Investigation of Solar Photovoltaic-Thermal (PVT) and Solar Photovoltaic (PV) Performance: A Case Study in Ghana

 ,
,  , and
, and
Abstract

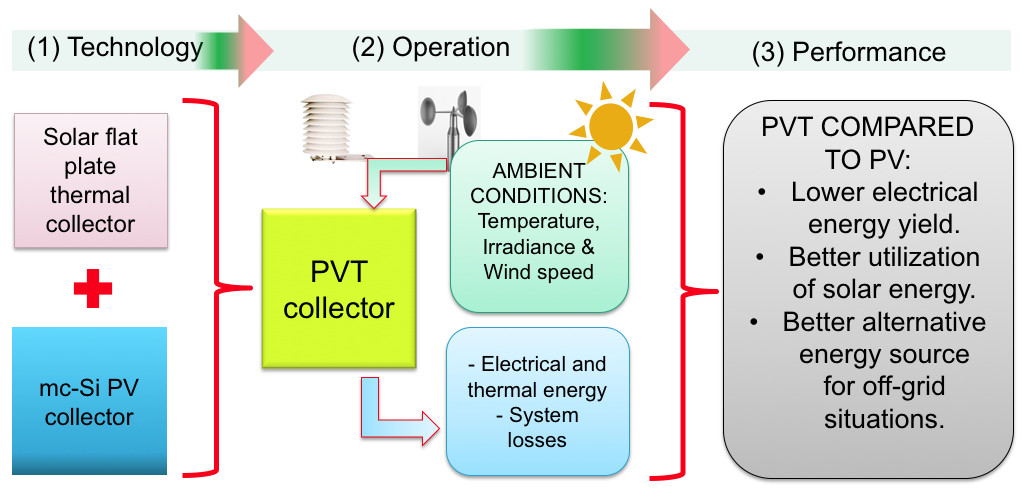
1. Introduction
2. Materials and Methods
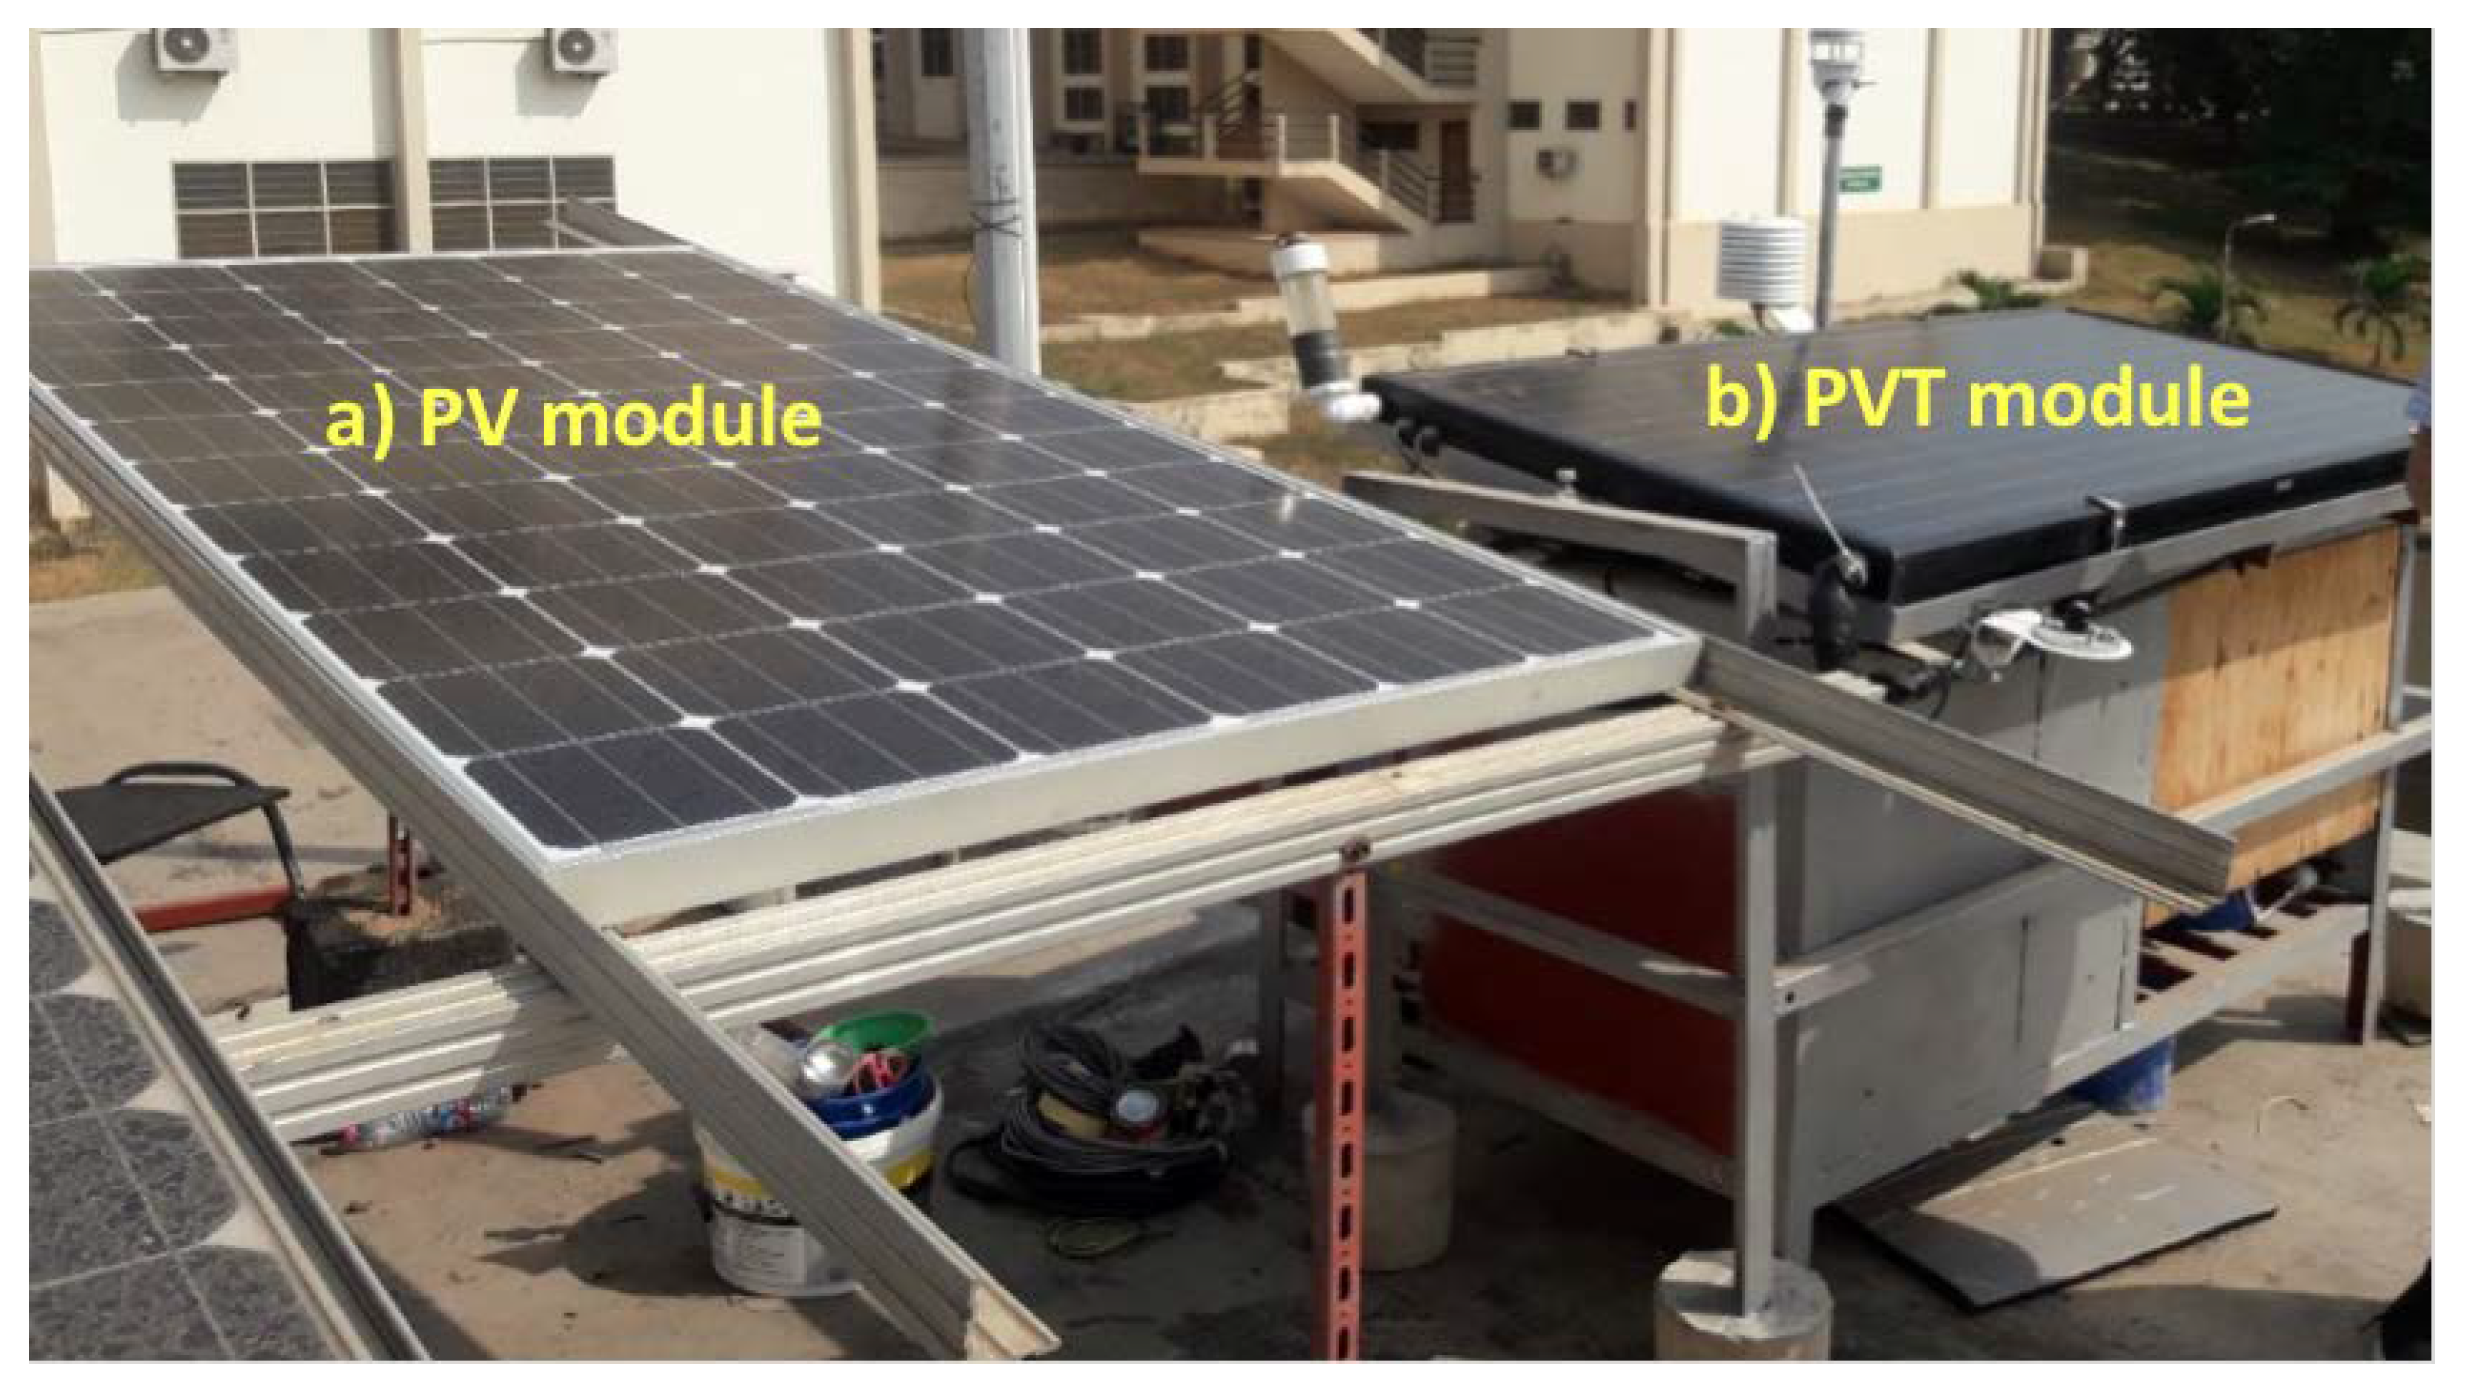
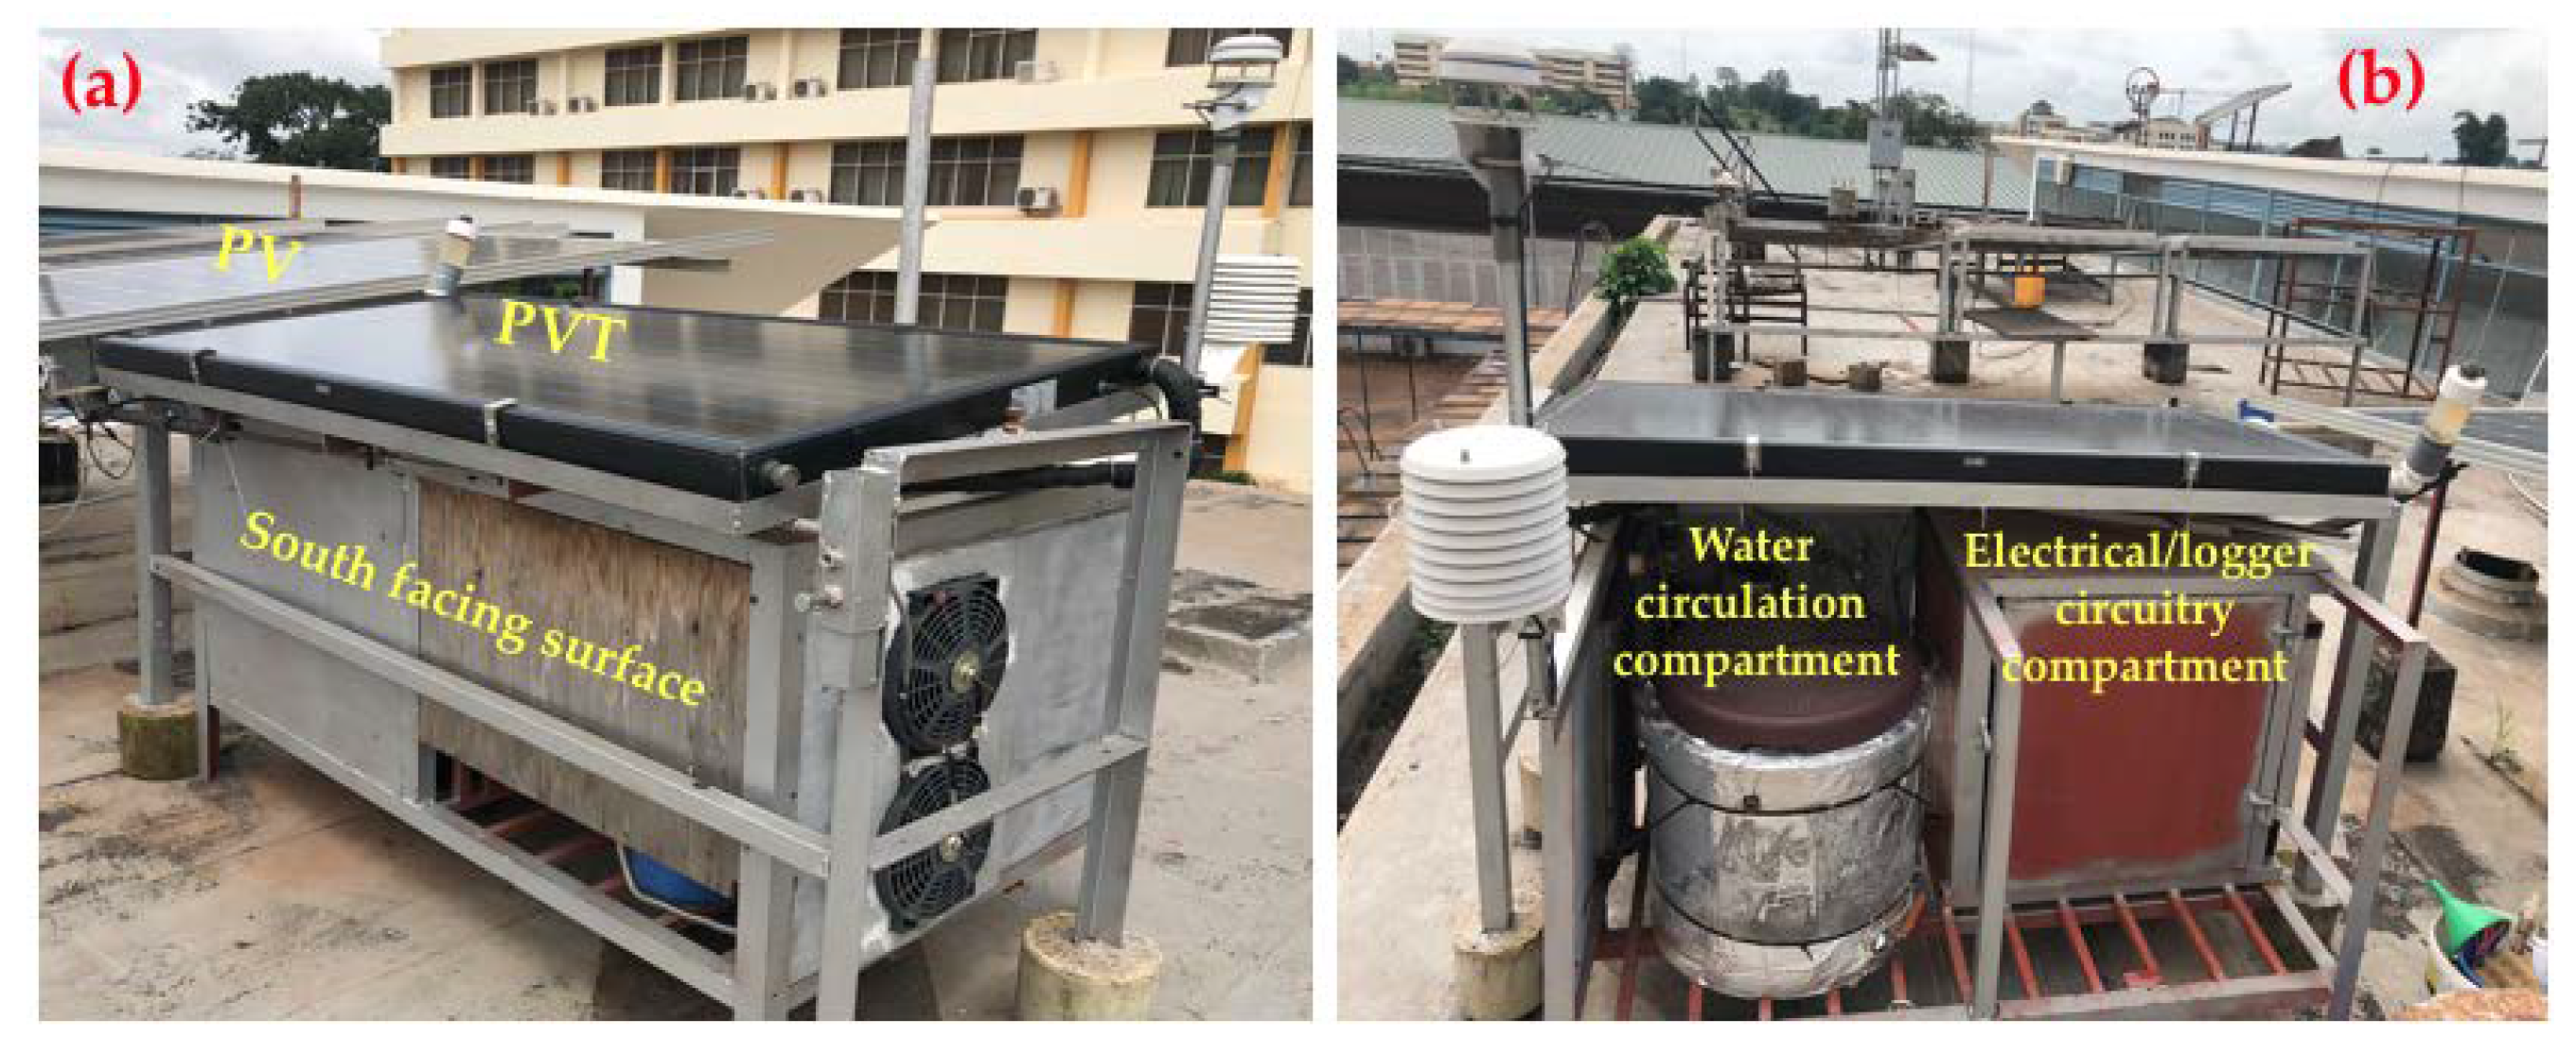
2.1. Experimental Set-up
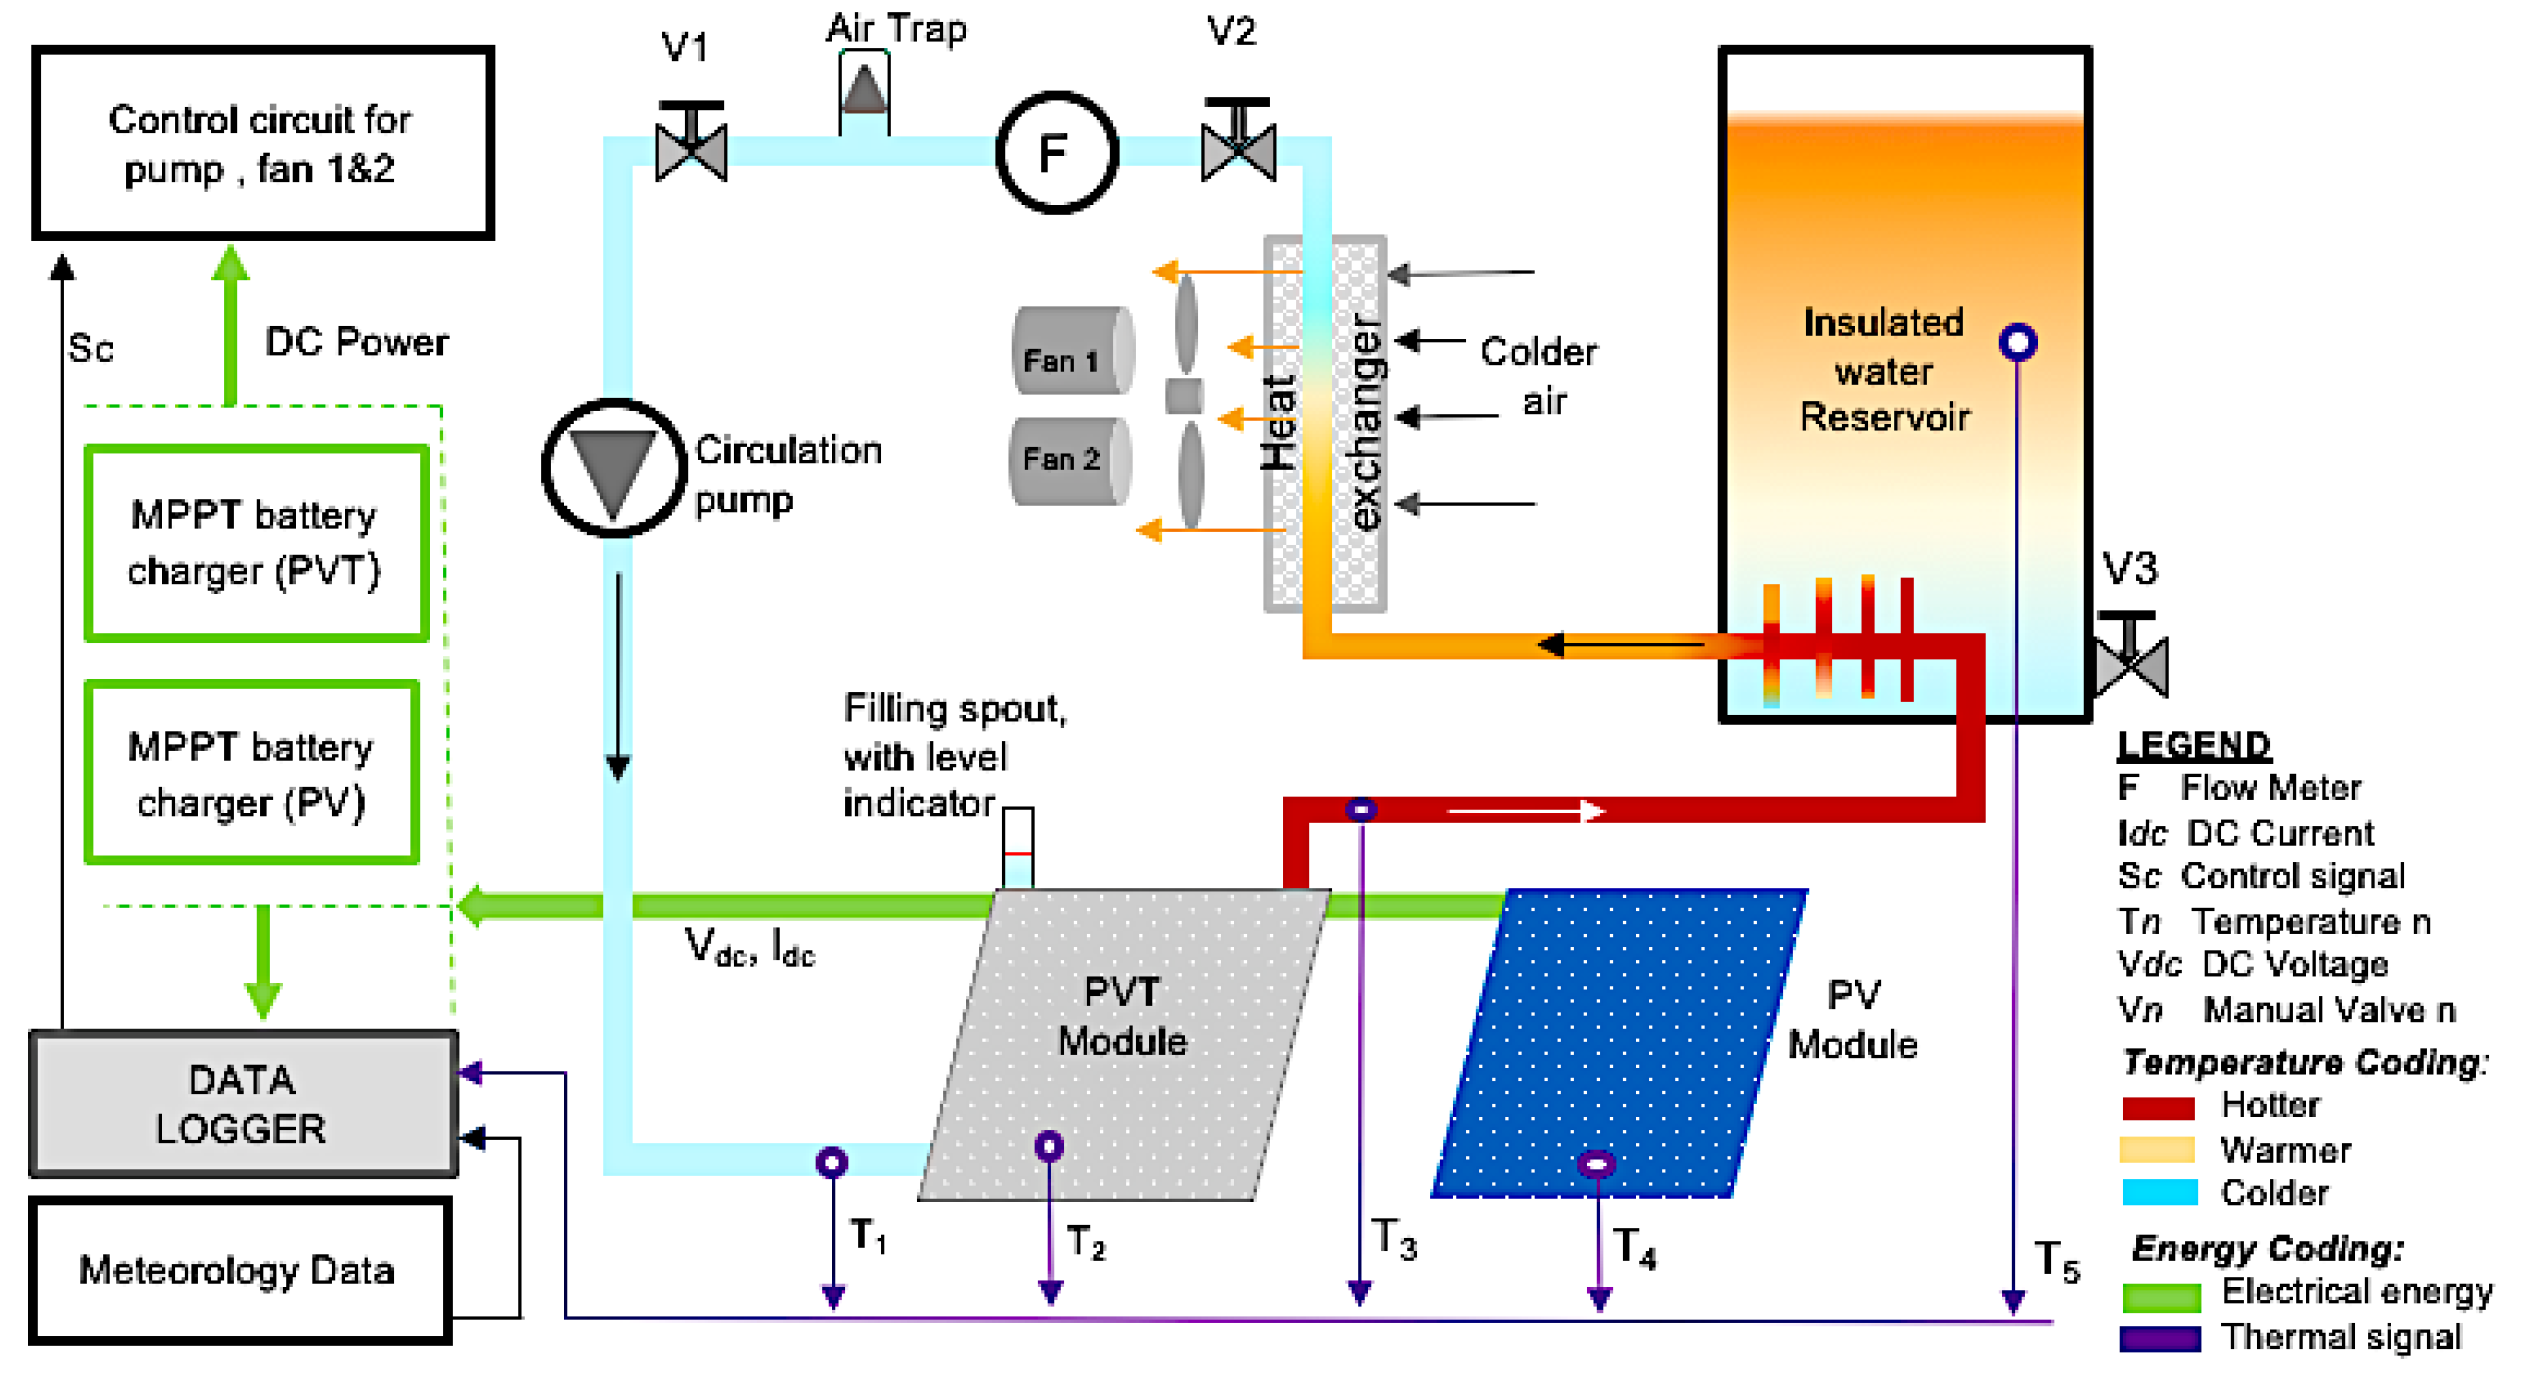
2.2. Schematic of the Experimental Setup and Water Circulation
2.3. Instrumentations, System Control and Data Collection
2.4. Data Analysis
2.4.1. Module Temperature
2.4.2. PV Performance Indices-Energy Yield, Performance Ratio and Efficiency
2.4.3. PVT Performance Indices—Heat Gained, Thermal Energy Yield and Efficiency
2.4.4. Clearness Index
3. Results and Discussion
3.1. Ambient Conditions
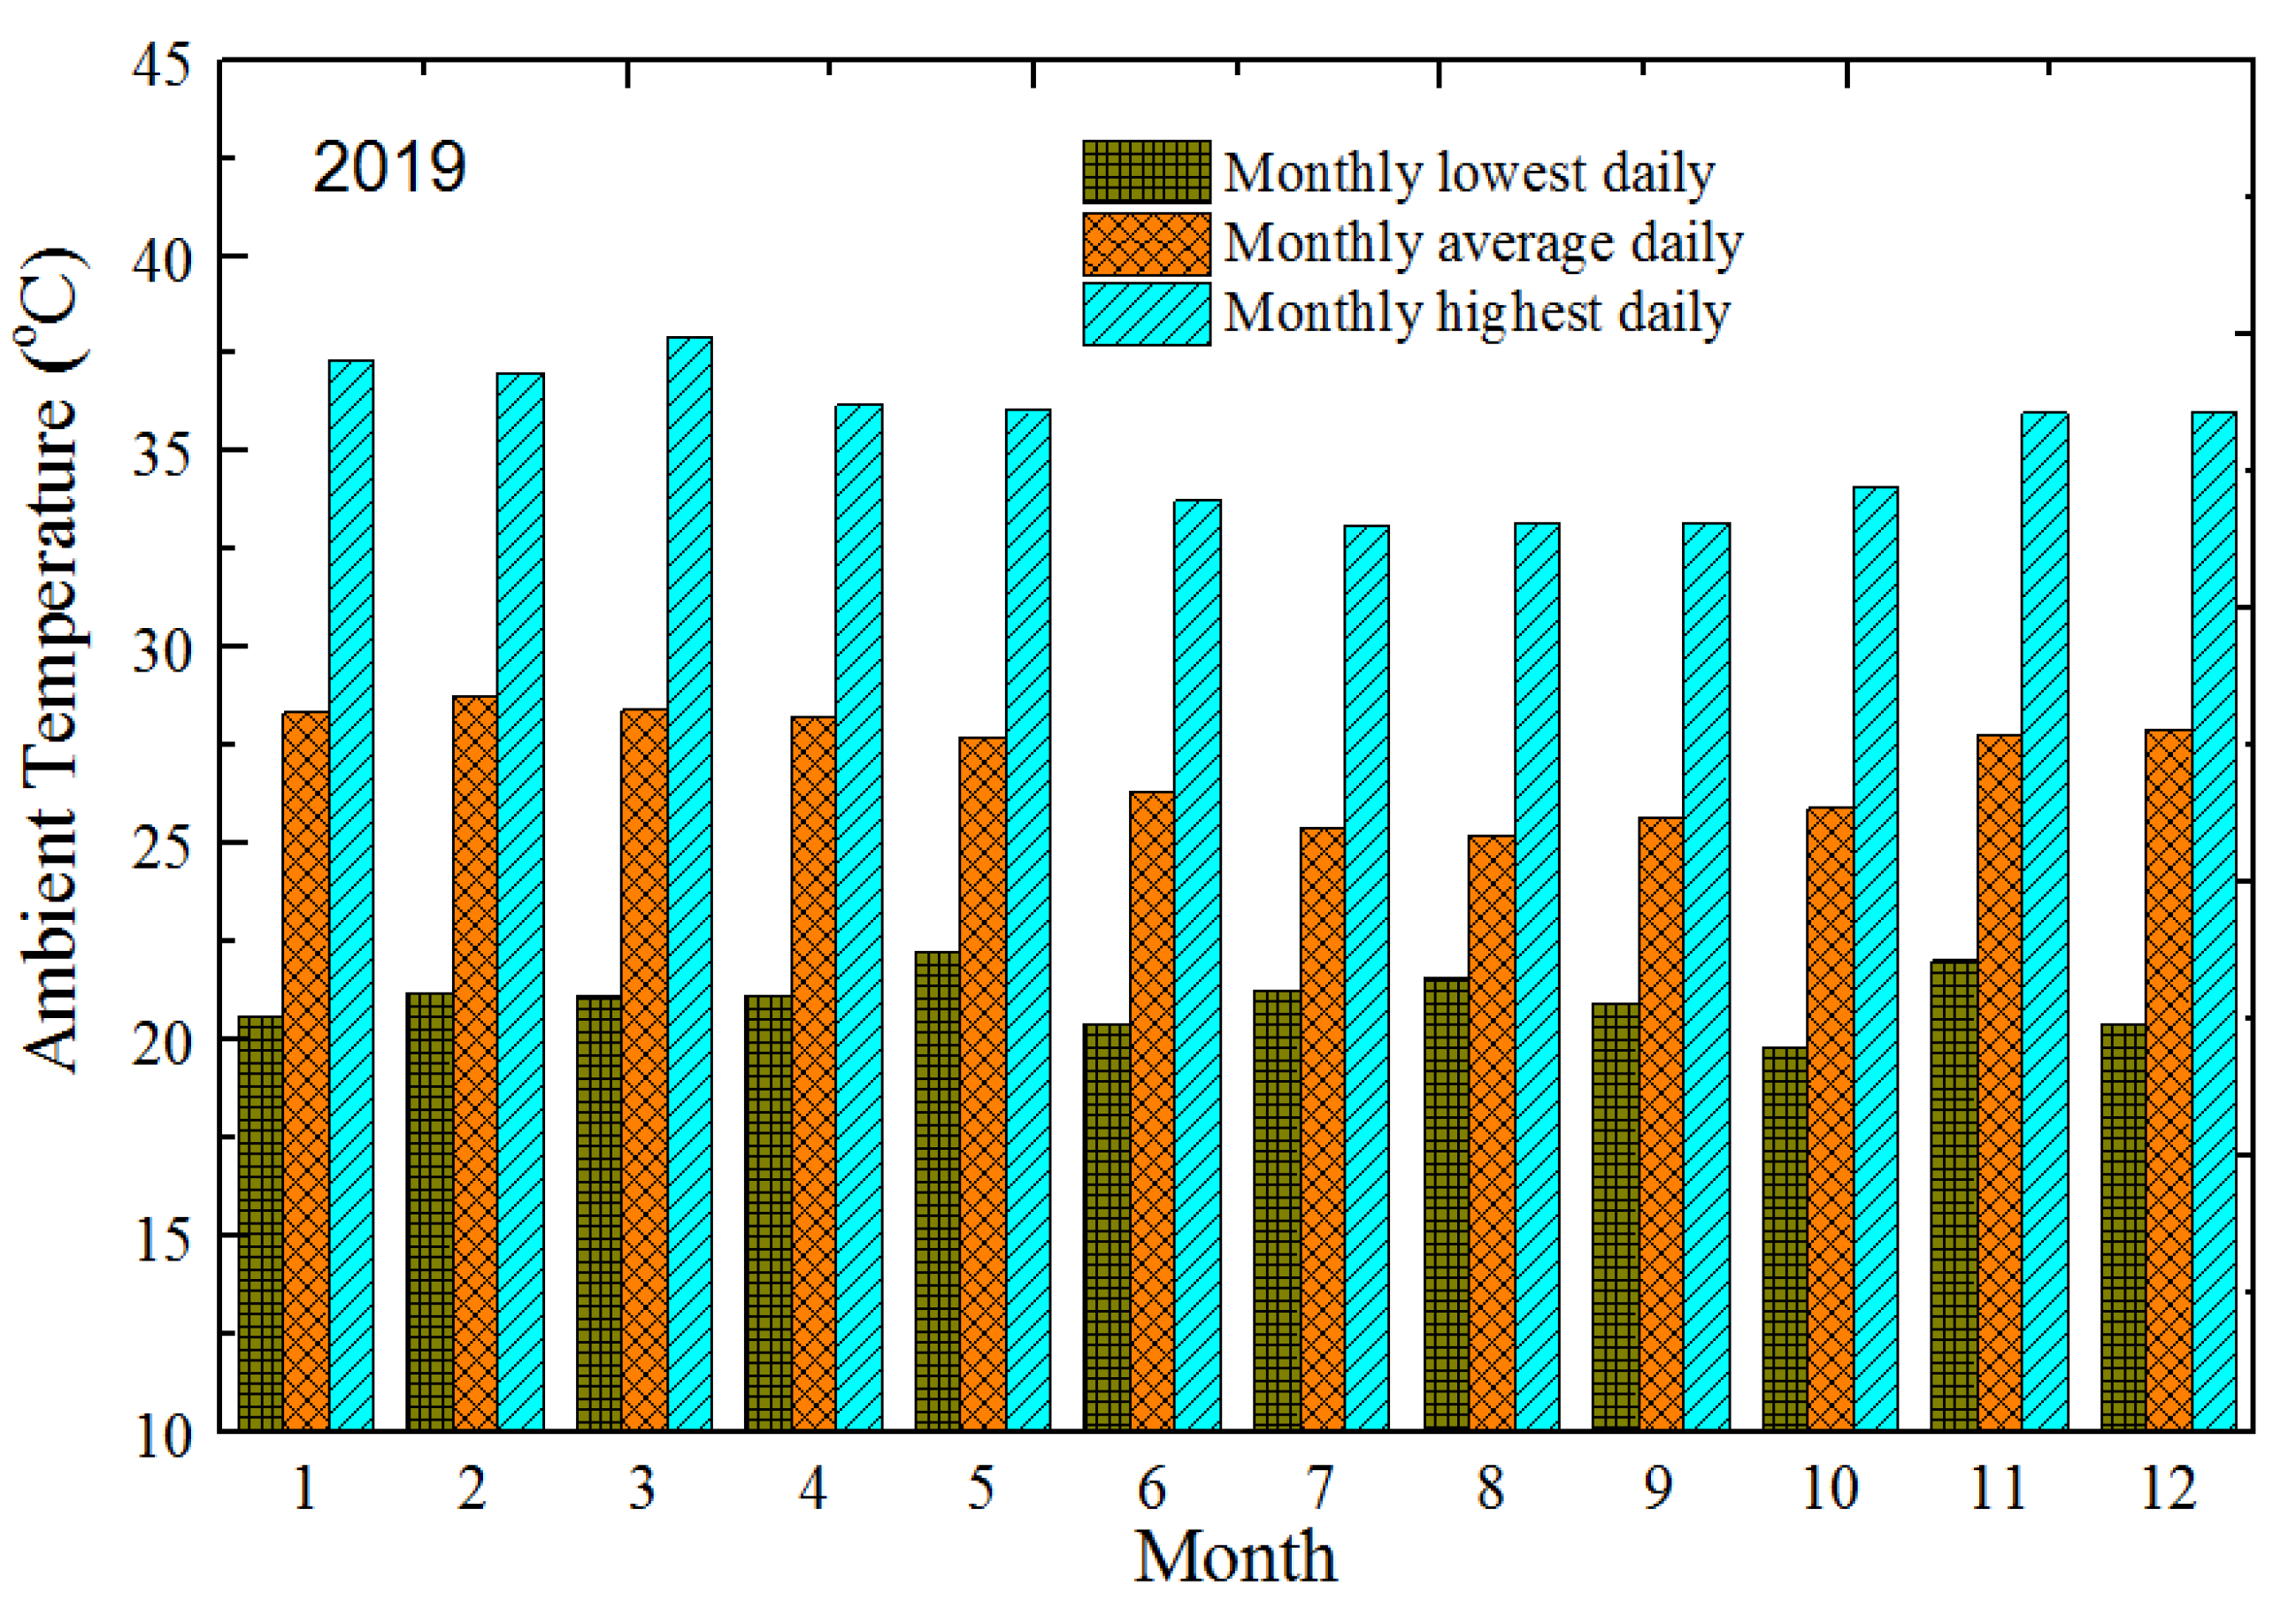
3.1.1. Ambient Temperature ()
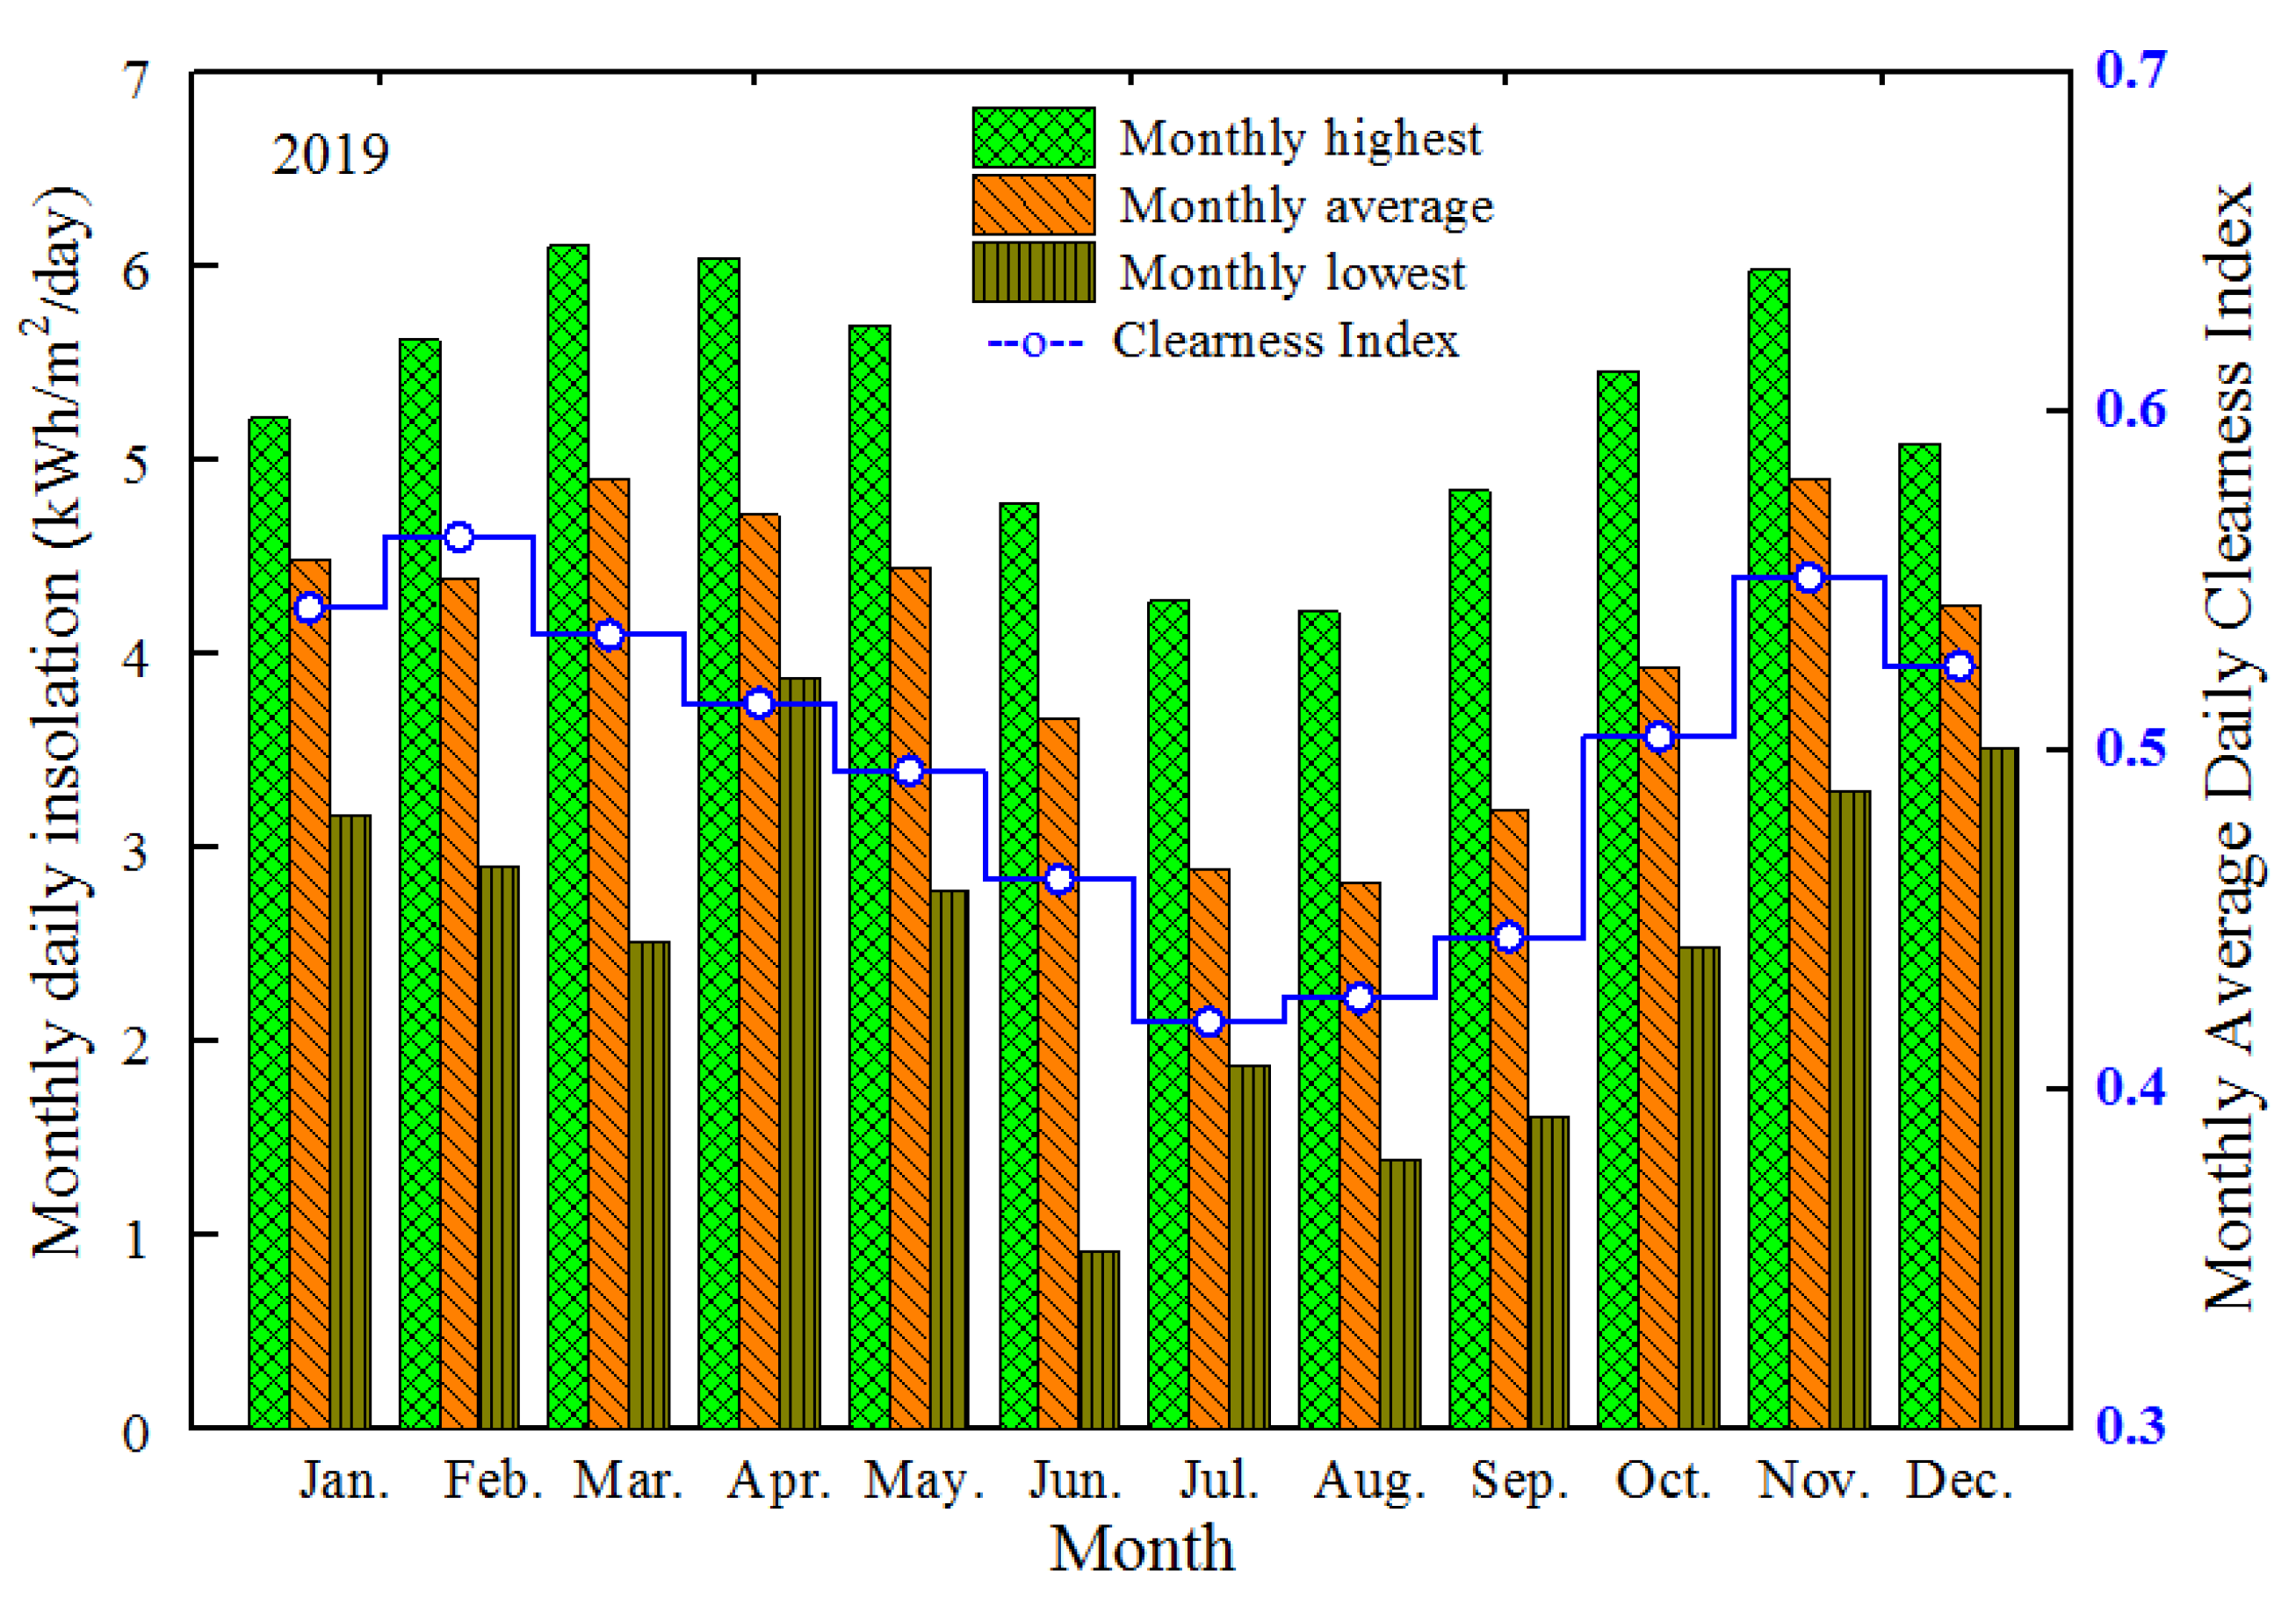
3.1.2. Solar Irradiation ()
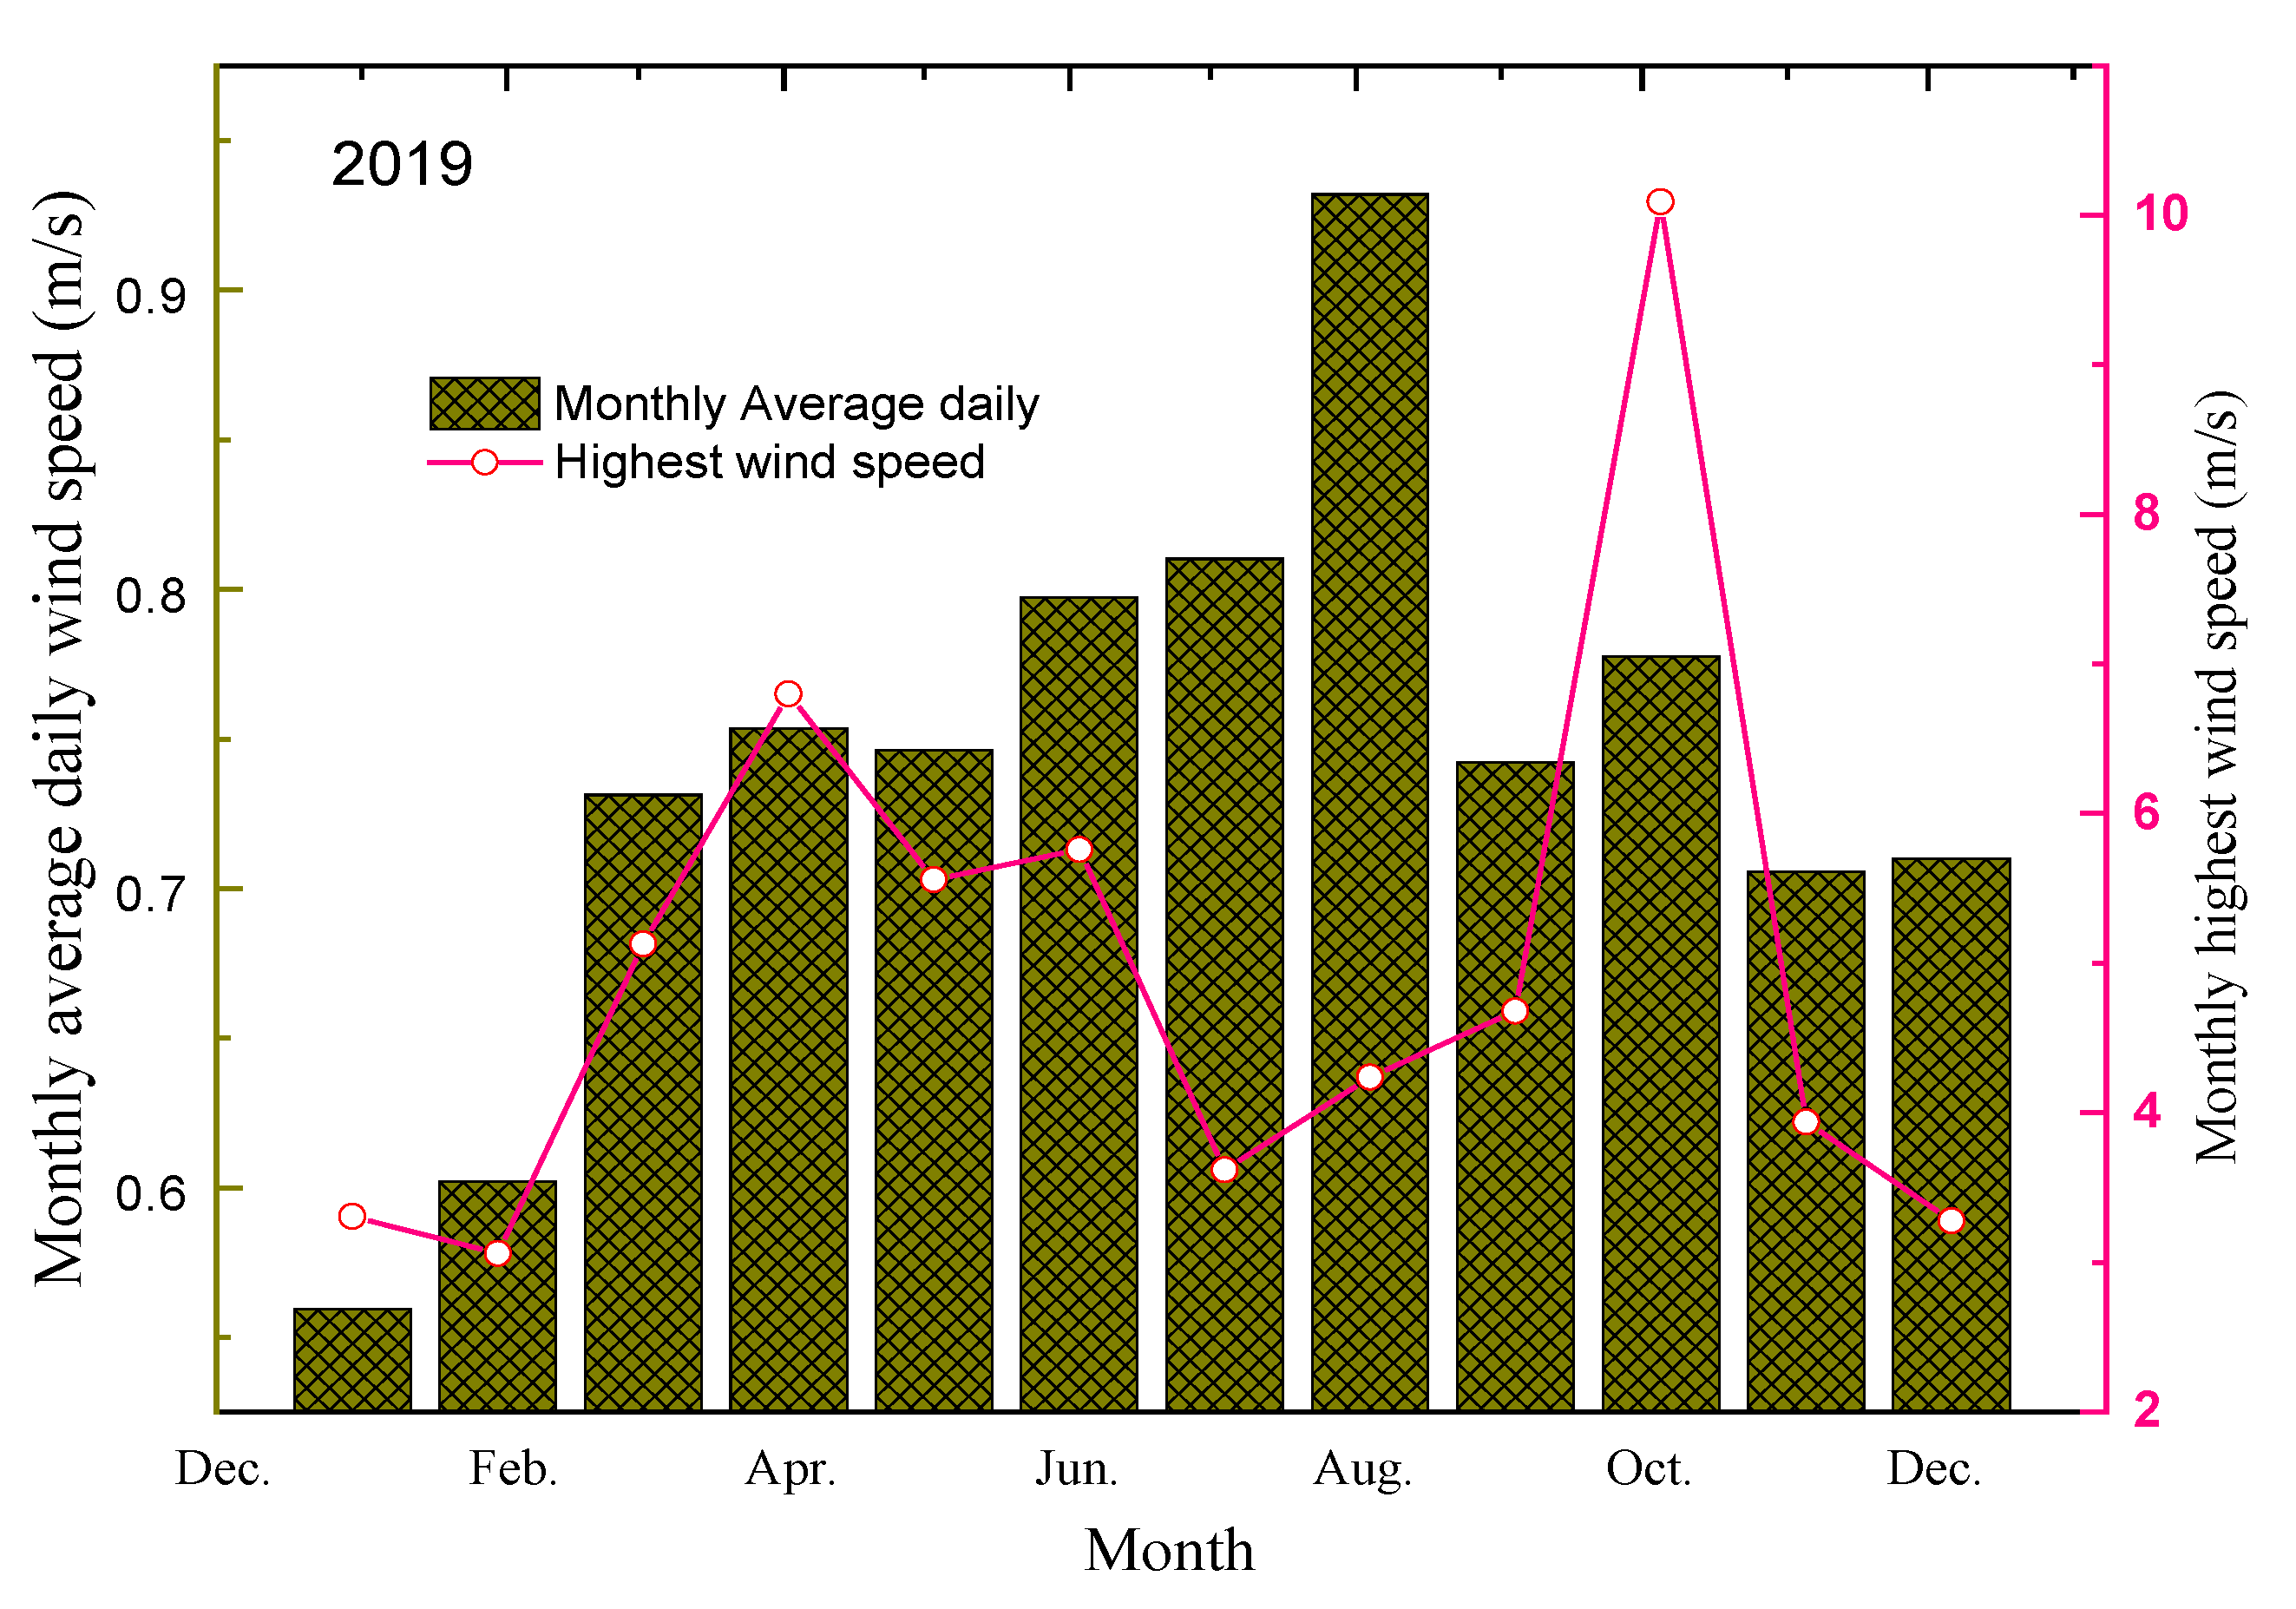
3.1.3. Wind Speed ()
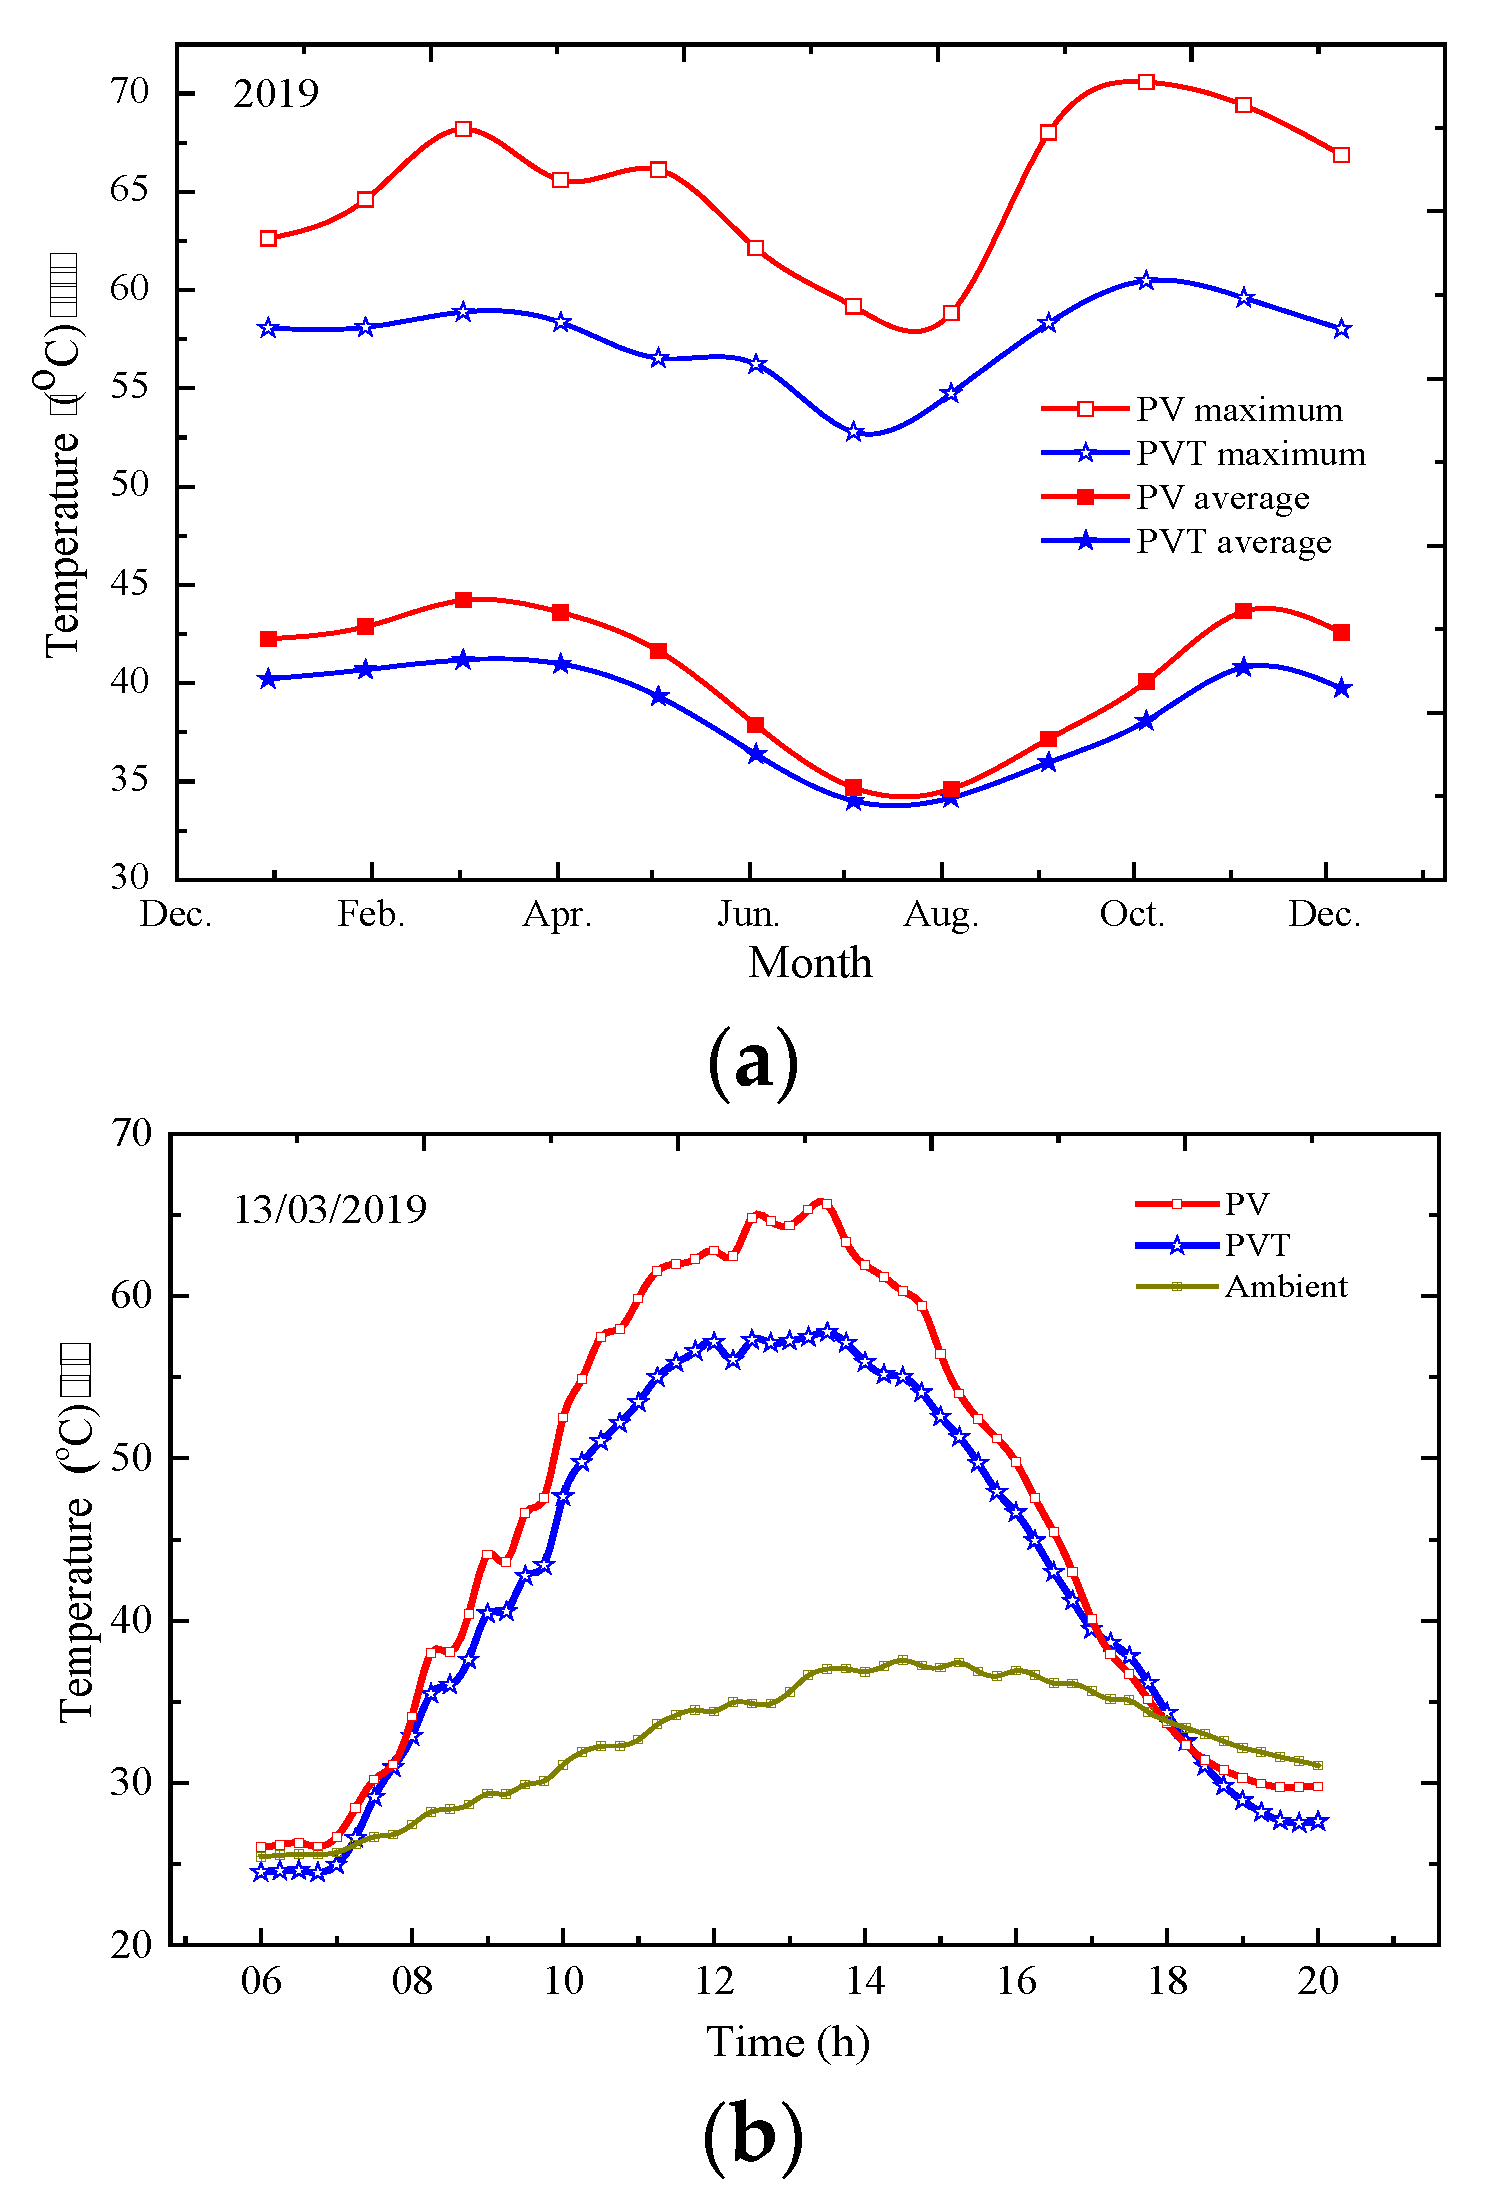
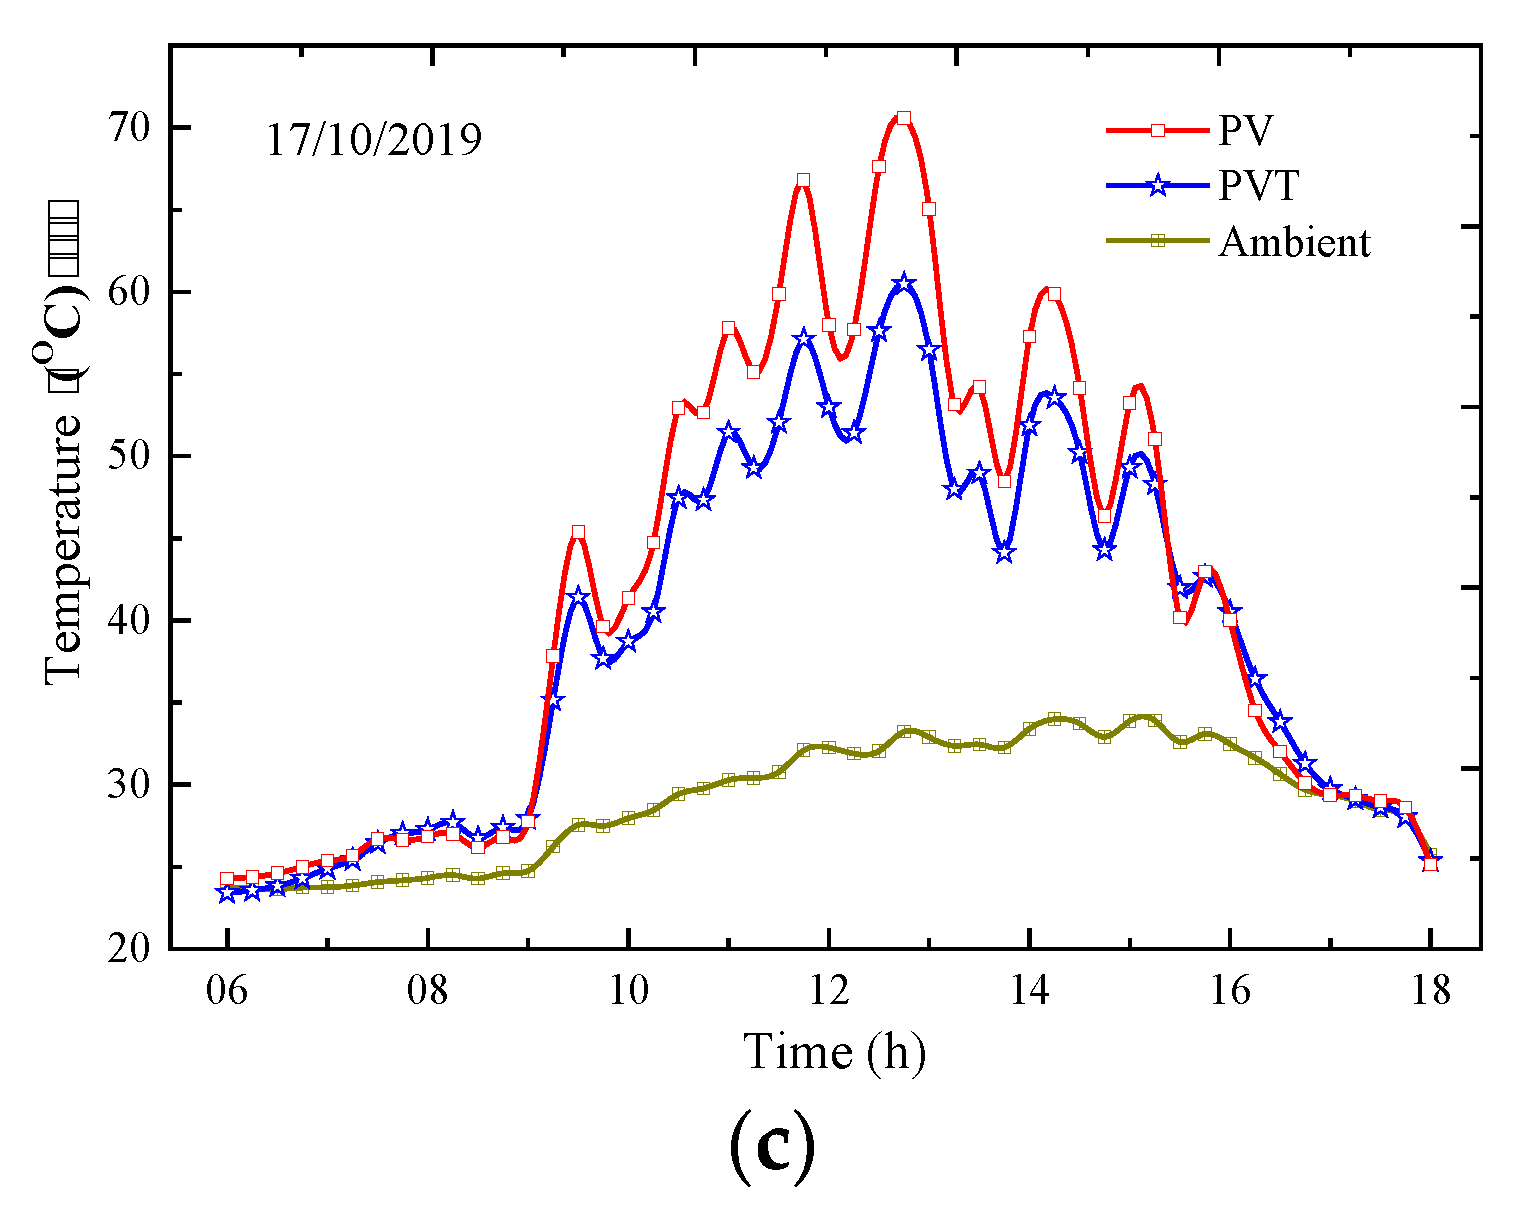
3.2. Module Temperature ()
3.3. Performance
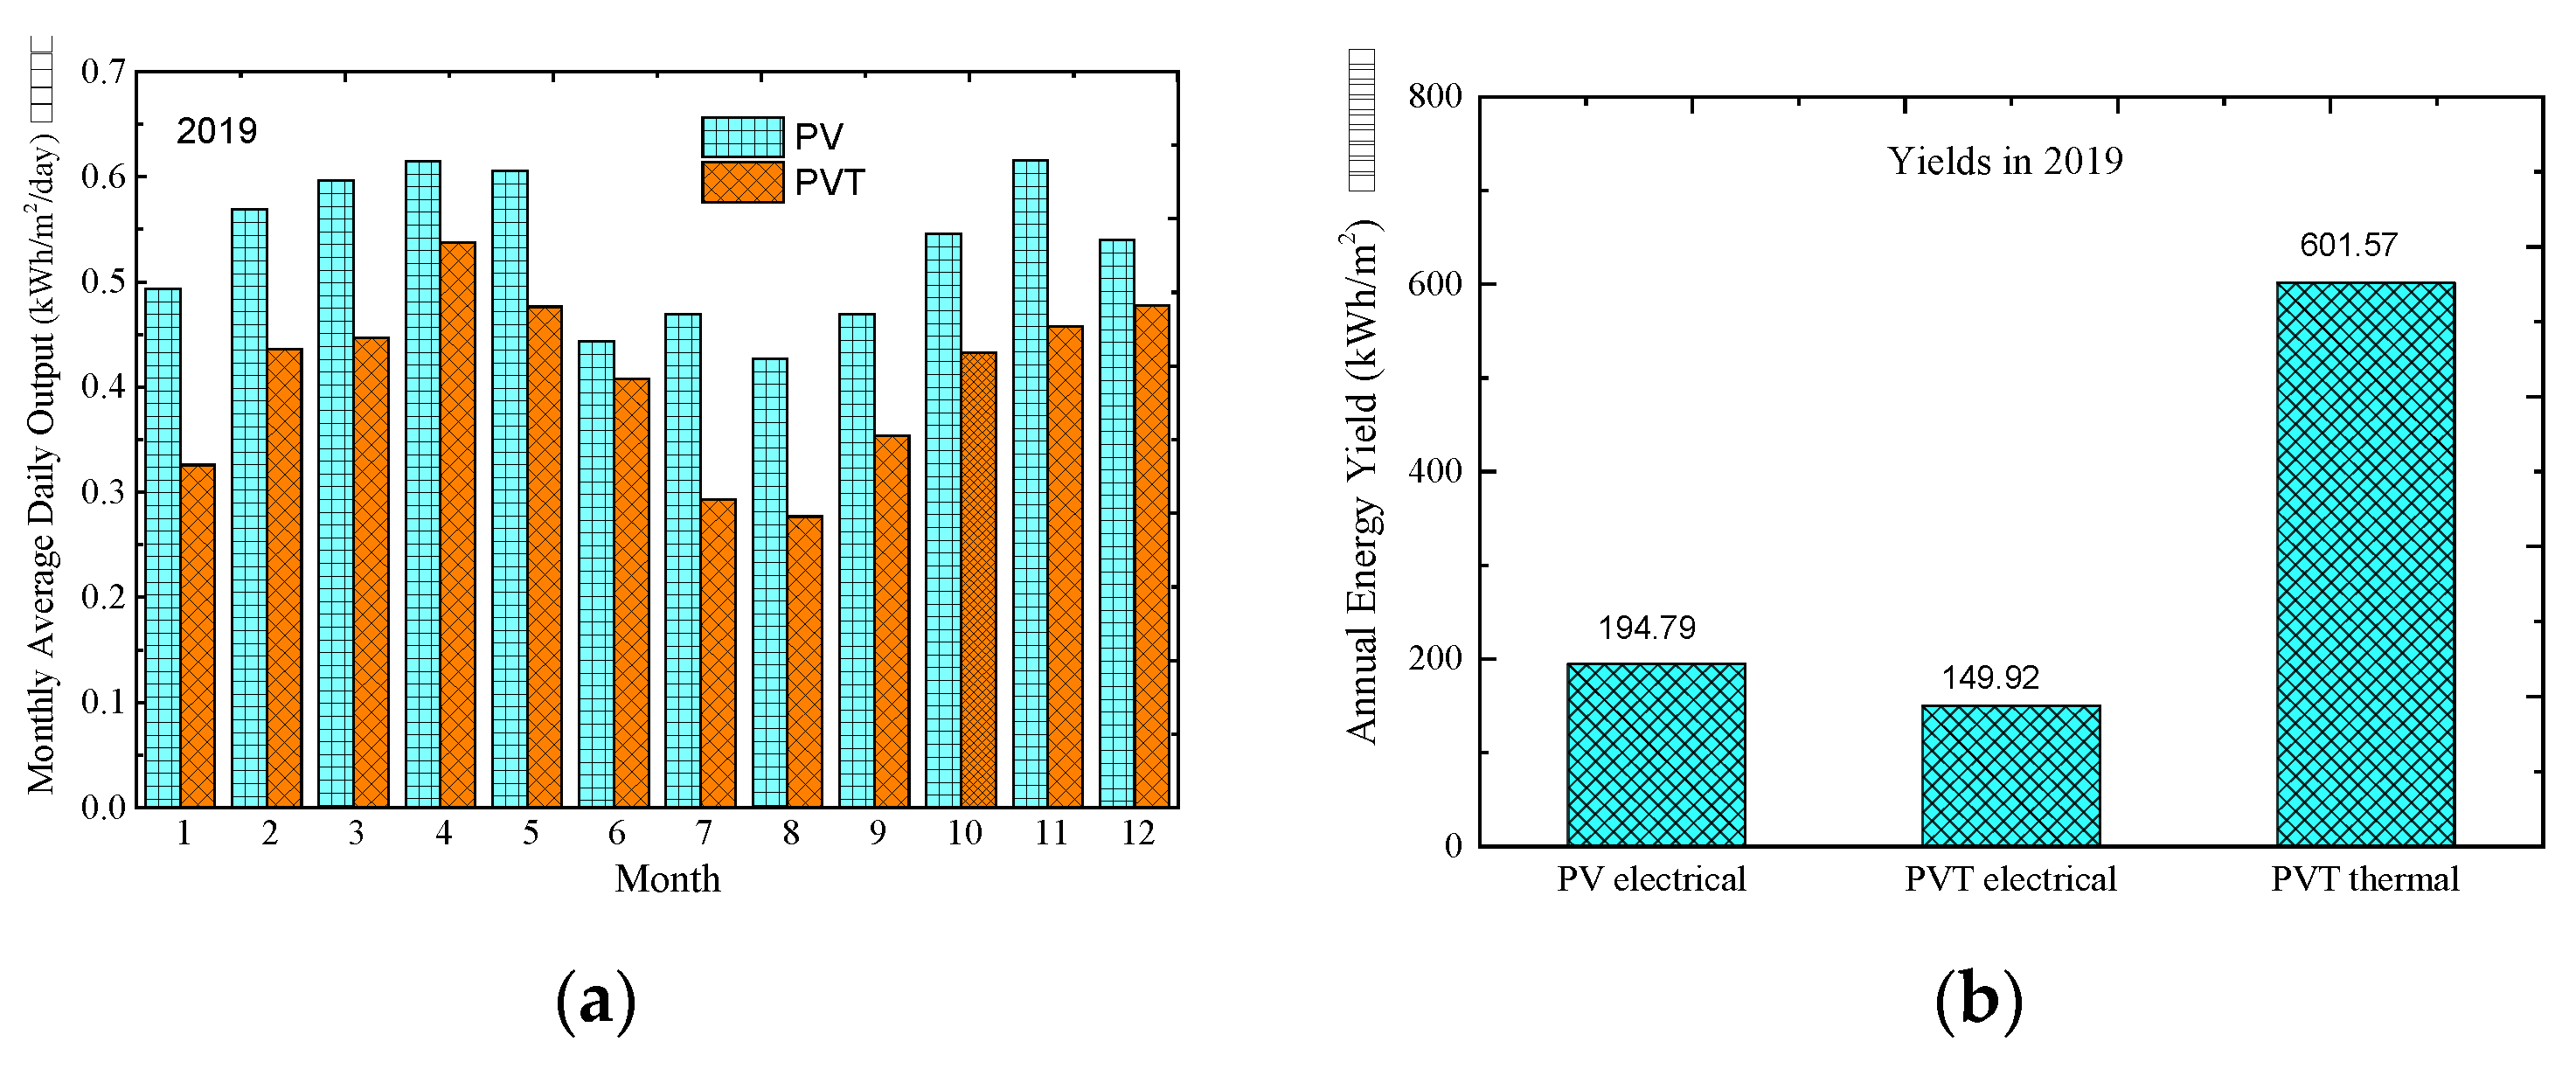
3.3.1. Electrical Energy Outputs for both PV and PVT
3.3.2. Efficiency
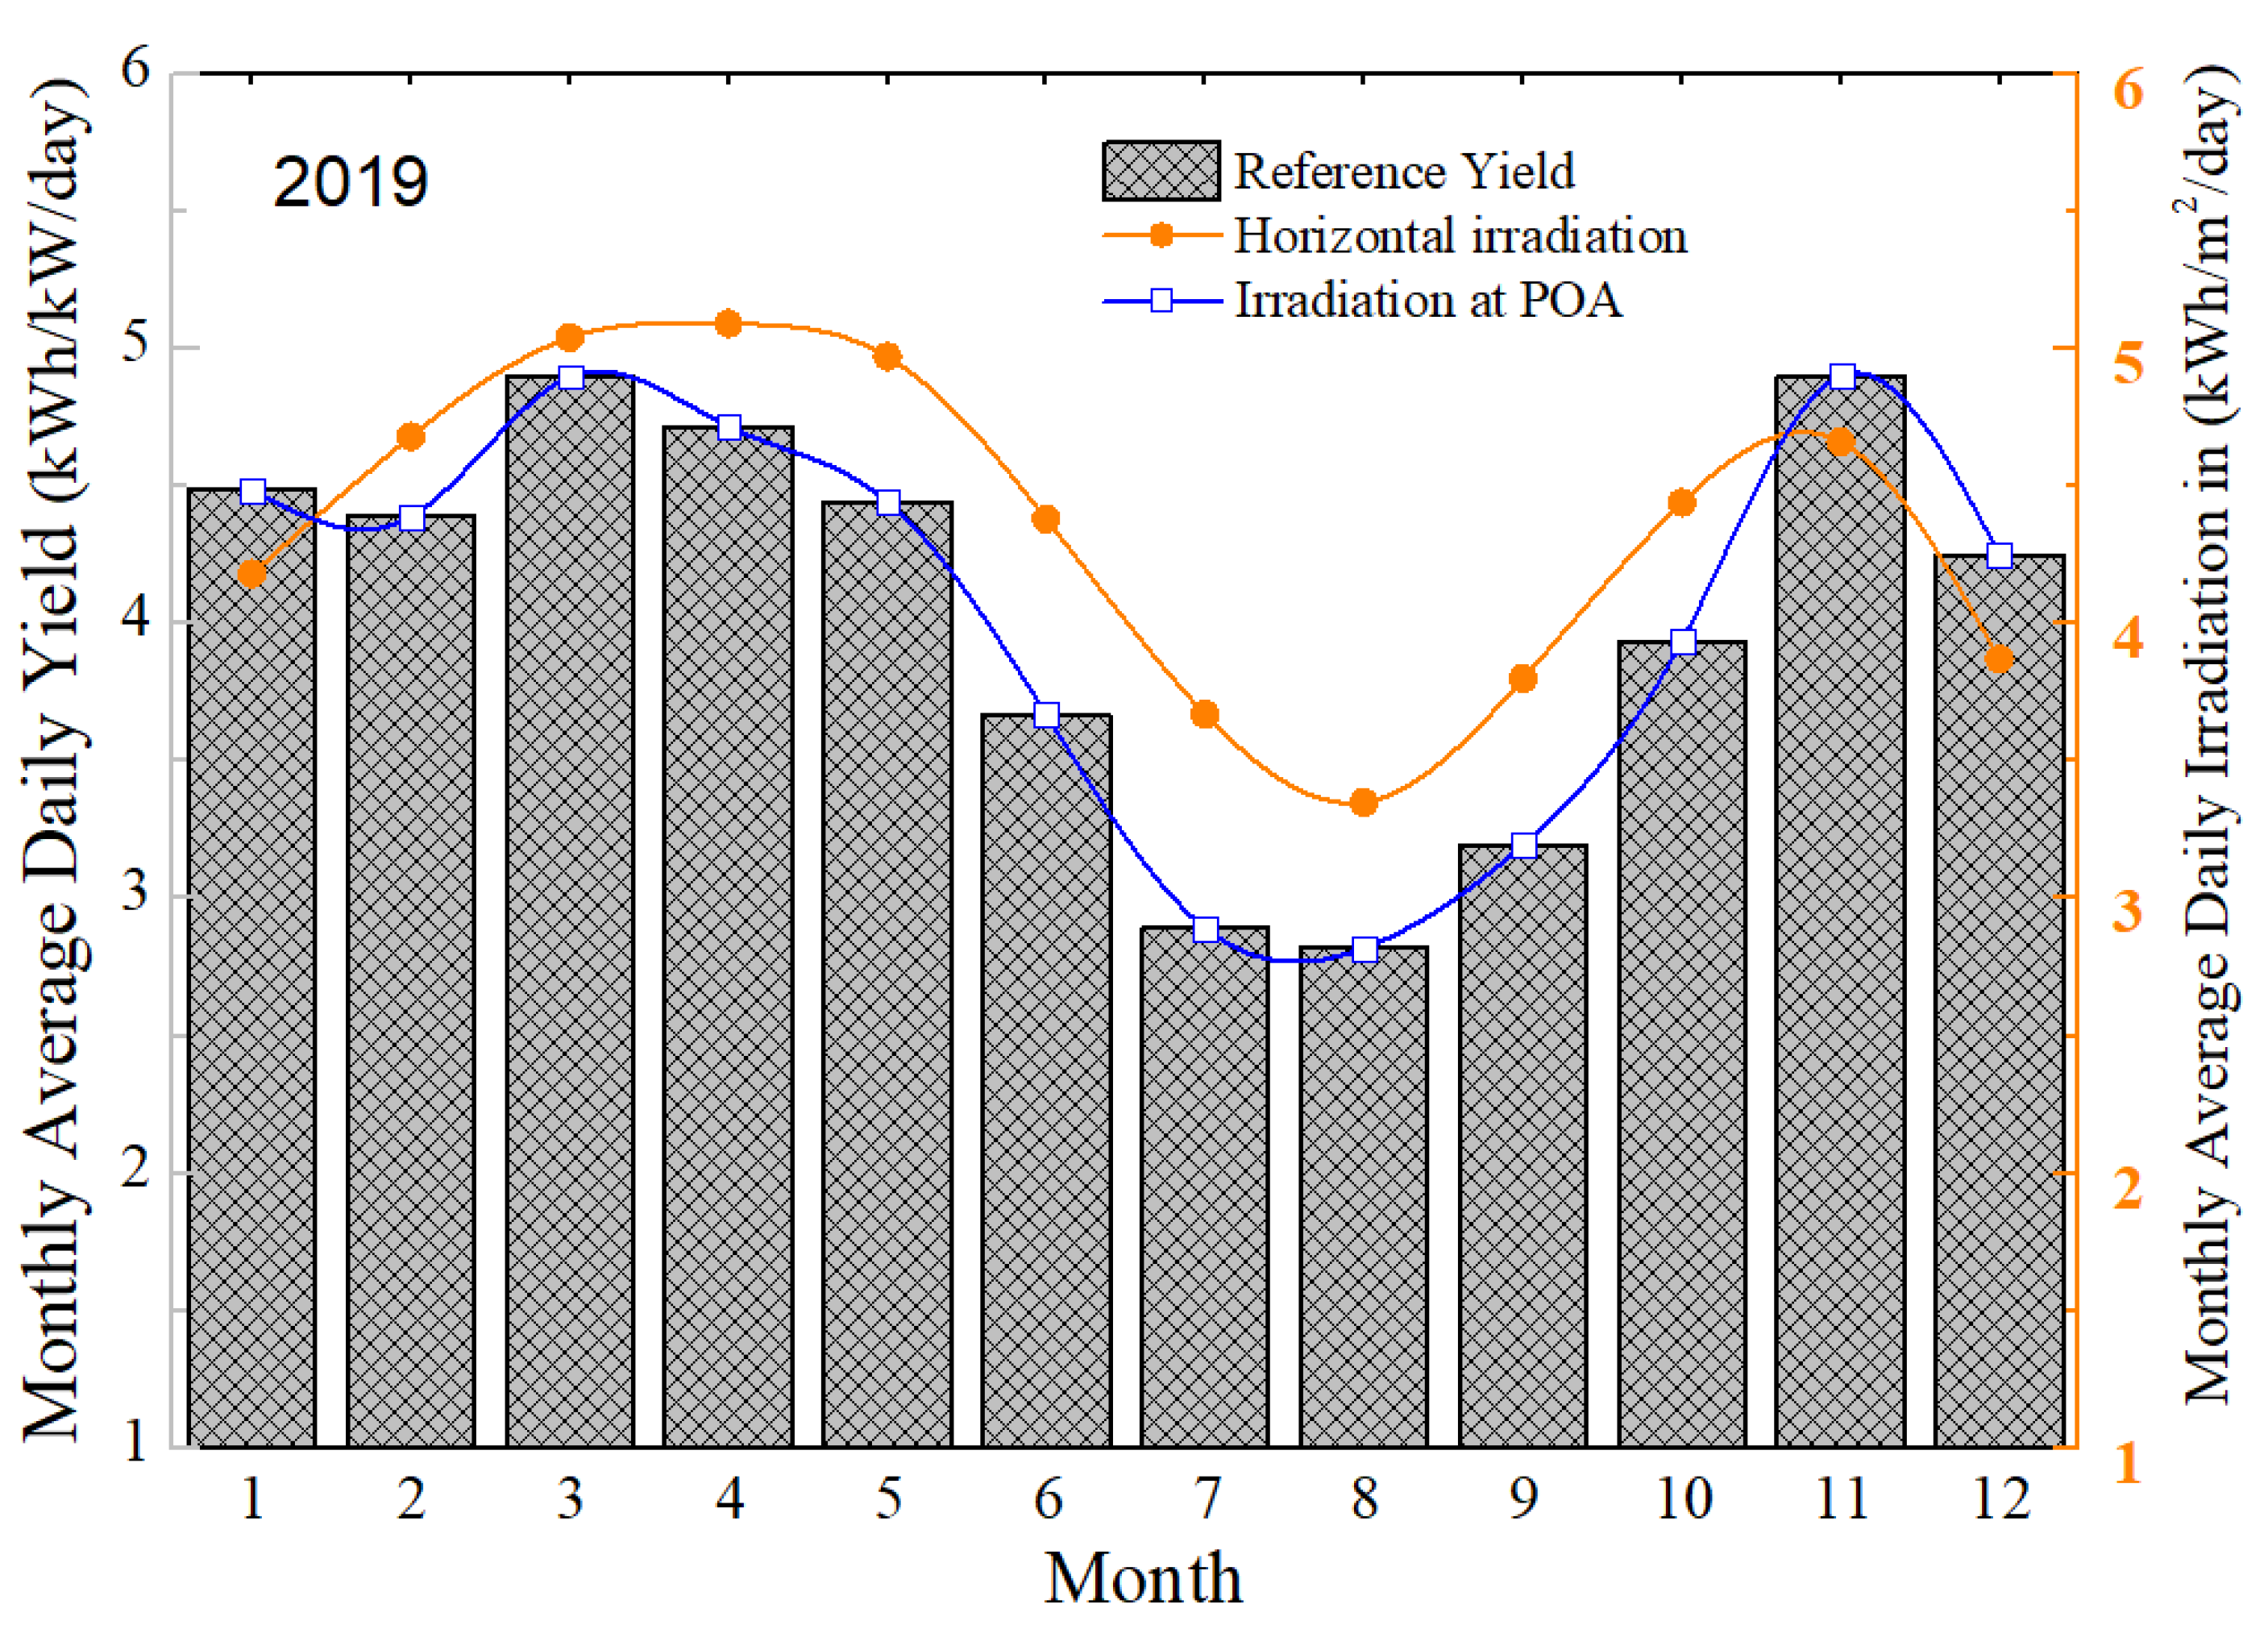
3.3.3. Reference Yield
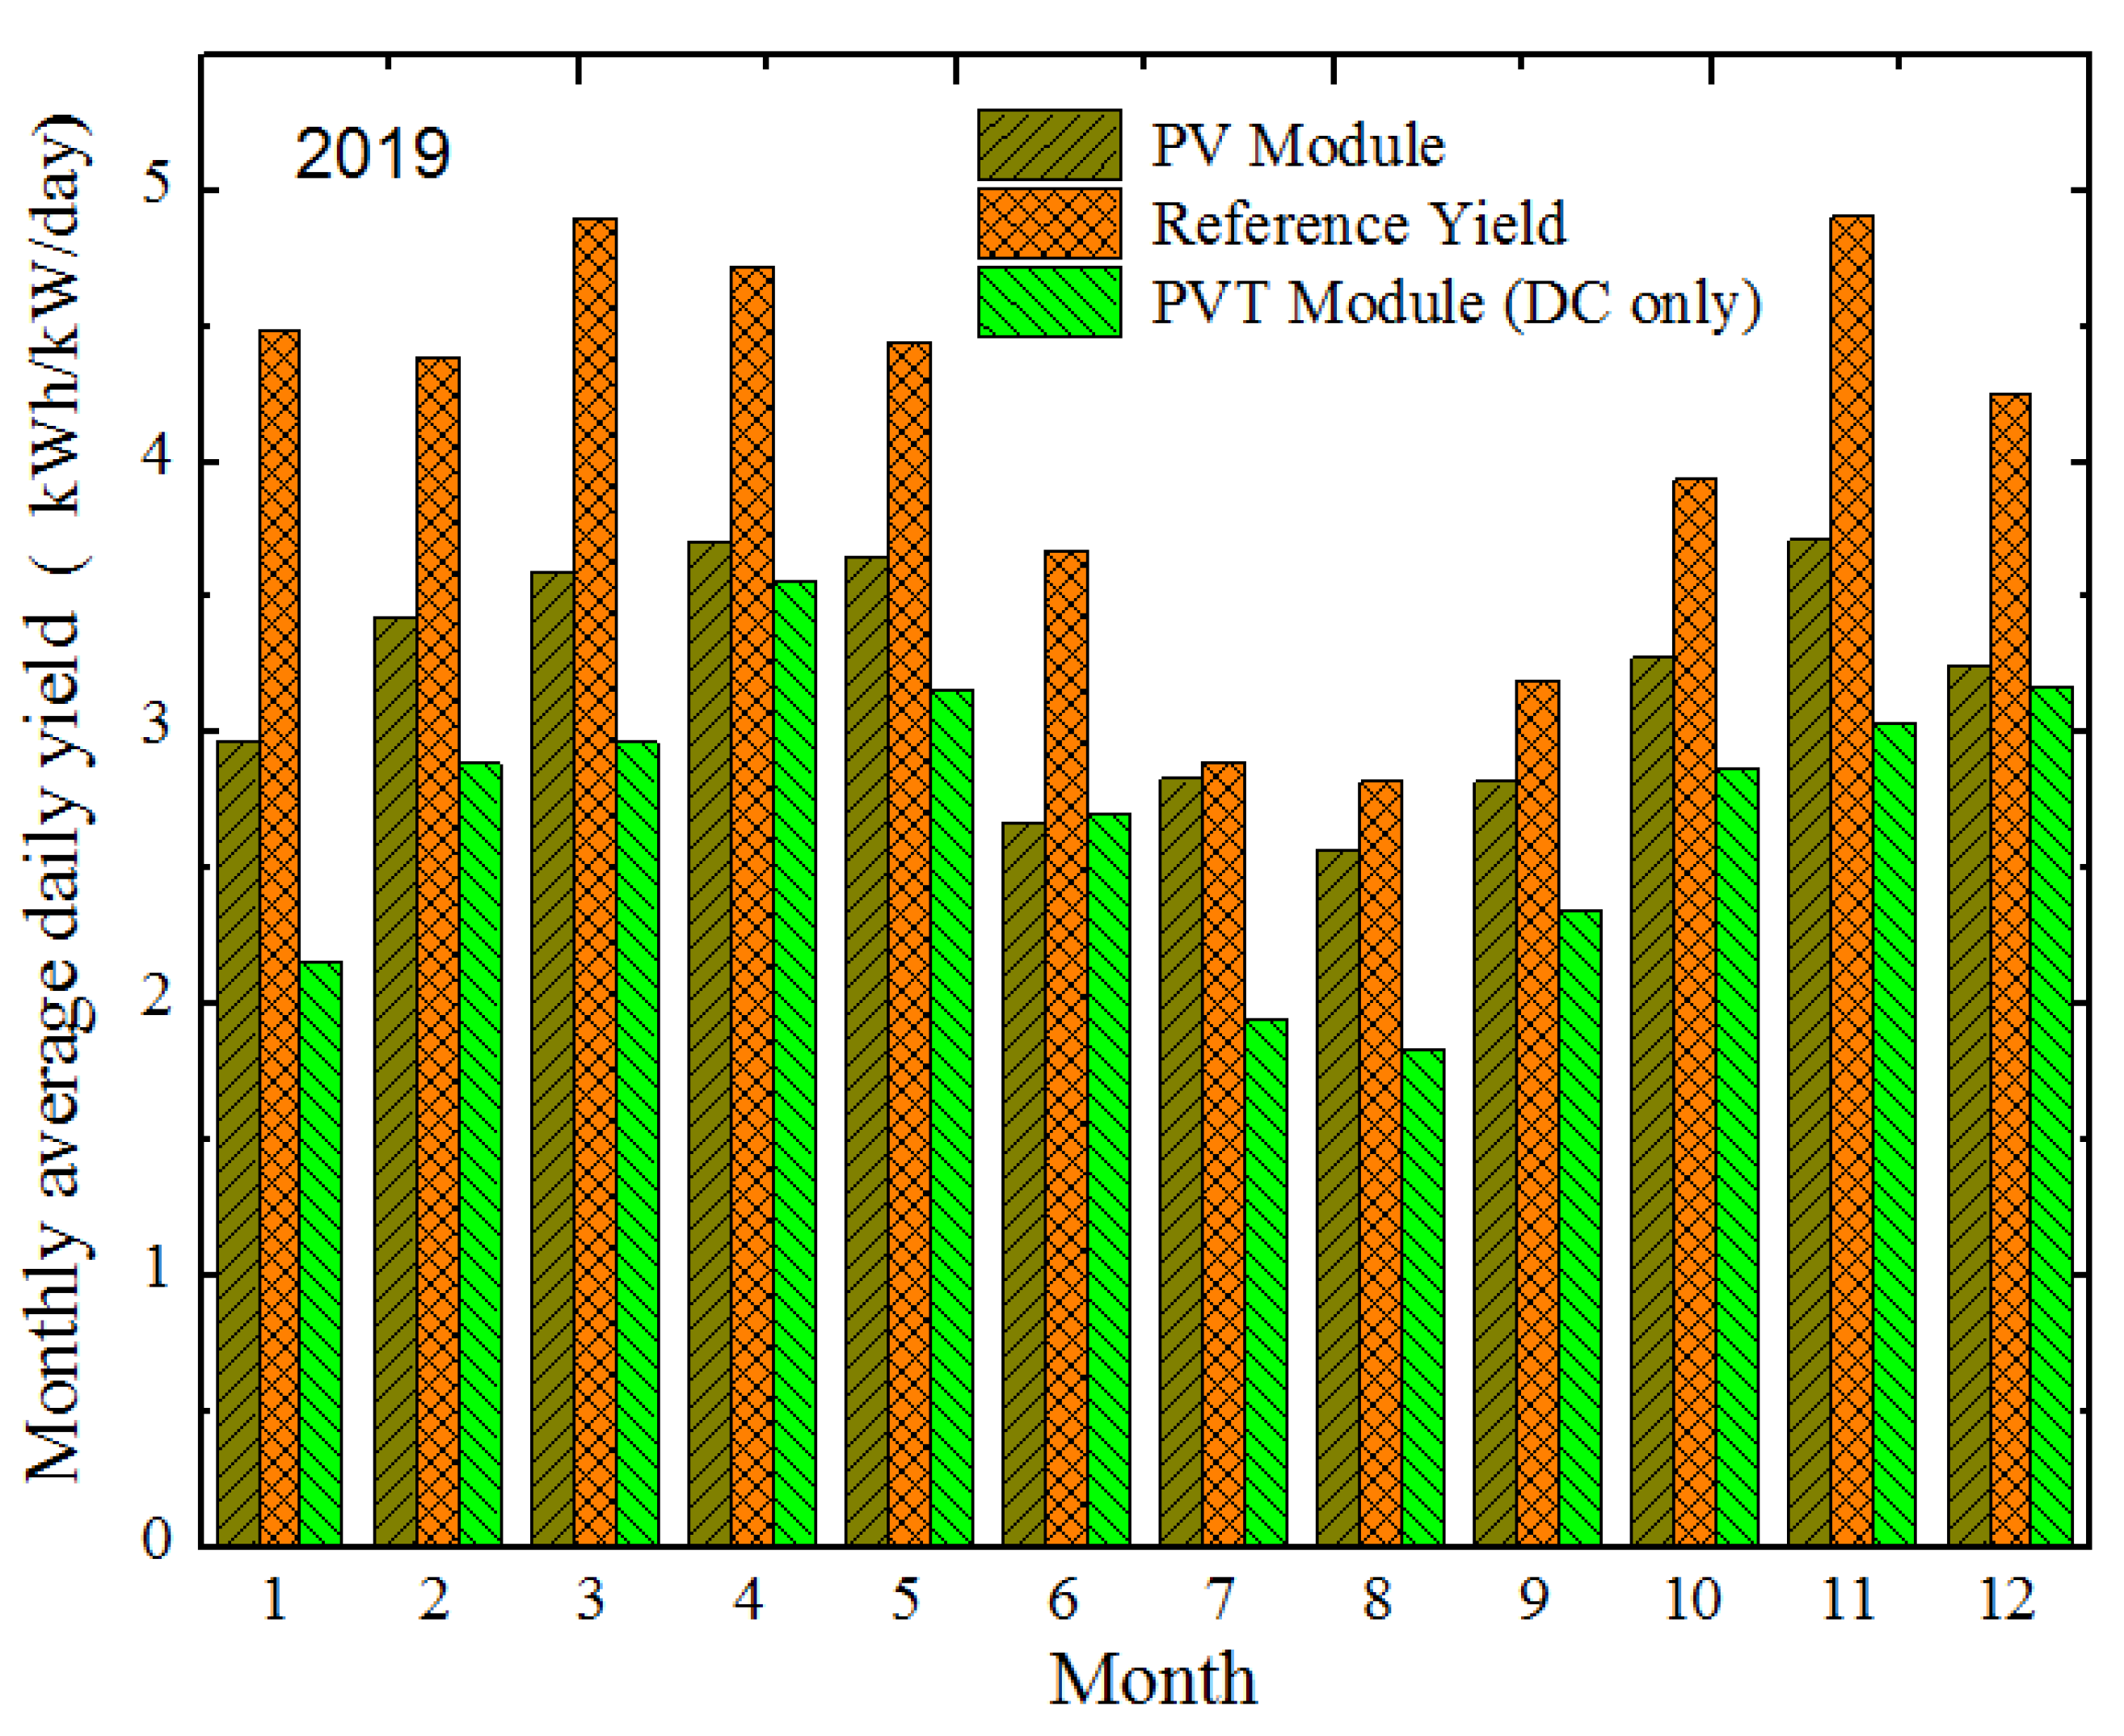
3.3.4. Array or Module Yield
3.3.5. Performance Ratio (PR)
3.3.6. Capacity Factor (CF)
3.4. Comparison between PV and PVT Installations
4. Conclusions
- The highest recorded instantaneous module temperatures were 70.6 °C and 60.5 °C for the PV module and PVT module, respectively, recorded in October. On the average, the PV module temperature remained relatively higher than that of PVT by 1.3% to 6.9%.
- The annual total energy output for the PV module was 194.79 kWh/m2 while that of the PVT for electrical and thermal outputs was 149.92 kWh/m2 and 1087.79 kWh/m2, respectively.
- The annual daily mean electrical energy yield for the PV and PVT were 3.21 kWh/kWp/day and 2.72 kWh/kWp/day, respectively.
- The annual performance ratios based on only electrical energy for the PV and PVT were 79.2% and 51.6%, respectively, whereas their capacity factors were, respectively, 13.35% and 11.3%.
- The monthly average electrical efficiency values for PV and PVT were 11.6–12.7% and 9.9–11.5% respectively. The thermal efficiency of the PVT had a wider variation from 29.44% to 44.84%. There is however the need to improve the thermal efficiency of commercial PVTs.
Author Contributions
Acknowledgments
Conflicts of Interest
References
- Baljit, S.S.S.; Chan, H.Y.; Sopian, K. Review of building integrated applications of photovoltaic and solar thermal systems. J. Clean. Prod. 2016, 137, 677–689. [Google Scholar] [CrossRef]
- Zondag, H. Flat-plate PV-Thermal collectors and systems: A review. Renew. Sustain. Energy Rev. 2008, 12, 891–959. [Google Scholar] [CrossRef]
- Chow, T.T. A review on photovoltaic/thermal hybrid solar technology. Appl. Energy 2010, 87, 365–379. [Google Scholar] [CrossRef]
- Aste, N.; del Pero, C.; Leonforte, F. Water flat plate PV/thermal collectors: A review. Sol. Energy 2014, 102, 98–115. [Google Scholar] [CrossRef]
- Guarracino, I.; Markides, C.N.; Mellor, A.; Ekins-Daukes, N.J. Dynamic coupled thermal and electrical modelling of sheet and tube hybrid photovoltaic/thermal (PVT) collectors. Appl. Therm. Eng. 2016, 101, 778–795. [Google Scholar] [CrossRef]
- Good, C. Environmental impact assessment of hybrid photovoltaic-thermal (PV/T) Systems—A review. Renew. Sustain. Energy Rev. 2016, 55, 234–239. [Google Scholar] [CrossRef]
- Fuentes, M.; Vivar, M.; de la Casa, J.; Aguilera, J. An experimental comparison between commercial hybrid PV-T and simple PV systems intended for BIPV. Renew. Sustain. Energy Rev. 2018, 93, 110–120. [Google Scholar] [CrossRef]
- Guarracino, I.; Freeman, J.; Ramos, A.; Kalogirou, S.A.; Ekins-Daukes, N.J.; Markides, C.N. Systematic testing of hybrid PV-thermal (PVT) solar collectors in steady state and dynamic outdoor conditions. Appl. Energy 2019, 240, 1014–1030. [Google Scholar] [CrossRef]
- de Keizer, C.; de Jong, M.; Mendes, T.; Katiyar, M.; Folkerts, W.; Rindt, C.; Zondag, H. Evaluating the thermal and electrical performance of several uncovered PVT collectors with a field test. Energy Procedia 2016, 91, 20–26. [Google Scholar] [CrossRef]
- Rejeb, O.; Dhaou, H.; Jemni, A. A numerical investigation of a photovoltaic thermal (PV/T) collector. Renew. Energy 2015, 77, 43–50. [Google Scholar] [CrossRef]
- Dupeyrat, P.; Ménézo, C.; Rommel, M.; Henning, H.M. Efficient single glazed flat plate photovoltaic-thermal hybrid collector for domestic hot water system. Sol. Energy 2011, 85, 1457–1468. [Google Scholar] [CrossRef]
- Fudholi, A.; Sopian, K.; Yazdi, M.H.; Ruslan, M.H.; Ibrahim, A.; Kazem, H.A. Performance analysis of photovoltaic thermal (PVT) water collectors. Energy Convers. Manag. 2014, 78, 641–651. [Google Scholar] [CrossRef]
- Zhang, X.; Zhao, X.; Smith, S.; Xu, J.; Yu, X. Review of R&D progress and practical application of the solar photovoltaic/thermal (PV/T) technologies. Renew. Sustain. Energy Rev. 2012, 16, 599–617. [Google Scholar]
- Huang, B.J.; Lin, T.H.; Hung, W.C.; Sun, F.S. Performance evaluation of solar photovoltaic/thermal systems. Sol. Energy 2001, 70, 443–448. [Google Scholar] [CrossRef]
- Chow, T.T.; Ji, J.; He, W. Photovoltaic–thermal collector system for domestic application. J. Sol. Energy Eng. 2007, 129, 205–209. [Google Scholar] [CrossRef]
- He, W.; Chow, T.T.; Ji, J.; Lu, J.P.; Pei, G.; Chan, L.S. Hybrid photovoltaic and thermal solar-collector designed for natural circulation of water. Appl. Energy 2006, 83, 199–210. [Google Scholar] [CrossRef]
- Ji, J.; Lu, J.P.; Chow, T.T.; He, W.; Pei, G. A sensitivity study of a hybrid photovoltaic/thermal water-heating system with natural circulation. Appl. Energy 2007, 84, 222–237. [Google Scholar] [CrossRef]
- IEA-Africa Energy Outlook 2019-World Energy Outlook Special Report. Available online: https://www.ncran.gc.ca/maps-tools-publications/tools/data-analysis-software-modelling/retscreen/7465 (accessed on 22 April 2020).
- Hazami, M.; Ali Riahi, A.; Mehdaoui, F.; Omeima Nouicer, O.; Farhat, A. Energetic and exergetic performances analysis of a PV/T (photovoltaic thermal) solar system tested and simulated under to Tunisian (North Africa) climatic conditions. Energy 2016, 10715, 78–94. [Google Scholar] [CrossRef]
- Abdulkadir, M.; Muhammad, S.B. Design and construction of a thermosiphonic solar photovoltaic: Thermal water heating system for sustainable development in temperate regions of Africa. J. Altern. Energy Sources Technol. 2017, 8, 1–8. [Google Scholar]
- Siecker, J.; Kusakan, K.; Numbi, B.P. Optimal switching control of PV/T systems with energy storage using forced water circulation: Case of South Africa. J. Energy Storage 2018, 20, 264–278. [Google Scholar] [CrossRef]
- Oyieke, A.Y.A.; Inambao, F.L. Performance characterisation of a hybrid flat-plate vacuum insulated photovoltaic/thermal solar power module in subtropical climate. Int. J. Photoenergy 2016, 2, 1–15. [Google Scholar] [CrossRef]
- Apuko, O.A.Y.; Inambao, F.L. Simulation and performance evaluation of a vacuum insulated hybrid solar photovoltaic/thermal power module for domestic applications in South Africa. TMC Acad. J. 2015, 9, 1–19. [Google Scholar]
- Sawadogo, W.; Abiodun, B.J.; Okogbue, E.C. Impacts of global warming on photovoltaic power generation over West Africa. Renew. Energy 2020, 151, 263–277. [Google Scholar] [CrossRef]
- Meunier, S.; Heinrich, M.; Quéval, L.; Cherni, J.A.; Vido, L.; Darga, A.; Dessante, P.; Multon, B.; Kitanidis, P.K.; Marchand, C. A validated model of a photovoltaic water pumping system for off-grid rural communities. Appl. Energy 2019, 241, 580–591. [Google Scholar] [CrossRef]
- Akinyele, D.; Babatunde, O.; Monyei, C.; Olatomiwa, L.; Okediji, A.; Ighravwe, D.; Abiodun, O.; Onasanya, M.; Temikotan, K. Possibility of solar thermal power generation technologies in Nigeria: Challenges and policy directions. Renew. Energy Focus 2019, 29, 24–41. [Google Scholar] [CrossRef]
- Nyarko, F.K.A.; Takyi, G.; Amalu, E.H.; Adaramola, M.S. Generating temperature cycle profile from in-situ climatic condition for accurate prediction of thermo-mechanical degradation of c-Si photovoltaic module. Eng. Sci. Technol. Int. J. 2019, 22, 502–514. [Google Scholar] [CrossRef]
- Quansah, D.A.; Adaramola, M.S. Assessment of early degradation and performance loss in five co-located solar photovoltaic module technologies installed in Ghana using performance ratio time-series regression. Renew. Energy 2019, 131, 900–910. [Google Scholar] [CrossRef]
- Quansah, D.A.; Adaramola, M.S. Ageing and degradation in solar photovoltaic modules installed in northern Ghana. Sol. Energy 2018, 173, 834–847. [Google Scholar] [CrossRef]
- Quansah, D.A.; Muyiwa, S.A.; Appiah, G.K.; Edwin, I.A. Performance analysis of different grid-connected solar photovoltaic (PV) system technologies with combined capacity of 20 kW located in humid tropical climate. Int. J. Hydrog. Energy 2017, 42, 4626–4635. [Google Scholar] [CrossRef]
- Enongene, K.E.; Abanda, F.H.; Otene, I.J.J.; Obi, S.I.; Okafor, C. The potential of solar photovoltaic systems for residential homes in Lagos city of Nigeria. J. Environ. Manag. 2019, 24415, 247–256. [Google Scholar] [CrossRef]
- Caton, P. Design of rural photovoltaic water pumping systems and the potential of manual array tracking for a West-African village. Sol. Energy Vol. 2014, 103, 288–302. [Google Scholar] [CrossRef]
- Ndiaye, A.; Kébé, C.M.F.; Charki, A.; Ndiaye, P.A.; Sambou, V.; Kobi, A. Degradation evaluation of crystalline-silicon photovoltaic modules after a few operation years in a tropical environment. Sol. Energy Vol. 2014, 103, 70–77. [Google Scholar] [CrossRef]
- Tossa, A.K.; Soro, Y.M.; Azoumah, Y.; Yamegueu, D. A new approach to estimate the performance and energy productivity of photovoltaic modules in real operating conditions. Sol. Energy Vol. 2014, 110, 543–560. [Google Scholar] [CrossRef]
- Dajuma, A.; Yahaya, S.; Touré, S.; Diedhiou, A.; Adamou, R.; Konaré, A.; Sido, M.; Golba, M. Sensitivity of solar photovoltaic panel efficiency to weather and dust over West Africa: Comparative experimental study between Niamey (Niger) and Abidjan (Côte d’Ivoire). Comput. Water Energy Environ. Eng. 2016, 5, 123–147. [Google Scholar] [CrossRef]
- Yushchenko, A.; de Bono, A.; Chatenoux, B.; Patel, M.K.; Ray, M. GIS-based assessment of photovoltaic (PV) and concentrated solar power (CSP) generation potential in West Africa. Renew. Sustain. Energy Rev. 2018, 81, 2088–2103. [Google Scholar] [CrossRef]
- Simo-Tagne, M.; Ndukwu, M.C.; Zoulalian, A.; Bennamoun, L.; Kifani-Sahban, F.; Rogaume, Y. Numerical analysis and validation of a natural convection mix-mode solar dryer for drying red chilli under variable conditions. Renew. Energy 2020, 151, 659–673. [Google Scholar] [CrossRef]
- Ogunmodimu, O.; Okoroigwe, E.C. Solar thermal electricity in Nigeria: Prospects and challenges. Energy Policy 2019, 128, 440–448. [Google Scholar] [CrossRef]
- Seshie, Y.M.; N’Tsoukpoe, K.E.; Neveu, P.; Coulibaly, Y.; Azoumah, Y.K. Small scale concentrating solar plants for rural electrification. Renew. Sustain. Energy Rev. 2018, 90, 195–209. [Google Scholar] [CrossRef]
- Ayompe, L.M.; Duffy, A.; McCormack, S.J.; Conlon, M. Measured performance of a 1.72 kW rooftop grid connected photovoltaic system in Ireland. Energy Convers. Manag. 2011, 52, 816–825. [Google Scholar] [CrossRef]
- Adaramola, M.S.; Vågnes, E.E.T. Preliminary assessment of a small-scale rooftop PV-grid tied in Norwegian climatic conditions. Energy Convers. Manag. 2015, 90, 458–465. [Google Scholar] [CrossRef]
- Homer Pro Microgrid Analysis Tool-Version 3.13.6. Available online: www.homerenergy.com (accessed on 10 February 2020).
- Soubdhan, T.; Emilion, R.; Calif, R. Classification of daily solar radiation distributions using a mixture of Drichlet distributions. Sol. Energy 2009, 83, 1056–1063. [Google Scholar] [CrossRef]
- RETScreen Expert- Version 6.0.7.55. Available online: https://www.ncran.gc.ca/maps-tools-publications/tools/data-analysis-software-modelling/retscreen/7465 (accessed on 13 February 2020).
- Benatiallah, A.; Mostefaou, R.; Bradja, K. Performance of photovoltaic solar system in Algeria. Desalination 2007, 209, 39–42. [Google Scholar] [CrossRef]
- Mondol, J.D.; Yohanis, Y.; Smyth, M.; Norton, B. Long term performance analysis of a grid connected photovoltaic system in Northern Ireland. Energy Convers. Manag. 2006, 47, 2925–2947. [Google Scholar] [CrossRef]
- Miguel, A.D.; Bilbao, J.; Cazorro, J.R.S.; Martin, C. Performance analysis of a grid-connected PV system in a rural site in the northwest of Spain. In Proceedings of the World Renewable Energy Congress VII (WREC 2002), Cologne, Germany, 29 June–5 July 2002; Available online: https://www.researchgate.net/profile/Argimiro_De_Miguel/publication/258221437_Performance_analysis_of_a_grid-connected_PV_system_in_a_rural_site_in_the_Northwest_of_Spain/links/598987884585156058588c9b/Performance-analysis-of-a-grid-connected-PV-system-in-a-rural-site-in-the-Northwest-of-Spain.pdf (accessed on 13 February 2020).
- Humada, A.M.; Hojabri, M.; Hamada, H.M.; Samsuri, F.B.; Ahmed, M.N. Performance evaluation of two PV technologies (c-Si and CIS) for building integrated photovoltaic based on tropical climate condition: A case study in Malaysia. Energy Build. 2016, 119, 233–241. [Google Scholar] [CrossRef]
- Ghiani, E.; Pilo, F.; Cossu, S. Evaluation of photovoltaic installations performances in Sardinia. Energy Convers. Manag. 2013, 76, 1134–1142. [Google Scholar] [CrossRef]
- Tripathia, B.; Yadav, P.; Rathod, S.; Kumar, M. Performance analysis and comparison of two silicon material based photovoltaic technologies under actual climatic conditions in Western India. Energy Convers. Manag. 2014, 80, 97–102. [Google Scholar] [CrossRef]
- Tan, P.H.; Gan, C.K.; Baharin, K.A. Techno-economic analysis of rooftop PV system in UTeM Malaysia. In Proceedings of the IEEE Xplore 2014, 3rd IET International Conference on Clean Energy and Technology (CEAT), Kuching, Malaysia, 24–26 November 2014. [Google Scholar]


| Parameters | PVT | PV |
|---|---|---|
| Dimension (mm3) | 1601 × 828 × 90 | 1640 × 992 × 45 |
| Aperture area (m2) | 1.326 | 1.474 |
| Absorber area (m2) | 1.194 | - |
| Weight (kg) | 24.4 | 18.3 |
| Nominal electrical power (W) | 200 | 270 |
| Thermal power (W) | 630 | - |
| Nominal current Imp (A) | 5.43 | 8.6 |
| Short circuit current Isc (A) | 5.67 | 9.31 |
| Nominal voltage Vmp (V) | 37.89 | 31.4 |
| Open circuit voltage Voc (V) | 45.26 | 38.3 |
| Module electrical efficiency (%) | 15.08 | 16.6 |
| Zero loss collector efficiency (%) | 0.48 | - |
| Temperature coefficient of Isc (%/°C) | 0.06 | 0.05 |
| Temperature coefficient of Voc (%/°C) | −0.34 | −0.34 |
| Temperature coefficient of Pmax (%/°C) | −0.45 | −0.45 |
| Nominal operating cell temperature NOCT (°C) | 45 ± 2 | 45 ± 2 |
| Absorber Surface (PV) | mc-Si | mc-Si |
| Absorber surface (T) | Copper | - |
| Variable | Instrumentation | Measurement Accuracy | Resolution |
|---|---|---|---|
| Flow Gauge (L/min) | Mechanical spring flow meter | not available | 0.2 |
| Temperature (°C) | 109 Temperature Probe (PT100) | ±0.2 °C (for 0–70 °C) | 0.01 |
| Solar irradiance(W/m2) | Apogee SP-421 pyranometer | ±1% | <0.001 |
| Wind speed (m/s) | Decagon DL-2 wind sensor | 3% | 0.01 |
| Air temperature (°C) | CS215 Temp/RH sensor | ±0.4 °C (5–40 °C) | 0.01 |
| Relative humidity (%) | CS215 Temp/RH sensor | ±4% (0–100%) at 25 °C | 0.03 |
| Flow rate (L/min) | Mechanical valves set. | Not specified | 0.2 |
| Current (A) | Bim205 smart charger w/MPPT | Not specified | 0.1 |
| Voltage (V) | Bim205 smart charger w/MPPT | Not specified | 0.1 |
| Month | Ambient Conditions | ||||
|---|---|---|---|---|---|
| V m/s | PV °C | PVT °C | |||
| January | 4.49 | 30.57 | 0.56 | 42.26 | 40.21 |
| February | 4.39 | 30.86 | 0.60 | 42.87 | 40.69 |
| March | 4.90 | 30.94 | 0.73 | 44.22 | 41.19 |
| April | 4.72 | 30.67 | 0.75 | 43.60 | 40.98 |
| May | 4.44 | 29.88 | 0.75 | 41.65 | 39.33 |
| June | 3.67 | 28.08 | 0.80 | 37.87 | 36.38 |
| July | 2.90 | 26.79 | 0.81 | 34.69 | 34.01 |
| August | 2.82 | 26.62 | 0.93 | 34.62 | 34.17 |
| September | 3.20 | 27.31 | 0.74 | 37.16 | 35.97 |
| October | 3.94 | 28.00 | 0.78 | 40.08 | 38.08 |
| November | 4.90 | 29.91 | 0.71 | 43.65 | 40.80 |
| December | 4.25 | 30.10 | 0.71 | 42.58 | 39.74 |
| Reference | |||
|---|---|---|---|
| Fuentes et al. [7] | 16.1–19.1 | 50–70.4 | 66.1–89.5 |
| Fudholi et al. [12] | 11.9–12.4 | 41.1–48 | 53.6–66.8 |
| Fudholi et al. [12] | 12.2–12.7 | 46.4–54.6 | 58.6–66.8 |
| Zhang et al. [13] | 9.5 | 50.0 | 59.5 |
| Huang et al. [14] | 9.0 | 38.0 | 47.0 |
| Chow et al. [15] | 11.0 | 51.0 | 62.0 |
| He et al. [16] | 9.8 | 40.0 | 49.87 |
| Ji et al. [17] | 10.15 | 45.0 | 55.15 |
| Present study | 9.9–11.5 | 29.44–44.84 | 39.34–56.34 |
| Location | PR (%) | Reference |
|---|---|---|
| Dublin, Ireland | 81.50 | [40] |
| Kumasi, Ghana | 67.90 | [30] |
| Algeria | 80.70 | [45] |
| Ballymena, Ireland | 60-62 | [46] |
| Castile and Leon, Spain | 69.80 | [47] |
| Malaysia | 59.90–79.14 | [48] |
| Sardinia, Italy | 83.20–87.3 | [49] |
| Gujarat, India | 57.10–93.14 | [50] |
| Malaysia | 77.85 | [51] |
| Kumasi, Ghana | 79.18 | Present study |
| Kumasi, Ghana (PVT) 1 | 51.60 | Present study |
| Parameter | PV | PVT |
|---|---|---|
| Rated Power of PV (Wp) | 270 | 200 |
| Annual energy output of PV (kWh/year) | 315.73 | 198.19 |
| Annual average daily energy output of PV (Wh/day) | 865.02 | 542.97 |
| Yearly total irradiance (kW/m2) | 14,766.66 | 14,766.66 |
| Yearly average daily irradiance (kWh/m2/day) | 4.05 | 4.05 |
| Daily Reference Yield (kWh/kW/day) | 4.05 | 4.05 |
| Daily Module Yield (kWh/kWp/day) | 3.20 | 2.09 |
| Performance Ratio (%) | 79.18 | 51.60 |
| Annual Capacity factor (%) | 13.34 | 11.30 |
| Efficiency (averaged) (%) | 12.14 | 10.80 |
© 2020 by the authors. Licensee MDPI, Basel, Switzerland. This article is an open access article distributed under the terms and conditions of the Creative Commons Attribution (CC BY) license (http://creativecommons.org/licenses/by/4.0/).
Share and Cite
Abdul-Ganiyu, S.; Quansah, D.A.; Ramde, E.W.; Seidu, R.; Adaramola, M.S. Investigation of Solar Photovoltaic-Thermal (PVT) and Solar Photovoltaic (PV) Performance: A Case Study in Ghana. Energies 2020, 13, 2701. https://doi.org/10.3390/en13112701
Abdul-Ganiyu S, Quansah DA, Ramde EW, Seidu R, Adaramola MS. Investigation of Solar Photovoltaic-Thermal (PVT) and Solar Photovoltaic (PV) Performance: A Case Study in Ghana. Energies. 2020; 13(11):2701. https://doi.org/10.3390/en13112701
Chicago/Turabian StyleAbdul-Ganiyu, Saeed, David A Quansah, Emmanuel W Ramde, Razak Seidu, and Muyiwa S. Adaramola. 2020. "Investigation of Solar Photovoltaic-Thermal (PVT) and Solar Photovoltaic (PV) Performance: A Case Study in Ghana" Energies 13, no. 11: 2701. https://doi.org/10.3390/en13112701
APA StyleAbdul-Ganiyu, S., Quansah, D. A., Ramde, E. W., Seidu, R., & Adaramola, M. S. (2020). Investigation of Solar Photovoltaic-Thermal (PVT) and Solar Photovoltaic (PV) Performance: A Case Study in Ghana. Energies, 13(11), 2701. https://doi.org/10.3390/en13112701