Article

Investigation of Solar Photovoltaic-Thermal (PVT) and Solar Photovoltaic (PV) Performance: A Case Study in Ghana

1
Faculty of Environmental Sciences and Natural Resources Management, Norwegian University of Life Science, Høgskoleveien 12, 1433 Ås, Norway
2
Department of Mechanical Engineering, Kwame Nkrumah University of Science and Technology (KNUST), Kumasi AK-448-6464, Ghana
3
The Brew-Hammond Energy Centre, Kwame Nkrumah University of Science and Technology (KNUST), Kumasi AK-448-6464, Ghana
4
Department of Ocean Operations and Civil Engineering, Norwegian University of Science and Technology, 6025 Ålesund, Norway
*
Author to whom correspondence should be addressed.
Energies 2020, 13(11), 2701; https://doi.org/10.3390/en13112701
Submission received: 31 March 2020 / Revised: 11 May 2020 / Accepted: 19 May 2020 / Published: 28 May 2020
(This article belongs to the Section A2: Solar Energy and Photovoltaic Systems)

Abstract

:
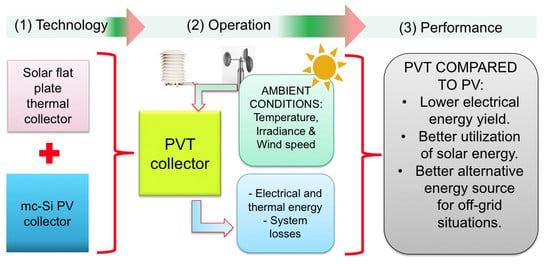
The main objective of this paper is to experimentally assess the real-life outdoor performance of a photovoltaic-thermal (PVT) module against a conventional photovoltaic (PV) system in a hot humid tropical climate in Ghana. An experimental setup comprising a water-based mono-crystalline silicon PVT and an ordinary mono-crystalline silicon PV was installed on a rooftop at the Kwame Nkrumah University of Science and Technology in Kumasi and results evaluated for the entire year of 2019. It was observed that the annual total output energy of PV module was 194.79 kWh/m2 whereas that of the PVT for electrical and thermal outputs were 149.92 kWh/m2 and 1087.79 kWh/m2, respectively. The yearly average daily electrical energy yield for the PV and PVT were 3.21 kWh/kWp/day and 2.72 kWh/kWp/day, respectively. The annual performance ratios for the PV and PVT (based on electrical energy output only) were 79.2% and 51.6%, respectively, whilst their capacity factors were, respectively, 13.4% and 11.3%. Whereas the highest monthly mean efficiency recorded for the PV was 12.7%, the highest combined measured monthly mean electrical/thermal efficiency of the PVT was 56.1%. It is also concluded that the PVT is a worthy prospective alternative energy source in off-grid situations.

Graphical Abstract

1. Introduction

Solar energy is commonly collected as heat and electricity through thermal and photovoltaic (PV) technologies, respectively. A hybrid photovoltaic-thermal (PVT) integrates a solar thermal absorber and a PV into one unit. Whereas the PV cells generate electricity, the integrated thermal system absorbs residual heat energy from the cells and thus reduces their temperature in the process and also enhances their performance [1,2,3]. The two most cost-effective working fluids are water and air, with water type found to be more efficient [4]. Hybrid PVT collectors can reach net (electrical plus thermal) efficiencies of 70% or higher, with electrical efficiencies up to 15–20% and thermal efficiencies exceeding 50%, depending on the conditions [5]. The PVT technologies have the potential to reduce the use of materials, installation time, and the required space [6]. The advantage of PVTs in generating both electricity and thermal energy simultaneously makes them handy for domestic applications. However, despite the immense potential, commercial PVT systems are still not as popular as stand-alone, and separately installed, PV and thermal systems [7,8].
PVT technologies have been studied since 1970s, including variation in designs, working fluids and other performance-influencing factors [2,3]. The thermal and electric energy outputs depend on many factors, some of which are irradiance, ambient temperature, wind speed, circulating fluid temperature and flowrate [7,9,10]. It is therefore important that more experimental data from different environmental conditions are collected to enrich available data to cover the different places in the world. The precise projection of solar collector behavior is key for ensuring proper design and reduction in underperformance or system failure; while improved models of PVT systems are required for optimization of the design and operating parameters in order to achieve higher electrical and thermal energy yields and increased energy savings [8].
Unlike indoor test conditions, climatic conditions could vary significantly affecting general performance and resilience of designs. For instance, the harsh harmattan weather conditions of sub-Saharan West Africa sets it apart from other places in the world. Although the efficiency of PVT collectors are affected by meteorological conditions, several of the studies to predict the performance of PVTs were carried out in Europe [7,8,9,11] and many parts of Asia [12,13,14,15,16,17], with minimal experimental investigation records on the subject in sub-Saharan Africa in the open literature. Nevertheless, Rejeb et al. numerically investigated a photovoltaic/thermal sheet and tube collector for the semi-arid climatic with hot summer and mild winter in North Africa [10]; but again, their data correspond to simulations, not experimental work.
Africa is home to 17% of the world’s population, but, generates 4% of global power supply. As of 2018, the electrification rate in sub-Saharan Africa was 45% with frequent electricity disruptions and economic losses. This and many more have hampered industrial expansion on the continent. Meanwhile, the continent has the richest solar resources in the world, but accounts for less than 1% of global solar PV installed capacity [18]. Solar resources provide the option of decentralized (and off-grid) solutions to remote settlements. The number of people who gained access to electricity through solar home systems in sub-Saharan Africa increased from two million in 2016 to approximately five million in 2018 [18]. This shows that, with the right policies, solar could become one of the top resources in overcoming the energy deficits on the continent. Thus, more research into solar technologies, like PVT, on the continent is needed for informed decision-making by stakeholders.
The few studies on PVT technology in Africa in the literature were based on climates of North Africa sub-region [10,19,20] and the country of South Africa [20,21,22,23]. In the case of West Africa, studies on solar technology were either separately conducted on solar photovoltaic systems [24,25,26,27,28,29,30,31,32,33,34,35,36] or solar thermal systems [36,37,38,39], with very little evidence of studies on performance of the combined technology (PVT) in the literature. The objective of this experimental study is therefore to assess the real-life performance of a water-based commercial PVT module against a PV system installed in a dynamic environment of Kumasi Ghana (in West Africa). The results from this study will provide valuable information about the viability of water PVT as an alternative source of energy for provision of warm water and electricity in (especially off-grid locations) Ghana. Furthermore, experimental data collected and presented in this study will serve as input and validation parameters for modelling and simulation of PVT systems. To the authors, this is the first study of a commercialized PVT in the dynamic tropical weather conditions of West Africa.

2. Materials and Methods

2.1. Experimental Set-up

The experimental set-up for the study was installed on the roof of the Department of Mechanical Engineering laboratory (6.68° N, 1.57° W), Kwame Nkrumah University of Science and Technology (KNUST), Kumasi-Ghana. The set-up consisted of a conventional solar PV and hybrid PVT installations (Figure 1). For ease of comparison and commercial availability, both modules were made up of mono-crystalline Silicon (mc-Si) PV technology. The selected specifications for the modules are shown in Table 1.
Special care was taken to ensure the PV and PVT modules were sourced from the same manufacturer for similarities in peripheral material composition and assembling techniques. The 200 W rated commercial PVT module had a layer of 72 mc-Si PV cells with a flat copper plate thermal system securely attached on its back. A thin adhesive layer, made up of ethylene-vinyl acetate (EVA) layer and the tedlar layer, was used to fix the PV module on to the thermal absorber plate. This compound adhesive layer also acted as a shock absorber to further strengthen the PV module. The heat conducted by the copper thermal plate from the PV cells was transferred by fluid (water in this case) flowing through 14 evenly distributed parallel copper pipes attached to the absorber plate and running from inlet to outlet manifolds. The thermal absorber was then covered with an insulator material and then finally with an aluminum foil to complete the thermal insulation on its back.
Both unshaded PVT and PV modules were oriented towards the south and inclined at a fixed angle of 8°. Tilt angle allowed natural cleaning of the modules during rainfalls, which reduced soiling by dust settlement on the installations, and ensured optimum capture of the solar irradiation for the location. In addition, the modules were manually cleaned on regular basis to reduce the effects of soiling. As shown in Figure 2, beneath the mounting frame for the PVT installations were two separated compartments for housing the main electrical/logging circuitry and water circulation system.

2.2. Schematic of the Experimental Setup and Water Circulation

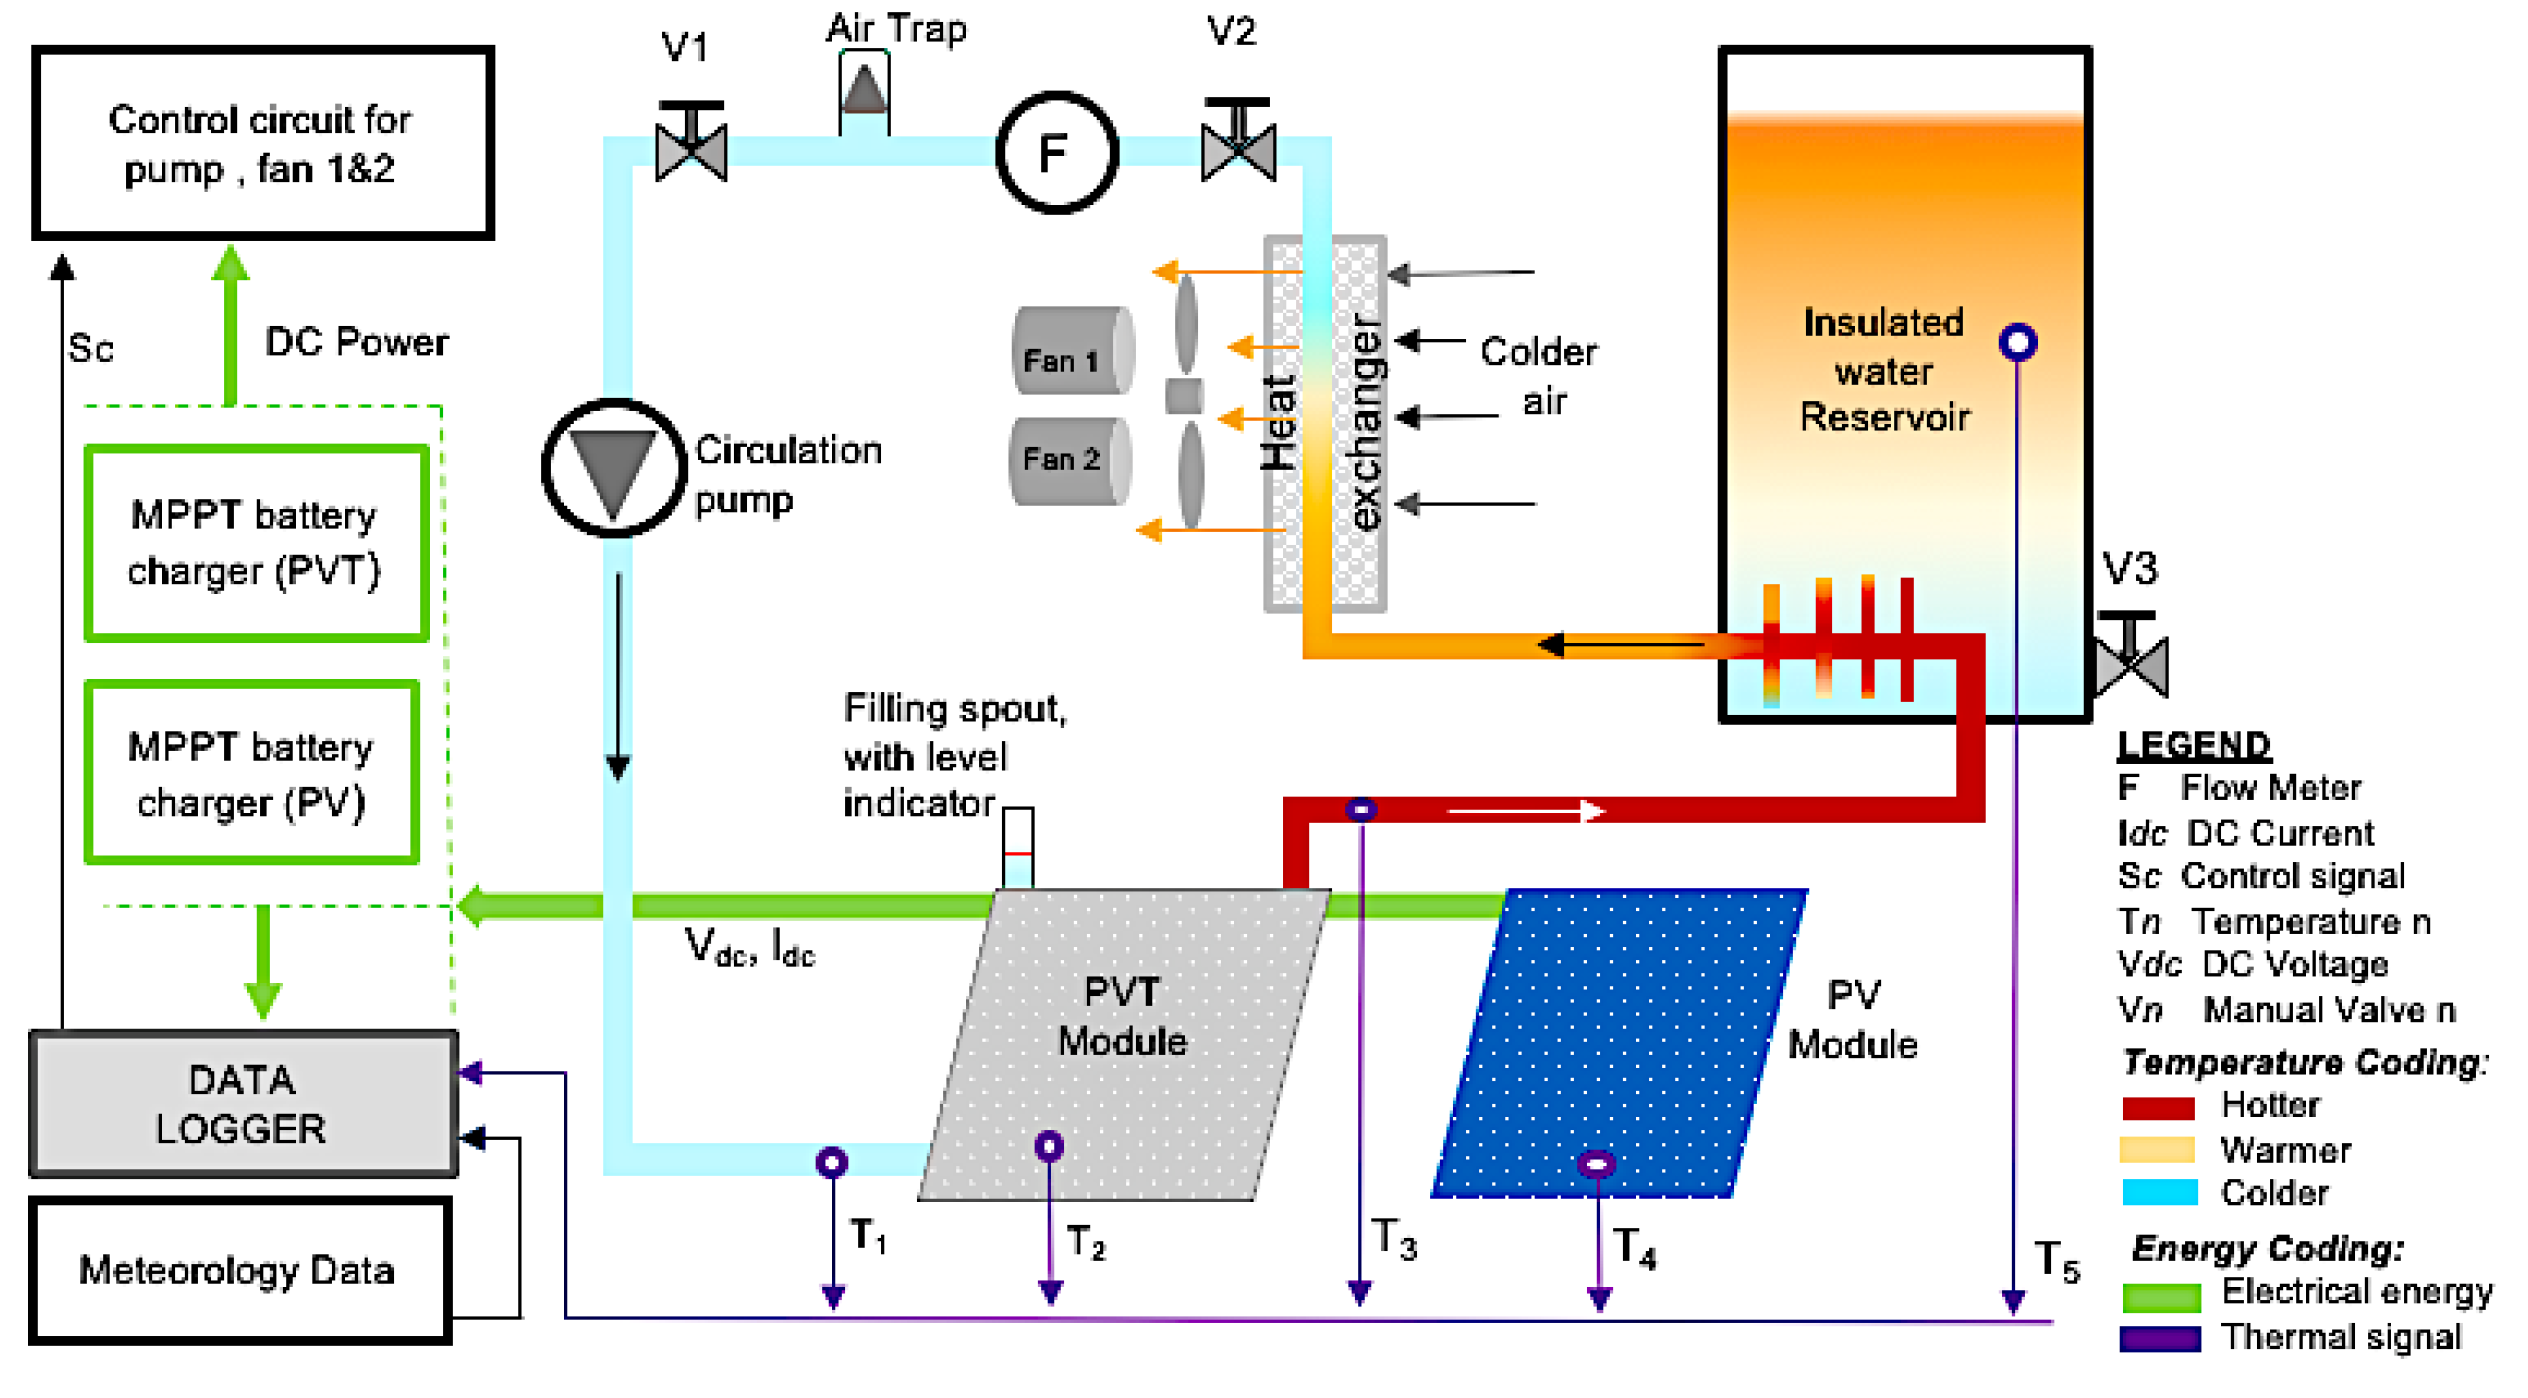
Figure 3 shows a schematic diagram of the experimental setup. The main heat transfer medium for the PVT was by force-circulated water in a closed-loop system. A flow jet direct current (DC) pump, with regulated input power, circulated the water at solar irradiance above 150 W/m2 when the thermal absorber temperature was greater than its inlet water temperature. The solar irradiance was measured with a pyranometer mounted in-plane on the PVT module. Manual valves V1 and V2 were used to regulate the flow rate and monitored with a mechanical spring flow meter F (see Figure 3). The relatively warm water from the PVT went through a copper-coiled heat exchanger submerged in 70 L of water contained in an insulated tank. For the purpose of the experiment, the circulating water returning into the PVT inlet was further cooled with a water-to-air heat exchanger. This also reduced the problem of potential heat recirculation from the water tank back to the PVT, making it a better stand-alone system.

2.3. Instrumentations, System Control and Data Collection

A programmable data logger (CR300, Campbell Scientific, Logan, UT, USA) was used to record both meteorological and the modules’ performance data. The measurements were sampled every 10s and then averaged over 15-min periods, from which hourly, daily and monthly data were determined. The meteorological measurements were the global solar irradiance in plane-of-array (W/m2), ambient wind velocity (m/s), ambient relative humidity (%) and ambient air temperature (°C). The electrical energy yields from the PVT and PV modules were measured by two dedicated maximum power point tracking (MPPT) battery chargers (BIM 205 Version 1.0, MicroStep-MIS, Bratislava, Slovak Republic). Batteries, radiator fans, data logger and circulation pump were powered from the battery charger, serving as external loads to the modules. Logged data from the battery chargers included output currents (A) and voltages (V) from modules.
Apart from ambient temperature, all other temperatures were separately measured with calibrated temperature sensors (PT100, Campbell Scientific, Logan, Utah, USA). As shown in Figure 3, measured temperatures included the PVT inlet water temperature (T1), PVT module back temperature (T2), PVT outlet water temperature (T3), PV module back temperature (T4) and water storage tank temperature (T5). In addition to recording data, the logger was programed to control the functionalities of the mechanical components in the PVT setup based on real-time in-plane global irradiation. Active water circulation through the PVT was kept at a constant flowrate per desired set value. Table 2 shows the list and basic characteristics of the instrumentation used in this study.

2.4. Data Analysis

2.4.1. Module Temperature

The peak or rated power of a PV module is determined under standard test conditions (STC), which are solar irradiance of 1 kW/m2, module temperature of 25 °C and air-mass ratio (AM) of 1.5 (AM = 1.5). However, in real life outdoor situations, the ambient conditions are different from these STC, and hence, the PV module power output will differ from the rated power. The cell temperature T c e l l (°C) at any ambient temperature T a m b   (°C) is given as:
T c e l l T a m b N O C T T a m b . N O C T = G P G P . N O C T × U L . N O C T U L   [ 1 η c e l l ( τ α ) ] ,
where NOCT is the nominal operating cell temperature (°C), G P is the in-plane global irradiance (W/m2), η c e l l is cell efficiency (%), ( τ α ) is the effective transmittance-absorptance, U L is the loss coefficient (W/m2 °C) and Z N O C T means parameter Z at NOCT. The loss coefficient can further be expressed as:
U L = 5.7 + 3.8 ω ,
where ω   is wind speed (m/s). Additionally, at NOCT, T a m b . N O C T is 20 °C, G P . N O C T is 800 W/m2 and ω is 1 m/s, at no load operation (i.e., η c e l l   = 0). Equation (1) can therefore be simplified as:
T c e l l = T a m b + [ ( 9.5 5.7 + 3.8 ω ) × ( N O C T 20 800 ) × G p ] ,
Thus the effect of solar irradiance, ambient temperature and wind speed on solar PV module can be quantified by their impact on the module temperature as given in Equation (3).

2.4.2. PV Performance Indices-Energy Yield, Performance Ratio and Efficiency

The performance of a PV system is usually examined using a number of selected performance indices, including energy yield, performance ratio and efficiency. The energy yield is defined as output normalized by the PV system’s rated capacity. It specifies how many hours in a day the PV system must operate at its rated power in order to produce the same amount of energy as was measured [40,41]. It is given as:
Y A = E a v . d P r a t e d
where Y A is the array yield in kWh/kWp/day, E a v . d is the average daily module DC energy output (kWh/day) and P r a t e d is the rated kilowatt peak electrical power (kWp) of the PV module at STC.
The performance ratio (PR) measures the overall effect of losses on the rated output of the system and indicates how close its performance is to the ideal performance during real life operation. The PR is useful for the comparison of modules that receive different amounts of irradiation, especially due to geographical location and or PV inclination. It is given as [40,41]:
P R = E a v . d P r a t e d × S h
where Sh (h/day) is the plane-of-array average daily peak sun-hours, which is the same as the reference yield, YR. The reference yield is the ratio of the total in-plane solar radiation to the array reference irradiance, H R (usually taken as 1 kW/m2). It is a measure of the theoretical energy available at a specific location over a specified time period [41] given as:
Y R   = G p H R
The PV module efficiency is given as:
η p v = 100 × E d c A m × G p % ,
where A m is the module total surface area (m2) and G p is the in-plane solar irradiance (kW/m2). E d c  is the DC power from the module in kW. Depending on the available data and desire level of resolution, the efficiencies can be determined on instantaneous, hourly, daily, monthly and annual bases [41].

2.4.3. PVT Performance Indices—Heat Gained, Thermal Energy Yield and Efficiency

The overall performance of a PVT system is a combination of both PV (electricity) and its thermal (heat energy) components. The thermal gain of the system is given as:
E t h = M w c p Δ T
where M w is the water mass flow rate (kg/s), c p  is the specific heat of water (kJ/kg °C) and ΔT (°C) is the temperature difference, expressed as:
Δ T = T 3 T 1
where T 1 and T 3 are the inlet and outlet water temperature, respectively (see Figure 3).
The mass flow rate Mw can also be expressed in volumetric terms as:
M w = V w . ρ ( T ) ,
where Vw is the volumetric flow rate in m3/s and ρ ( T ) is the density of water (kg/m3) at temperature T. Both c p and ρ ( T ) were assumed to be constant ( c p   = 4.18 J/kg °C, ρ ( T ) = 1000 kg/m3) throughout the analysis presented in the study.
The thermal efficiency of the PVT is given as:
η t h = 100 × E t h A m × G p   % ,
Combining Equations (7) and (11), the overall efficiency of a PVT system is given as:
η P V T = 100 × E d c A m × G p + 100 × E t h A m × G p = 100 A m × G p ( E d c + E t h ) % ,

2.4.4. Clearness Index

The clearness index is the fraction of the solar radiation reaching the top of the atmosphere that makes it through the atmosphere to reach the Earth’s surface. It is normally calculated as a ratio of the monthly averaged daily global solar radiation on horizontal surface ( H a v ) to the monthly averaged daily extraterrestrial solar radiation ( H o . a v   ) at a given site.
The monthly daily average clearness index (KT):
K T = H a v H o . a v   ,
The extraterrestrial irradiance H o can be determined using the mathematical expression:
H o   = 24 π G s c   ( 1 + 0.033 c o s ( 360 n 365 ) ) × ( c o s L cos δ s i n H S R + π 180 H S R   s i n L   s i n δ ) ,
where n is the day of the year, L is the latitude of the site, δ is the declination angle of the sun, G s c   is the extraterrestrial solar constant 1.37 kW/m2 and H S R is the sunrise hour given as:
H S R = c o s 1 [ tan ( L ) tan ( δ ) ] ,
H o . a v can then be calculated as:
H o . a v = r = 1 R H o R ,
where R is the number of days in the month. For this study, monthly daily average clearness indexes were generated for the site using HOMER Pro energy simulation software (Version 3.13.6, Homer Energy, Boulder, CO, USA) [42] which employs existing global data sources and libraries in its predictions.

3. Results and Discussion

3.1. Ambient Conditions

The performance of a solar collector is influenced by a number of interactive factors including, weather conditions. There is however, a very high level of variability and uncertainty in predicting meteorological variables. Nonetheless, PV cell temperature, for instance, is a function of ambient temperature, wind speed and global irradiance (Equation (3)).

3.1.1. Ambient Temperature ( T a m b )

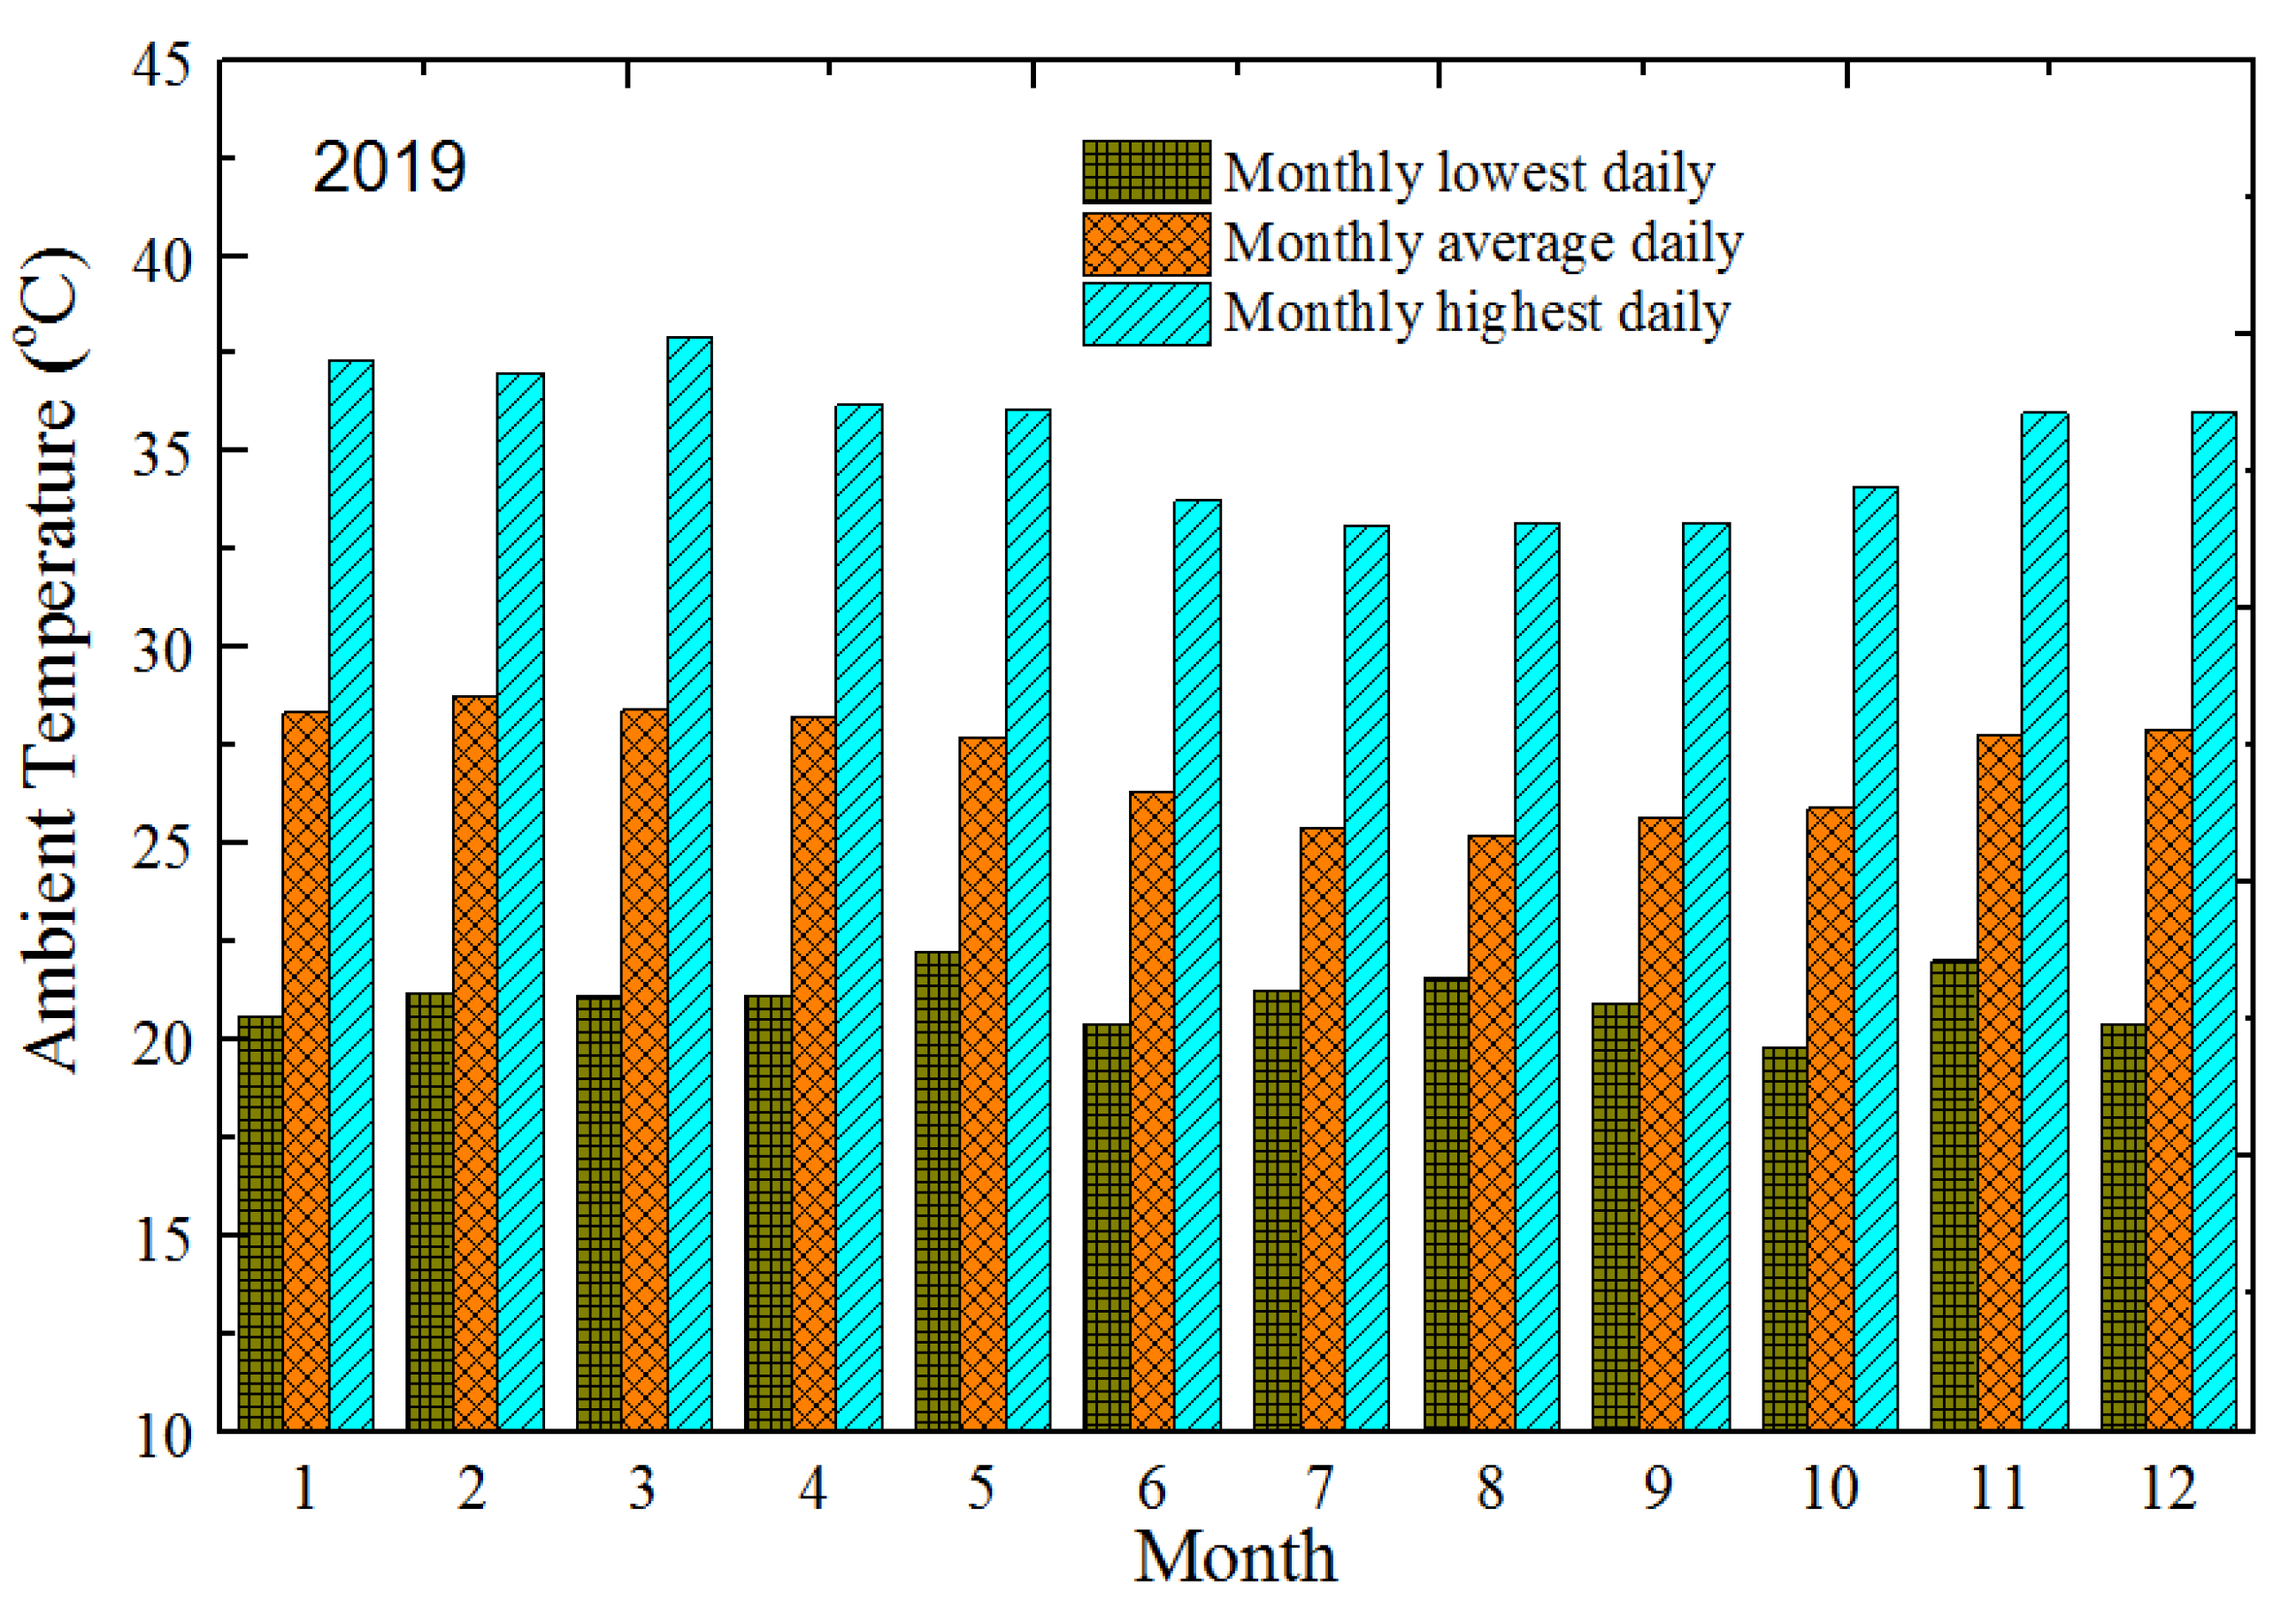
Figure 4 shows the monthly variation of measured ambient temperature. It can be observed from Figure 4 that the highest ambient temperature of 37.90 °C was recorded in the month of March, whereas the minimum of 19.81 °C occurred in October. However, the highest and minimum monthly average daily ambient temperatures of 28.78 °C and 25.18 °C were recorded in February and August, respectively. The average ambient temperature is dependent on the time or season of the year. Ghana has two main climatic seasons namely, the wet and dry seasons. Typically, the wet season in Kumasi starts from April to October. It is normally characterized by cloudy weather conditions, relatively higher mean monthly precipitation and relatively lower mean monthly ambient temperatures. The dry season (which predominantly spans November to March) records low-to-no precipitation and higher ambient temperatures.

3.1.2. Solar Irradiation ( G p )

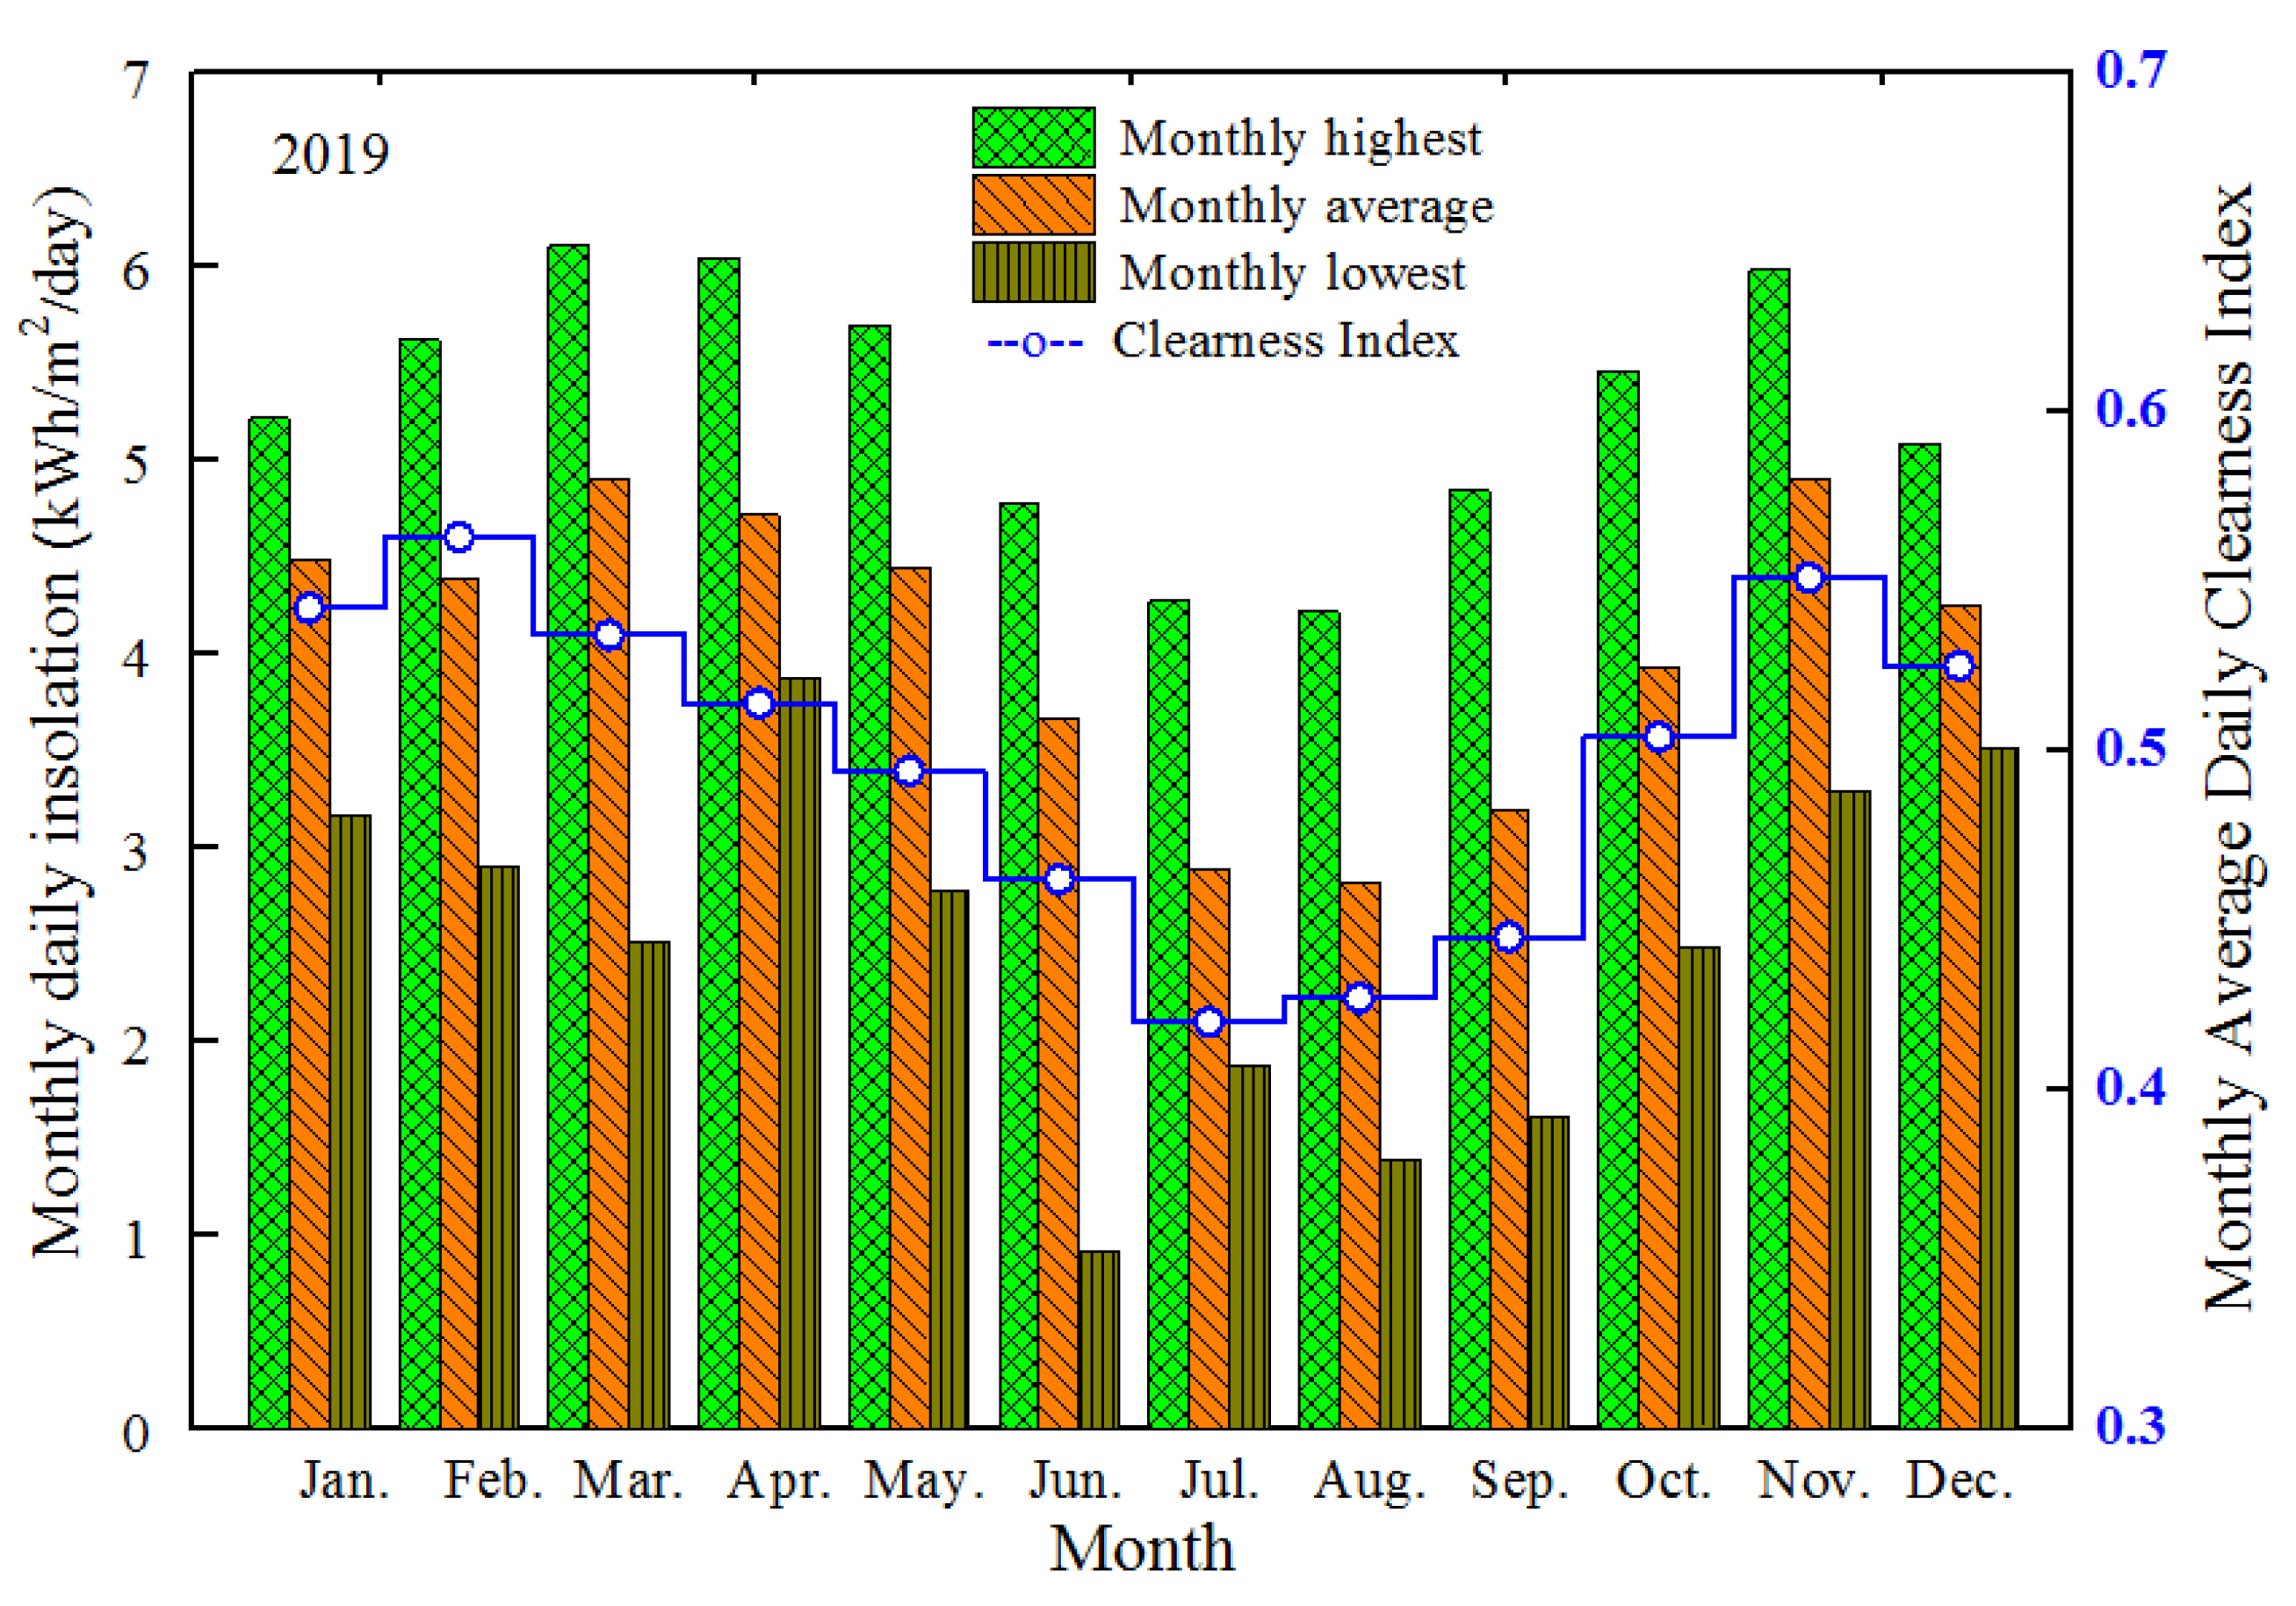
Figure 5 shows the monthly in-plane global solar insolation and monthly average clearness index values in 2019. It was observed that the highest monthly average daily insolation was recorded in the months of March, April and November with clearness index values of 0.53, 0.51 and 0.55, respectively. The lowest monthly average daily irradiations were in July and August (with clearness index values of 0.42 and 0.43, respectively) due to dense cloudy sky conditions. Although the general sky conditions for January and December were not cloudy, they signified the harmattan season when lots of dust and smoke prevailed in the atmosphere and led to high levels of solar attenuation. Annual lowest and highest daily insolation of 0.91 kWh/m2/day and 6.10 kWh/m2/day were observed in the months of June and March, respectively. Furthermore, the annual average daily solar energy for the site was 4.05 kWh/m2/day.

3.1.3. Wind Speed ( ω )

Figure 6 shows the monthly average and maximum wind speed within the vicinity of the installation. For the period of the study, the monthly average wind speed was less than 1.00 m/s, which prospectively indicated that wind speed effects on solar photovoltaic performance could be negligible. However, observed maximum monthly wind speeds ranged from 3 m/s in February to 11 m/s in October.

3.2. Module Temperature ( T cell )

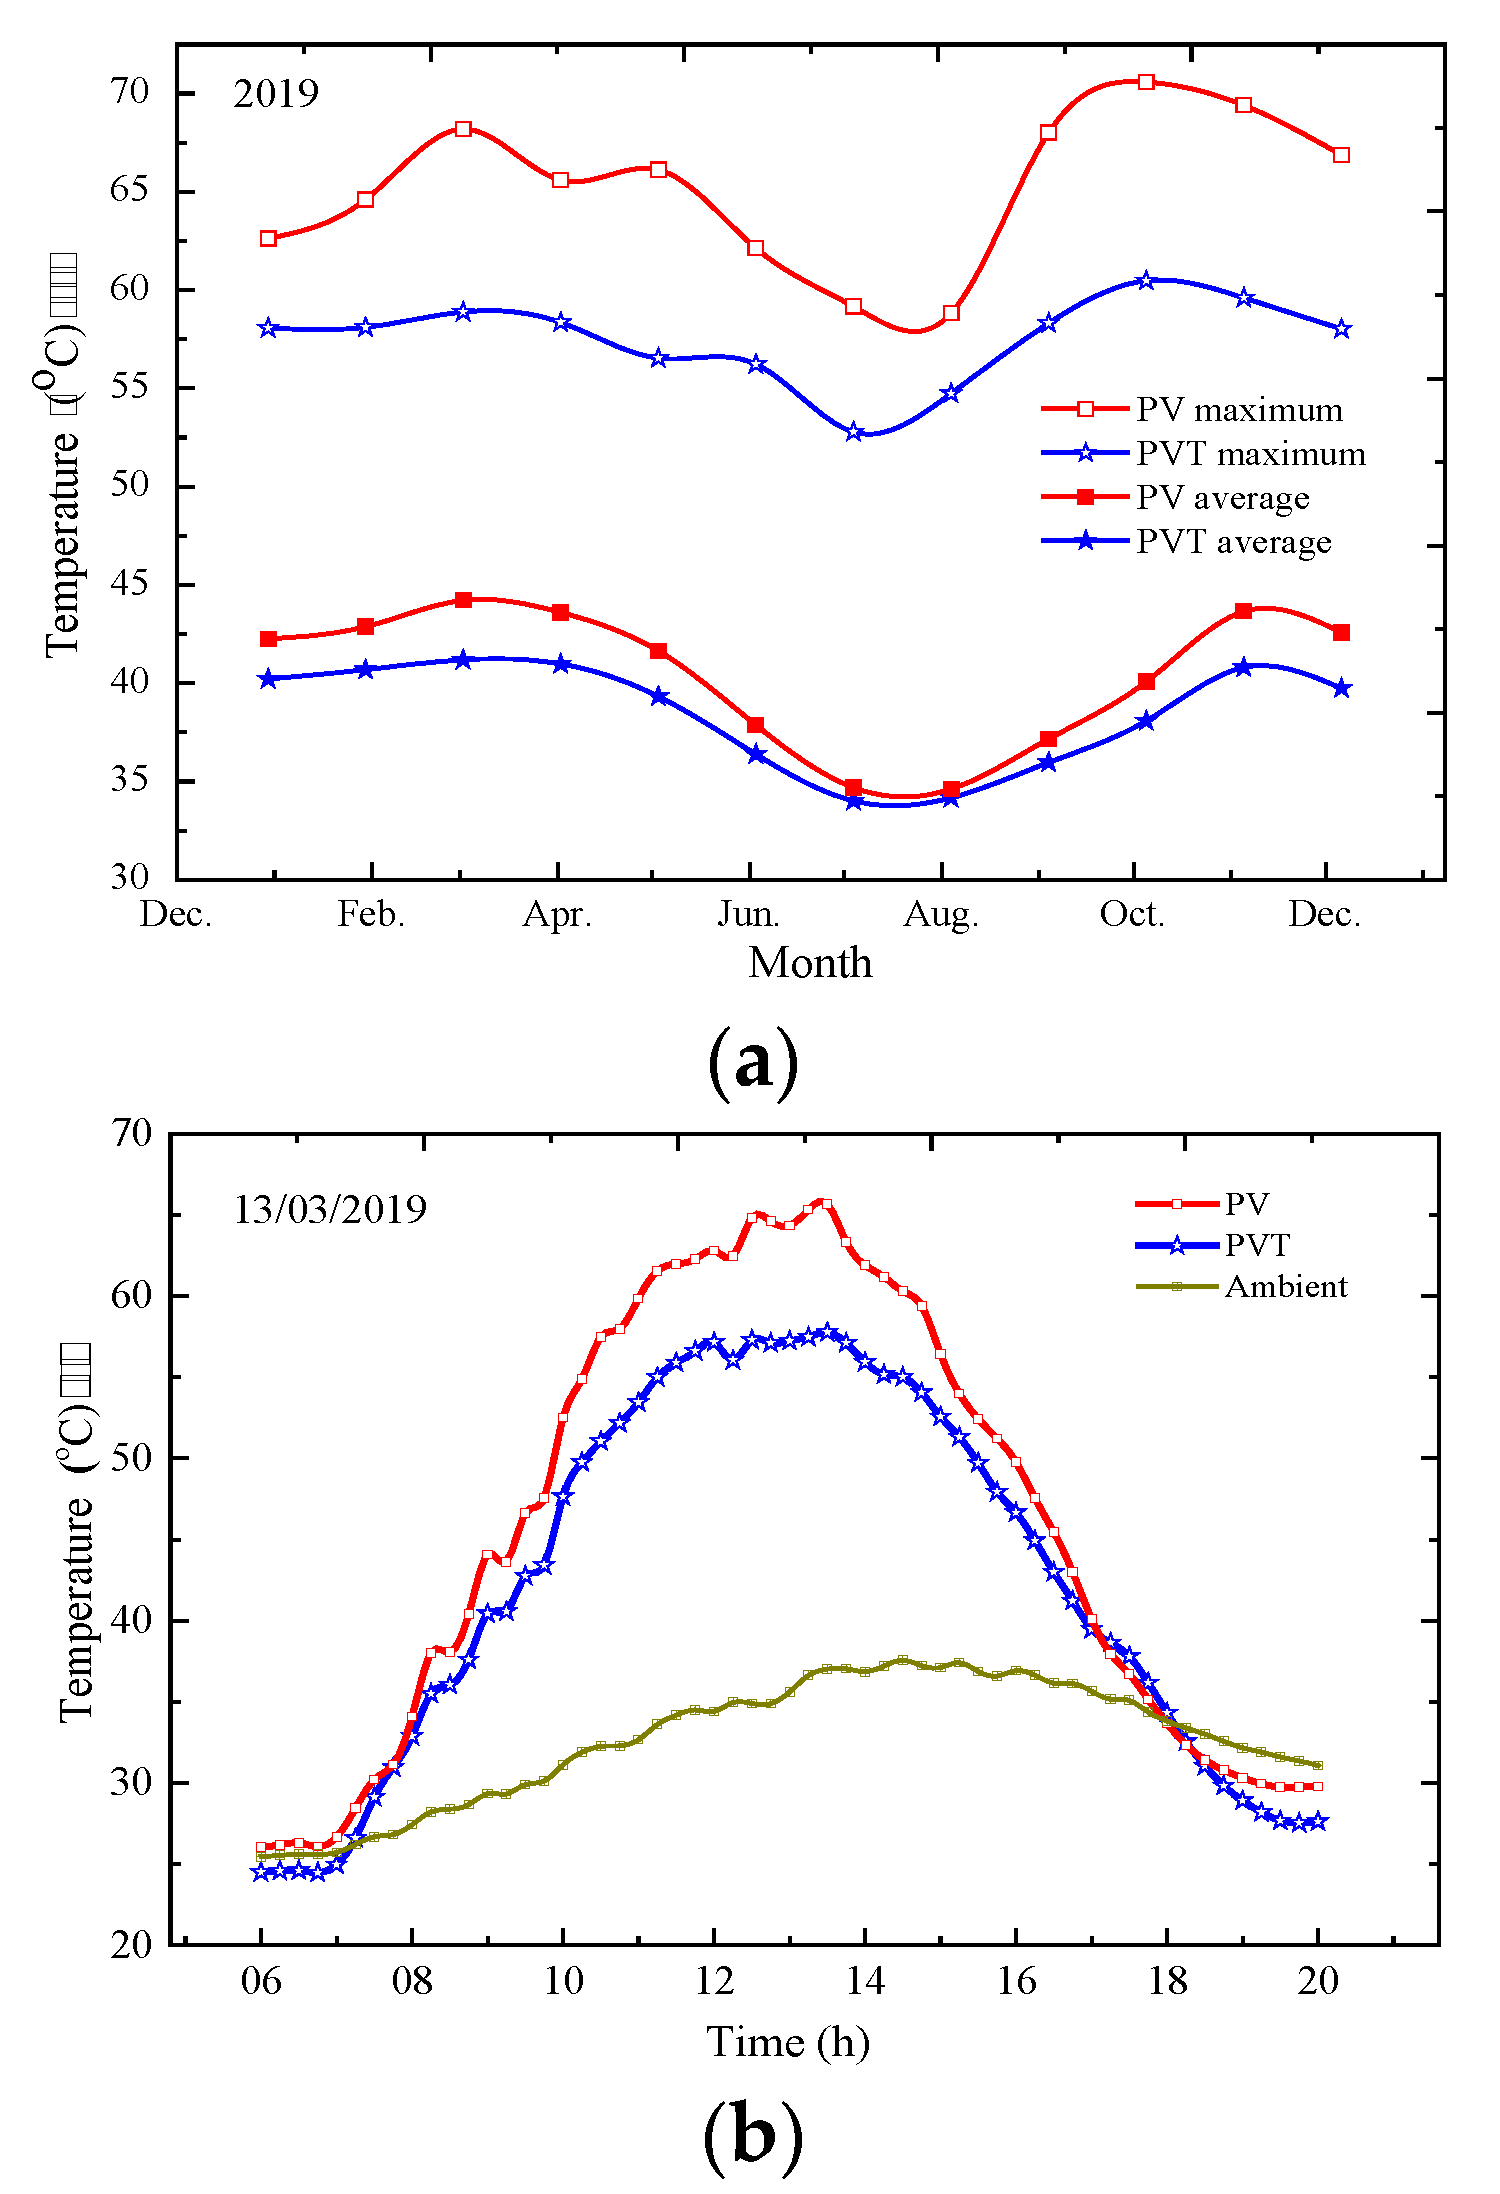
The variations in PV and PVT module temperatures at daytime are shown in Figure 7. The recorded average PV module temperatures at daytime were relatively higher than average PVT module temperatures, ranging from 1.3% higher in the month of August to 6.9% higher in March. This could translate into a relatively higher net energy yield per rated wattage for PVT module, due to the lower cell temperature and higher heat recoveries.
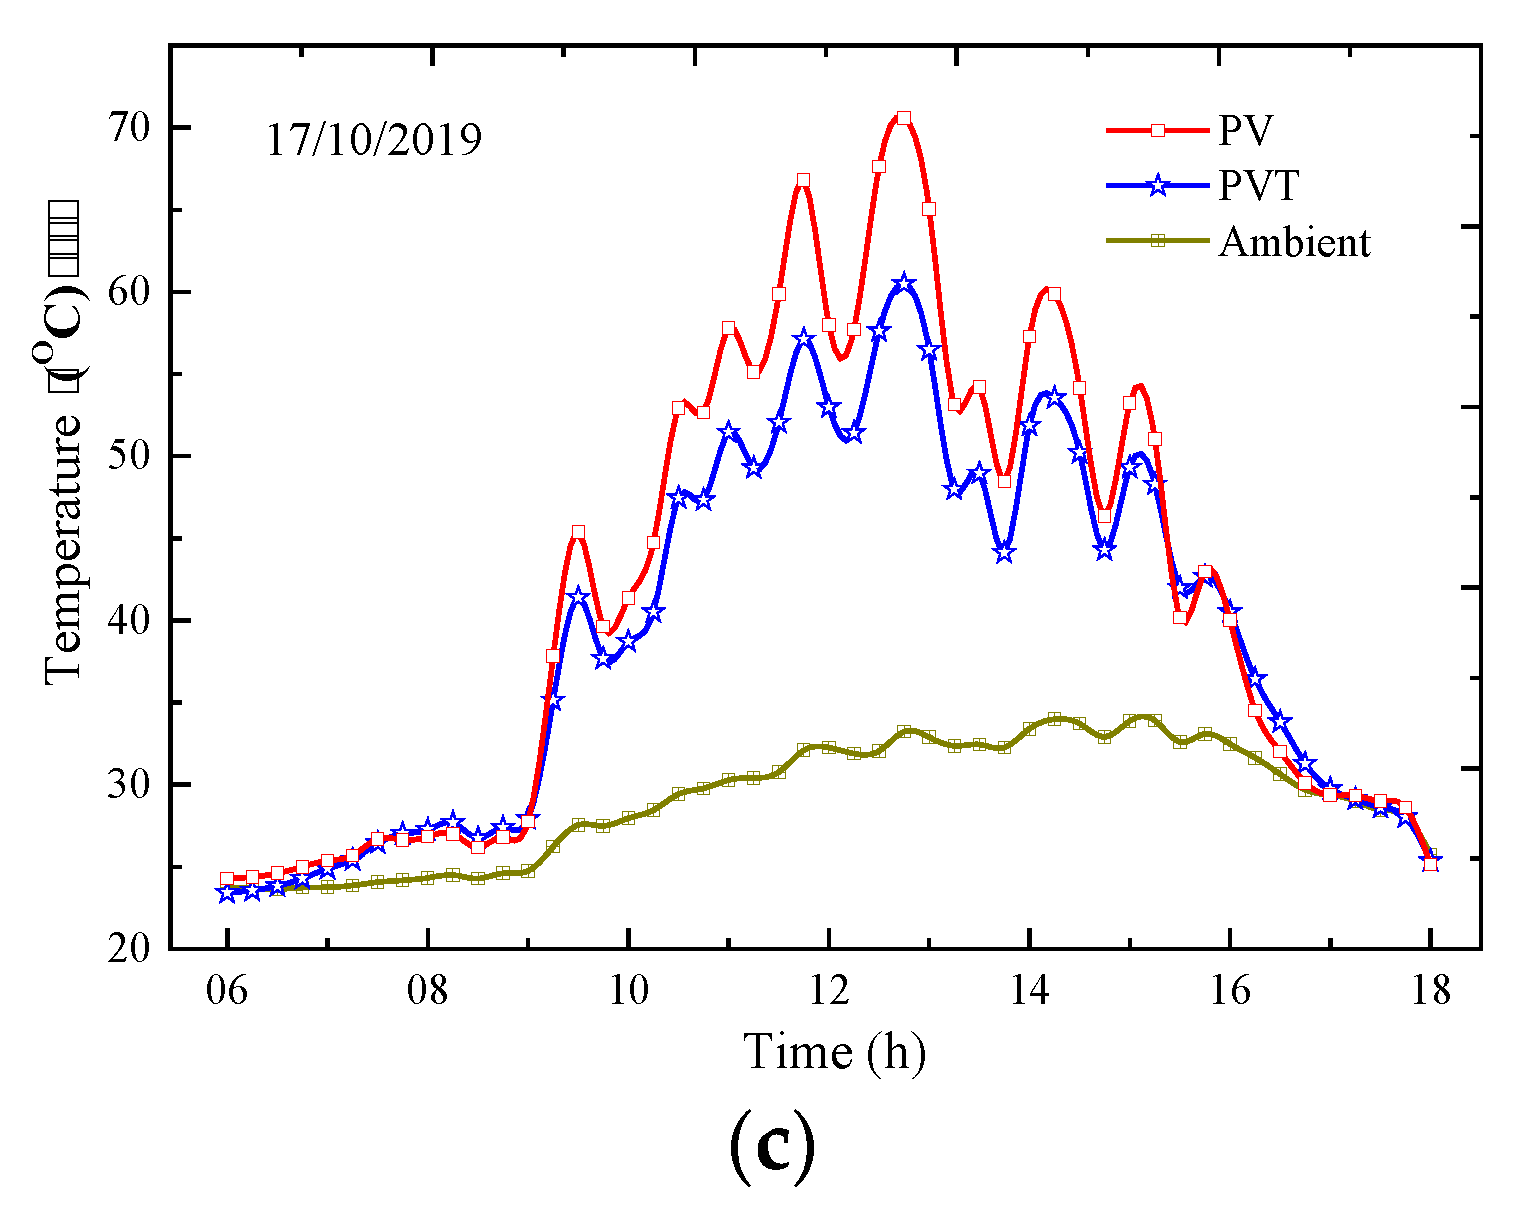
Figure 7b,c show the contrasting effects of solar irradiance fluxes on the modules temperatures. Cloudy and unstable weather conditions, smoke and dust in the atmosphere intermittently attenuated incidental solar irradiation resulting in fluctuations and generally lowered ambient temperatures with telling effects on solar module temperature. Nonetheless, the highest recorded operating cell temperatures for the modules for the period under study were 70.6 °C and 60.5 °C for PV module and PVT module, respectively, recorded on the 17 October 2019 (Figure 7c). The high module temperatures were consistent with an earlier study in the same environment [30] where similar observations were made for different PV technologies. Table 3 presents the summary installations’ site ambient conditions and PV and PVT module temperatures.

3.3. Performance

3.3.1. Electrical Energy Outputs for both PV and PVT

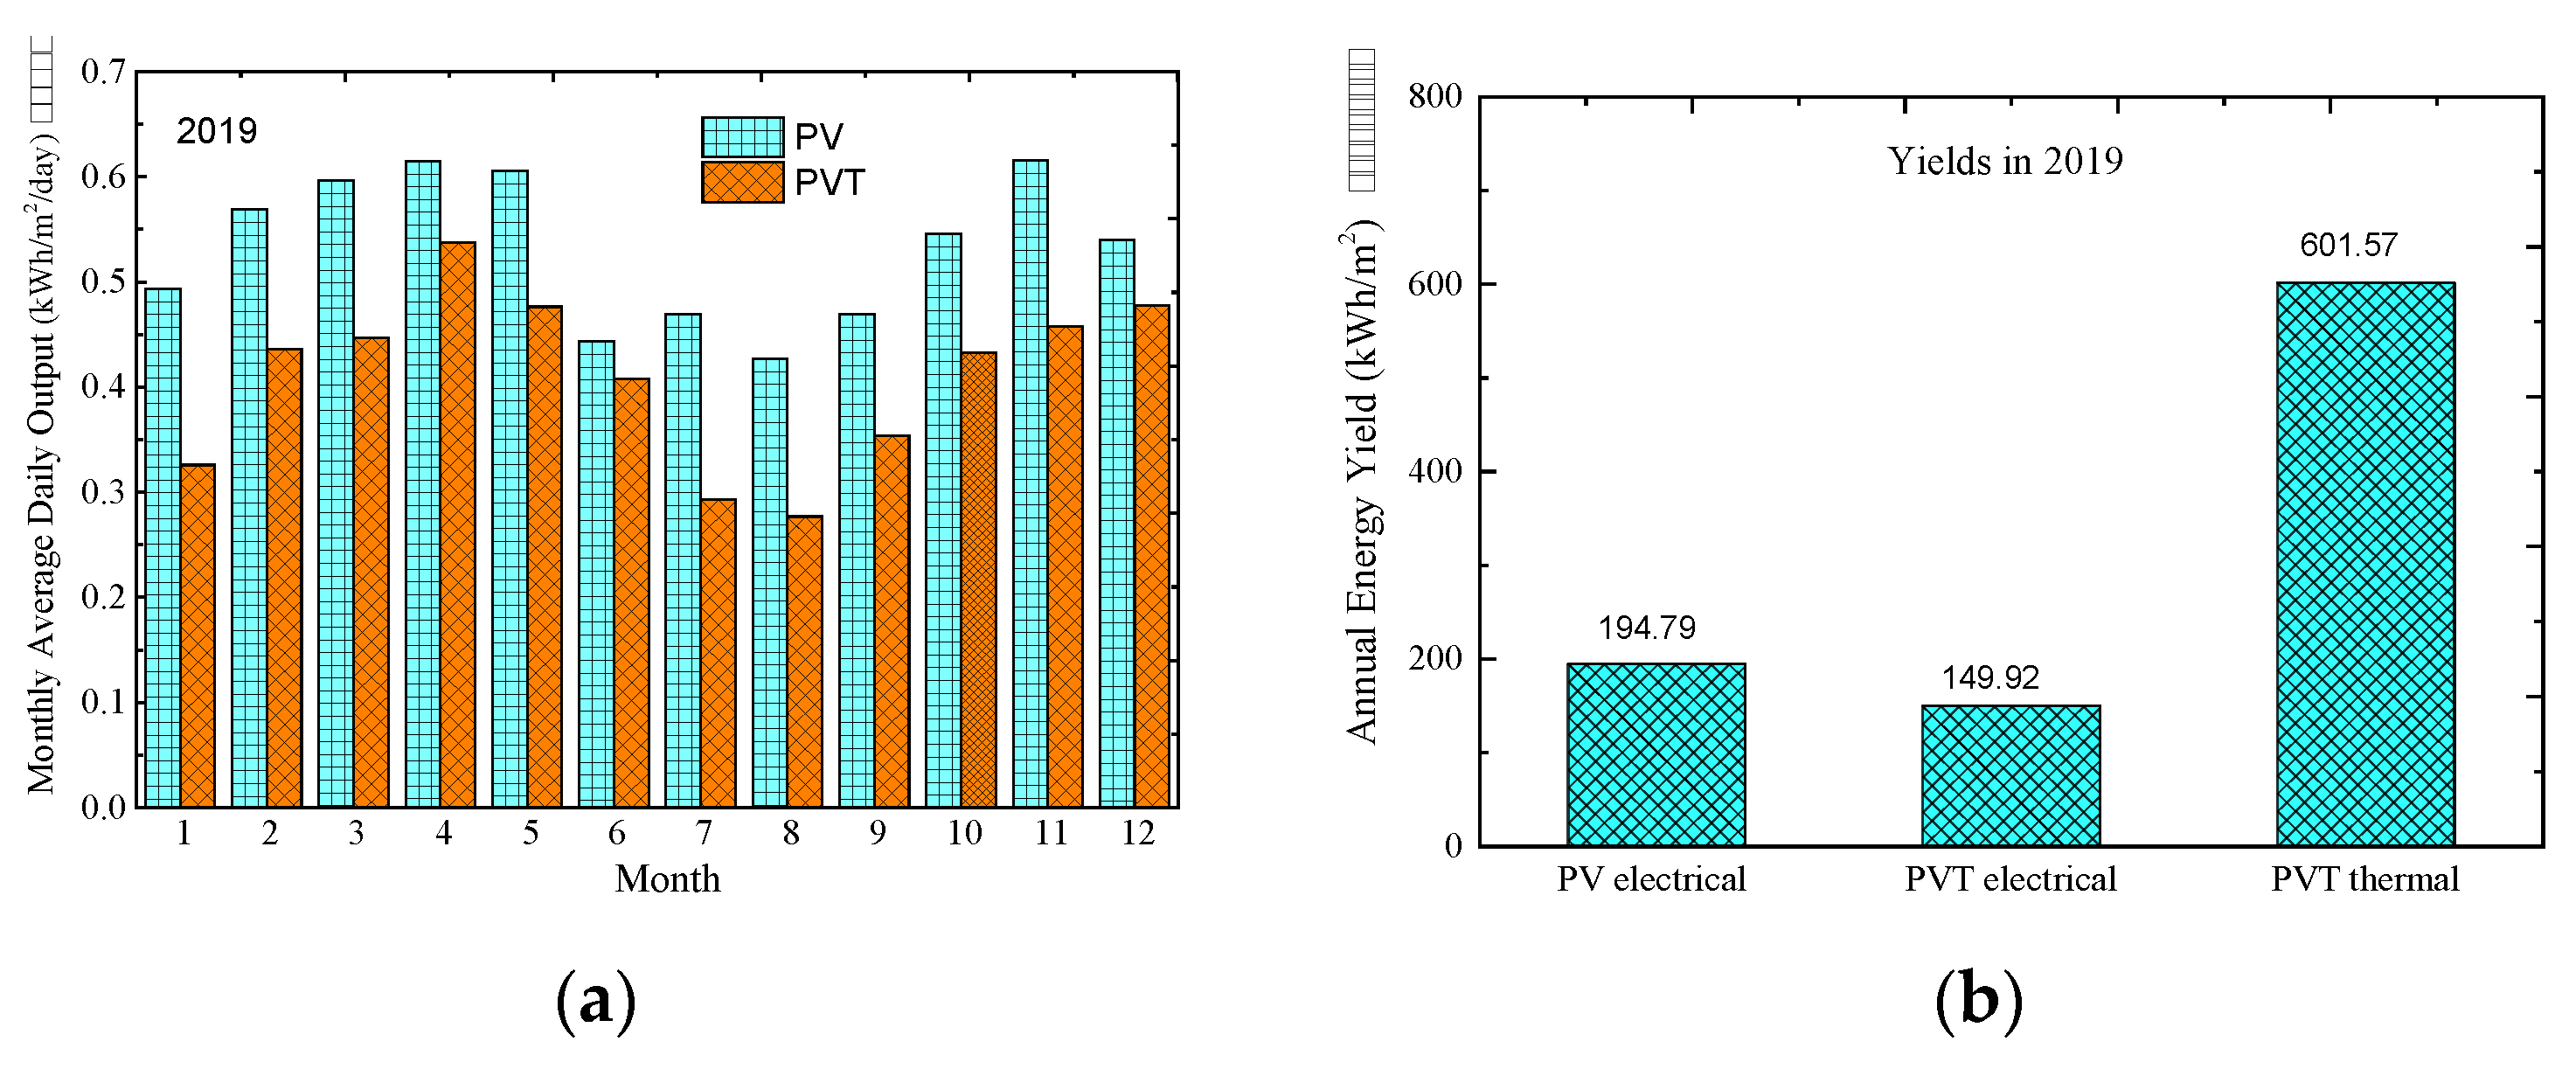
The electrical energy outputs from both PVT and PV were measured at maximum power point (MPP). Both the PV and the PVT outputs followed the same trend as in-plane solar radiation (Figure 5 and Figure 8a). As shown in Figure 8a, in comparison with the other months, the DC outputs from both PV and PVT modules were generally low in the months of June to September. For the PV, the monthly average daily electrical energy outputs varied from 0.39 kW/m2/day in August to 0.62 kWh/m2/day in April and November. In the case of the PVT however, it varied from 0.29 kW/m2/day in August to 0.54 kWh/m2/day in April. Unlike the PV, the PVT performance dependency factors go beyond environmental factors to include PV parking factor, type and flow rate of the thermal fluid, type and design of thermal absorber [7,10,11] etc. which were not covered in the scope of this work.
The annual total electrical energy measurements, per unit area, assessed from PV and PVT modules were 194.79 kWh/m2 and 149.92 kWh/m2, respectively (Figure 8b). In addition to the electrical energy, the PVT also provided an added incentive of 601.57 kWh/m2 of heat energy over the same period.

3.3.2. Efficiency

The efficiency was based on only DC power output, since the installations were not connected to inverters. It was calculated for every 15 min (data resolution) for daily sun-hour periods (with filtered irradiance ≥ 150 W/m2) and then averaged monthly. Nameplate rated efficiencies (DC) for PV and PVT are 16.60% and 15.08%, respectively (see Table 1). From the results, the monthly averaged electrical efficiency for PV varied from 11.6% to 12.7% over the data collection period, indicating a deviation range of 23.1% to 30.1%, relative to rated efficiency. In the case of the PVT, the electrical efficiency varied from 9.9% to 11.5%, representing a deviation of 28% to 38% from STC rating. In addition to that, the thermal efficiency for the PVT had a wider variation of 29.44% to 44.84%. This represented a deviation of 5.6% to 38% from its zero-loss collector efficiency of 47.5% (see Table 1). This could be attributed to the slow thermal response (time constant of up to 8 min [8]) of the PVT’s thermal absorber (copper sheet with pipes in this case) to erratic spectral changes, typical of the study environment [30,43]. It can also be deduced from Table 4 that the average thermal efficiency of the commercial PVT was predominantly lower than those reported in most studies in the literature. This could be attributed to many factors, including poor contact between absorber and PV. A similar observation was made about a commercial water PVT by Guarracino et al. [8] in another study. Notwithstanding this observation, the highest recorded monthly mean net efficiency was 56.14%.

3.3.3. Reference Yield

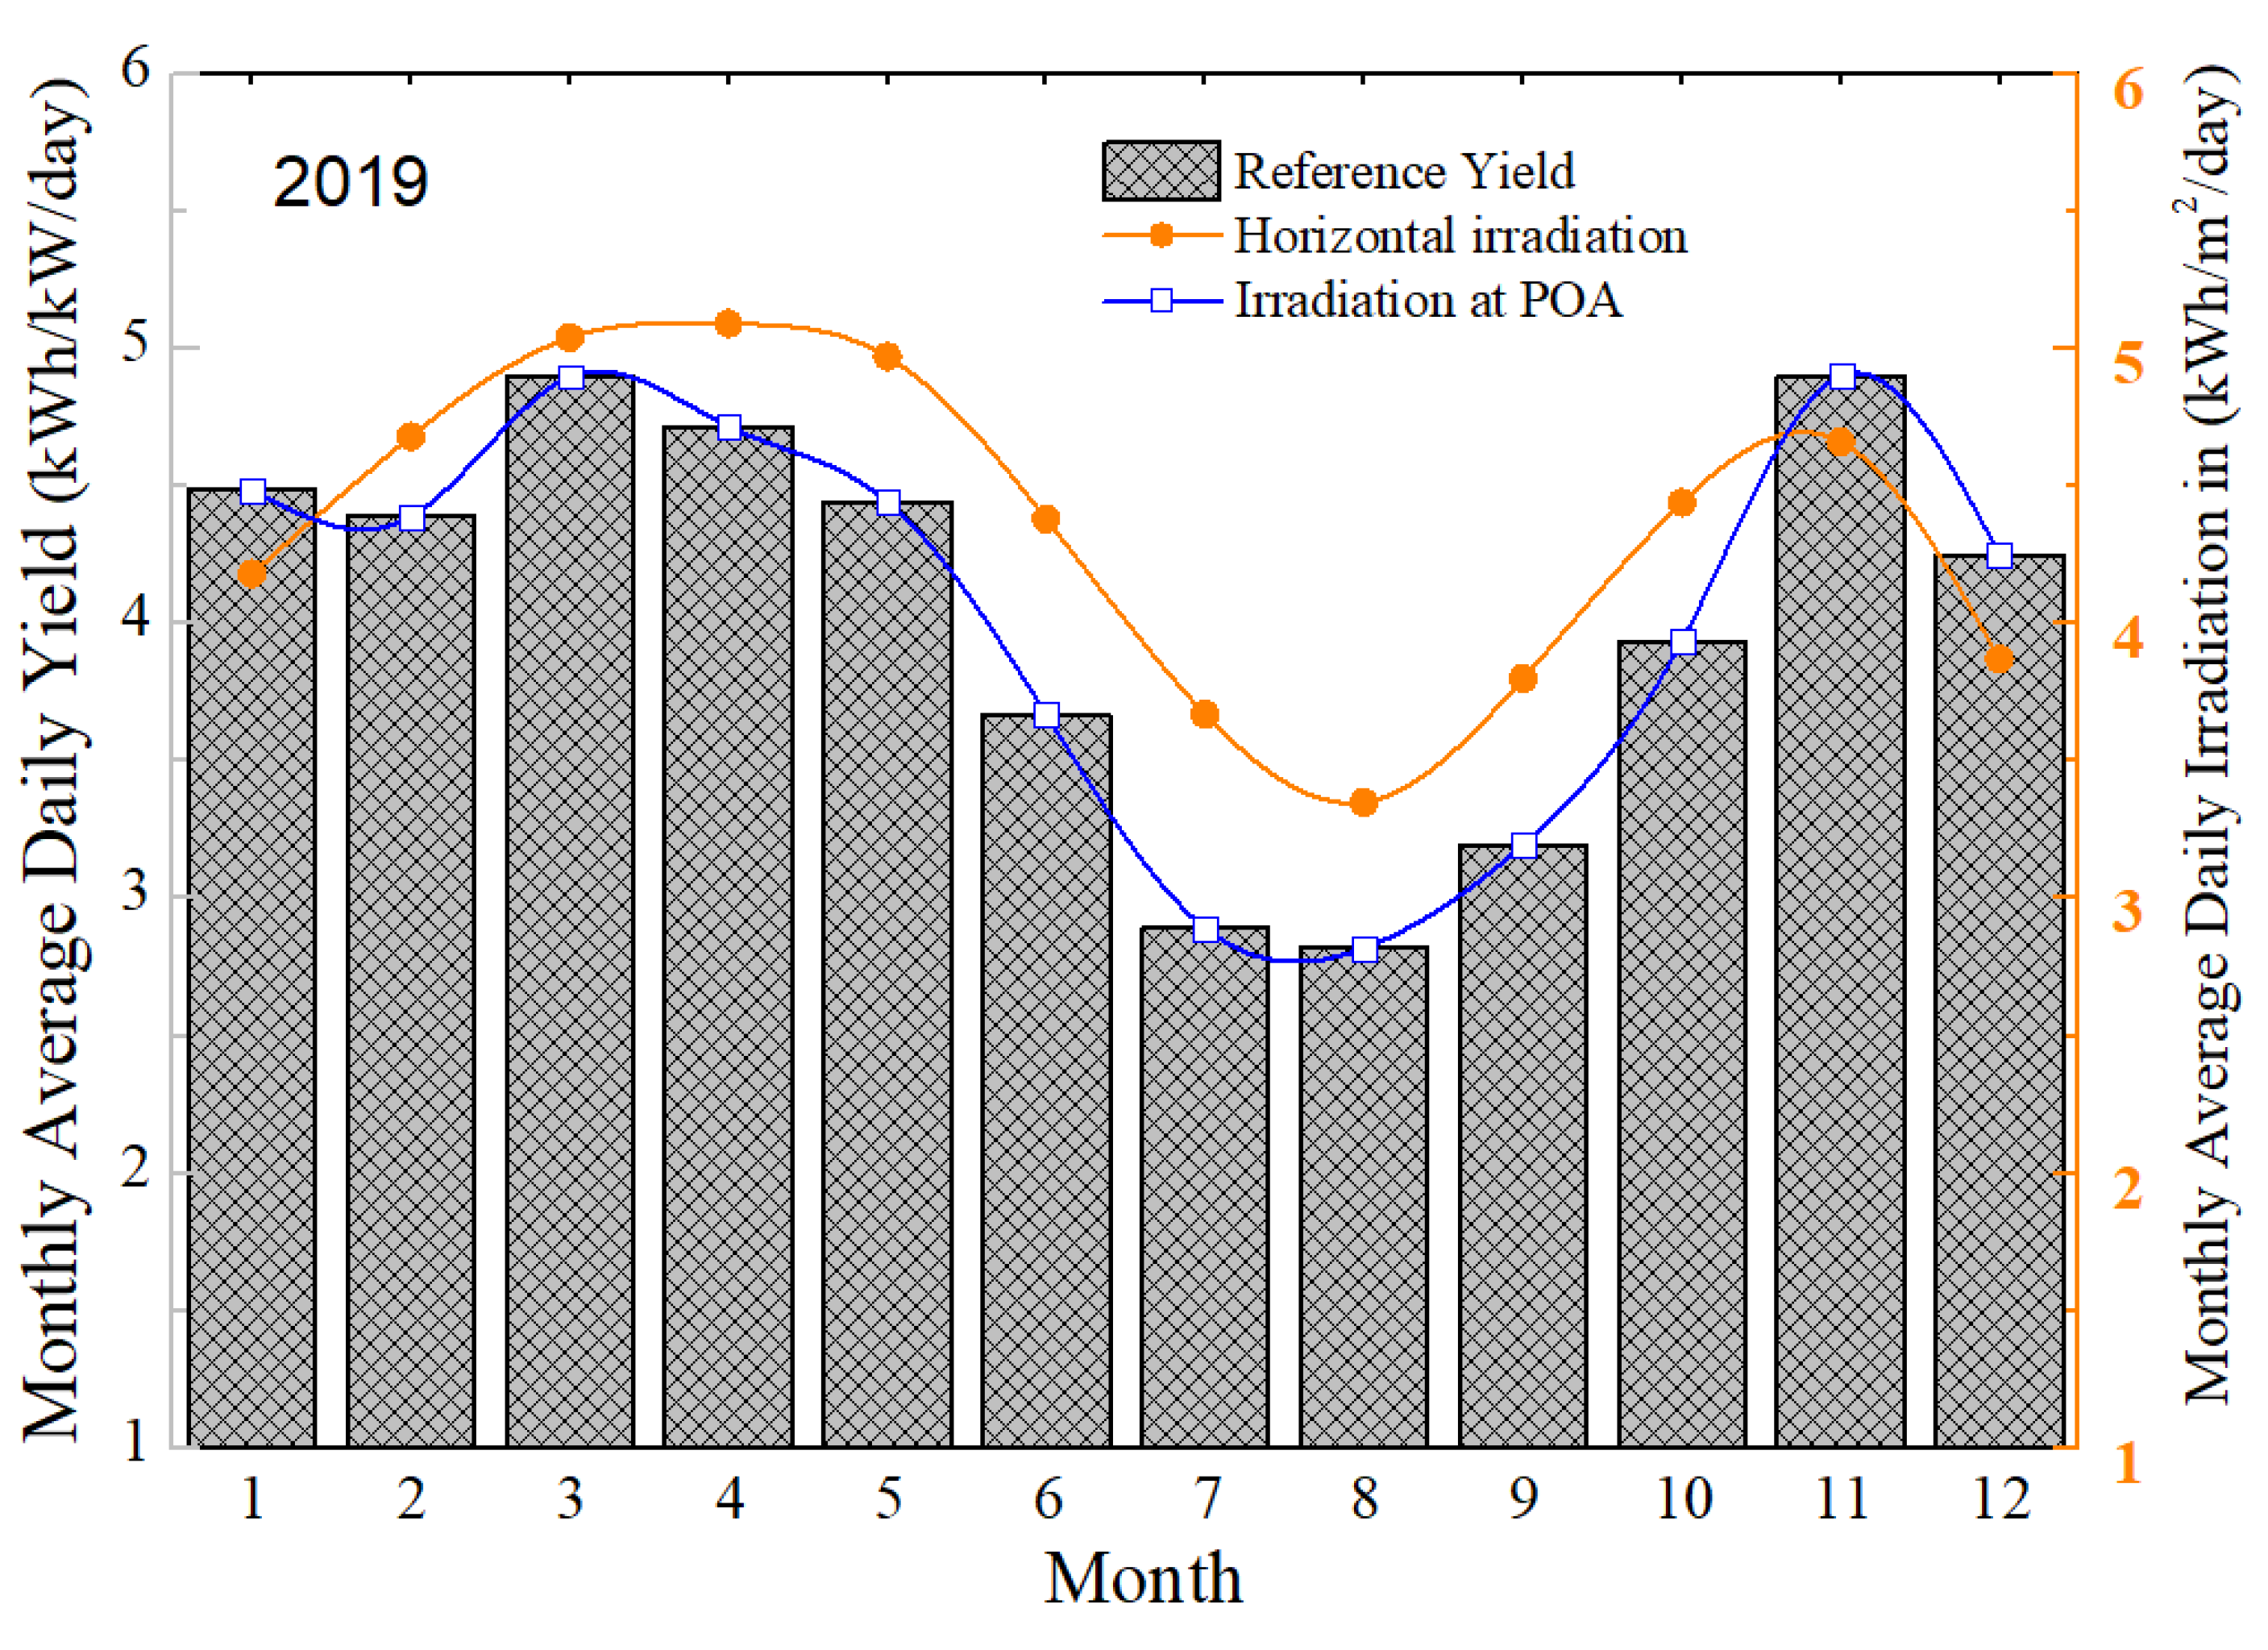
Figure 9 shows that the highest and lowest monthly average daily reference yields were realized in the months of November (4.90 kWh/kW/day) and August (2.81 kWh/kW/day), respectively. The reference yield represents the number of peak sun hours. It is a function of the location, orientation and inclination of the solar PV array. As a result, the monthly daily average reference yield followed the same trend as the irradiance recorded in-plane as shown in Figure 9. The observed low reference yields in the months of July to September could be attributed to low in-plane solar irradiation.

3.3.4. Array or Module Yield

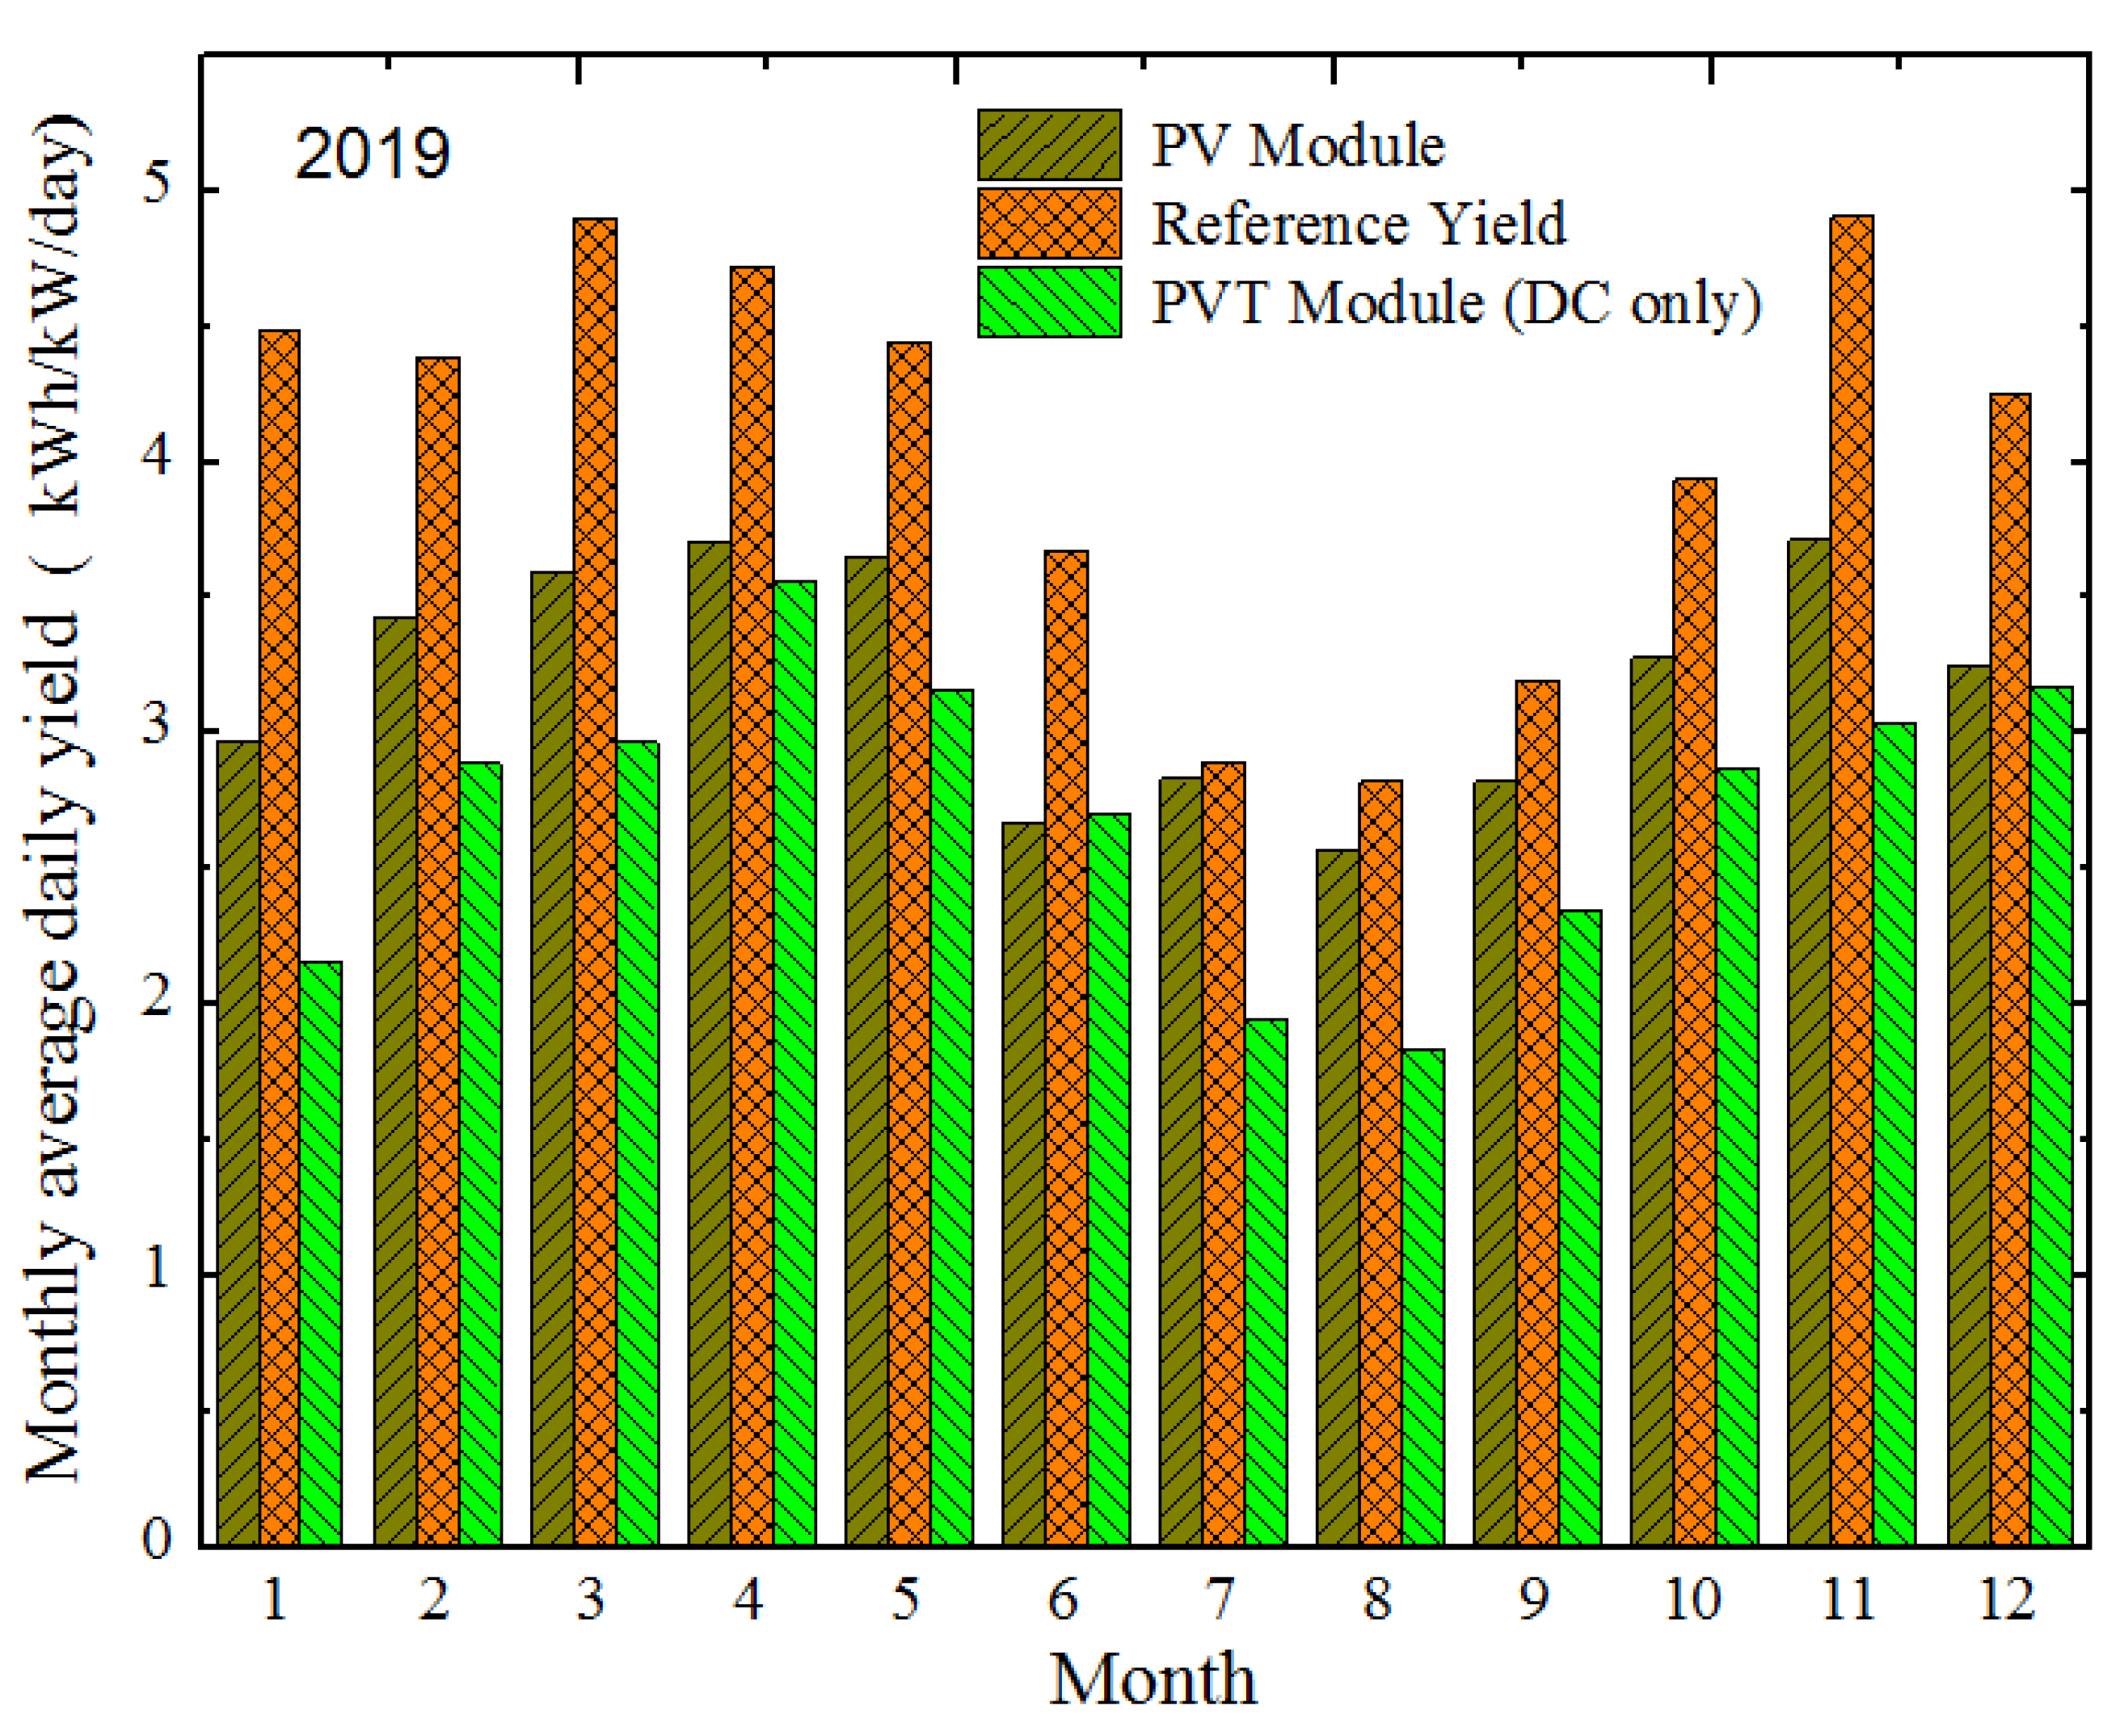
The monthly average daily electrical energy yields for the PV and PVT are presented in Figure 10. The energy yield of the PV varied from a low of 2.5 kWh/kWp/day in the month of August to a high of 3.85 kWh/kWp/day in the months of April and November. In the case of the PVT, its electrical energy yield varied from a low of 1.83 kWh/kWp/day in the same month of August to a high of 3.56 kWh/kWp/day in April. As indicated earlier, the observed lower reference yields in the months of July to September were due to low in-plane solar irradiation. However, during the same period, the PV yields increased compared to the reference yield due to lower ambient temperatures on average translating into lower module temperatures (Figure 7a) and improved performance. The yearly daily average electrical energy yields for the period of the study were observed to be 3.21 kWh/kWp/day for the PV module and 2.72 kWh/kWp/day for the PVT module. The variation in monthly energy yield was similar to a pattern in an earlier study [30] in the same environment on assorted model technologies.

3.3.5. Performance Ratio (PR)

As indicated earlier PR shows the overall effect of losses on PV ratings. For this study, the PRs for the PV and PVT were 79.2% and 51.6% respectively. These values were not very different from what were reported in other studies as shown in Table 5. The value of the PR is an important way of identifying problems emanating from system component failures and a good guide for improving system performance.

3.3.6. Capacity Factor (CF)

The annual capacity factors (CF) of 13.35% and 11.30% were recorded for the PV and PVT, respectively. The CFs show the average of fraction of time in a year when the PV system is available to generate energy at its rated power output. Thus, the PV and PVT systems considered in this study can be said to have generated their rated electrical power only in about 48 days and 41 days, respectively.

3.4. Comparison between PV and PVT Installations

Table 6 presents the summary of key electrical parameters for PV and PVT installations. Yearly average daily array yields of 3.21 kWh/kWp/day for the PV module, as against 2.72 kWh/kWp/day for the PVT module, seemed to suggest the PV module outperformed the PVT in electrical energy production. This was consistent with earlier studies [7]. The electrical energy yield from the PV in this study was on average 25.55% higher than what was generated from the PVT. However, with the additional incentive of thermal energy harvest, the PVT provided a better utilization of solar energy resources than the ordinary PV. Due to the continuous extraction of heat from the modules, the PVT module generally operated at lower module temperatures than the PV module. This was however contradicted by Fuentes et al. [7] who attributed lower electrical performance of PVT to higher module temperatures compared to the PV module. Despite this, the thermal gains of the PVT made it better than PV in terms of total energy output per unit area. The monthly mean efficiency variations of the PVT module in this study also showed that, based on both electrical and thermal energy outputs, its overall efficiency could reach 56.34%, which is significantly higher than the maximum monthly mean value of 12.7% for the PV module. This meant that, in terms of physical installation and space, the PVT gave a better energy output per unit area than the PV. Hence, for better space utilization per energy output, the PVT was a better alternative than the PV. For off-grid rural settlements, the PVT could come in handy in the provision of both electricity and heating. Additionally, this could be very useful in clinics, schools, and for camping.

4. Conclusions

In this paper, a comparative performance valuation was conducted on water-based PVT and PV modules made of mc-Si cell technology in a dynamic environment for 2019.
  • The highest recorded instantaneous module temperatures were 70.6 °C and 60.5 °C for the PV module and PVT module, respectively, recorded in October. On the average, the PV module temperature remained relatively higher than that of PVT by 1.3% to 6.9%.
  • The annual total energy output for the PV module was 194.79 kWh/m2 while that of the PVT for electrical and thermal outputs was 149.92 kWh/m2 and 1087.79 kWh/m2, respectively.
  • The annual daily mean electrical energy yield for the PV and PVT were 3.21 kWh/kWp/day and 2.72 kWh/kWp/day, respectively.
  • The annual performance ratios based on only electrical energy for the PV and PVT were 79.2% and 51.6%, respectively, whereas their capacity factors were, respectively, 13.35% and 11.3%.
  • The monthly average electrical efficiency values for PV and PVT were 11.6–12.7% and 9.9–11.5% respectively. The thermal efficiency of the PVT had a wider variation from 29.44% to 44.84%. There is however the need to improve the thermal efficiency of commercial PVTs.
This study has shown that the flat plate water PVT application is feasible in environments with similar weather conditions to that of Kumasi. It could also be concluded that, based on the general performance of the two technologies, the PV is a better choice for very large-scale grid-connected systems, where the interest is mostly in electrical energy production. However, for domestic applications and small scale grid systems with provision for thermal energy use, the PVT is a better option. The study could not however cover the exergy analysis, economic evaluations and life cycle assessment of the current PVT/PV setup. These should be carried out so that the actual cost of PVT setup, the net cost of produced energy and their environmental impact could be determined. This information could be useful to stakeholders in Ghana in making informed decisions in energy systems.

Author Contributions

Conceptualization, S.A.-G., and M.S.A.; methodology, S.A.-G.; formal analysis, S.A.-G.; resources, R.S. and M.S.A.; data curation, S.A.-G.; writing—original draft preparation, S.A.-G.; writing—review and editing, D.A.Q., E.W.R., R.S., M.S.A.; supervision, D.A.Q., E.W.R., R.S., M.S.A.; project administration, R.S. and M.S.A.; funding acquisition, R.S. and M.S.A. All authors have read and agreed to the published version of the manuscript.

Acknowledgments

We are grateful to the Norwegian aid agency, Norad, for funding this work through the UPERCRETs project, aimed at building capacity in the area of research through the collaboration between KNUST in Ghana and NMBU in Norway.

Conflicts of Interest

The authors declare no conflict of interest.

References

  1. Baljit, S.S.S.; Chan, H.Y.; Sopian, K. Review of building integrated applications of photovoltaic and solar thermal systems. J. Clean. Prod. 2016, 137, 677–689. [Google Scholar] [CrossRef]
  2. Zondag, H. Flat-plate PV-Thermal collectors and systems: A review. Renew. Sustain. Energy Rev. 2008, 12, 891–959. [Google Scholar] [CrossRef] [Green Version]
  3. Chow, T.T. A review on photovoltaic/thermal hybrid solar technology. Appl. Energy 2010, 87, 365–379. [Google Scholar] [CrossRef]
  4. Aste, N.; del Pero, C.; Leonforte, F. Water flat plate PV/thermal collectors: A review. Sol. Energy 2014, 102, 98–115. [Google Scholar] [CrossRef]
  5. Guarracino, I.; Markides, C.N.; Mellor, A.; Ekins-Daukes, N.J. Dynamic coupled thermal and electrical modelling of sheet and tube hybrid photovoltaic/thermal (PVT) collectors. Appl. Therm. Eng. 2016, 101, 778–795. [Google Scholar] [CrossRef] [Green Version]
  6. Good, C. Environmental impact assessment of hybrid photovoltaic-thermal (PV/T) Systems—A review. Renew. Sustain. Energy Rev. 2016, 55, 234–239. [Google Scholar] [CrossRef]
  7. Fuentes, M.; Vivar, M.; de la Casa, J.; Aguilera, J. An experimental comparison between commercial hybrid PV-T and simple PV systems intended for BIPV. Renew. Sustain. Energy Rev. 2018, 93, 110–120. [Google Scholar] [CrossRef]
  8. Guarracino, I.; Freeman, J.; Ramos, A.; Kalogirou, S.A.; Ekins-Daukes, N.J.; Markides, C.N. Systematic testing of hybrid PV-thermal (PVT) solar collectors in steady state and dynamic outdoor conditions. Appl. Energy 2019, 240, 1014–1030. [Google Scholar] [CrossRef]
  9. de Keizer, C.; de Jong, M.; Mendes, T.; Katiyar, M.; Folkerts, W.; Rindt, C.; Zondag, H. Evaluating the thermal and electrical performance of several uncovered PVT collectors with a field test. Energy Procedia 2016, 91, 20–26. [Google Scholar] [CrossRef] [Green Version]
  10. Rejeb, O.; Dhaou, H.; Jemni, A. A numerical investigation of a photovoltaic thermal (PV/T) collector. Renew. Energy 2015, 77, 43–50. [Google Scholar] [CrossRef]
  11. Dupeyrat, P.; Ménézo, C.; Rommel, M.; Henning, H.M. Efficient single glazed flat plate photovoltaic-thermal hybrid collector for domestic hot water system. Sol. Energy 2011, 85, 1457–1468. [Google Scholar] [CrossRef]
  12. Fudholi, A.; Sopian, K.; Yazdi, M.H.; Ruslan, M.H.; Ibrahim, A.; Kazem, H.A. Performance analysis of photovoltaic thermal (PVT) water collectors. Energy Convers. Manag. 2014, 78, 641–651. [Google Scholar] [CrossRef]
  13. Zhang, X.; Zhao, X.; Smith, S.; Xu, J.; Yu, X. Review of R&D progress and practical application of the solar photovoltaic/thermal (PV/T) technologies. Renew. Sustain. Energy Rev. 2012, 16, 599–617. [Google Scholar]
  14. Huang, B.J.; Lin, T.H.; Hung, W.C.; Sun, F.S. Performance evaluation of solar photovoltaic/thermal systems. Sol. Energy 2001, 70, 443–448. [Google Scholar] [CrossRef]
  15. Chow, T.T.; Ji, J.; He, W. Photovoltaic–thermal collector system for domestic application. J. Sol. Energy Eng. 2007, 129, 205–209. [Google Scholar] [CrossRef]
  16. He, W.; Chow, T.T.; Ji, J.; Lu, J.P.; Pei, G.; Chan, L.S. Hybrid photovoltaic and thermal solar-collector designed for natural circulation of water. Appl. Energy 2006, 83, 199–210. [Google Scholar] [CrossRef]
  17. Ji, J.; Lu, J.P.; Chow, T.T.; He, W.; Pei, G. A sensitivity study of a hybrid photovoltaic/thermal water-heating system with natural circulation. Appl. Energy 2007, 84, 222–237. [Google Scholar] [CrossRef]
  18. IEA-Africa Energy Outlook 2019-World Energy Outlook Special Report. Available online: https://www.ncran.gc.ca/maps-tools-publications/tools/data-analysis-software-modelling/retscreen/7465 (accessed on 22 April 2020).
  19. Hazami, M.; Ali Riahi, A.; Mehdaoui, F.; Omeima Nouicer, O.; Farhat, A. Energetic and exergetic performances analysis of a PV/T (photovoltaic thermal) solar system tested and simulated under to Tunisian (North Africa) climatic conditions. Energy 2016, 10715, 78–94. [Google Scholar] [CrossRef]
  20. Abdulkadir, M.; Muhammad, S.B. Design and construction of a thermosiphonic solar photovoltaic: Thermal water heating system for sustainable development in temperate regions of Africa. J. Altern. Energy Sources Technol. 2017, 8, 1–8. [Google Scholar]
  21. Siecker, J.; Kusakan, K.; Numbi, B.P. Optimal switching control of PV/T systems with energy storage using forced water circulation: Case of South Africa. J. Energy Storage 2018, 20, 264–278. [Google Scholar] [CrossRef]
  22. Oyieke, A.Y.A.; Inambao, F.L. Performance characterisation of a hybrid flat-plate vacuum insulated photovoltaic/thermal solar power module in subtropical climate. Int. J. Photoenergy 2016, 2, 1–15. [Google Scholar] [CrossRef]
  23. Apuko, O.A.Y.; Inambao, F.L. Simulation and performance evaluation of a vacuum insulated hybrid solar photovoltaic/thermal power module for domestic applications in South Africa. TMC Acad. J. 2015, 9, 1–19. [Google Scholar]
  24. Sawadogo, W.; Abiodun, B.J.; Okogbue, E.C. Impacts of global warming on photovoltaic power generation over West Africa. Renew. Energy 2020, 151, 263–277. [Google Scholar] [CrossRef]
  25. Meunier, S.; Heinrich, M.; Quéval, L.; Cherni, J.A.; Vido, L.; Darga, A.; Dessante, P.; Multon, B.; Kitanidis, P.K.; Marchand, C. A validated model of a photovoltaic water pumping system for off-grid rural communities. Appl. Energy 2019, 241, 580–591. [Google Scholar] [CrossRef] [Green Version]
  26. Akinyele, D.; Babatunde, O.; Monyei, C.; Olatomiwa, L.; Okediji, A.; Ighravwe, D.; Abiodun, O.; Onasanya, M.; Temikotan, K. Possibility of solar thermal power generation technologies in Nigeria: Challenges and policy directions. Renew. Energy Focus 2019, 29, 24–41. [Google Scholar] [CrossRef]
  27. Nyarko, F.K.A.; Takyi, G.; Amalu, E.H.; Adaramola, M.S. Generating temperature cycle profile from in-situ climatic condition for accurate prediction of thermo-mechanical degradation of c-Si photovoltaic module. Eng. Sci. Technol. Int. J. 2019, 22, 502–514. [Google Scholar] [CrossRef]
  28. Quansah, D.A.; Adaramola, M.S. Assessment of early degradation and performance loss in five co-located solar photovoltaic module technologies installed in Ghana using performance ratio time-series regression. Renew. Energy 2019, 131, 900–910. [Google Scholar] [CrossRef]
  29. Quansah, D.A.; Adaramola, M.S. Ageing and degradation in solar photovoltaic modules installed in northern Ghana. Sol. Energy 2018, 173, 834–847. [Google Scholar] [CrossRef]
  30. Quansah, D.A.; Muyiwa, S.A.; Appiah, G.K.; Edwin, I.A. Performance analysis of different grid-connected solar photovoltaic (PV) system technologies with combined capacity of 20 kW located in humid tropical climate. Int. J. Hydrog. Energy 2017, 42, 4626–4635. [Google Scholar] [CrossRef]
  31. Enongene, K.E.; Abanda, F.H.; Otene, I.J.J.; Obi, S.I.; Okafor, C. The potential of solar photovoltaic systems for residential homes in Lagos city of Nigeria. J. Environ. Manag. 2019, 24415, 247–256. [Google Scholar] [CrossRef]
  32. Caton, P. Design of rural photovoltaic water pumping systems and the potential of manual array tracking for a West-African village. Sol. Energy Vol. 2014, 103, 288–302. [Google Scholar] [CrossRef]
  33. Ndiaye, A.; Kébé, C.M.F.; Charki, A.; Ndiaye, P.A.; Sambou, V.; Kobi, A. Degradation evaluation of crystalline-silicon photovoltaic modules after a few operation years in a tropical environment. Sol. Energy Vol. 2014, 103, 70–77. [Google Scholar] [CrossRef]
  34. Tossa, A.K.; Soro, Y.M.; Azoumah, Y.; Yamegueu, D. A new approach to estimate the performance and energy productivity of photovoltaic modules in real operating conditions. Sol. Energy Vol. 2014, 110, 543–560. [Google Scholar] [CrossRef]
  35. Dajuma, A.; Yahaya, S.; Touré, S.; Diedhiou, A.; Adamou, R.; Konaré, A.; Sido, M.; Golba, M. Sensitivity of solar photovoltaic panel efficiency to weather and dust over West Africa: Comparative experimental study between Niamey (Niger) and Abidjan (Côte d’Ivoire). Comput. Water Energy Environ. Eng. 2016, 5, 123–147. [Google Scholar] [CrossRef] [Green Version]
  36. Yushchenko, A.; de Bono, A.; Chatenoux, B.; Patel, M.K.; Ray, M. GIS-based assessment of photovoltaic (PV) and concentrated solar power (CSP) generation potential in West Africa. Renew. Sustain. Energy Rev. 2018, 81, 2088–2103. [Google Scholar] [CrossRef]
  37. Simo-Tagne, M.; Ndukwu, M.C.; Zoulalian, A.; Bennamoun, L.; Kifani-Sahban, F.; Rogaume, Y. Numerical analysis and validation of a natural convection mix-mode solar dryer for drying red chilli under variable conditions. Renew. Energy 2020, 151, 659–673. [Google Scholar] [CrossRef]
  38. Ogunmodimu, O.; Okoroigwe, E.C. Solar thermal electricity in Nigeria: Prospects and challenges. Energy Policy 2019, 128, 440–448. [Google Scholar] [CrossRef]
  39. Seshie, Y.M.; N’Tsoukpoe, K.E.; Neveu, P.; Coulibaly, Y.; Azoumah, Y.K. Small scale concentrating solar plants for rural electrification. Renew. Sustain. Energy Rev. 2018, 90, 195–209. [Google Scholar] [CrossRef]
  40. Ayompe, L.M.; Duffy, A.; McCormack, S.J.; Conlon, M. Measured performance of a 1.72 kW rooftop grid connected photovoltaic system in Ireland. Energy Convers. Manag. 2011, 52, 816–825. [Google Scholar] [CrossRef] [Green Version]
  41. Adaramola, M.S.; Vågnes, E.E.T. Preliminary assessment of a small-scale rooftop PV-grid tied in Norwegian climatic conditions. Energy Convers. Manag. 2015, 90, 458–465. [Google Scholar] [CrossRef]
  42. Homer Pro Microgrid Analysis Tool-Version 3.13.6. Available online: www.homerenergy.com (accessed on 10 February 2020).
  43. Soubdhan, T.; Emilion, R.; Calif, R. Classification of daily solar radiation distributions using a mixture of Drichlet distributions. Sol. Energy 2009, 83, 1056–1063. [Google Scholar] [CrossRef] [Green Version]
  44. RETScreen Expert- Version 6.0.7.55. Available online: https://www.ncran.gc.ca/maps-tools-publications/tools/data-analysis-software-modelling/retscreen/7465 (accessed on 13 February 2020).
  45. Benatiallah, A.; Mostefaou, R.; Bradja, K. Performance of photovoltaic solar system in Algeria. Desalination 2007, 209, 39–42. [Google Scholar] [CrossRef]
  46. Mondol, J.D.; Yohanis, Y.; Smyth, M.; Norton, B. Long term performance analysis of a grid connected photovoltaic system in Northern Ireland. Energy Convers. Manag. 2006, 47, 2925–2947. [Google Scholar] [CrossRef]
  47. Miguel, A.D.; Bilbao, J.; Cazorro, J.R.S.; Martin, C. Performance analysis of a grid-connected PV system in a rural site in the northwest of Spain. In Proceedings of the World Renewable Energy Congress VII (WREC 2002), Cologne, Germany, 29 June–5 July 2002; Available online: https://www.researchgate.net/profile/Argimiro_De_Miguel/publication/258221437_Performance_analysis_of_a_grid-connected_PV_system_in_a_rural_site_in_the_Northwest_of_Spain/links/598987884585156058588c9b/Performance-analysis-of-a-grid-connected-PV-system-in-a-rural-site-in-the-Northwest-of-Spain.pdf (accessed on 13 February 2020).
  48. Humada, A.M.; Hojabri, M.; Hamada, H.M.; Samsuri, F.B.; Ahmed, M.N. Performance evaluation of two PV technologies (c-Si and CIS) for building integrated photovoltaic based on tropical climate condition: A case study in Malaysia. Energy Build. 2016, 119, 233–241. [Google Scholar] [CrossRef] [Green Version]
  49. Ghiani, E.; Pilo, F.; Cossu, S. Evaluation of photovoltaic installations performances in Sardinia. Energy Convers. Manag. 2013, 76, 1134–1142. [Google Scholar] [CrossRef]
  50. Tripathia, B.; Yadav, P.; Rathod, S.; Kumar, M. Performance analysis and comparison of two silicon material based photovoltaic technologies under actual climatic conditions in Western India. Energy Convers. Manag. 2014, 80, 97–102. [Google Scholar] [CrossRef]
  51. Tan, P.H.; Gan, C.K.; Baharin, K.A. Techno-economic analysis of rooftop PV system in UTeM Malaysia. In Proceedings of the IEEE Xplore 2014, 3rd IET International Conference on Clean Energy and Technology (CEAT), Kuching, Malaysia, 24–26 November 2014. [Google Scholar]
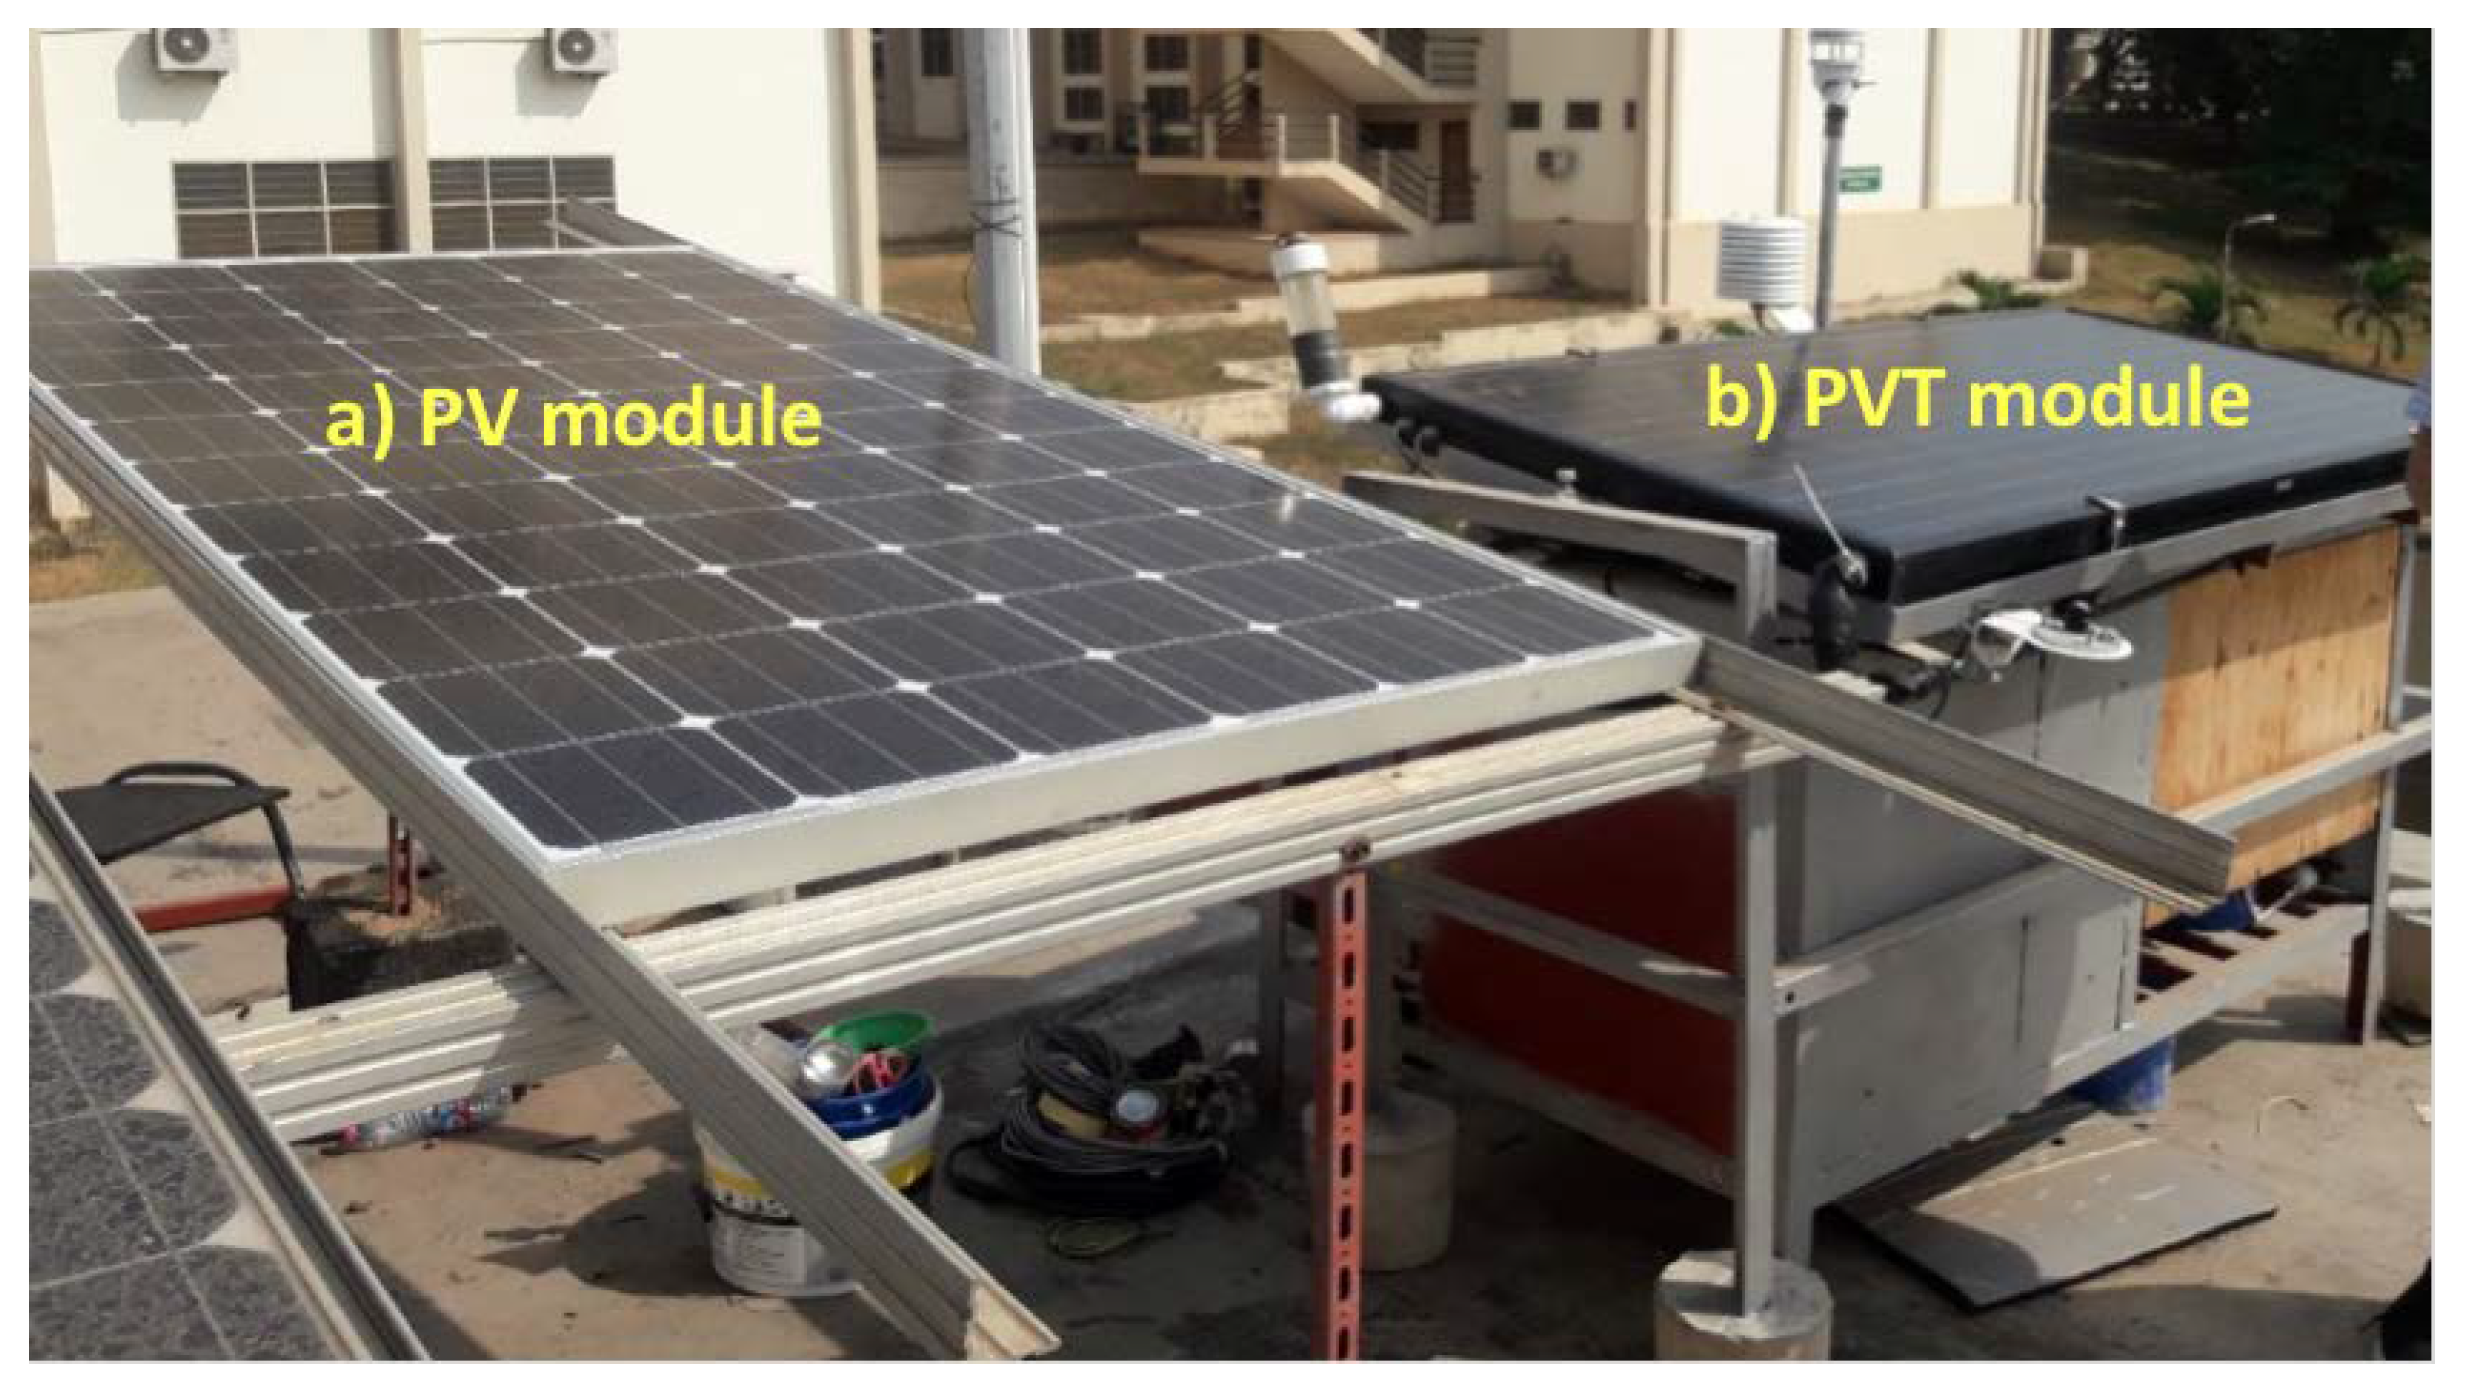
Figure 1. (a) Conventional solar photovoltaic (PV) installation; (b) hybrid photovoltaic-thermal (PVT) installation.
Energies 13 02701 g001
Figure 2. Photovoltaic-thermal (PVT) showing: (a) south facing surface and cooling fans for radiator (left); (b) north facing face with water circulation compartment and electrical/logging circuitry compartment (right).
Energies 13 02701 g002
Figure 3. Schematic of the experimental setup.
Energies 13 02701 g003
Figure 4. Monthly variation of ambient temperature in 2019.
Energies 13 02701 g004
Figure 5. Measured monthly in-plane solar irradiation with clearness index from Homer SW.
Energies 13 02701 g005
Figure 6. Monthly average daily wind speeds at the experimental site.
Energies 13 02701 g006
Figure 7. PVT and PV modules temperature profiles at daytime showing variations in: (a) monthly average daily temperatures for 2019; (b) daily temperature variation on a stable sunny day; (c) daily temperature variations on an unstable sunny day.
Energies 13 02701 g007aEnergies 13 02701 g007b
Figure 8. The energy outputs of the PV and PVT showing: (a) monthly average daily electrical energy outputs; (b) net annual energy yields.
Energies 13 02701 g008
Figure 9. Reference yield compared to monthly average in-plane and horizontal daily irradiation data extracted from RETscreen Expert Viewer Software (Version 6.0.7.55, CanmetENERGY, Varennes, QC, Canada) [44].
Energies 13 02701 g009
Figure 10. Array yield for PV and PVT modules compared with reference yield.
Energies 13 02701 g010
Table 1. Technical specification of PVT and PV collectors.
ParametersPVTPV
Dimension (mm3)1601 × 828 × 901640 × 992 × 45
Aperture area (m2)1.3261.474
Absorber area (m2)1.194-
Weight (kg)24.418.3
Nominal electrical power (W)200270
Thermal power (W)630-
Nominal current Imp (A)5.438.6
Short circuit current Isc (A)5.679.31
Nominal voltage Vmp (V)37.8931.4
Open circuit voltage Voc (V)45.2638.3
Module electrical efficiency (%)15.0816.6
Zero loss collector efficiency (%)0.48-
Temperature coefficient of Isc (%/°C)0.060.05
Temperature coefficient of Voc (%/°C)−0.34−0.34
Temperature coefficient of Pmax (%/°C)−0.45−0.45
Nominal operating cell temperature NOCT (°C)45 ± 245 ± 2
Absorber Surface (PV)mc-Simc-Si
Absorber surface (T)Copper-
Table 2. Test Variables and Sensors.
VariableInstrumentationMeasurement AccuracyResolution
Flow Gauge (L/min)Mechanical spring flow meternot available0.2
Temperature (°C)109 Temperature Probe (PT100)±0.2 °C (for 0–70 °C)0.01
Solar irradiance(W/m2)Apogee SP-421 pyranometer±1%<0.001
Wind speed (m/s)Decagon DL-2 wind sensor3%0.01
Air temperature (°C)CS215 Temp/RH sensor±0.4 °C (5–40 °C)0.01
Relative humidity (%)CS215 Temp/RH sensor±4% (0–100%) at 25 °C0.03
Flow rate (L/min)Mechanical valves set.Not specified0.2
Current (A)Bim205 smart charger w/MPPTNot specified0.1
Voltage (V)Bim205 smart charger w/MPPTNot specified0.1
Table 3. A summary of weather data and module temperatures.
MonthAmbient Conditions Average   Daily   T c e l l
H p   kWh / m 2 / day T a m b   ° C V m/sPV °CPVT °C
January4.4930.570.5642.2640.21
February4.3930.860.6042.8740.69
March4.9030.940.7344.2241.19
April4.7230.670.7543.6040.98
May4.4429.880.7541.6539.33
June3.6728.080.8037.8736.38
July2.9026.790.8134.6934.01
August2.8226.620.9334.6234.17
September3.2027.310.7437.1635.97
October3.9428.000.7840.0838.08
November4.9029.910.7143.6540.80
December4.2530.100.7142.5839.74
Table 4. Comparison of present study with other water based PVT efficiencies.
Reference η P V   ( % ) η T H   ( % ) η P V T   ( % )
Fuentes et al. [7]16.1–19.150–70.466.1–89.5
Fudholi et al. [12]11.9–12.441.1–4853.6–66.8
Fudholi et al. [12]12.2–12.746.4–54.658.6–66.8
Zhang et al. [13]9.550.059.5
Huang et al. [14]9.038.047.0
Chow et al. [15]11.051.062.0
He et al. [16]9.840.049.87
Ji et al. [17]10.1545.055.15
Present study9.9–11.529.44–44.8439.34–56.34
Table 5. Performance parameter for mc-Si modules in the literature.
LocationPR (%)Reference
Dublin, Ireland81.50[40]
Kumasi, Ghana67.90[30]
Algeria80.70[45]
Ballymena, Ireland60-62[46]
Castile and Leon, Spain69.80[47]
Malaysia59.90–79.14[48]
Sardinia, Italy83.20–87.3[49]
Gujarat, India57.10–93.14[50]
Malaysia77.85[51]
Kumasi, Ghana79.18Present study
Kumasi, Ghana (PVT) 151.60Present study
1 This is only in reference to the electrical component of the PVT.
Table 6. A summary of PV and PVT (electrical properties) performance.
ParameterPVPVT
Rated Power of PV (Wp)270200
Annual energy output of PV (kWh/year)315.73198.19
Annual average daily energy output of PV (Wh/day)865.02542.97
Yearly total irradiance (kW/m2)14,766.6614,766.66
Yearly average daily irradiance (kWh/m2/day)4.054.05
Daily Reference Yield (kWh/kW/day)4.054.05
Daily Module Yield (kWh/kWp/day)3.202.09
Performance Ratio (%)79.1851.60
Annual Capacity factor (%)13.3411.30
Efficiency (averaged) (%)12.1410.80