1. Introduction
Solar energy is a freely available source that can either be harvested for electricity or converted into thermal energy for heating purposes as well as for domestic hot water applications. The problem with thermal energy conversion is that the availability of solar energy is mismatched with demand. In winter thermal energy demand is high during the night and early morning, with the maximum solar energy is available around midday. In the summer solar energy availability is significantly high, but demand is minimum. Still, solar energy is used for domestic hot water (DHW) with the aid of solar collectors and thermosiphons, with a high percentage of application in sunny countries, both in summer and winter.
A related noteworthy fact is that the maximum efficiency of a photovoltaic/thermal (PVT) system is at about 63% (glazed and water-based; it can be higher for other fluids) [
1], solar flat plate collectors (FPC) at 80% (water-flow based) [
2], while that of photovoltaics (PV) for electricity production at 28% (crystalline-cells based; can be higher for other cells) [
3], depending of course on the climatic, operating and design parameters. It would be, therefore, natural and sensible to use solar energy for thermal purposes. This raises the issue of utilizing the solar energy in buildings by storing the thermal energy when available and releasing it on demand when needed.
Thermal storage can be described by the storage concept and the storage mechanism [
4]. The storage concept is divided into active and passive, where in an active method there is use of forced convection, and in a passive method gravitational forces are utilized to circulate the fluid in the system [
5]. Storage mechanisms on the other hand can be sensible, latent and chemical systems. The chemical process uses a chemical reaction where the latent uses phase changing materials (PCMs). Although the chemical and the latent systems have proven to be the more advantageous mechanisms [
6], the sensible mechanism is the most commonly used, whereby heat is stored as internal energy in the medium, which is either a liquid or a solid [
5]. Water, rocks and soil are the most common materials, but also concrete has been tested for short term sensible storage [
7]. Concrete, brick and gypsum have been studied as sensible thermal storage building materials, with conventional 20 cm concrete shown to be the most suitable one [
8].
For the selection of the sensible heat storage medium (including concrete), Hariri and Ward [
5,
9] have provided principal characteristics limiting the choices. to the volumetric heat capacity, the system operation temperatures, the medium transfer properties (such as toxicity, corrosiveness, etc.), the stratification of the storage unit, the charging and discharging power, and the thermal loss control. Additionally, the choice of the storage medium lies on the available space, where at residential applications there is usually a shortage. Sensible TES systems, in order to avoid the heat losses when fully charged, are fully insulated and often placed underground. Ucar and Inalli [
10] have performed a comparison between the cylindrical tanks placed uninsulated underground and insulated and uninsulated above ground, with results indicating that the best performance is provided by the underground placed storage tank. Methodologies for performance evaluation and analysis of sensible TES systems (always including concrete) have been presented by several authors [
11,
12,
13,
14], where the exergy analysis seems to have a higher potential among other methods [
14].
The idea of incorporating PCM materials in building materials in order to achieve higher thermal properties for thermal energy storage has been proposed in the literature. The feasibility of such a system is extensively reviewed in [
15,
16]. Although promising as a thermal storage unit, PCM exhibits weaknesses when it is used as a building foundation, with regard to cost (higher), strength (lower) and fire resistance (lower) compared to reinforced concrete.
Good examples of solar energy storage systems have been presented in [
17,
18], where the energy collected by the solar collectors has been stored in a pebble bed. The systems have been applied to a building (large scale, 3320 m
2) in China and the results obtained can be considered as satisfactory, with the temperature of the pebbles increasing during the day (charging stage) and dropping during the night (discharging stage). It should be noted that the pebble bed was preheated days before the heating season.
In the current study the building’s foundation, constructed with reinforced concrete, is used and studied as passive heating with the aid of solar collectors. The study is an extension of the previously proposed system, by Aresti el al. [
19], where a preliminary investigation of passive floor heating from solar collectors was performed.
There are several components/elements that act as thermal energy storage (TES) or seasonal TES (STES) units, such as, water tanks, aquifers, ponds, rock or gavel beds, ground, oil or salt solutions and solid blocks from different materials (concrete). Conventionally, sensible heat storage is used, and water is assumed to be the storage of choice for years to come [
6].
A review on sensible heat storage materials can be found in [
20], where it is stated that low cost, availability and good mechanical and thermal properties are among the advantages of using concrete as a TES unit. The authors also noted that the compressive strength decreases by about 20% when the temperature is at 400 °C. Thermal properties and costs for different sensible TES solid materials have been compared in [
21]. The authors present concrete as the lowest cost material in terms of USD per kg and USD per kWh
T (namely, (0.05 USD/kg and 1 USD/kWh
T). Also, a large quantity (300) of engineering materials have been compared for sensible heat storage in [
22], with the authors suggesting that for long term storage the materials require to have high heat capacity per unit volume and thermal conductivity above 1 W∙m
−1∙K
−1. Concrete is included in the selection of materials, the authors identified as with high energy density.
Concrete can be considered as a heterogeneous material with several factors such as water cement, voids and aggregation, affecting its thermal properties [
23,
24]. Different types of concrete with their thermal properties have been presented in [
24]. The thermal properties and their accurate estimation are, of course, of great importance as they contribute to the energy calculations and energy rating of a building. For shallow foundations, such as residential buildings in Cyprus, concrete is reinforced with horizontal two-way steel bars. The reinforced concrete compared to standard concrete has a greater thermal conductivity and density, due to the enhancement with steel, but lower specific heat at constant pressure. Such and similar cases have been studied in [
25], where the thermal conductivity presented varies between 1.4–1.6 W∙m
−1∙K
−1.
Similar to a shell and tube type heat exchangers [
26], for solid media storage, concrete would act as the shell, where the fluid passes through the tubes. A piping network is placed inside the storage medium and is used as an exchanger for heat transfer to and from the building’s foundation.
Dwellings in Cyprus have foundations made of reinforced concrete, which is hence an obvious choice for TES, with the only additional cost being that of piping and labor. Although the reinforced concrete foundation is already available, the piping installation can only be installed in new dwellings and this system cannot be retrofitted. Since the concrete foundation block provides structural support and strength to the dwellings, it cannot be examined only as a TES unit, but as a hybrid system as well. Such effects on the concrete properties as due to temperature changes have been presented in [
27]. The authors have reported a reduction in the concrete’s strength with an increase of temperature, where cracks become visible with temperatures above 600 °C and a complete decomposition occurs at temperatures of 1200 °C. The use of high temperature concrete modules as TES unit of sensible heat in solar power plans has been examined in [
28] and guidelines have been presented. The authors have specified a maximum operating temperature of 300 °C. As stated in [
29], the first effects on the concrete will occur just above 100 °C due to the evaporation of the moisture.
Hence, in order to achieve this concrete hybrid TES structure, it is important to maintain concrete foundation at a temperature lower than 90–100 °C, in order to avoid evaporation and preserve its integrity and strength. As mentioned above such a system is examined here for a typical house in the moderate climate in Cyprus.
The study is performed numerically, with the computational modeling—described in
Section 2—being conducted in two stages. In the first stage the TRNSYS software is used to simulate a south facing building with solar collectors at an optimal slope. The house load is computed in hourly steps for a typical Cypriot house at fixed room temperature, with the solar collectors exposed at the climate conditions of the capital Nicosia, in central Cyprus. Then, in
Section 3, the results from the TRNSYS software are incorporated into the COMSOL Multiphysics software for the further examination of using the building’s concrete foundation as a sensible TES unit.
2. Computational Modeling
The model design and the simulation process were carried out in two stages. The first stage was performed in the TRNSYS software (Thermal Energy System Specialists, LLC, Madison, WI, USA) through two different configurations, while the second stage was performed in the COMSOL Multiphysics software [
30] for a more detailed analysis of the system.
In order to examine the concept under investigation, a typical house in Cyprus was chosen as a building of study. The characteristics of the residential buildings in Cyprus have been presented in a statistical format in [
31]. Out of a sample of 500 residential buildings, the authors have found that the large majority of the houses are between 51–200 m
2, with a mean area of 173 m
2 corresponding to 57 m
2/occupant. It has also been calculated that the primary energy per total area is between 51–150 kWh/m
2. In addition, statistics composed by the Cyprus Ministry of Finance Statistical Service [
32] have shown that in the construction industry the constructed dwellings are mainly houses (in 2016, 1709 houses versus 746 apartments were completed).
Note also that, according to a Renewables Global status report [
33], Cyprus is the world leader in solar water collector per capita, with 541 kW thermal per 1000 inhabitants. As previously reported in [
34], solar water heating systems were installed in more than 93% of houses in 2006.
2.1. Typical Residential Building Loads
The selected residential building modeled here had a rectangular shape with the elongated side facing south and an area of 120 m2. It consisted of a single floor with minimum insulation on the outer wall and some insulation on the roof.
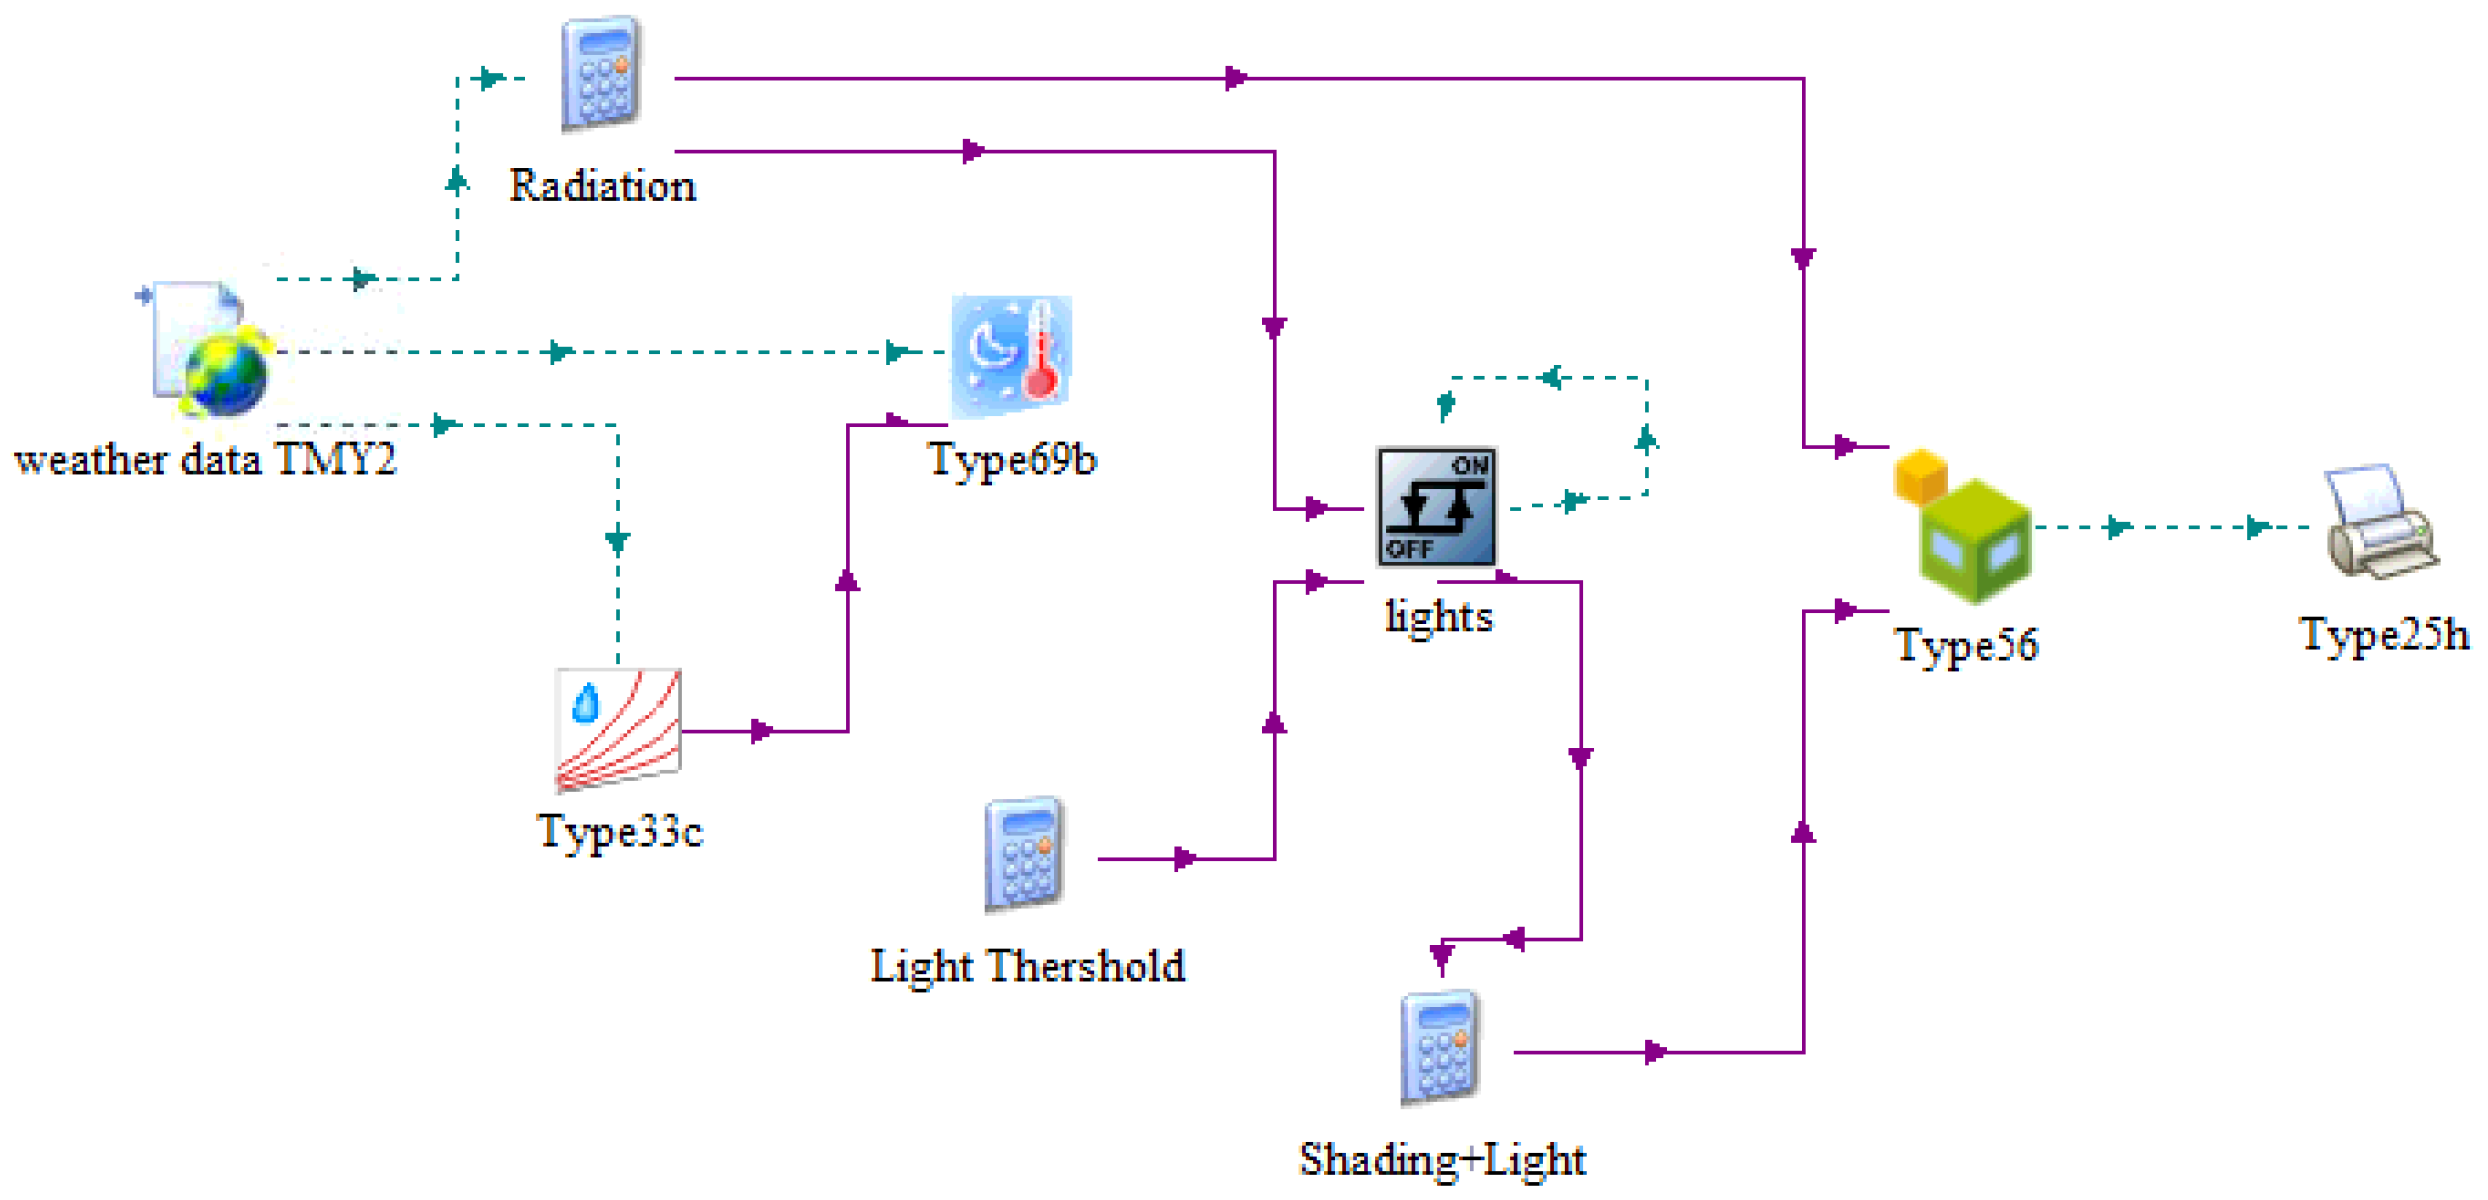
The walls considered during the modeling consisted of the following layers: 0.025 m of plaster and 0.2 m hollow clay brick. The roof consists of a layer of 0.025 m plaster, 0.15 m reinforced concrete with 1% iron and 0.05 m of extruded polystyrene insulation. For the estimation of the building loads the floor was considered to have no heat losses to the ground. The model considered was built on TRNSYS (see
Figure 1), with following types used for the computations:
- i.
Type 109—TMY2 (weather data processing model),
- ii.
Type 33—Psychrometrics,
- iii.
Type 69—Effective sky temperature for long-wave radiation exchange,
- iv.
Type 2—ON/OFF Differential controller,
- v.
Type 65—Online graphical plotter,
- vi.
Type 25—Printer—TRNSYS—supplied units printed to output file,
- vii.
Type 56—Multi-Zone Building.
TRNSYS [
35] is a user interface friendly software used to simulate transient systems and their performance with the aid of integrated types/modules. Manual types can be created with one need to use FORTRAN or C++ languages. The user is responsible to fill the parameters of the types based on the manufacturers specifications and organize the system’s input and output. TRNSYS is usually used for energy systems but can have a wider application, with fast producing analytical results.
The building was set to steady temperatures of 21 °C and 27 °C for heating and cooling, respectively. The building’s energy demand in terms of heating and cooling loads were calculated with one-hour time steps for one year. Additionally, the energy collected through the solar collector system was also calculated during the same time and under the same conditions.
2.2. Solar Collectors Model
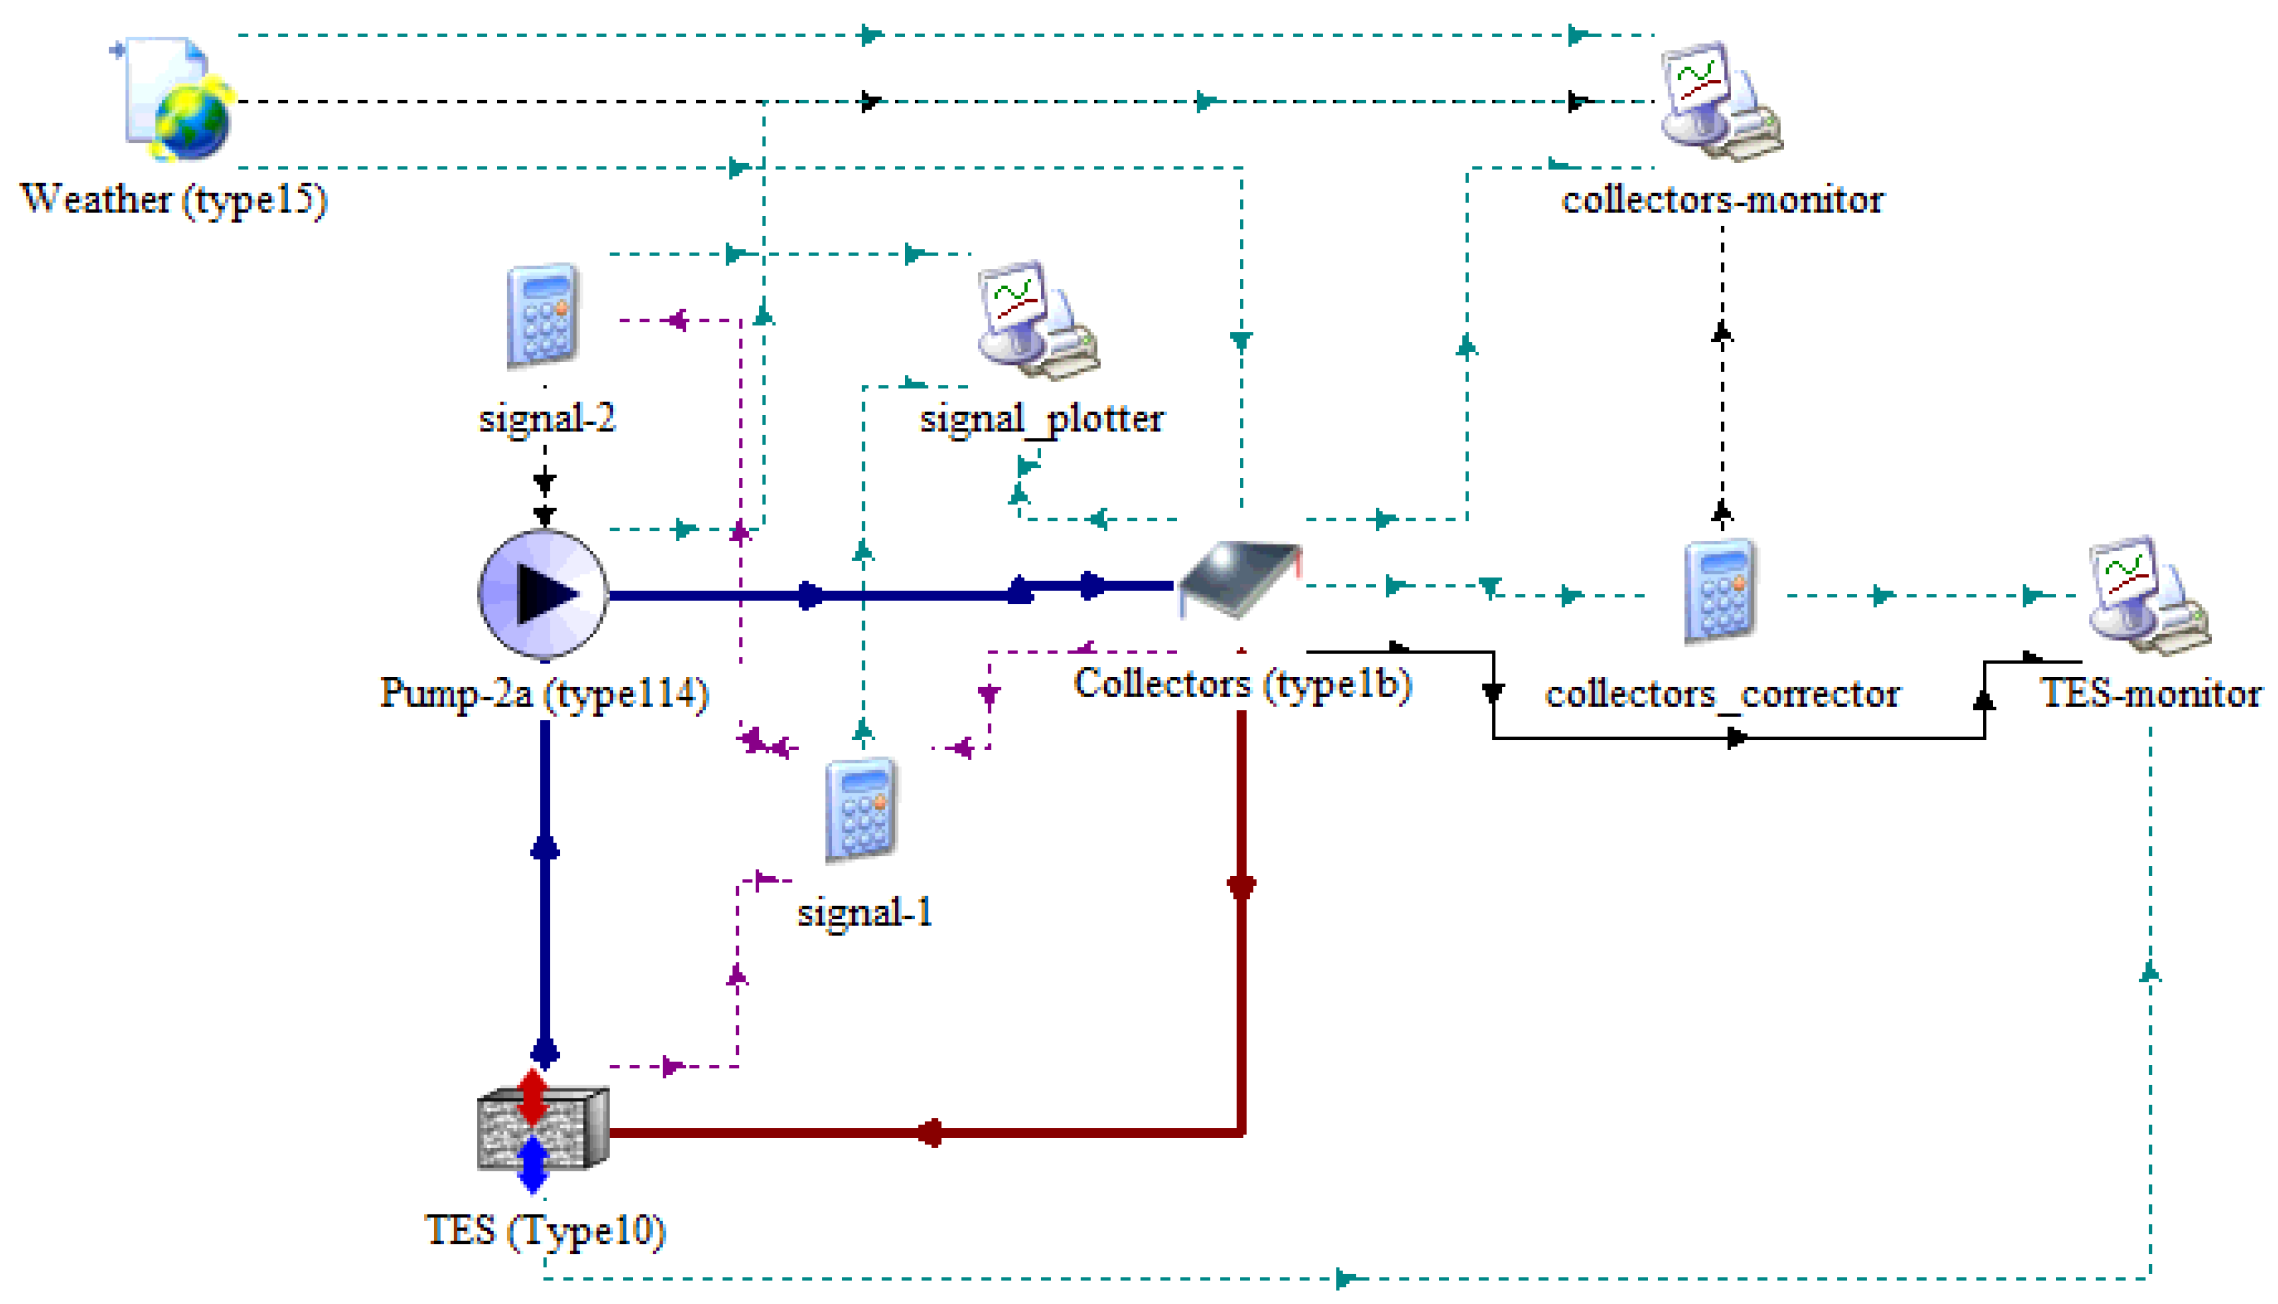
In order to store solar energy, a system, similar to domestic hot water (DHW), was modeled and simulated using TRNSYS. The building was considered to have an 8 m
2 flat plate solar collector, facing south with a slope of 45° on the building’s roof. Specifically, the flat place solar collectors are used to transfer heat, with the aid of a pump, into a TES unit; the building’s foundation in this case. The model is a simulation on TRNSYS (
Figure 2), with the use of various types. TMY2 (type 15) was used for producing the meteorological data required (i.e., incident solar radiation, diffuse solar radiation), while the solar collectors (type 1b) was used to model the thermal performance of a flat-plate solar collectors. The thermal performance of the collector array was determined by the number of modules in series and the characteristics of each module. The coefficients of the function were supplied by an ASHRAE or equivalent test. The circulation pump (type 114) was a constant fluid mass flow rate pump. The equation type was used to act as the controller of the pump setting it ON or OFF according to the season (only winter requires heating) and the difference between outlet temperature of the solar collector and the temperature stored in the TES unit. A more advanced controller was also examined using the microprocessor controller (type 40) to replace the signal equation type. The introduced controller applies a time delay of one hour when setting the pump OFF. Compared to the simple controller using the signal equation type the advanced controller does not seem to have a significant change on the outcome compared to ON-OFF, when using 1 h delay. When a further delay of two hours or more is applied, the TES average temperature decreases, something not desirable for the application. Hence, as the choice is between the 1 h delay and the no-delay ON-OFF, for simplicity the latter controller was used in the forward simulations. It should also be noted that the TES unit had a low overall heat transfer coefficient in relation to the surrounding environment. This was explicitly calculated in COMSOL with the build-in equations and was found to correspond to an overall 0.6 W∙m
−2 ∙K
−1, to be applied in TRNSYS.
The simulations were carried out for an entire year with hourly time steps for the weather conditions of Nicosia, Cyprus. During the simulation process the useful energy produced by the solar collectors in the form of hot water together with the temperature of the water, the flowrate and the pump signal were recorded in order to be used in the COMSOL Multiphysics stage of this work.
2.3. Building’s Foundation
Next, to examine the thermal distribution in the building’s foundation, the COMSOL Multiphysics software was used. COMSOL Multiphysics is a multi-physics software with user friendly interface, where the geometry, construction of the mesh and prost-processing procedures are in the same environment. Equations were selected according to the physical parameters involved; note that equations can also be added and edited manually.
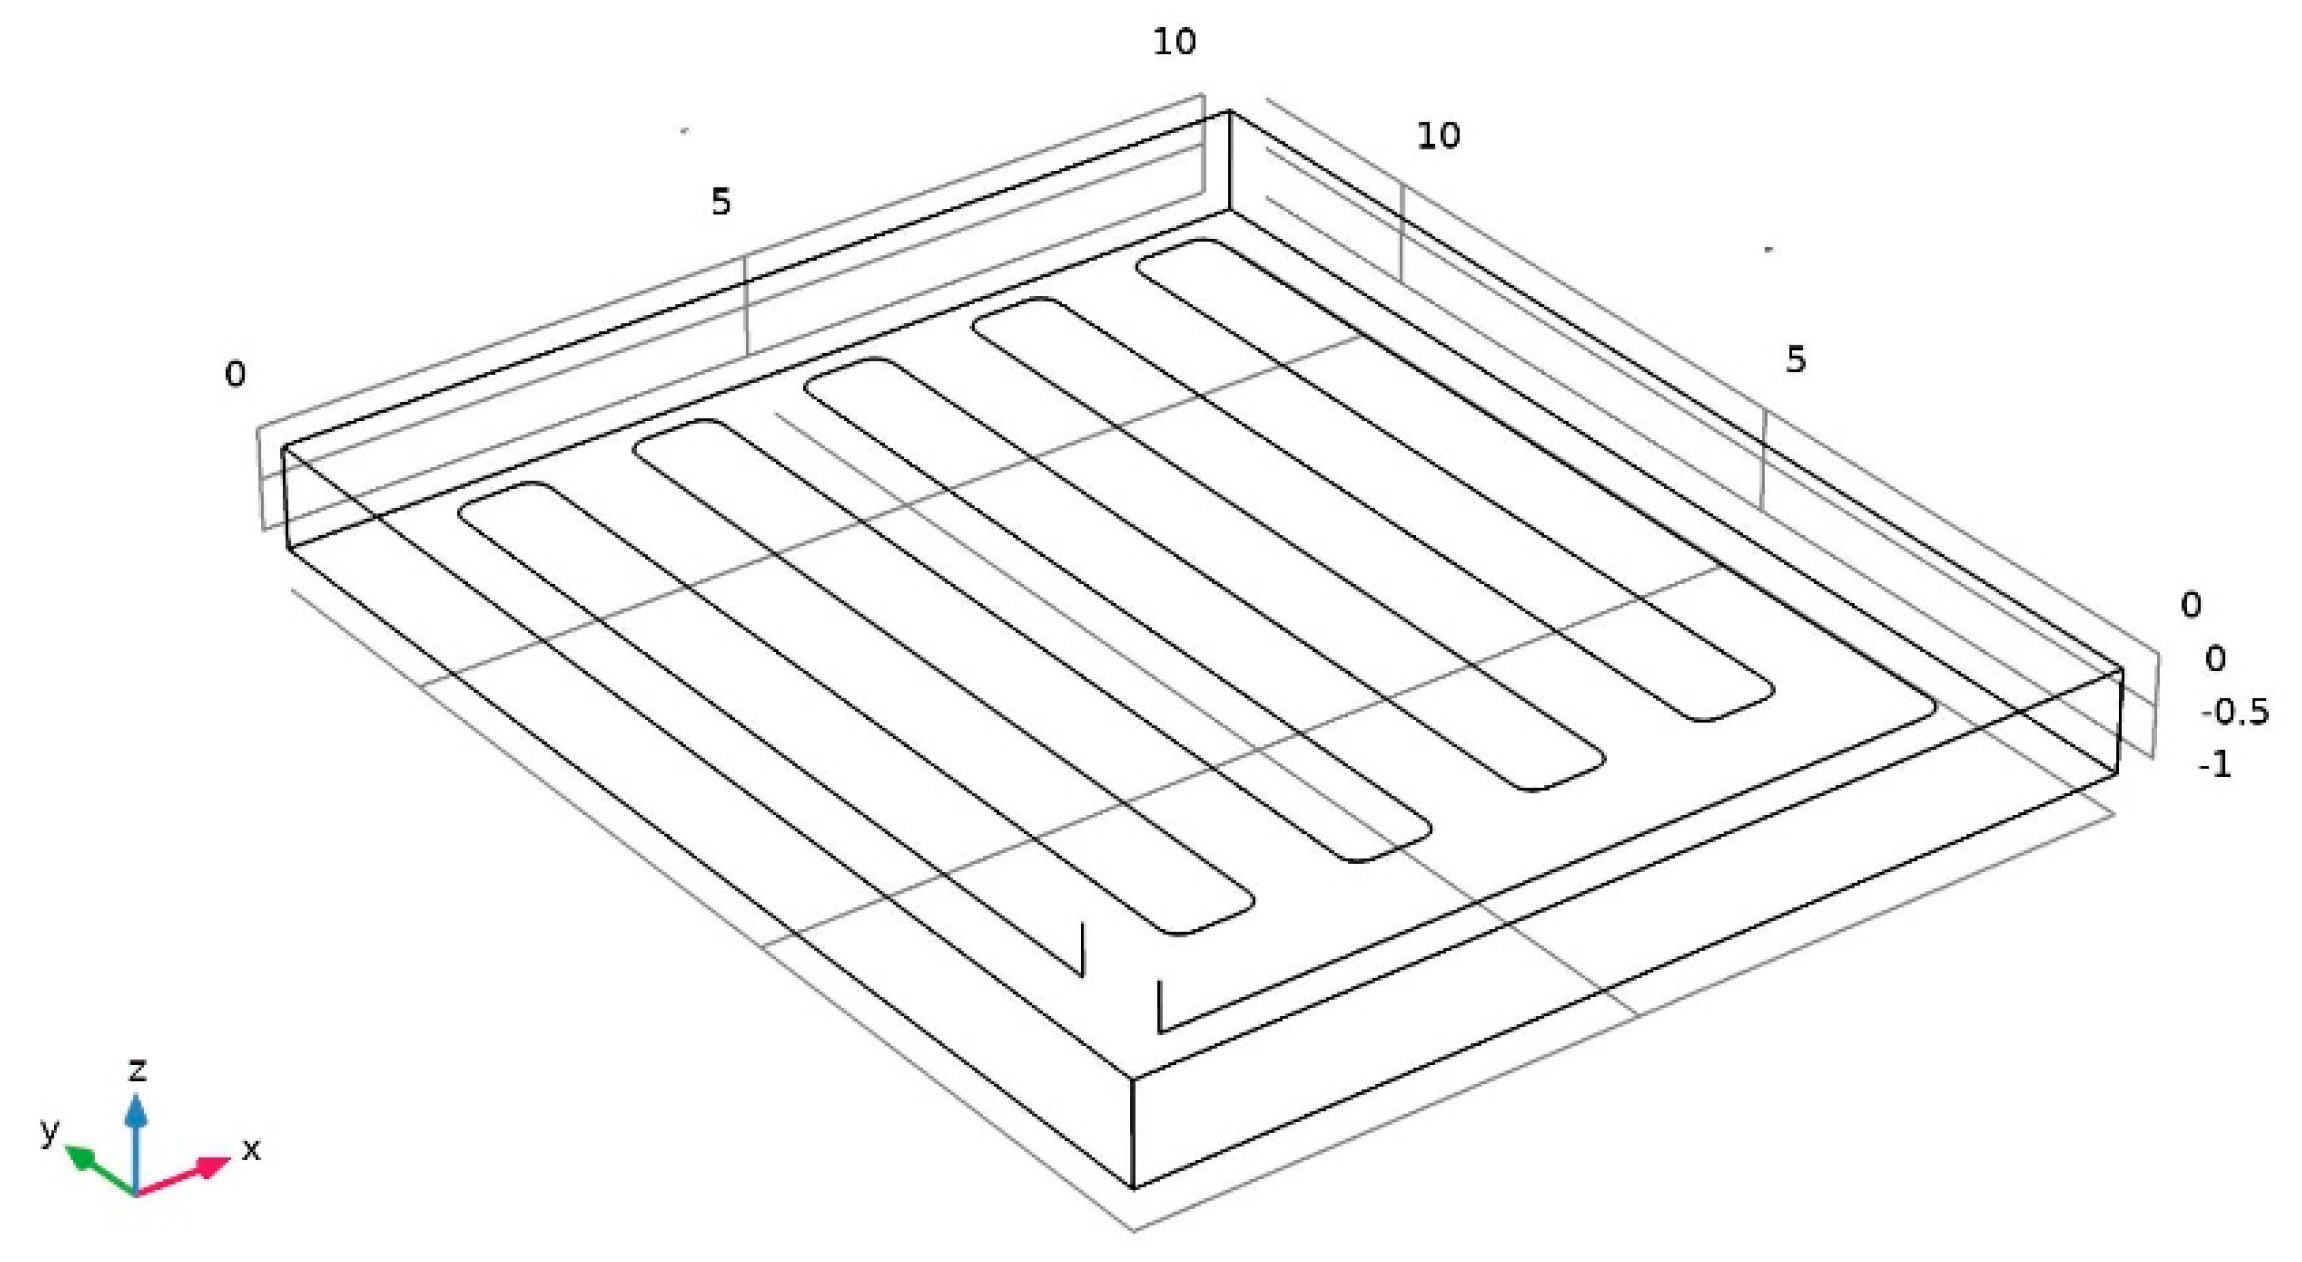
A 3D computer aided design (CAD) model of the building’s foundation was constructed using COMSOL Multiphysics’s integrated part builder. The model consisted of two domains; the concrete and the pipes. To convert the model into a heat exchanger, a piping system was introduced following a “snake” configuration, as shown in
Figure 3. Higher mesh density is concentrated on the pipes and the top surface with a growth factor of 1.4.
Ground thermal and other characteristics and reinforced concrete characteristics were based on previous publications [
25,
36,
37]. The building’s foundation dimensions were 12 × 10 × 1 m (length × width × depth), insulated in all directions except the top surface. Initial conditions were taken after a year’s run from TRNSYS, assuming that the reinforced concrete was pre-heated.
The convection diffusion equation was used under the Heat Transfer in Solids module, with a modification for 1D for the piping system using the Heat Transfer in Pipes module of COMSOL Multiphysics. The heat distribution over time was described by the general heat transfer equation based on the energy balance. Thus, the three-dimensional conservation of the transient heat equation for an incompressible fluid used is as follows:
where T is the temperature (K), t is time (s), ρ is the density of the foundation material (kg∙m
−3),
is the specific heat capacity of the foundation material at constant pressure (J∙kg
−1∙K
−1),
Q is the heat source (W∙m−3) and q (W∙m−2) is given by the Fourier’s law of heat conduction that describes the relationship between the heat flux vector field and the temperature gradient.
Based on Equation (1), the equation applied in the pipe network, where heat is directly supplied from the solar thermal collectors, is described as follows:
where A is the area of the pipe (m
2),
is the tangential velocity (m∙s
−1),
is the inner pipe diameter (m),
is the Darcy friction factor. The input temperature to the system and the flowrate are provided by TRNSYS and are time depended. The pipe was chosen to be a DN25 HDPE pipe.
The data from the TRNSYS were read in COMSOL Multiphysics as interpolations and the house load was applied as a boundary condition on the top surface of the model (where the screed and tile of the house usually sits). The boundary is applied only on condition when the top surface temperature is higher than the house set temperature of 21 °C:
The described model allows for the heat distribution in the ground from the supplied heat, provided by the solar collectors, where at the same time heat is lost with natural convection to the building, which is assumed as the top surface of the reinforced concrete foundation.
In order to achieve a heat exchange between the building and the concrete foundation, a heat flux boundary condition was applied with the building’s heating demand taken from TRNSYS. The COMSOL Multiphysics simulation runs were set for the whole month of January.
3. Results and Discussion
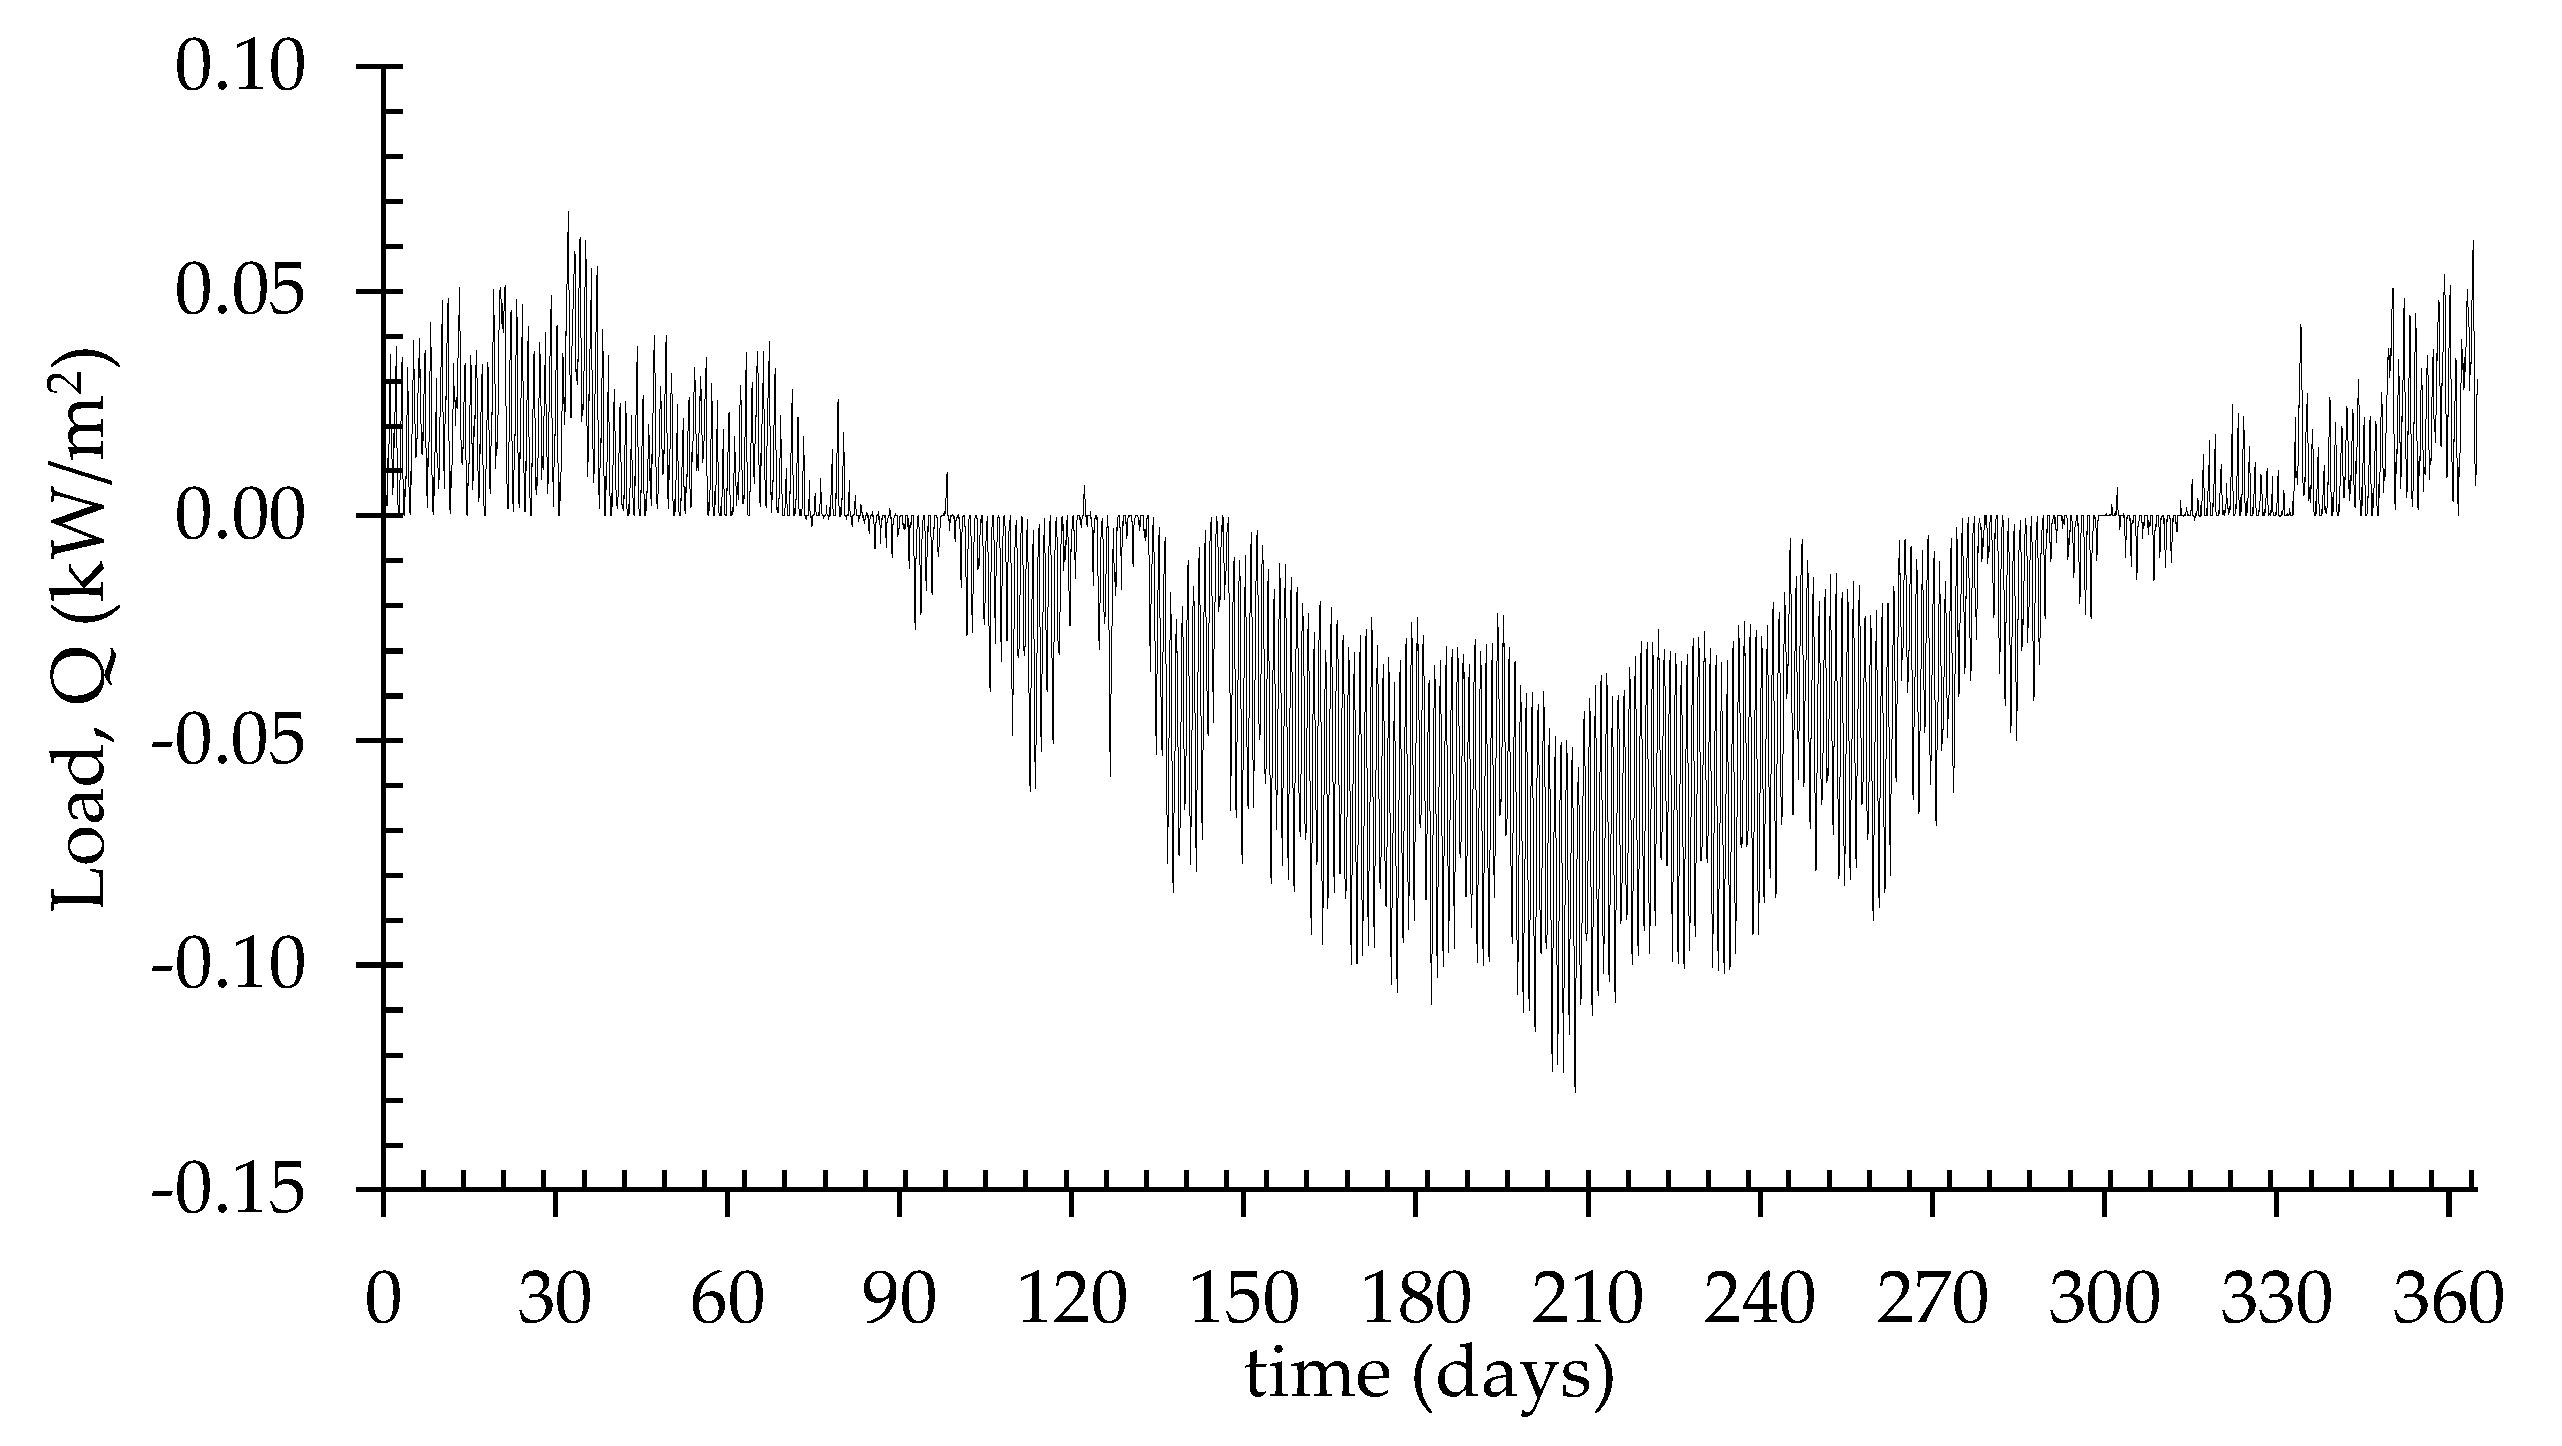
Several simulations were performed in order to obtain the optimum scenarios and the best conversion of computational time and memory. Firstly, the investigating residential building heating and cooling loads were simulated in TRNSYS and presented in
Figure 4, where the negative values represent the cooling load and the positive values the heating load. The simulated yearly heating and cooling loads as shown in
Table 1 are 5600 and 23,160 kWh respectively. Similar loads (for a similar case) have been obtained in [
38], where the presented measured heating and cooling loads were 6200 and 20,600 kWh respectively. Heating and cooling loads are not only weather dependent, but mostly case (size, materials, building orientation, residence activity, etc.) and location (coastal regions or higher altitude, city or village) sensitive too. Balanced loads could also be observed in different cases in Cyprus [
39] but with the heating load in similar cases not varying dramatically.
The house required heating and cooling loads are presented in
Table 1, where it can be observed that the most demanding month is January (with ambient temperatures below 18 °C, see Figure 6), which at the same time exhibits the lowest solar irradiation to heating demand ratio. The calculation of the loads was based on set temperatures of 21 °C and 27 °C, for winter and summer indoor thermal comfort respectively. Moreover, when the season changes from winter to spring, the required load of the house to keep a constant temperature drops close to 1/3 of the previous month. The ‘best’ month is November exhibiting at the same time a low heating energy demand and a high irradiation on the tilted surface (with the highest ratio). This very month could be considered for a preheating period. The current study examines the possibility to take advantage of the higher irradiation and store it on the reinforced concrete foundation to provide a partial heating though natural convection.
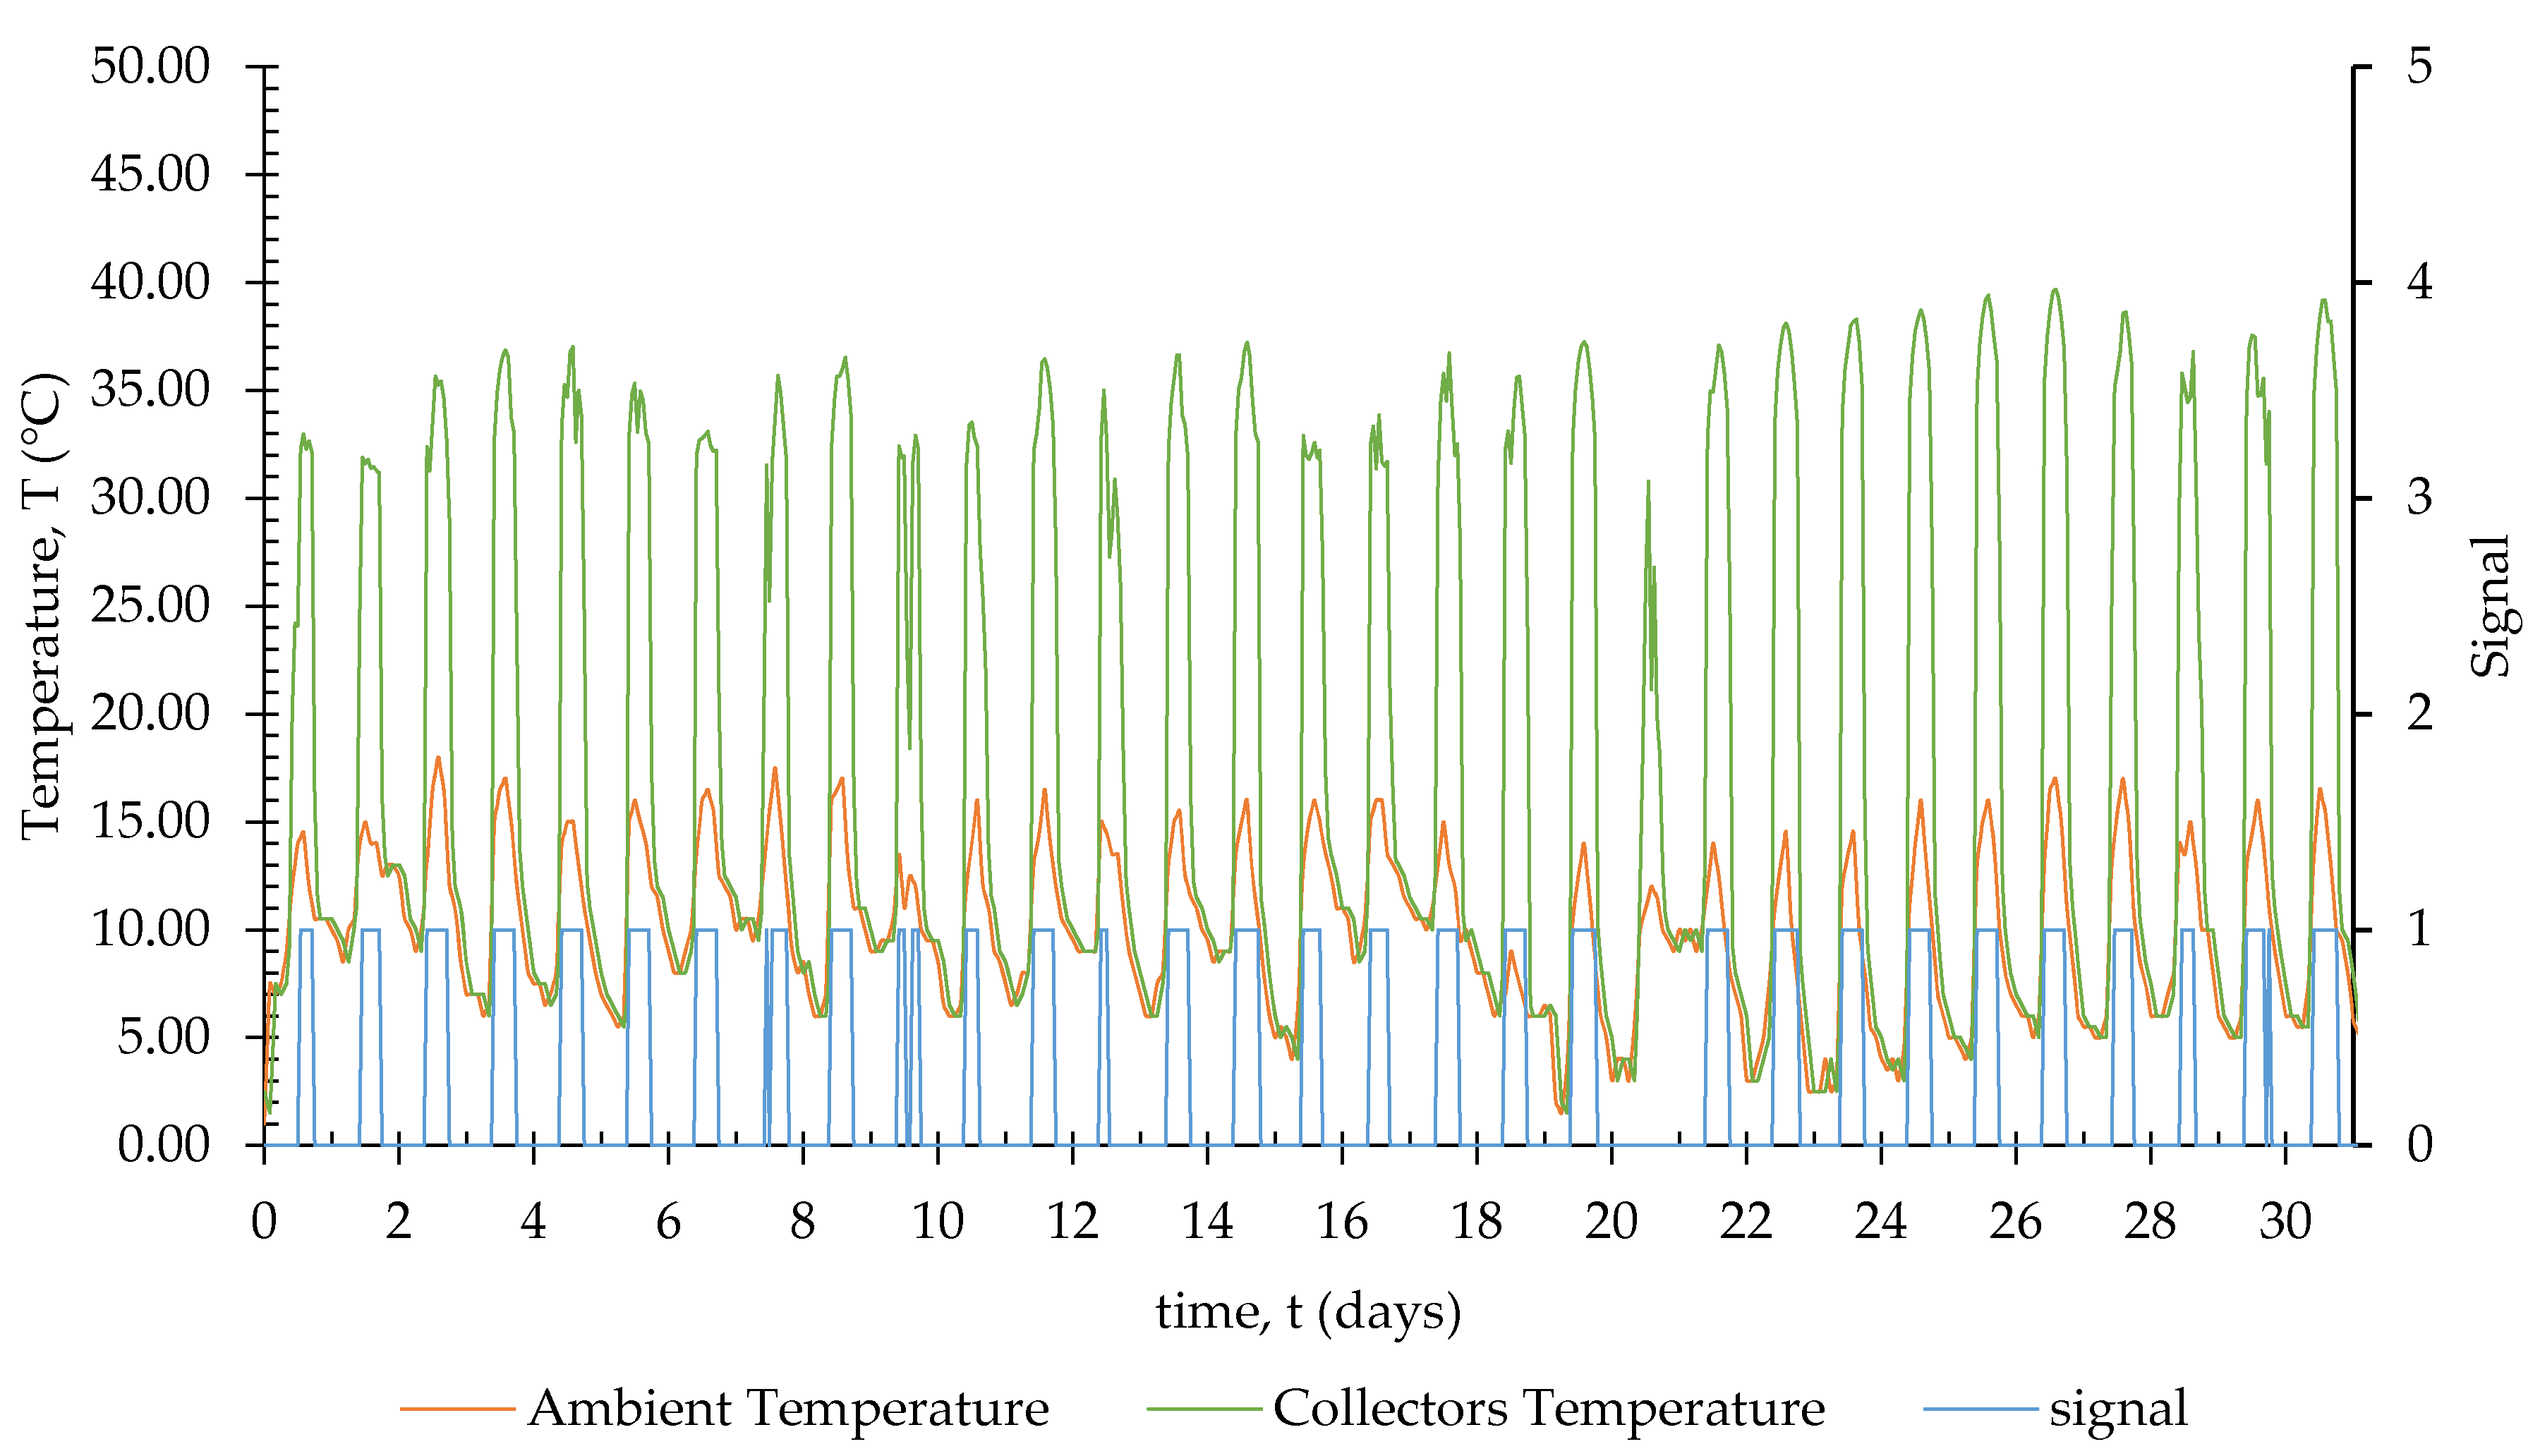
Following on, the solar collector system was examined using TRNSYS. Since heating is required only from November to March (as shown in
Table 1) the pump should be switched off during the summer months in order to avoid excessive heating of the rooms. Additionally, a comparative parameter between the TES unit temperature and the solar collectors’ output temperature is used to control the single-speed pump signal and allow the flow. This parameter reduces the risk to lower the temperature of the TES on a cloudy day. When the signal is set to 1, flow is circulated through the pump and the solar collectors’ temperature is plotted along with ambient temperature and signal for the whole of January.
Table 1 also illustrates that the solar irradiation is always higher that the heating load required. This, though, does not mean that the load could be covered completely by the collectors since during the day, when solar radiation is present, the heating demand is lower compared to the night demand.
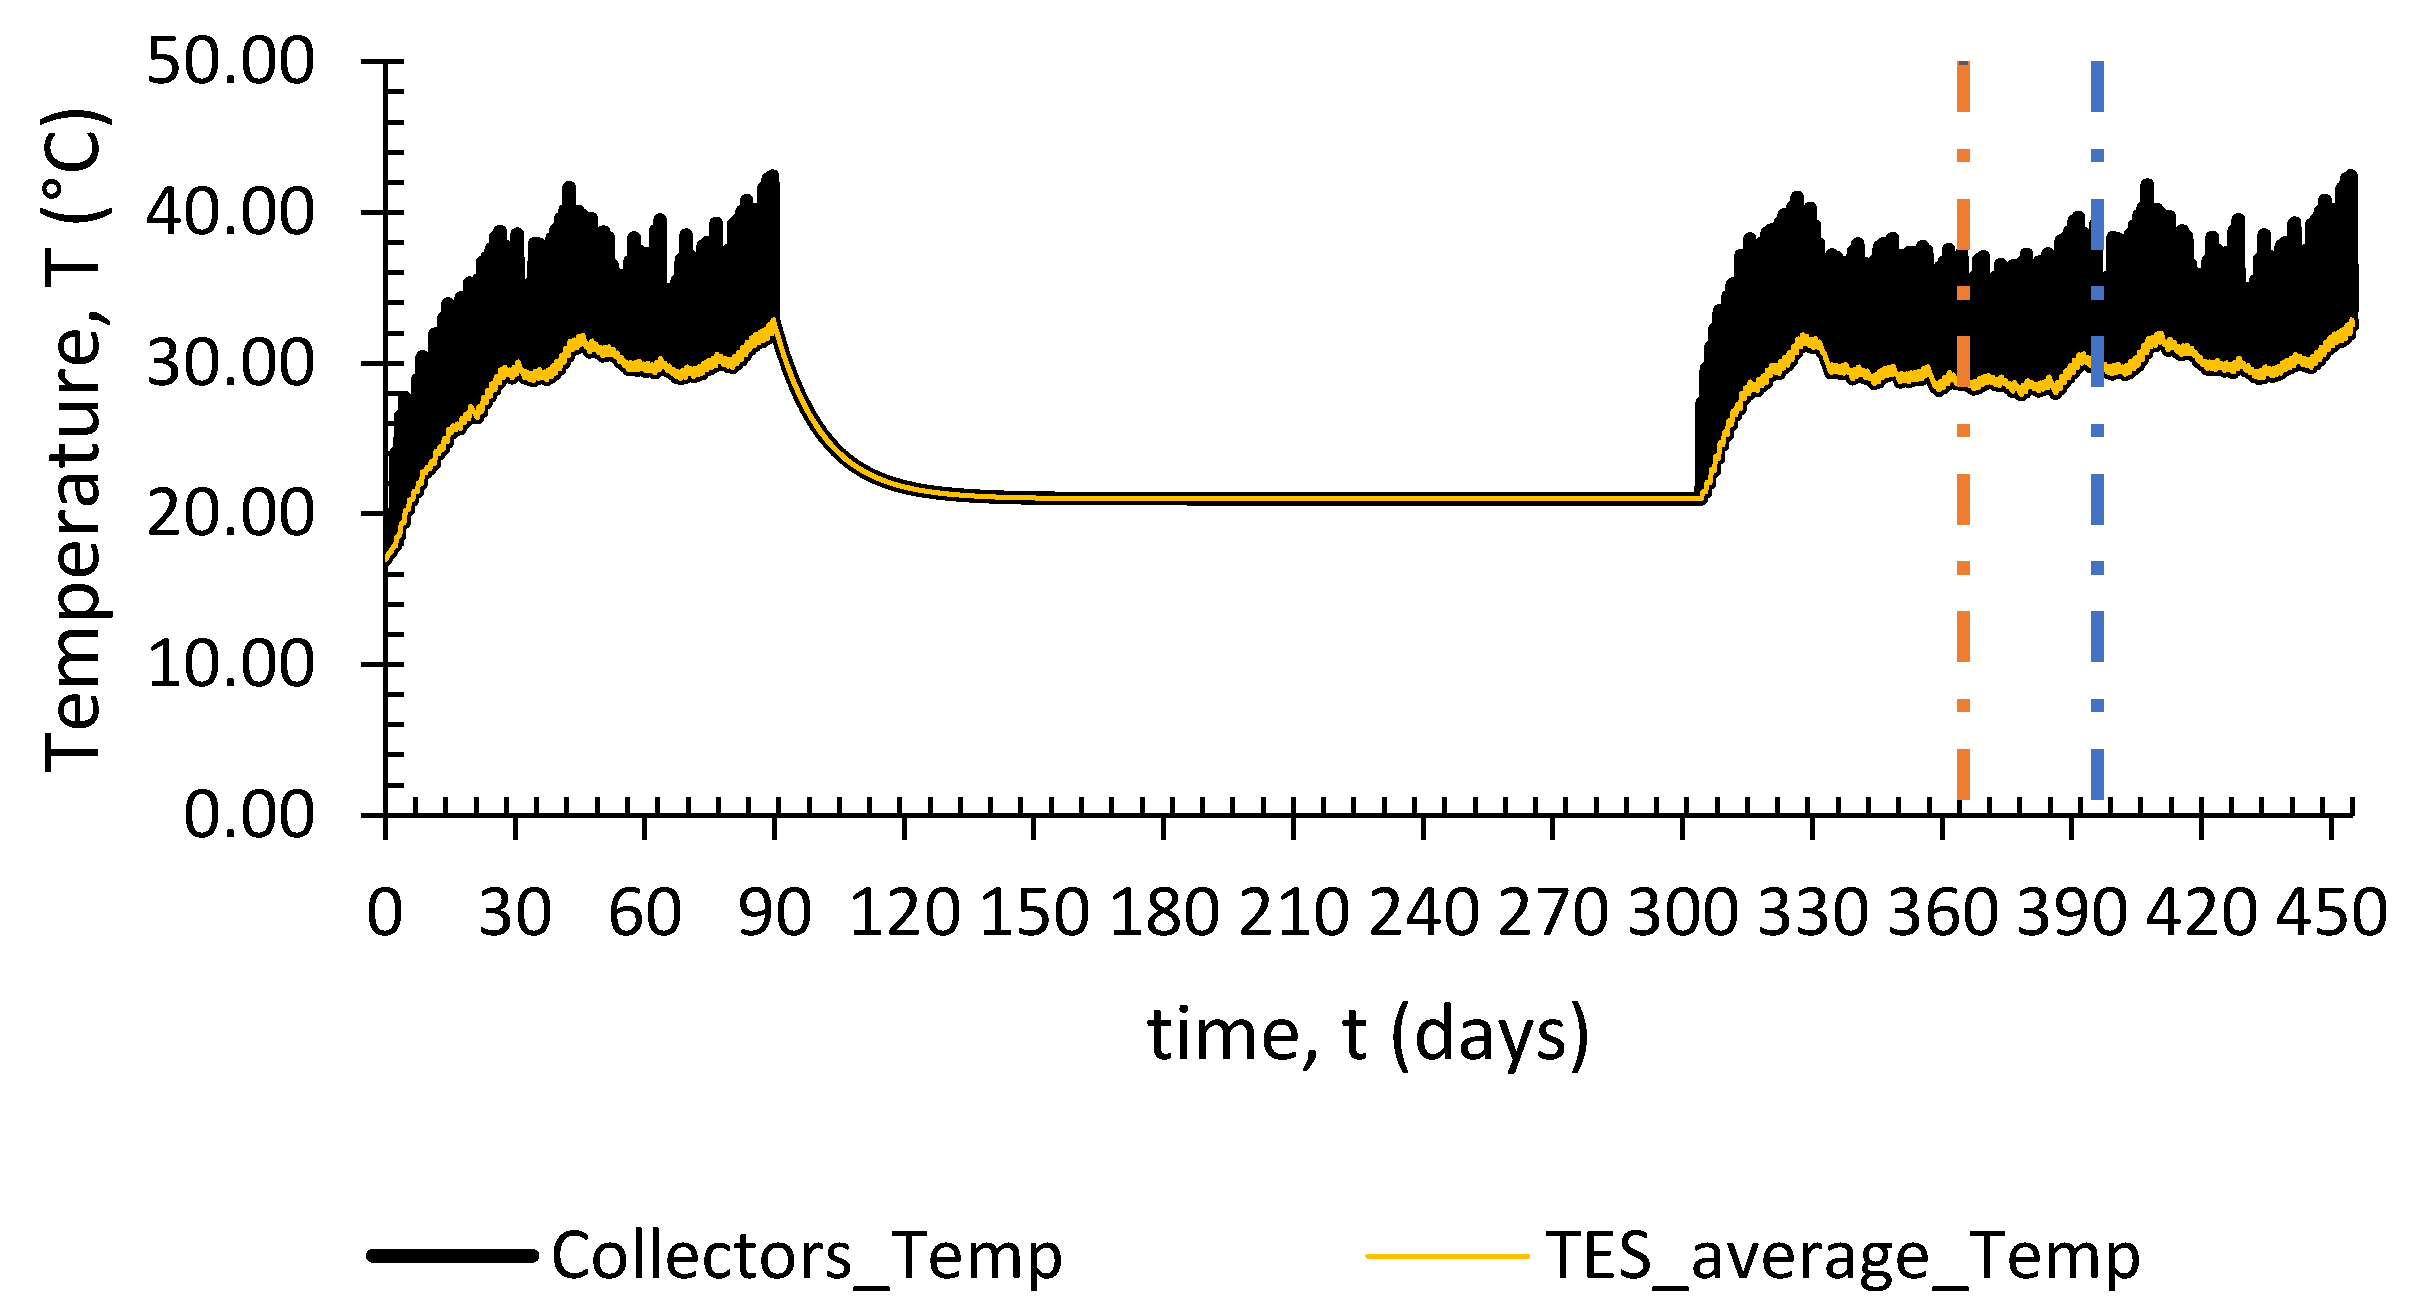
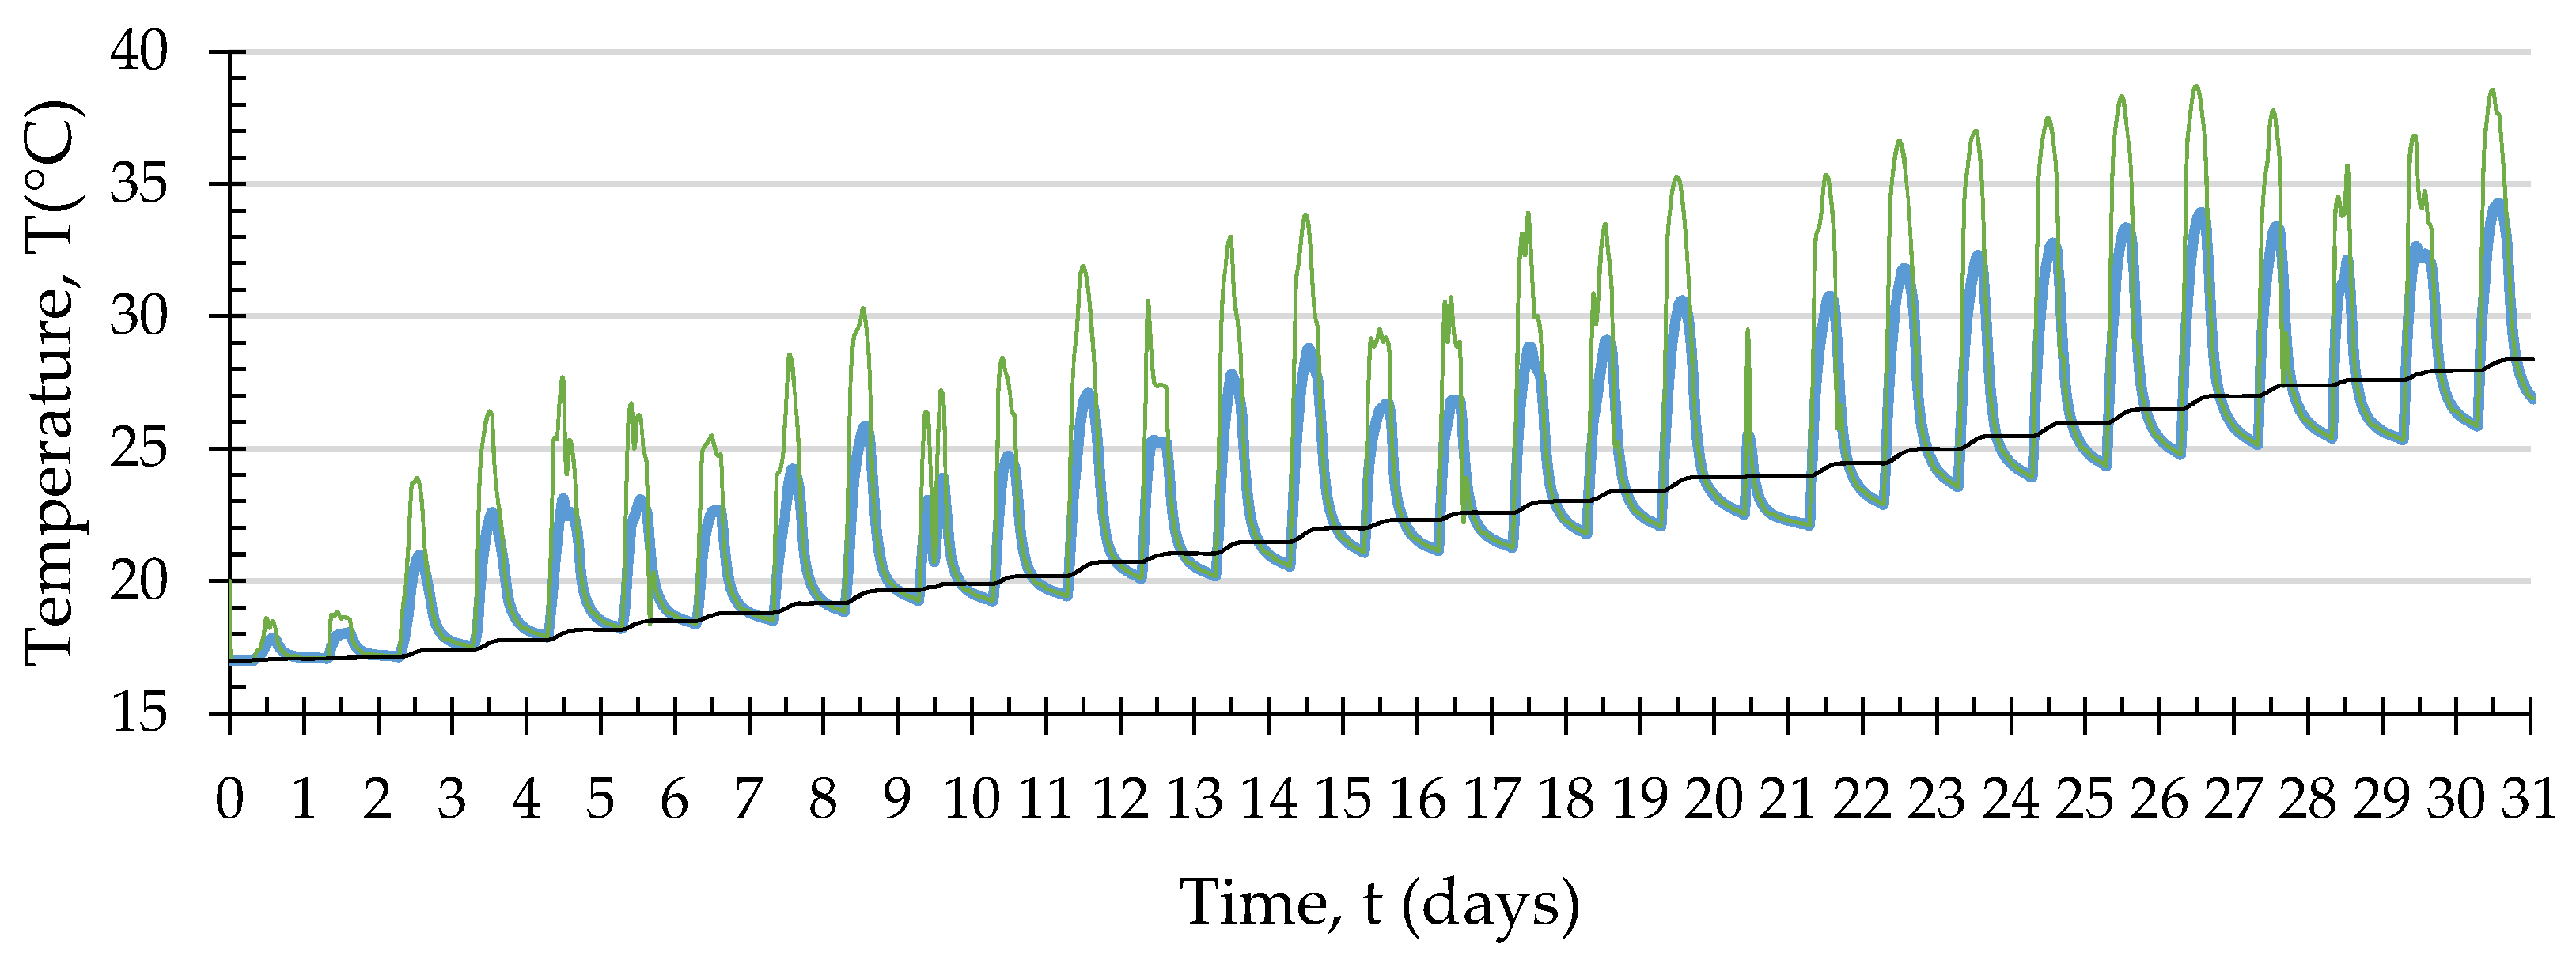
Upon circulating the energy from the solar thermal collectors through the network pipes installed in the TES unit, it was noticed that, for a whole year, the average concrete temperature did not rise above 35 °C, neither did the temperature at inlet (from the solar collectors) above 45 °C (see
Figure 5, days 0–365). Therefore, the strength of the concrete foundation is not affected as the temperature is maintained well below 100 °C (see the discussion in the previous section).
Additionally, one can observe that in order to reach a concrete average temperature of 25–30 °C a preheating period of 20–30 days is required (days 0–30), although the exact number of days cannot be predicted due to the randomness of the weather (related to cloud coverage, temperature, etc.). After the summer period, with the beginning of the heating seasons (November), due to the fact that higher temperatures are directed from the solar collectors to the TES unit, the reinforced concrete seems to maintain a close to steady average temperature of 25–35 °C, as shown in
Figure 5. This is favorable to the system since, for example, January, which is the weakest month in terms of thermal energy directed from the collectors and level of heating demand, could begin with higher initial TES temperatures, thus providing the required partial heating load to the building.
Indeed, the TES system was preheated for a whole month (October) before the heating season (November), a fact that enabled the TES to reach the desired temperatures at the right time, as shown in
Figure 5. One can see that the TES acquired nearly steady temperatures around 30 °C in the month under investigation (January, days 366–396). On the other hand, high temperature over 40 °C on the building’s flooring, are not recommended due to the discomfort this would cause to the residents.
Figure 6 shows the solar collectors’ (of area 8 m
2) temperature acquired for the month of January under investigation, which remain below 40 °C. Also shown are the ambient temperatures (below 18 °C) and the discrete value of 1 of the pump signal throughout the month, with the exception of day 21, where the pump signal remained at 0 owing to the collectors’ temperatures being lower than the TES temperatures (due to heavy cloudiness).
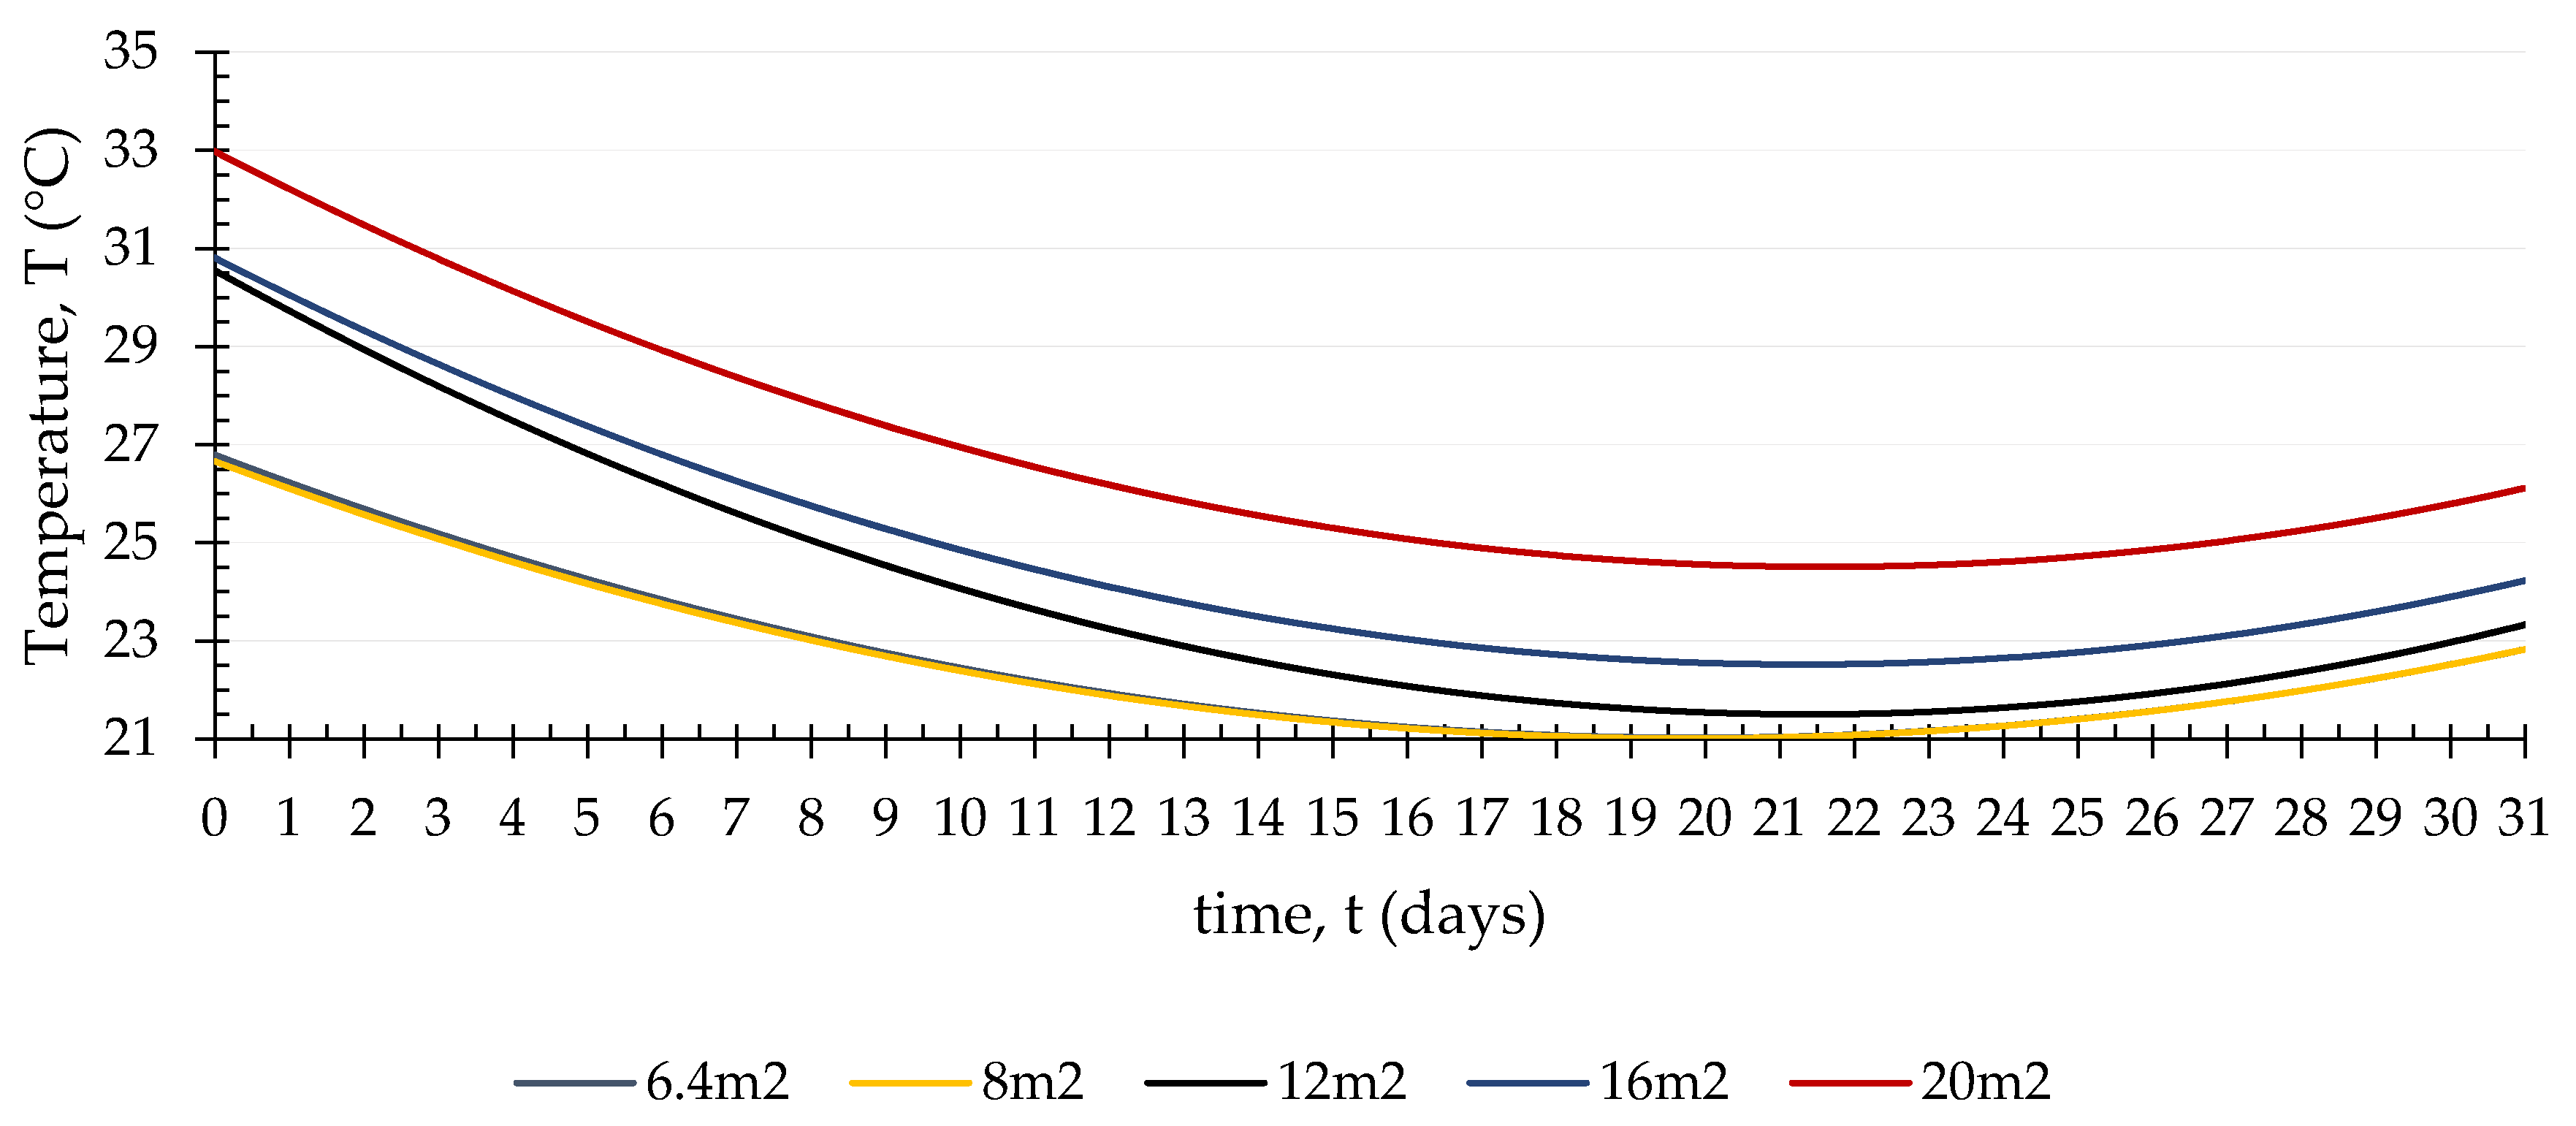
In order to examine the temperature distribution in the reinforced concrete foundation (TES unit) in more detail, COMSOL Multiphysics was then employed. The model was initially run with a solar collectors’ area of 6.4 m
2 to investigate whether the energy was enough to cover the house full heating load.
Figure 7 shows that, for January, the selected solar collectors’ area of 6.4 m
2 could not be enough to cover the full heating load required by the building and, as a result, the TES unit cannot support the building’s maintaining the desired set temperature of 21 °C. Larger solar collectors’ areas were tested in order for this issue to be addressed. The outcome of this test is shown in
Figure 7, where one can see that areas of over 12 m
2 seem to be enough.
It is expected that for high-enough areas of solar collectors applied (yielding a higher temperature and load delivered in the TES unit), not only would the system respond to the heating load, but additionally the TES unit average temperature would increase and energy could be saved for the days where a higher heating load were needed.
The main purpose of this system is to be economic and to cover part of the heating load of the building. Now, installing more and more solar collectors would increase the system’s initial cost, or cause other practical complications related to solar collectors and the building. It can always be argued whether it is advantageous to reduce the initial cost of the system and cover partial of the load with conventional means (albeit environmentally non-friendly), or whether a system would be designed to eliminate the need of any additional HVAC units. Hence, increasing the solar collectors’ area cannot always be the ideal solution, and other solutions may be desired. This though requires an economic analysis, which is beyond the scope of the current study.
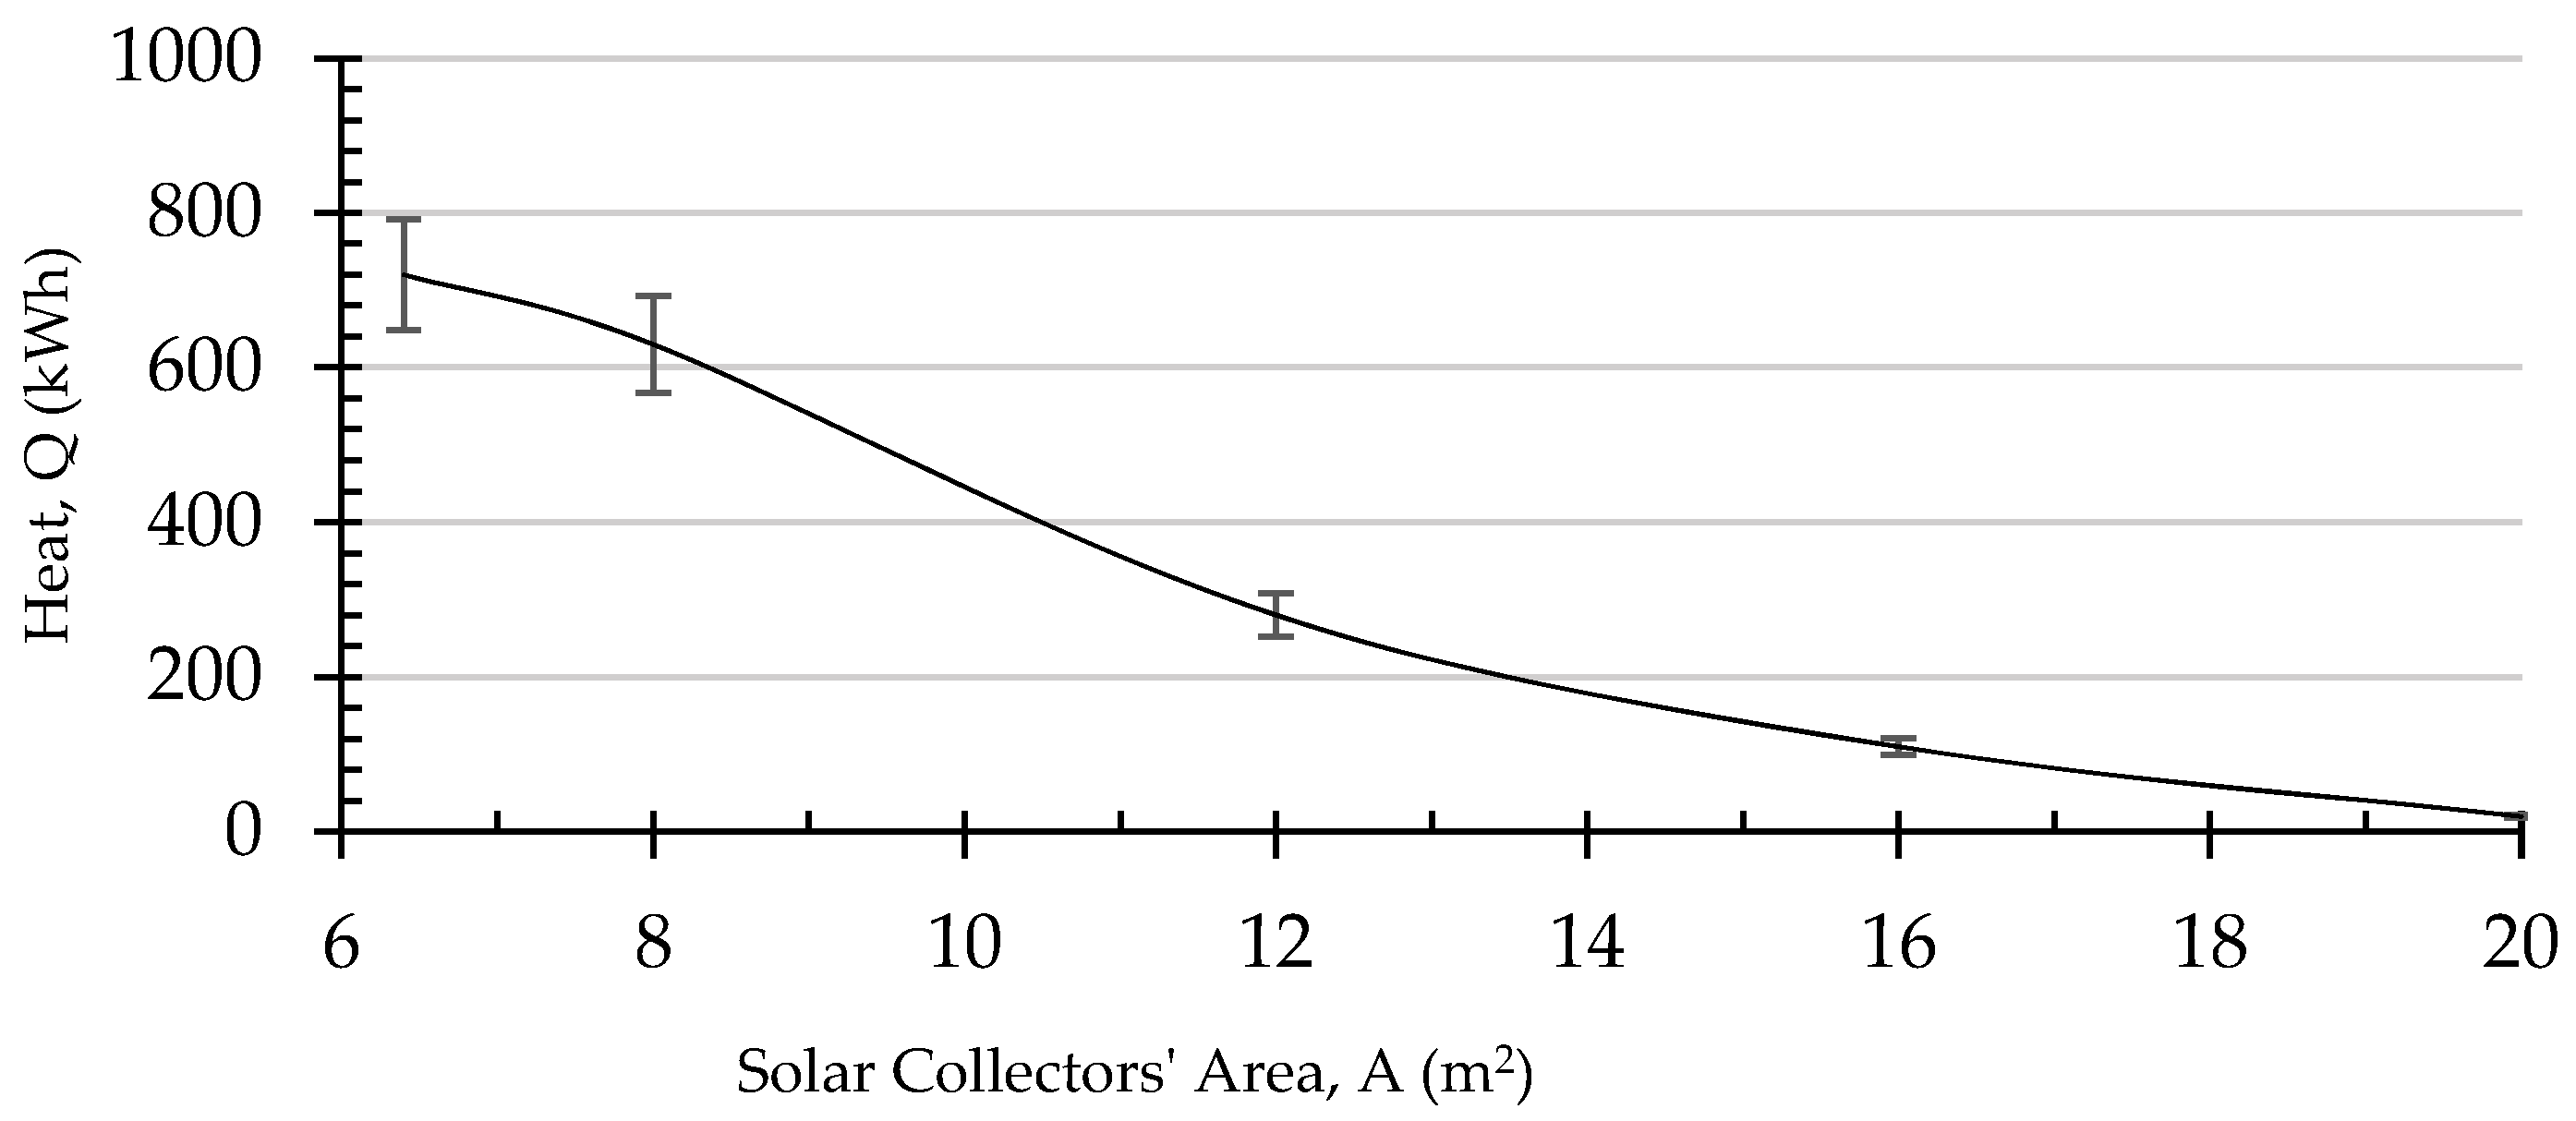
To this end, one can compare the additional energy the system would require for covering the building’s heating load (as presented in
Figure 4). In order to calculate the additional heat, the provided heat from the TES unit was subtracted from the building’s heating load for various scenarios of the solar collectors’ area, with the result shown in
Figure 8. It can be seen therein that the additional heat ranges from around 700 kWh to 10 kWh for ascending collector’s areas between 6 m
2 and 20 m
2.
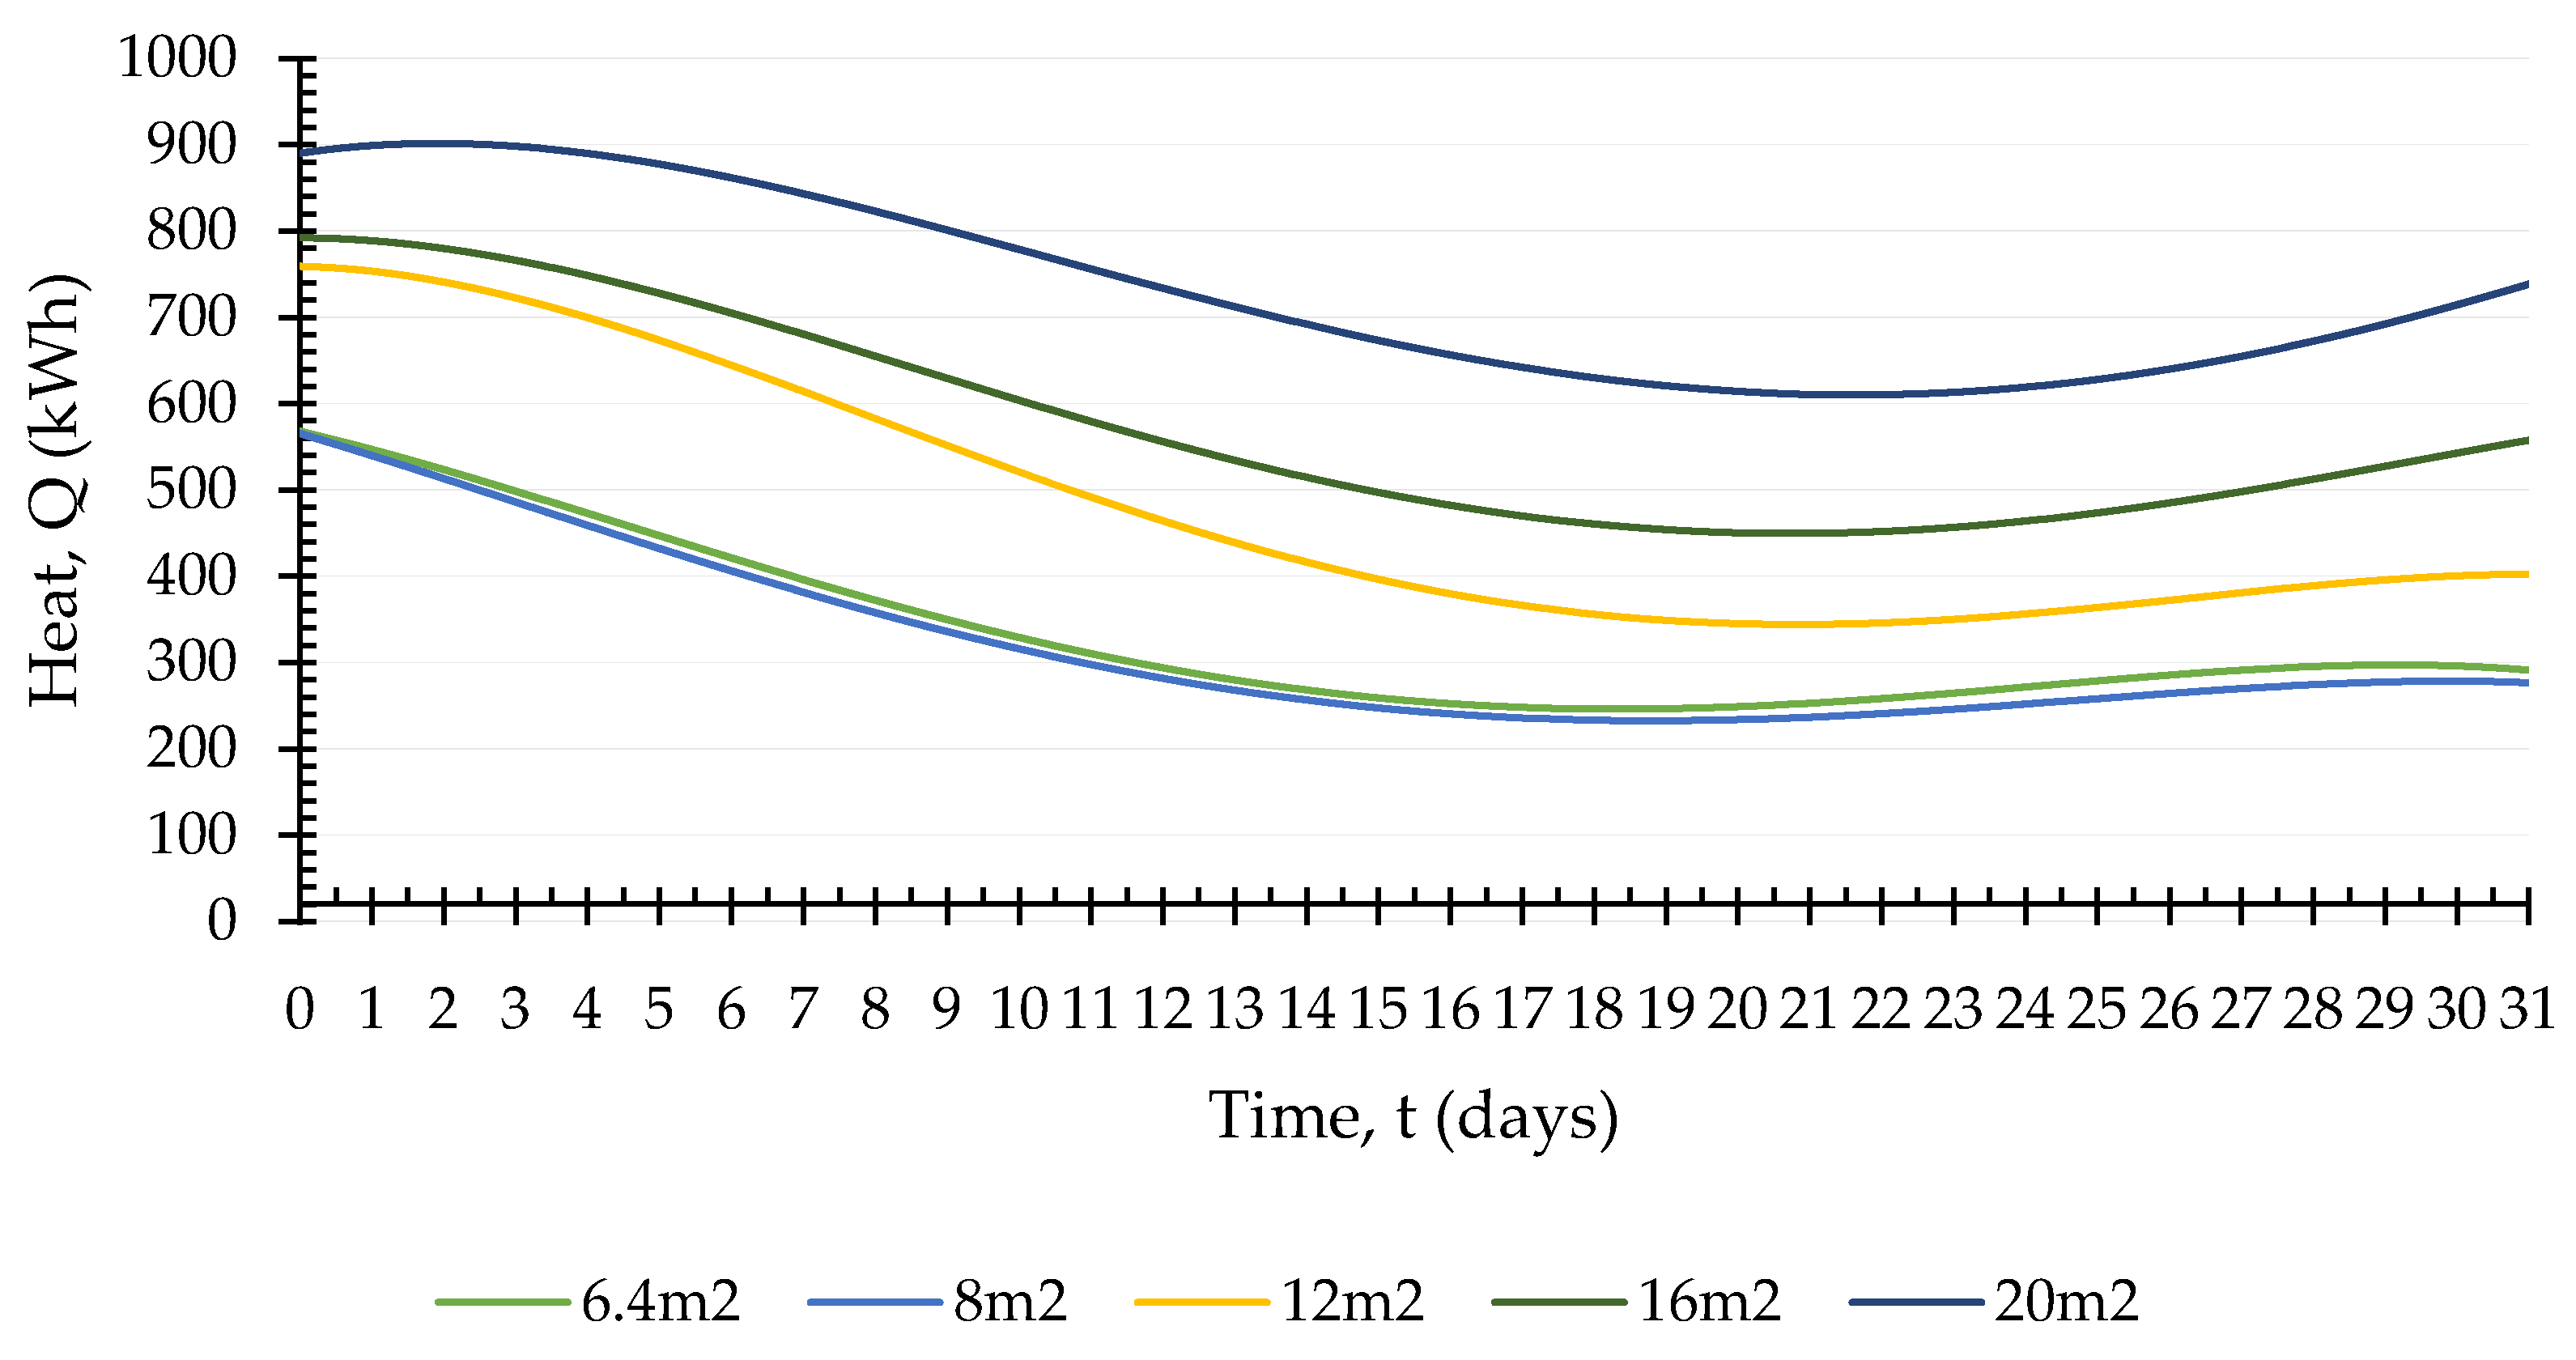
Figure 9 shows the available TES stored energy computed on the basis of the difference between the building’s set temperature (21 °C) and the TES average temperature. It can clearly be seen that for all times and all collector areas (even the lowest of 6.4 m
2), the available energy never goes below 200 kWh. However, as the heat transfer to the building is solely done by natural convection through the TES unit’s top surface, heat is transferred at a low rate. Such an issue could be overcome with methods deployed in ground heat exchangers, and by increasing the TES thermal conductivity using additives [
40].
Note here that ground TES units are used with various materials (such as rock bed, concrete, sand, and more [
41]) and are always well insulated in order to maintain their energy and supply it when needed. We consider such a scenario for the TES under investigation, where the reinforced concrete could be totally insulated, and hence it could be used as a sheer TES. The stored energy can then be transferred into the house by controlled forced convection. This scenario is presented through
Figure 10, where the TES average temperature is observed to keep increasing with time for inlet and outlet fluid temperatures. Such a behavior raises the concern to control the energy stored so that the TES (concrete) temperature stays well below 100 °C, in order to maintain the buildings foundation integrity.
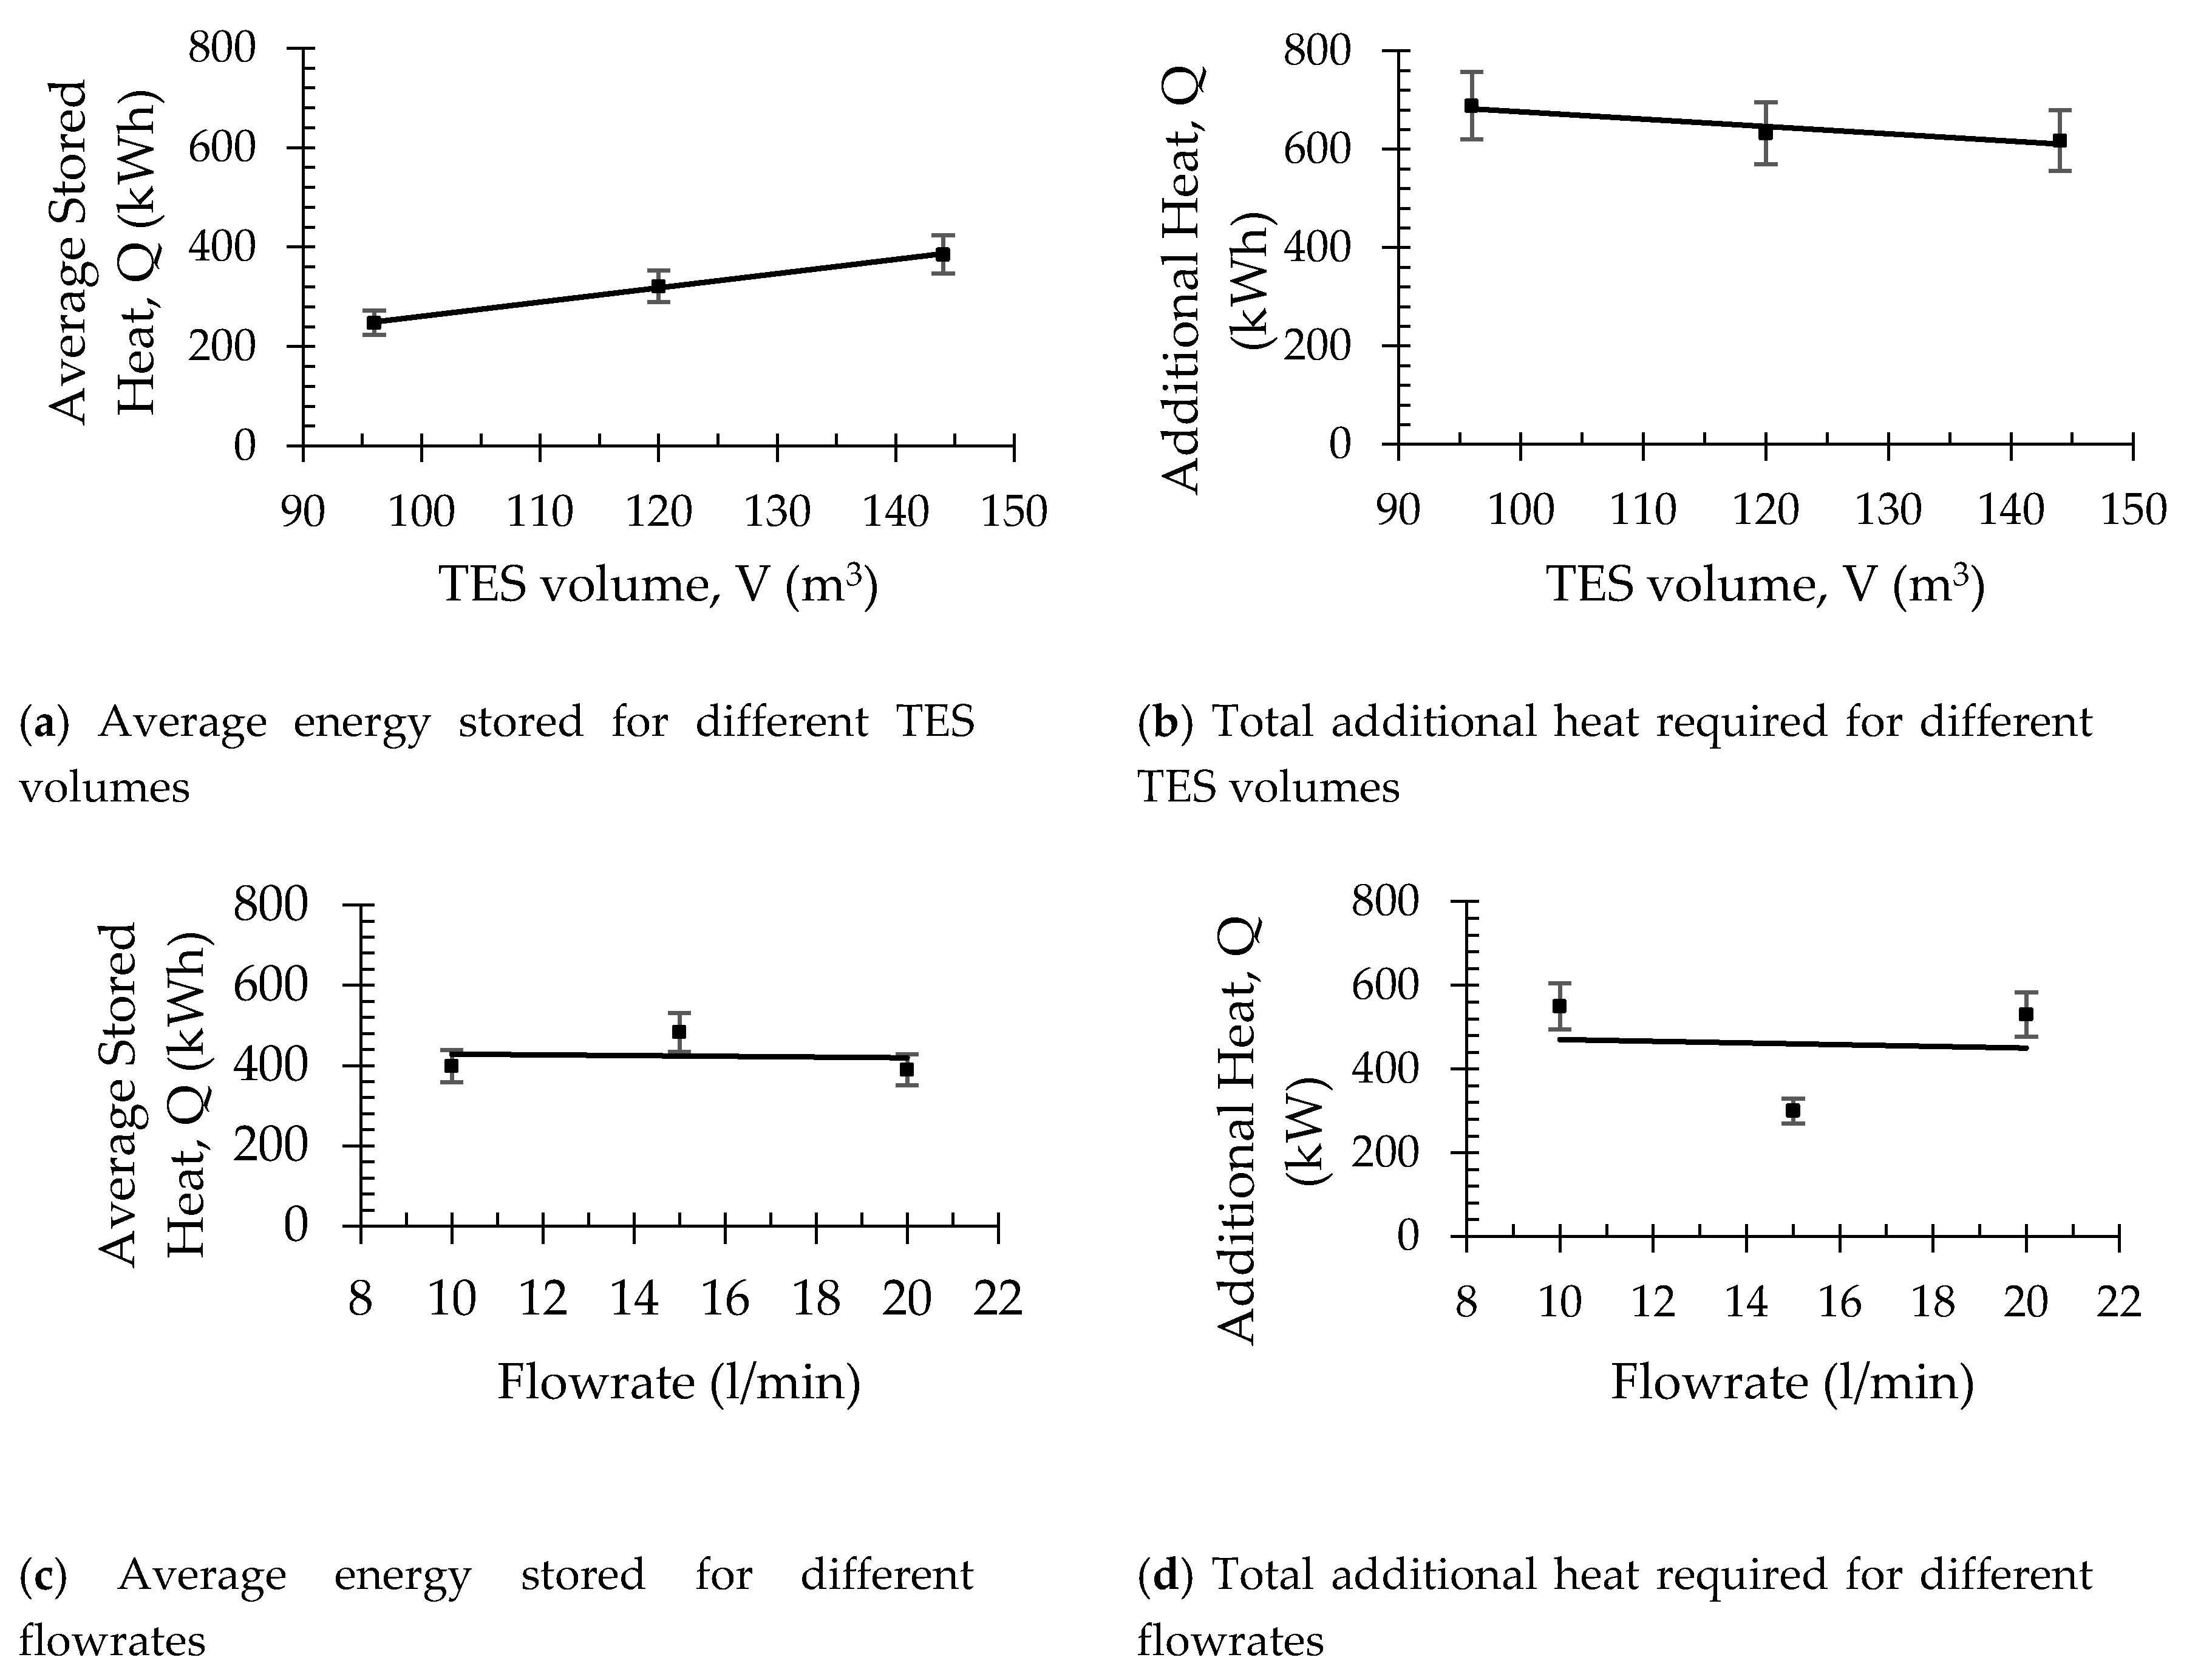
Finally, a ‘sensitivity’ analysis was also performed on the thickness of the foundation by using a ±20% difference from the standard thickness of 1 m, i.e., between 0.8–1.2 m (1.0 ± 0.2 m), and also a ±33% on flowrate, i.e., between 10–20 L/min (15 ± 5 L/min). As the length and width dimensions of the foundation remain fixed at 12 m × 10 m, the corresponding foundation volumes are between 96–144 m
3. The analysis is done through comparisons of (a) the average available stored energy and (b) the additional heat required, for different TES thicknesses/volumes and flowrate. The obtained results indicate an insignificant effect of the thickness on the system, yielding a maximum difference of only 65 kWh of average stored heat and 80 kWh of additional heat required between the two extreme foundation thickness cases (0.8 and 1.2 m) for the month of January (see linear regression results in
Figure 11). The flowrate analysis indicates an insignificant effect with only 90 kWh of average stored heat and 250 kWh of additional heat required between the lowest and the highest compared flowrates. By increasing the flowrate, the solar collectors’ temperature decreases but, on the other hand, the supplied heat increases. The opposite occurs when decreasing the flowrate, where lower heat is provided into the TES but with higher temperature.
4. Conclusions
The potential of storing thermal energy in a building’s reinforced concrete foundation acting as a TES unit has been numerically examined. A typical Cypriot house was selected to obtain heating and cooling loads by simulation on the TRNSYS software. The concept of seasonal TES was used for short time TES, where the TES unit (the building’s foundation in this case) would provide a partial heating load, to the residential building, with the use of natural convection (similar to floor heating).
In addition to TRNSYS a second software has been deployed, namely COMSOL Multiphysics, with TRNSYS providing yearly results and COMSOL further investigating one particular month, January, with the most demanding ‘worst-case’ scenario. Once the building’s heating load had been calculated, the solar collectors (simulated with TRNSYS), were tested for different areas. The simulations have shown that an area of 8 m2 was enough to cover two thirds of the chosen building’s heating load, and if the area of the collectors was increased to 20 m2, the buildings load could potentially be covered by the investigated hybrid system.
The presented system could offer an alternative possibility if used as a totally insulated TES unit. Moreover, an analysis on the thickness of the building’s foundation (TES unit) and the flowrate has shown an insignificant effect for ±20% and ±33% variations respectively.
The encouraging conclusion is that the use of a building’s foundation reinforced concrete for a potential partial or full cover of the building’s heating load is realistic. A future development could be achieved though research and experimentation on more parameters and aspects before eventual implementation, including possible economic and lifecycle analyses.


