1. Introduction
The air flow rate of variable air volume (VAV) terminal unit adjust the supply air flow rate and temperature based on the indoor load, ventilation requirement, and stratification [
1,
2,
3]. Accurate measurement of air flow rate is essential in automatic building control using the VAV system. The air flow measurement method can generally be measured using a Pitot tube, a hot-wire anemometer, and a virtual airflow sensor [
4].
Pitot-static tubes are the most commonly used methods for measuring air volume in buildings [
5]. However, Pitot-static tubes have the disadvantage of low accuracy at low speeds [
6].
The hot-wire anemometer can measure the air volume with high accuracy even at low speeds. However, in the wind speed measurement standard using a hot air anemometer, the sensor should be installed by dividing the duct evenly, and about 4 to 20 measurement points are required [
7]. If a hot-wire anemometer is installed to measure the air volume, a problem of installation cost may occur due to multiple measurement points.
To improve the problems of these physical sensors, Kim [
8] proposed a virtual air flow sensor for the terminal unit using a mathematical model. The air flow rate of the terminal unit was predicted using the in-situ performance curve of the damper. In addition, the factors affecting the air volume of the terminal unit were analyzed. It was confirmed that the air flow rate of the terminal unit was affected by the differential pressure of the damper as well as the speed of the supply fan. The virtual air flow sensor was developed using the supply fan speed and damper opening rate, which can be easily obtained from the existing control system. However, the mathematical model has the disadvantage that it takes a lot of effort and cost [
9]. Therefore, it is necessary to derive factors affecting the prediction results and to use data-based prediction using statistical method [
10].
The statistical method, which is one of the black box methods, can derive a prediction model using real data [
11]. In addition, even though the variables used in the black box model have no physical meaning, the relationship between input and output is derived using statistical methods. The statistical methods used for the development of prediction model in building are linear [
12], multiple [
13], polynomial [
14], logistic regression [
15], and partial least squares [
16].
In this study, a predictive model for the air flow rate was developed to secure the measurement stability of the VAV terminal unit. In order to predict the air flow rate, the factors used for control and monitoring when the existing heating, ventilation & air conditioning (HVAC) system is operated using the variable air volume system were selected as variables, and data collection and correlation analysis of the air flow rate of the terminal unit were performed. In addition, a predictive model for the air flow rate was developed using multiple regression analysis, and the reliability of the model was evaluated through comparison with the air flow rates measured by the hot-wire anemometer.
2. Collection of Air Flow Rate Data of the VAV Terminal Unit
2.1. Test Set-Up
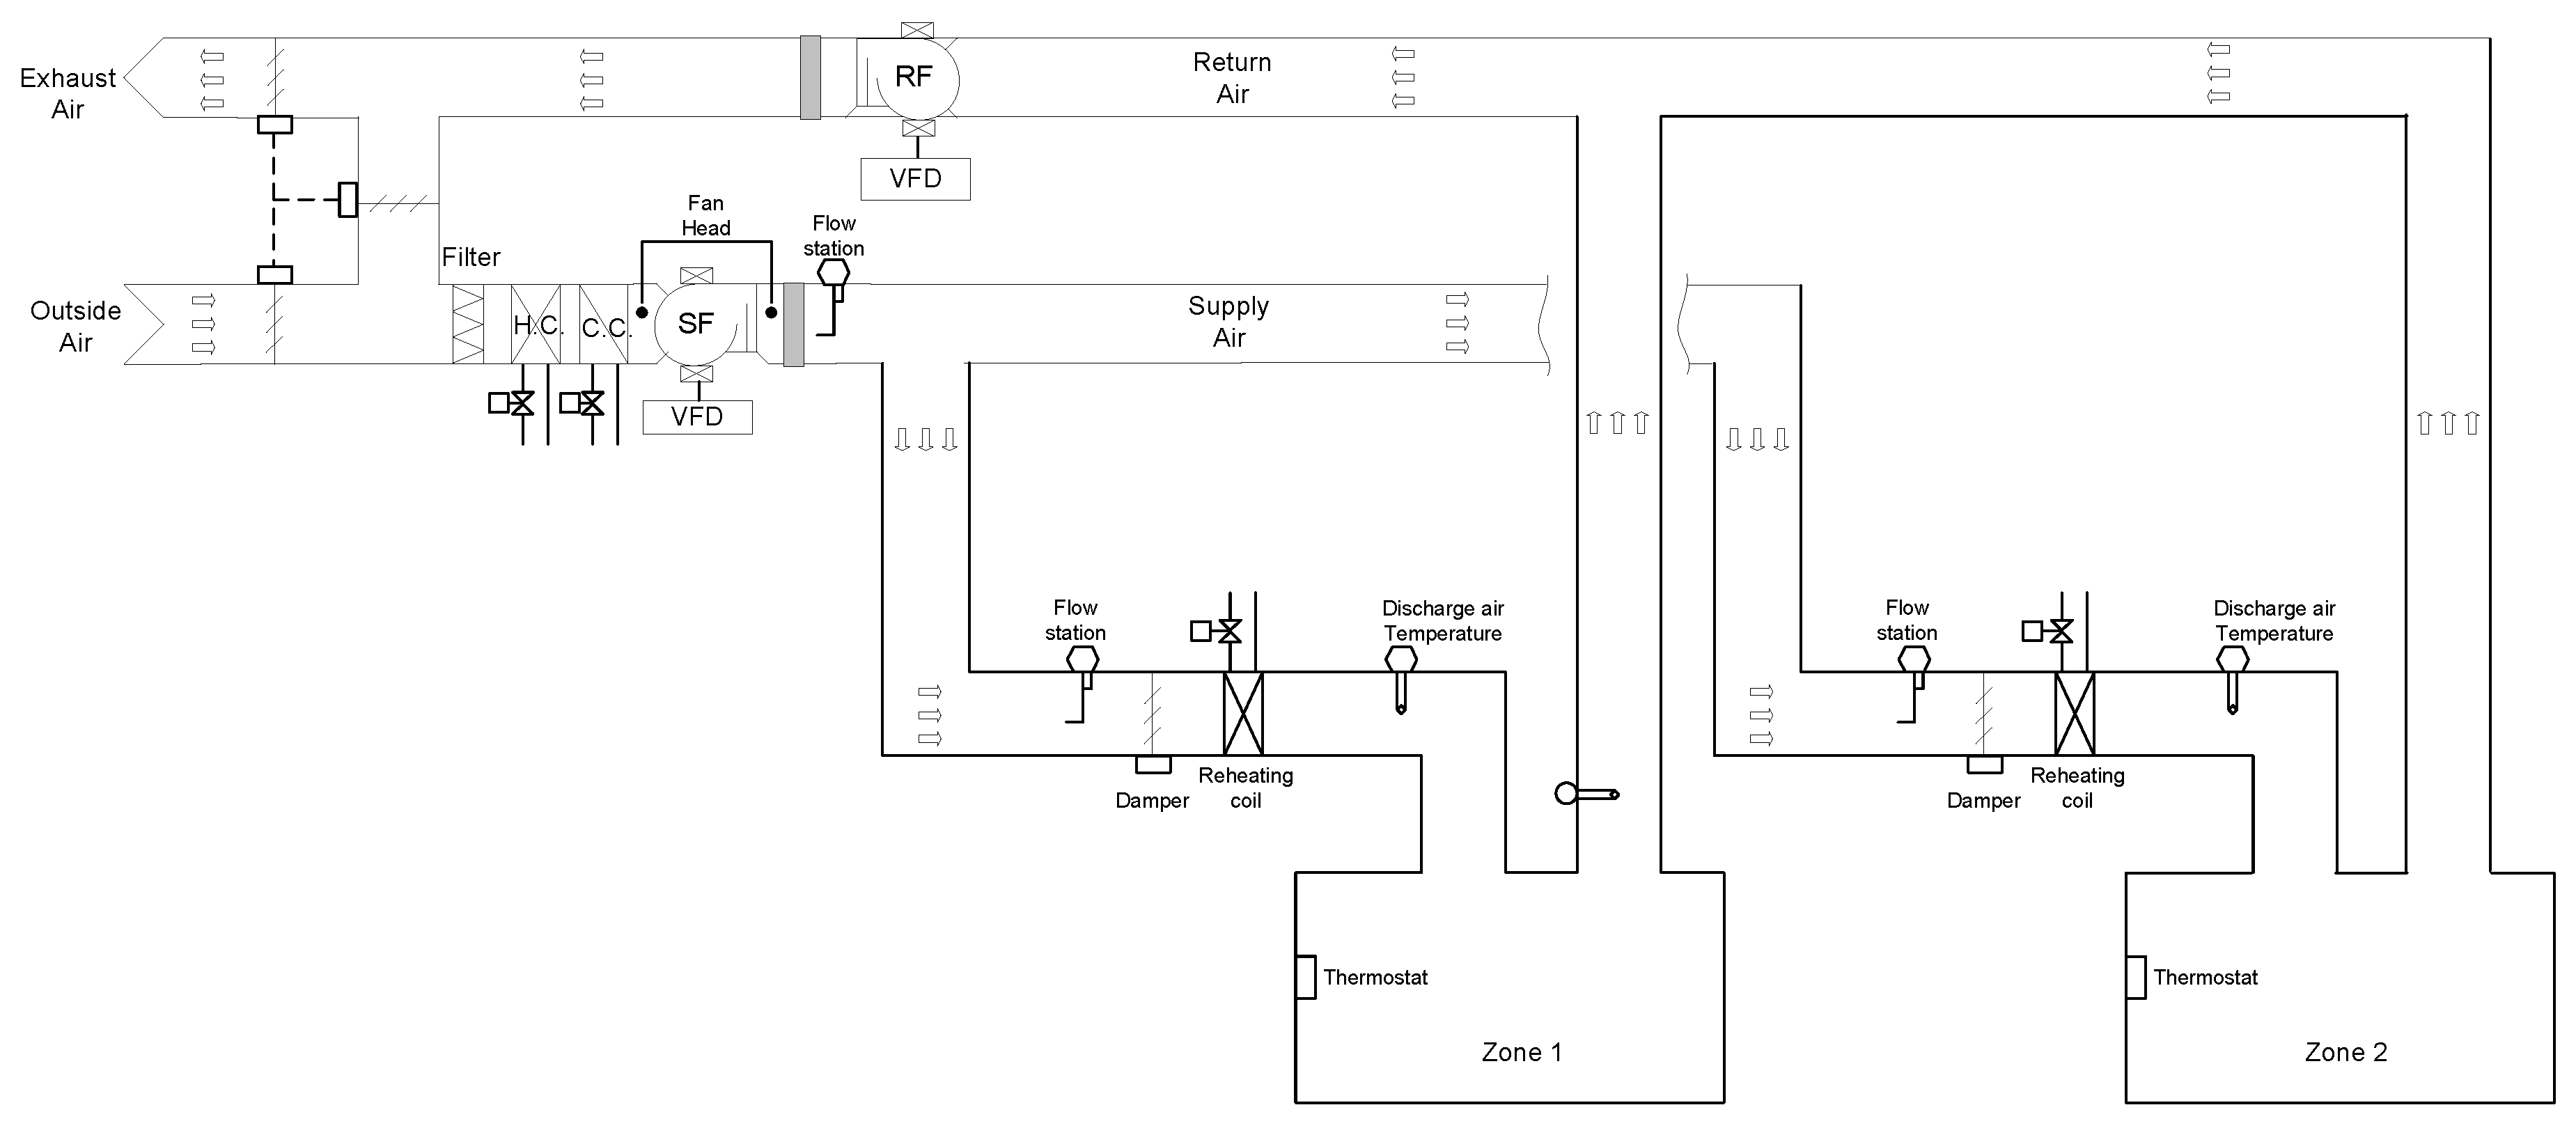
Airflow rate prediction model tests were performed using the HVAC test-bed. The HVAC system in test-bed serves an office and lecture room. The test system is a VAV terminal unit with reheating coil in VAV system. The air handling unit (AHU) was equipped with a cooling coil, heating coil, and supply and return fan with a variable frequency drive (VFD). The VAV terminal unit consists of a damper, an actuator, a reheating coil, a valve, an air flow sensor, and a supply temperature sensor. In order to supply variable air flow rate, it is automatically controlled in conjunction with an indoor temperature sensor. In addition, monitoring, automatic control, and data collection are possible through building automation system (BAS).
Table 1 shows the specification of test-bed [
8] and
Figure 1 shows the schematic diagram of experimental system.
2.2. Data Collection
The operational data of the HVAC system were collected for prediction of the air flow rates of the terminal unit. The data collected for analysis used for the control and monitoring of the VAV terminal unit [
8] were the data of six factors: supply fan speed, supply air static pressure, differential pressure of the supply fan, differential pressure of damper, damper position, and air flow rate. As for air flow rates, since the airflow sensor installed in the VAV terminal unit had low accuracy, the data of air flow rates were obtained by measuring the air velocity with a hot-wire anemometer and converting the measured values into air flow rates. In this study, the differential pressure sensor in damper, VFD of the supply fan, damper actuator in VAV terminal unit, and hot-wire anemometer were used for data collection of the air flow rate prediction model in VAV terminal unit. The data were measured at 1 min intervals from the BAS. Hot-wire anemometers were installed and measured using ASTM D3464-96 [
7]. In addition, another measurement sensor collected data through the BAS.
Before data collection, the standard uncertainty of the hot air anemometer was calculated using Equation (1). After fixing the damper opening rate of the air volume terminal unit (60%), the fan speed was changed (21, 23, and 25 Hz), and the measurements were repeated five times each. The results indicate that the air velocity showed 0.004–0.005 m/s of uncertainty and the air flow rate showed 2.4–3.1 CMH of uncertainty. These values represent less than 1% uncertainty.
The data of the other five factors were collected in real time through the BAS, and a total of 1184 sets of data were collected. Precisely, 75% (888 sets) of the collected data were used as the training data set and 25% (296 sets) were used as the validation data set to conduct multiple regression analysis. The training and validation data sets were classified by random extraction.
Table 2 shows the specifications of measurement sensors used to collect data and the ranges of the collected data.
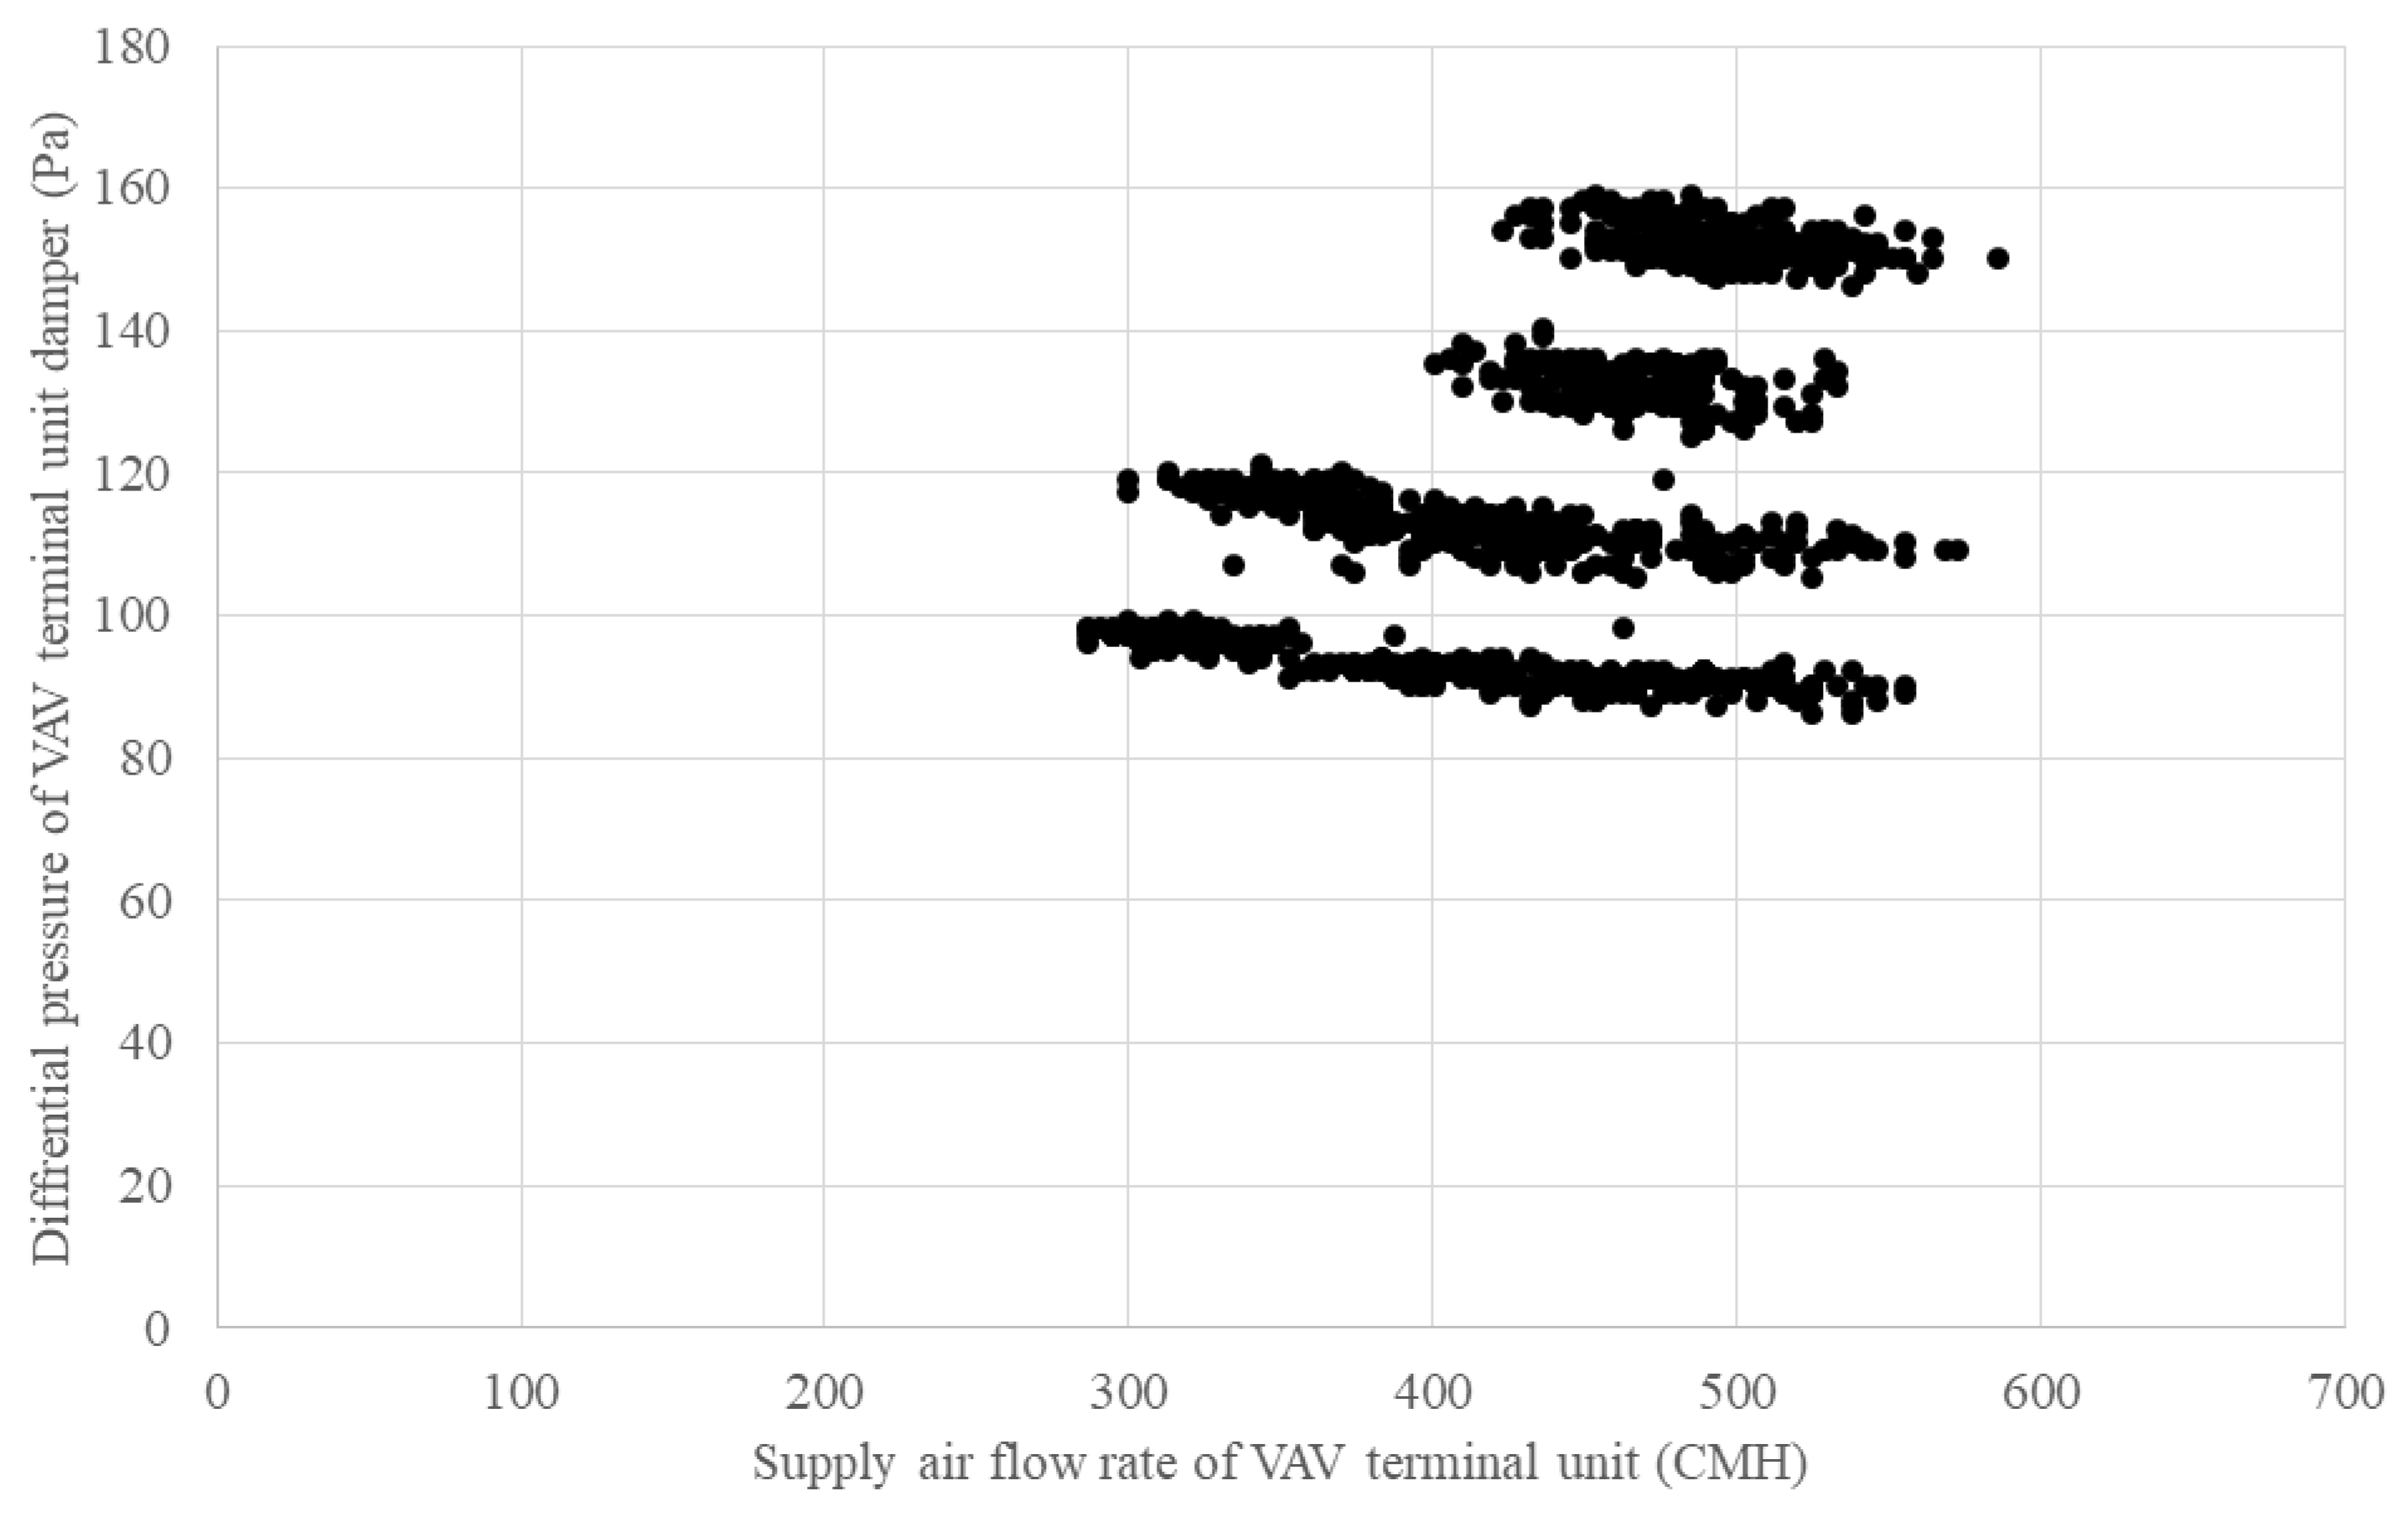
Figure 2 shows the measured air flow rates and differential pressure of the VAV terminal unit. In the case of the air flow rates of the VAV terminal unit, it can be seen that the differential pressure of the VAV terminal unit varies even at the same air flow rate and it is thought to be influenced by the supply fan speed.
3. Derivation of a Predictive Model for Air Flow Rates of the VAV Terminal Unit Using Multiple Regression Analysis
Multiple regression analysis was used for the operational data of the HVAC system to predict the air flow rate of the VAV terminal unit. Briefly, 1185 sets of the operational data of the HVAC system obtained by measurements and air flow rate data were used as variables. Equation (2) shows the relationships between the dependent variable (the air flow rate of the VAV terminal unit) and independent variables (the supply fan speed, supply air static pressure, differential pressure of the supply fan, differential pressure of the VAV terminal unit, and damper position) revealed by multiple regression analysis. In this case, it is assumed that the error term follows a normal distribution with mean 0 and variance
.
For multiple regression analysis, an airflow prediction model was derived using the IBM SPSS Statistics version 25.
3.1. Derivation of Predictors of Air Flow Rates of the VAV Terminal Unit
When operating the VAV terminal unit in the HVAC system, it is controlled through factors related to the air flow rate, and the related factors are monitored as the air flow rate changes. In order to predict the air flow rates of the VAV terminal unit, the factors used for control and monitoring during the operation of the VAV terminal unit were set as variables.
Table 3 shows the symbols and descriptions of the variables.
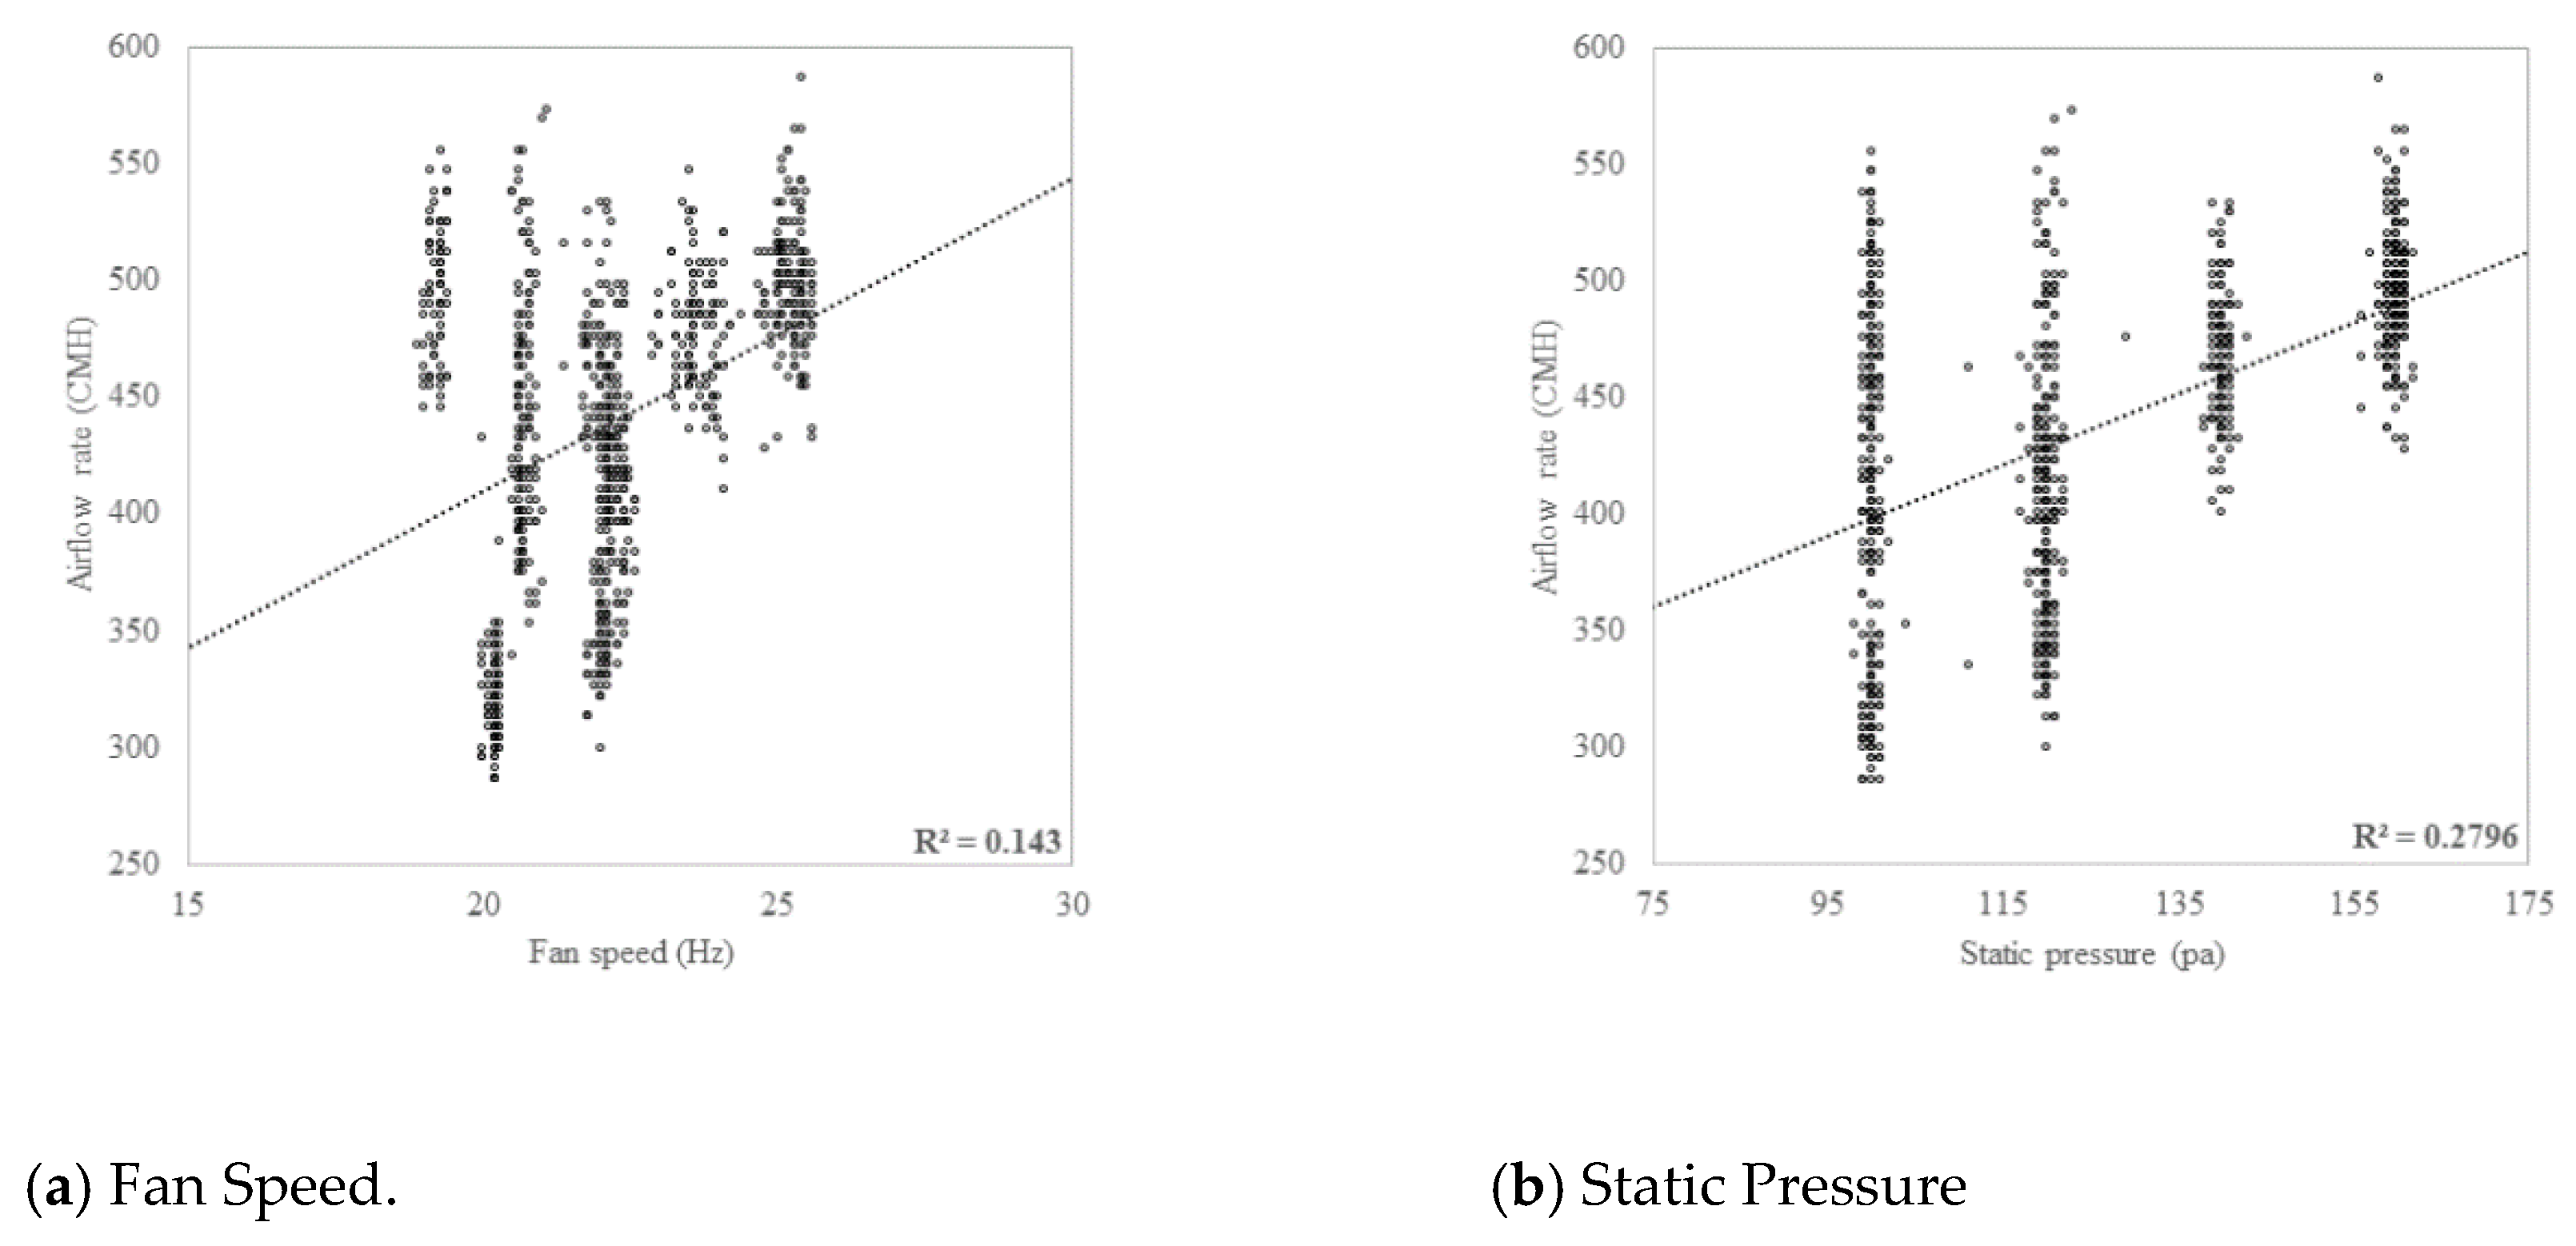
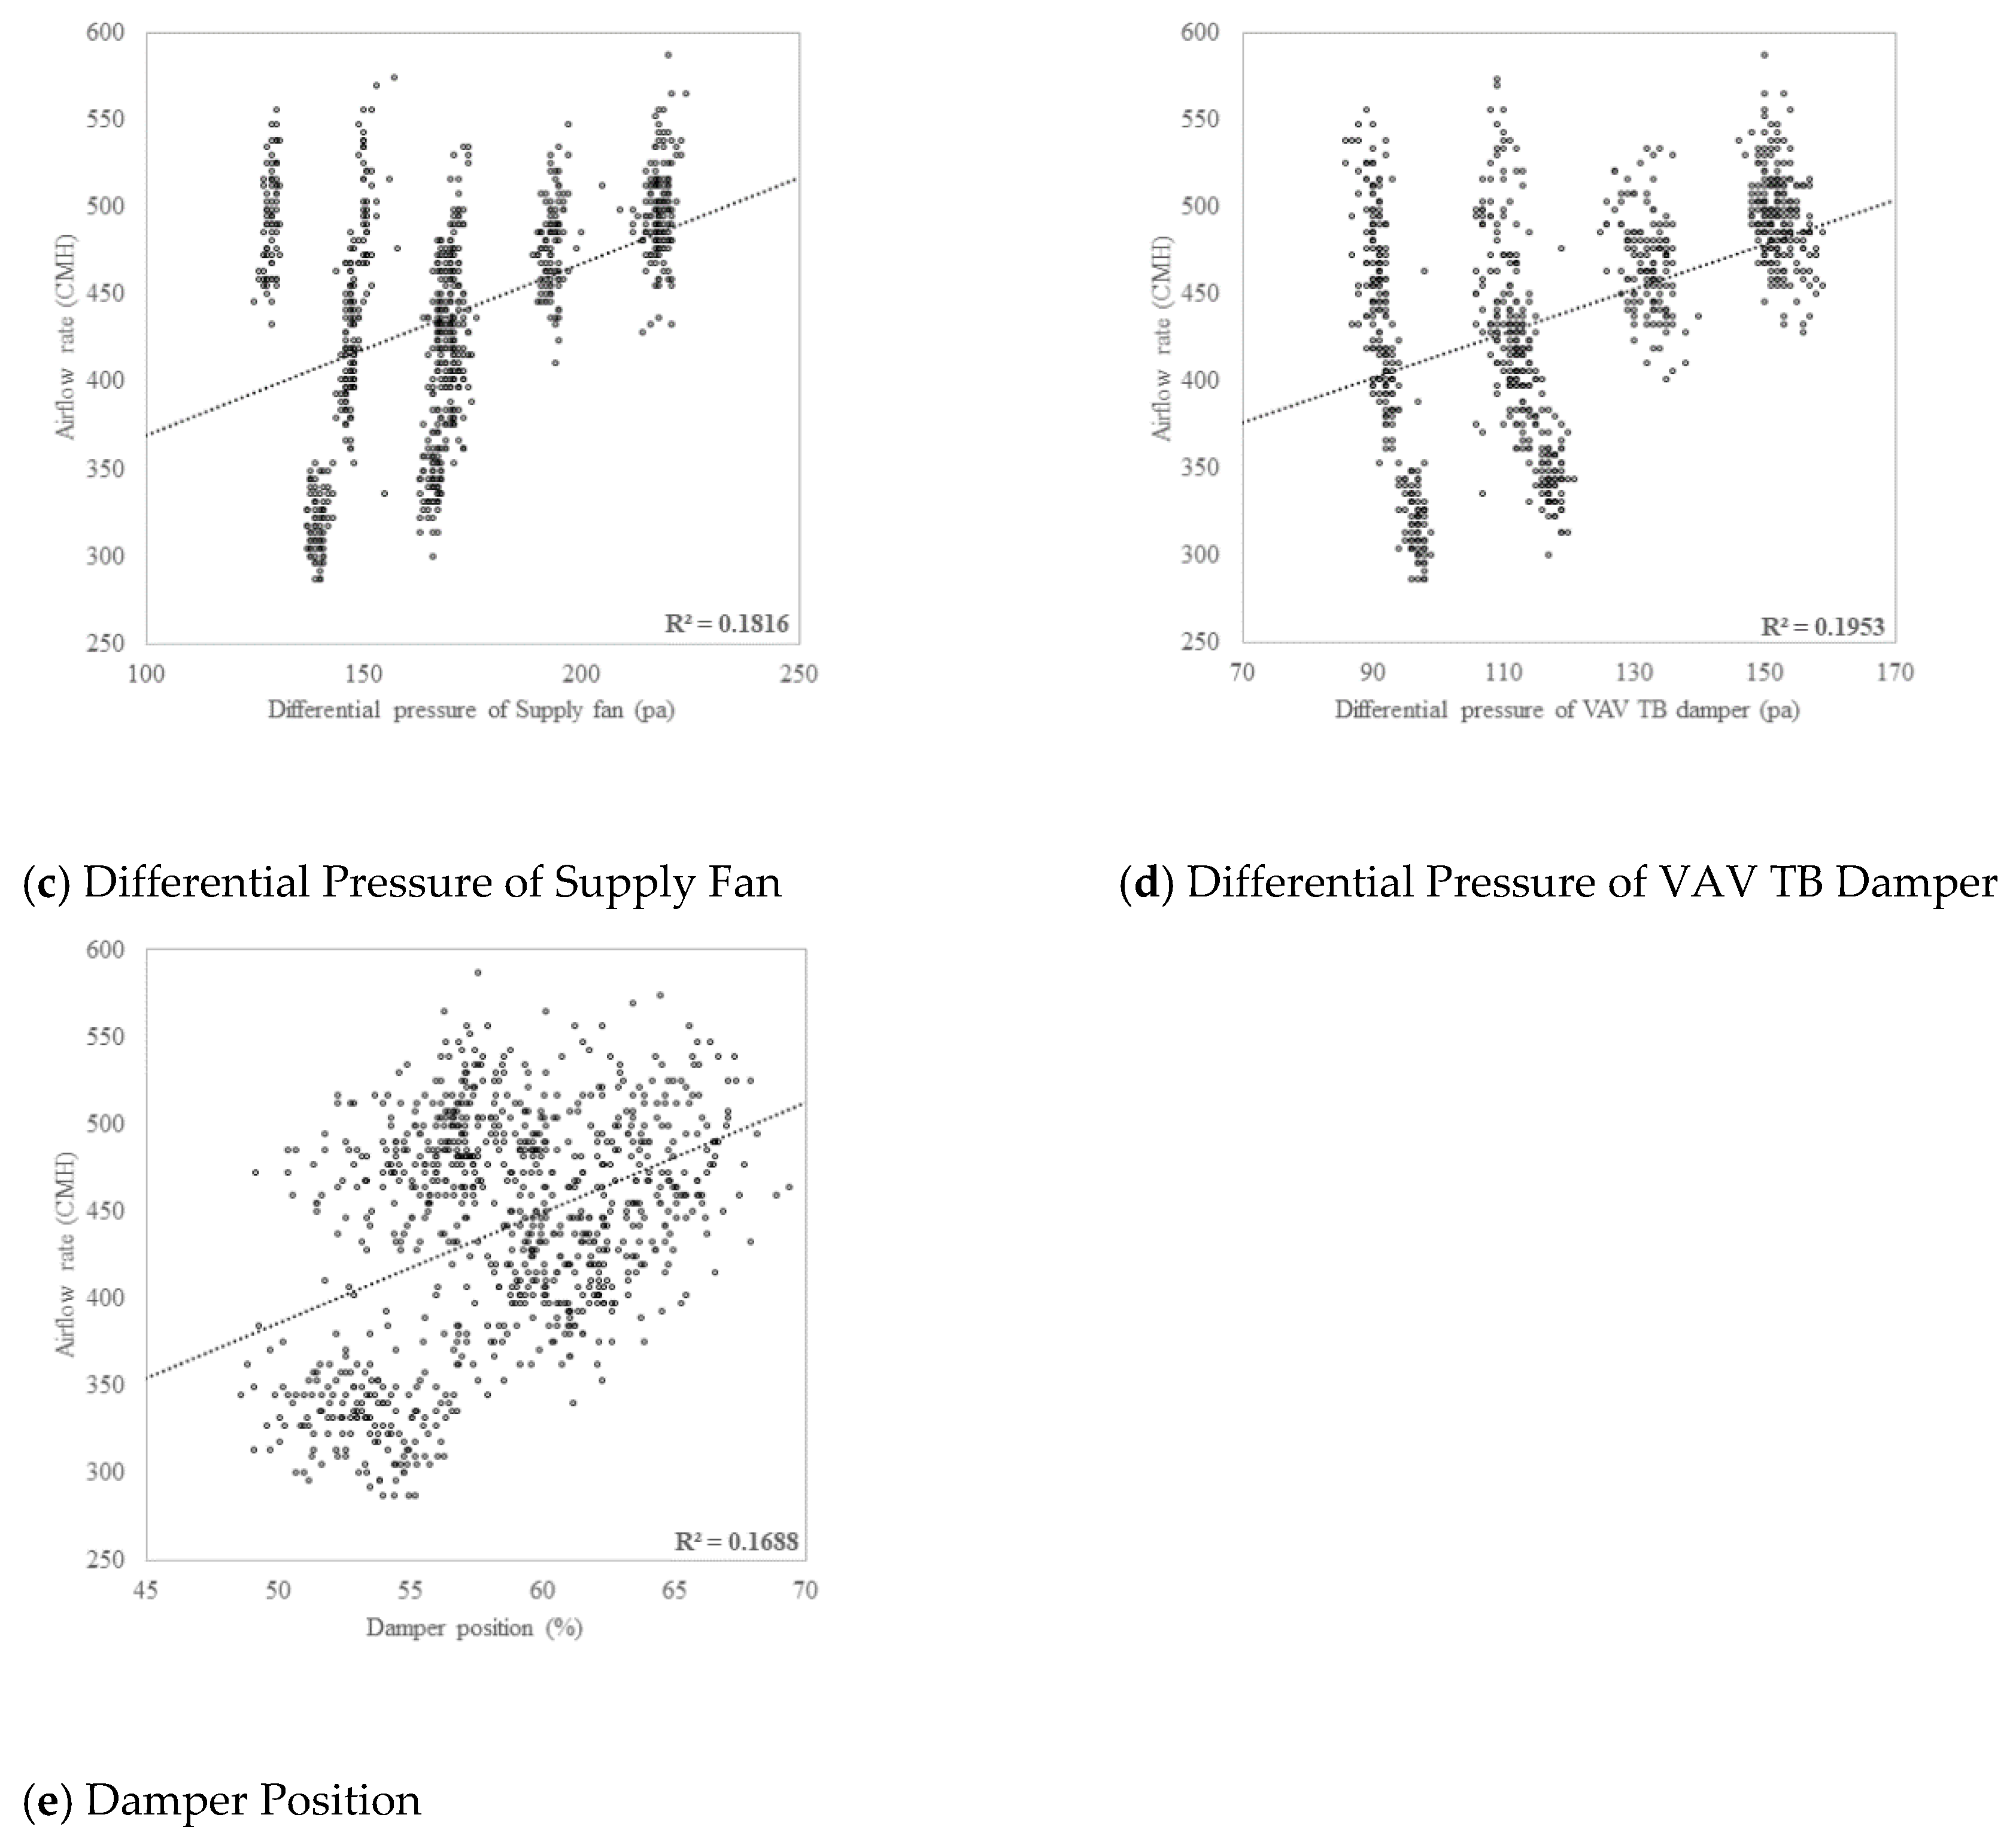
Statistical analysis was conducted to determine whether the selected variables can be used in the predictive model for the air flow rate. Scatter analysis and correlation analysis were performed to examine correlations among variables. The results of scatter analysis and correlation analysis are shown in
Figure 3 and
Table 4, respectively. Static pressure (R
2 = 0.2796) was shown to have a stronger correlation with the air flow rate compared to other variables. The other variables were correlated with the air flow rate in the order of the differential pressure of the VAV terminal unit (R
2 = 0.1953), differential pressure of the supply fan (R
2 = 0.1816), damper position (R
2 = 0.1688), and supply fan speed (R
2 = 0.1430).
Table 2 shows the correlations between the air flow rate and independent variables. As the air flow rate increases, each of the independent variables increases, showing that there is a positive correlation between the air flow rate and each independent variable. The Pearson correlation coefficient showed that the correlation is significant at the 0.01 level and each of the variables showed a high correlation (
p < 0.05). Scatter plot and correlation analysis confirmed that all the independent variables were correlated with the air flow rate, indicating that they can be used as the predictors of the air flow rate.
3.2. Development of a Predictive Model for Air Flow Rates of the VAV Terminal Unit Using Multiple Regression Analysis
A multiple regression analysis was conducted with the variables showing relationships with the air flow rate which can be utilized in predicting the air flow rates of the VAV terminal unit. A predictive model was developed using data obtained by measurements and monitoring. Prior to the development of the prediction model, a variable selection process was carried out to find the variables to be included in the regression model that could best explain the patterns of variations of the air flow rate. Among variable selection methods, we used the forward selection method, which is to enter variables one by one in descending order of importance in terms of the contribution to the model, starting with a regression model with only constant terms. It is the method of building a model by sequentially selecting the variables that make the largest contribution to the regression model, and once a variable has been selected, it continues to remain in the model. In selecting the variables, the
p-value for entry into the model was 0.05, while the
p-value for removal was 0.1.
Table 5 shows the variables for each model derived from the forward selection method. Five models were derived by adding variables one by one in a stepwise manner in descending order of importance in terms of contribution to the model and examining whether the
p-value was below the criterion.
Table 6 shows the results of multiple regression analysis used to derive the predictive model for the air flow rate. The adjusted R
2 value representing the explanatory power of the predictive model was found to be 0.809 for Model 5, 0.806 for Model 4, and 0.796 for Model 3; thus, Model 5 has the highest explanatory power, followed by Model 4 and Model 3. The Durbin–Watson statistic, a test used for detecting autocorrelation in the residuals from regression analysis, was 1.989, which is close to 2, indicating that there is no correlation between error terms.
Table 7 shows the analysis results of coefficients of the regression models and
Table 8 shows the results of ANOVA of the air flow rate prediction model. In the case of Model 3, the air flow rate increases as the supply air static pressure, damper position, and differential pressure of the supply fan increase, but the air flow rate decreases as the supply fan speed and differential pressure of the VAV terminal unit increase. The results of ANOVA revealed that the prediction model was statistically significant with a
p-value of 0.000 (
p < 0.05) for all models. The overall analysis results such as the explanatory power of the model and the
p-value indicate that Model 5 is the optimal model for predicting the air flow rate of the VAV terminal unit.
4. Validation of the Predictive Model for Air Flow Rates of the VAV Terminal Unit
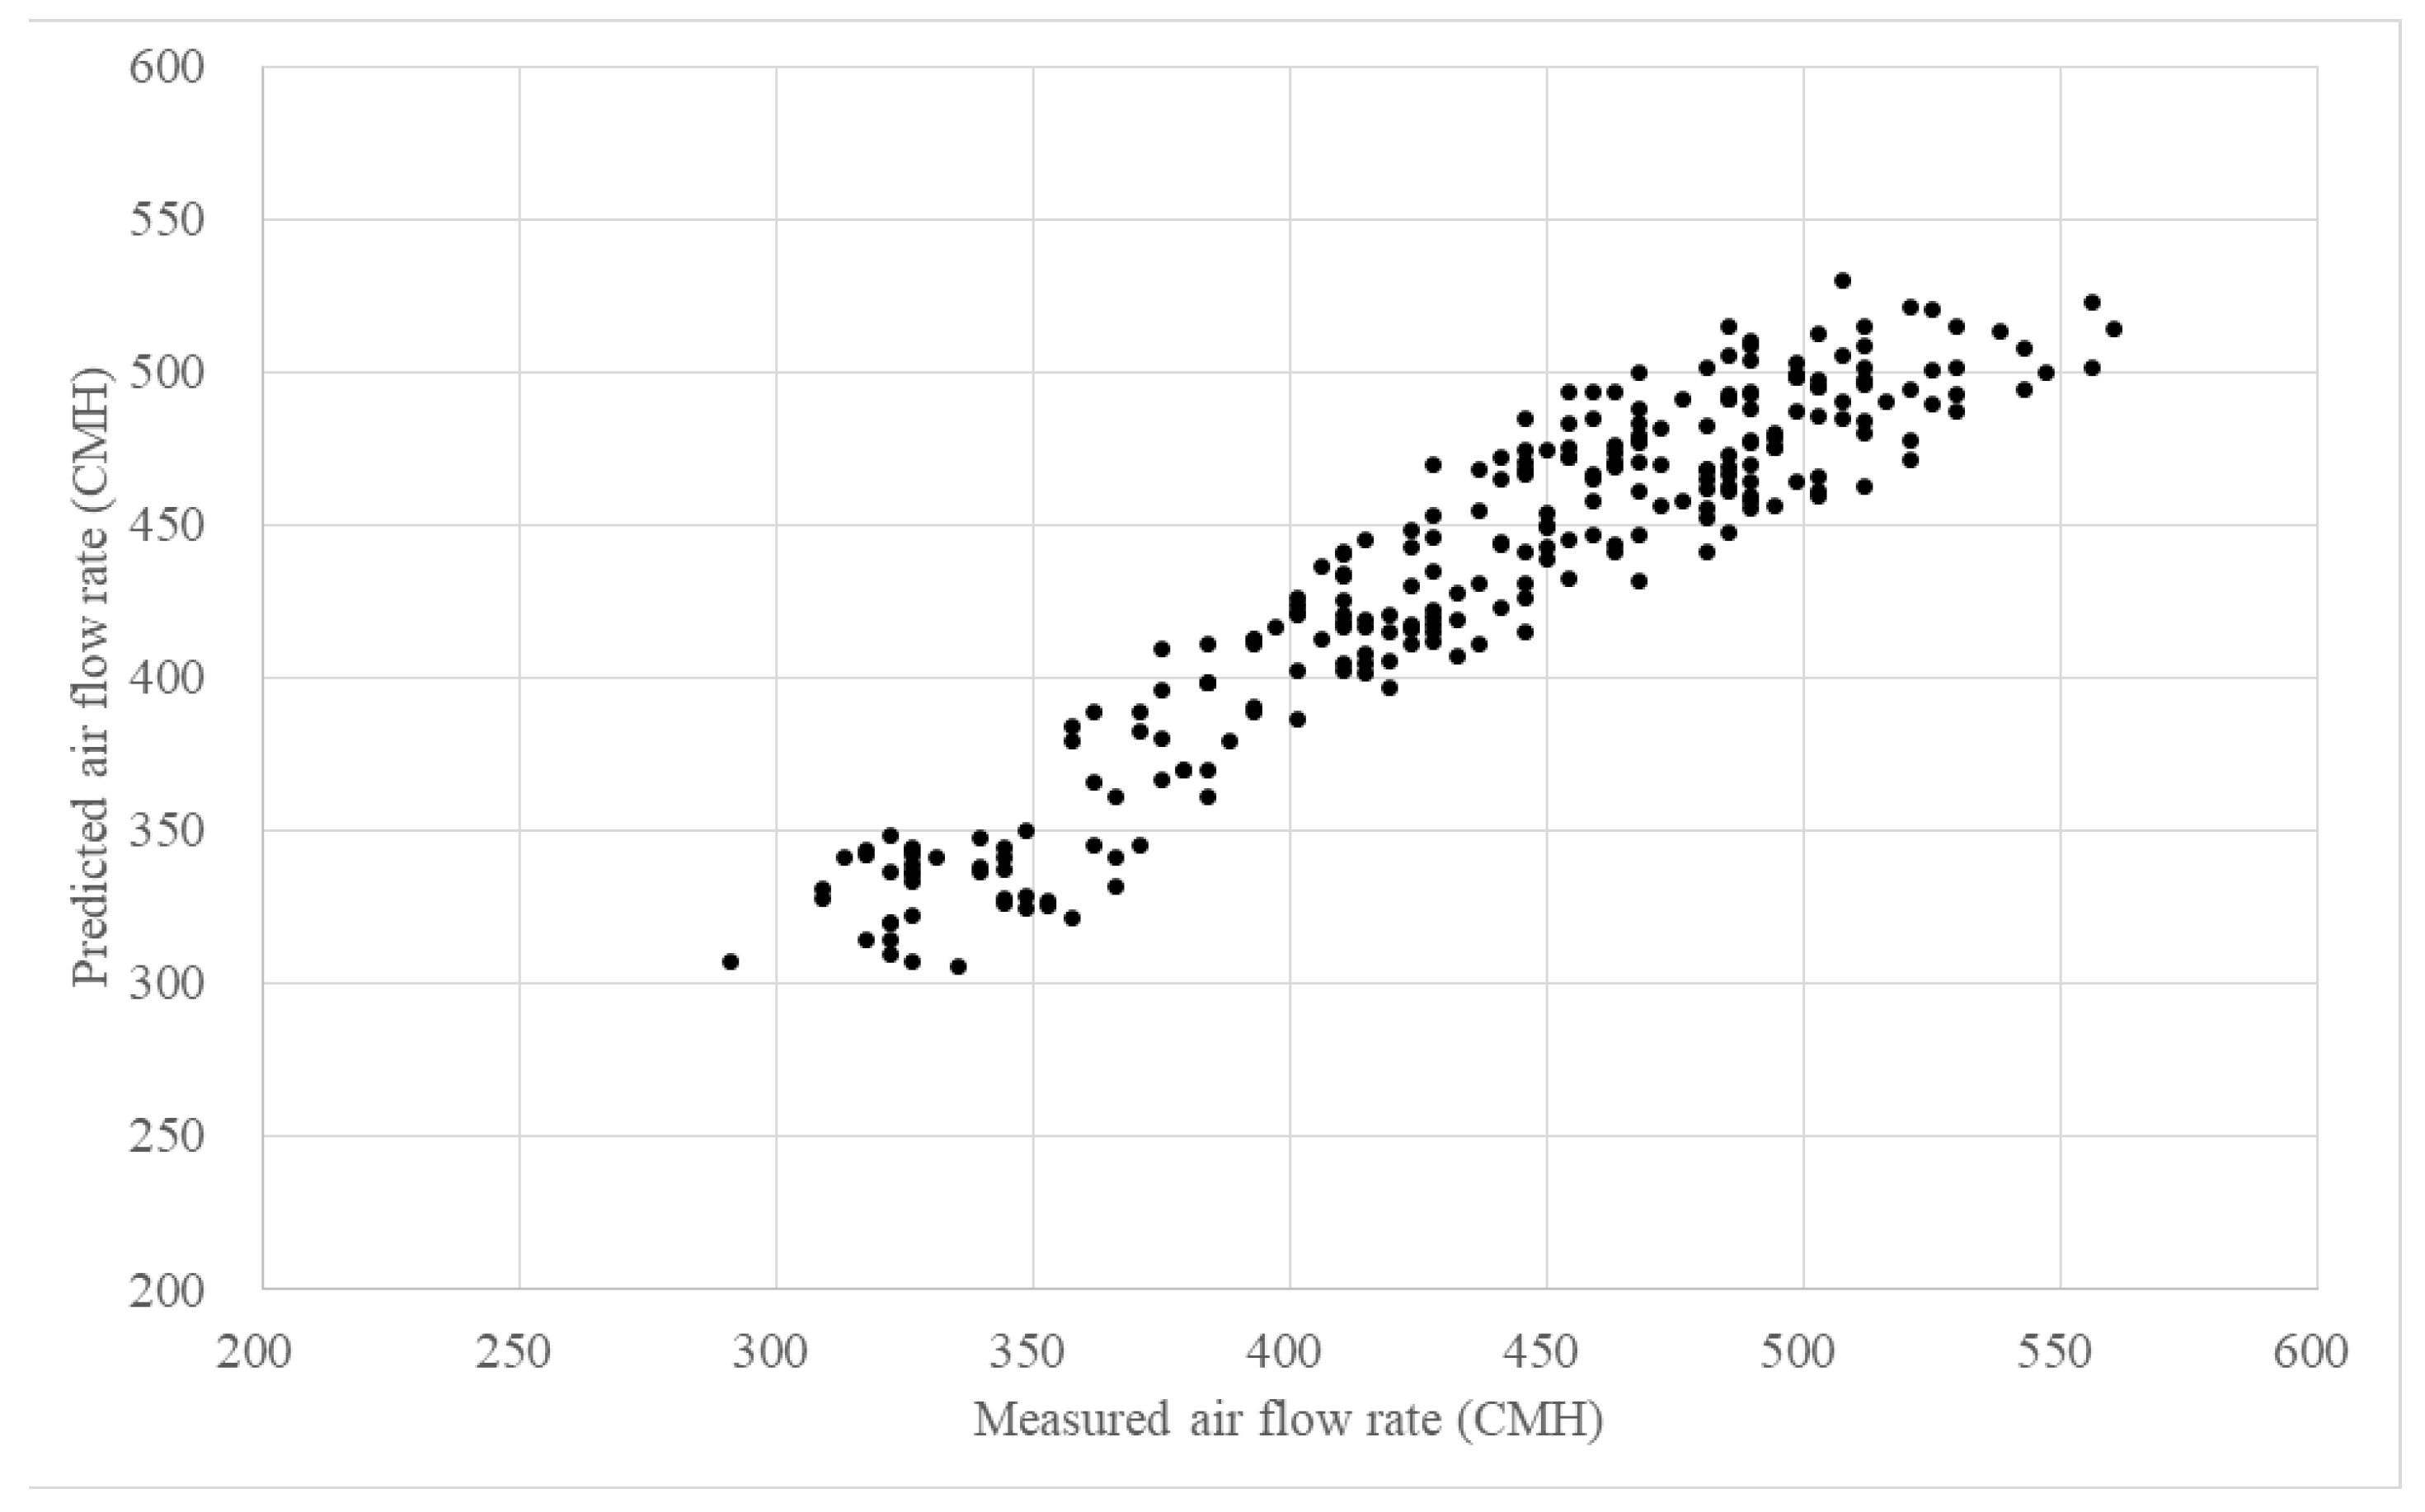
To conduct validation of the model derived through multiple regression analysis, 296 data sets for validation among the collected data were used. In order to validate the performance of the prediction model for the air flow rate through the comparison with the performance of a conventional hot-wire anemometer, the relative error was calculated using Equation (2).
The range of the input and dependent variables used in validation are shown in
Table 9. The predicted air flow rates obtained using the prediction model ranged from 291 to 530 CMH. As a result of comparing the values with the air flow rates measured by the hot-wire anemometer, the relative error ranged from −9.3% to 10.4%, as shown in
Figure 4.
5. Conclusions
In this study, a prediction model for the air flow rate was developed using multiple regression analysis to secure the measurement stability of the VAV terminal unit. The data collected by measurement and monitoring during the operation of the VAV terminal unit were used as the variables for development of the prediction model, and statistical analysis was conducted to determine the relationships between each of the variables and the air flow rate. Correlation and scatter analysis were used to derive the variables that have a significant correlation with the air flow rate and thus can be used for the prediction of air flow rates. Then, a prediction model for the air flow rate was developed by multiple regression analysis, and the validation of the developed prediction model was carried out. Static pressure was found to have the strongest correlation with the air flow rate, followed by the differential pressure of the VAV terminal unit, differential pressure of the supply fan, damper position, and supply fan speed in descending order, and the prediction model using the five variables was found to be the optimal model for prediction of air flow rates. The validation results of the prediction model for air flow rates showed a relative error of less than 10% compared with measured air flow rates. The results of this study showed the potential applicability of a predictive model for air flow rates of the VAV terminal unit in future studies such as development of the control technology for the minimum air flow rate of the VAV terminal unit.
Author Contributions
All authors contributed to this work. H.-J.K. performed the result analysis and wrote the major part of this article, J.-H.S. performed the simulation and data analysis, J.H.J. performed the result discussion and gave technical support, and Y.-H.C. was responsible for this article and gave conceptual advice. All authors have read and agreed to the published version of the manuscript.
Funding
This work was supported by the 2018 Yeungnam University Research Grant (218A380140).
Conflicts of Interest
The authors declare no conflict of interest.
Nomenclature
| Standard uncertainty |
| Standard deviation |
| Number of measurements |
| Relative error |
| Differential pressure of VAV terminal unit damper (Pa) |
| Differential pressure of supply fan (Pa) |
| Static pressure (Pa) |
| Airflow rate of VAV terminal unit (CMH) |
| Measured air flow rate (CMH) |
| Predicted air flow rate (CMH) |
| Damper opening ratio (%) |
| Regression coefficients |
| Fan speed (Hz) |
| Error |
References
- ASHRAE. ASHRAE Handbook 2015 Application : Design and Application of Controls; ASHRAE: Atlanta, GA, USA, 2015. [Google Scholar]
- Cho, Y.H.; Liu, M. Minimum airflow reset of single duct VAV terminal boxes. Build. Environ. 2009, 44, 1876–1885. [Google Scholar]
- Kim, H.; Kang, S.; Cho, Y. A study on the control method without stratification of single duct VAV terminal units. J. Asian Archit. Build. Eng. 2015, 14, 467–474. [Google Scholar]
- Liu, G.; Liu, M. Development of simplified in-situ fan curve measurement method using the manufacturers fan curve. Build. Environ. 2012, 48, 77–83. [Google Scholar]
- Liu, R.; Wen, J.; Waring, M. Improving airflow measurement accuracy in VAV terminal units using flow conditioners. Build. Environ. 2014, 71, 81–94. [Google Scholar]
- Klopfenstein, R. Air velocity and flow measurement using a pitot tube. ISA Trans. 1998, 37. [Google Scholar] [CrossRef]
- ASTM. ASTM D3463-96 Standard Test Method for Average Velocity in a Duct Using a Thermal Anemometer; ASTM: West Conshohocken, PA, USA, 2014. [Google Scholar]
- Kim, H.; Cho, Y. Development of Virtual Air Flow Sensor Using In-Situ Damper Performance Curve in VAV Terminal Unit. Energies 2019, 12, 4307. [Google Scholar]
- Ahn, K.U.; Kim, D.W.; Kim, Y.J.; Yoon, S.H.; Park, C.S. Issues to be solved for energy simulation of an existing office building. Sustainability 2016, 8, 345. [Google Scholar]
- Li, H.; Yu, D.; Braun, J. A review of virtual sensing technology and application in building systems. HVAC&R Res. 2011, 17, 619–648. [Google Scholar]
- Katipamula, S.; Michael, R.B. Methods for fault detection, diagnostics, and prognostics for building systems-A Review, Part I. HVAC R Res. 2005, 11, 3–25. [Google Scholar]
- Freire, R.Z.; Oliveira, G.H.C.; Mendes, N. Development of single-zone predictive equations using linear regression for advanced controllers synthesis. In Proceedings of the Ninth International IBPSA Conference, Building Simulation 2005, Montreal, QC, Canada, 15–18 August 2005; pp. 319–326. [Google Scholar]
- Amiri, S.S.; Mottahedi, M.; Asadi, S. Using multiple regression analysis to develop energy consumption indicators for commercial buildings in the U.S. Energy Build. 2015, 109, 209–216. [Google Scholar]
- Zhou, Q.; Wang, S.; Ma, Z. A model-based fault detection and diagnosis strategy for HVAC systems. Int. J. Energy Res. 2009, 33, 903–918. [Google Scholar]
- Yamaguchi, Y.; Miyachi, Y.; Shimoda, Y. Stock modelling of HVAC systems in Japanese commercial building sector using logistic regression. Energy Build. 2017, 152, 458–471. [Google Scholar]
- Zhao, J.; Liu, X. A hybrid method of dynamic cooling and heating load forecasting for office buildings based on artificial intelligence and regression analysis. Energy Build. 2018, 174, 293–308. [Google Scholar]
© 2020 by the authors. Licensee MDPI, Basel, Switzerland. This article is an open access article distributed under the terms and conditions of the Creative Commons Attribution (CC BY) license (http://creativecommons.org/licenses/by/4.0/).


