Article

Inspection of PN, CO2, and Regulated Gaseous Emissions Characteristics from a GDI Vehicle under Various Real-World Vehicle Test Modes

1
School of Mechanical Engineering, Korea University, 145 Anam-ro, Sungbuk-gu, Seoul 02841, Korea
2
Korea Automobile Testing and Research Institute, 200 Samjon-ro, Songsan-myeon, Hwaseong-si, Gyeonggi-do 18247, Korea
*
Author to whom correspondence should be addressed.
Energies 2020, 13(10), 2581; https://doi.org/10.3390/en13102581
Submission received: 24 April 2020 / Revised: 15 May 2020 / Accepted: 17 May 2020 / Published: 19 May 2020

Abstract

:
Although the chassis dynamometer type approval test considers real-world conditions, there are a few limitations to the experimental test environment that may affect gaseous or particulate emissions such as road conditions, traffic, decreasing tire pressure, or fluctuating ambient temperature. Furthermore, the real driving emission (RDE) test takes a long time, and it is too long to repeat under different experimental conditions. The National Institute of Environmental Research (NIER) test modes that reflect the driving pattern of Korea are not certification test modes, but can be used to evaluate the influence of traffic conditions because these modes consist of a total of 15 test modes that vary according to average speed. The use of the NIER #03, #09, and #13 modes as low-, medium-, and high-speed modes allow for gaseous and particulate emissions to be measured and analyzed. Additionally, the worldwide harmonized light-duty vehicle test procedure (WLTP), the certification mode of Europe, is used to test cycles to investigate the difference under cold- and hot-engine start conditions. The engine operating parameters are also measured to evaluate the relationships between the various test conditions and test cycles. The regulated and greenhouse gas levels decrease under various driving conditions, but the particle number (PN) emission level shows a different trend with gaseous emissions. While the PN and CO2 results dramatically increase when the air conditioner is on, tire pressure conditions show different PN size distributions: a large-sized PN fraction, which contains particles larger than 100 nm, increases and a sub-23 nm-sized PN fraction decreases. Under cold-start conditions in the WLTP modes, there are much higher PN emissions than that of an engine under hot-start conditions, and the sub-23-nm-sized PN fraction also increases.

1. Introduction

Currently, worldwide regulations that limit vehicle-related hazardous pollutant emissions, such as total hydrocarbon (THC), carbon monoxide (CO), nitrogen oxide (NOx), particulate matter (PM) and particle number (PN) emissions, in the automotive sector have been stricter than those in the past [1,2]. In particular, greenhouse gases, NOx, and particulate emissions are the main issues for automotive manufacturers and environmental departments of nations worldwide, since they can directly or indirectly affect global warming or health issues [3,4,5]. In fact, NOx and particulate emissions have been the main issues of concern for diesel engines and not gasoline engines [5,6,7]. However, as technical trends have recently changed from port fuel injection (PFI) to gasoline direct injection (GDI) engines, the share of direct injection engines in whole gasoline engine vehicles has increased, and the PN and PM emissions level of GDI engines without particle filters has become another problem. The GDI engine can improve engine power and fuel economy with an increased compression ratio and volumetric efficiency; however, if the internal air–fuel mixture is mixed inconsistently, a wall-wetting phenomena during fuel-rich engine operation, such as engine start or aggressive acceleration, may cause an increase in PN emissions compared with those of a PFI engine or a diesel engine with a diesel particulate filter (DPF) [8,9,10,11,12,13].
In particular, in Europe, which introduced as the worldwide harmonized light-duty vehicle test procedures (WLTPs) and real driving emission (RDE) tests in 2017, the regulation of PN emission concentration for GDI vehicles was established to be 6 × 10¹¹ N/km for the chassis dynamometer certification test and conformity factors (CF) of 2.1 and 1.5 for the RDE certification test [4,14,15]. Furthermore, current PN regulations only count PN emissions with sizes above 23 nm, but additional studies, which have extended the regulated range to 10- to 23-nm-sized particles, have been conducted. The 10- to 23-nm-sized particles comprise approximately 40% to 50% of exhaust particles and are much more hazardous to human health [16,17,18]. Therefore, the extended regulation will promote significant changes to not only the chassis dynamometer test, but also the RDE test method; moreover, in the case of GDI vehicles, a gasoline particulate filter (GPF) will be indispensable even if it can decrease the engine power or level of fuel efficiency caused by an increase in exhaust pressure [2,12,13,19,20,21]. Thus, the development of four-way catalysts that combine a GPF and a three-way catalytic converter (TWC) have been experimentally studied by manufacturers and environmental groups to estimate the PN emission level of GDI vehicles under RDE conditions using a portable emissions measurement system (PEMS).
The type approval test, carried out using a chassis dynamometer under laboratory circumstances, has a few limitations in that laboratory conditions cannot reflect real-world driving conditions such as ambient conditions, road load, driver deviations, or traffic. Because of these limitations, in Europe and the US, improved certification test modes such as WLTP and five combined cycles are applied to reduce the CO2 gap between the type approval test and RDE test, and the type approval test results of regulated gaseous and particulate emissions are investigated and complemented using gas PEMS or PN PEMS devices [22,23,24,25,26]. Previous studies indicate that there are variations between the CO2 and regulated emissions of a vehicle because they are affected by the driving conditions and several other parameters [1,27,28,29,30]. The air conditioning systems of a vehicle can affect the gaseous emission and CO2 according to the research of Martin et al. [31]. Liqiang et al. examined the impacts of air conditioner usage and low temperature conditions on solid particle and black carbon emissions. With air conditioner usage, the average engine load was increased by 25% and solid PN was increased by 132% compared to the air conditioner (A/C) off condition [32]. Nikolian et al. conducted the test using 12 test vehicles in the new european driving cycle (NEDC) and Artemis test cycles with different road load and electric load conditions to evaluate the influence on CO2 emissions. The highest increase in CO2 emissions was 14% when road loads were increased by about 10%, and the CO2 emissions gap was over 20% when 600W electrical loads were added [33]. Sina et al. tested deflated tires to investigate the impact to CO2 and fuel consumption and revealed that an increase in power loss due to tire pressure leads to more fuel consumption and CO2 emissions [34]. In particular, traffic conditions significantly affect vehicular emissions more than any other condition; therefore, investigations of urban area emissions, which account for approximately 40% to 50% of all emissions, are important to analyze for their emission level characteristics [5,11,18,20,25,35,36]. In the case of Korea, to monitor the domestic greenhouse gases and various hazardous emissions from vehicle exhaust and establish emission factors for the transportation sector, National Institute of Environmental Research (NIER) test modes have been used for experimental test modes and not for type approval because NIER test modes reflect driving patterns in Seoul. The NIER test modes consist of a total of 15 test cycles from NIER #01 to NIER #15 to be able to evaluate diverse traffic conditions that range from a highly congested urban area featuring frequent idle periods and periods of acceleration to a motorway area where the average speed of vehicles is much higher and with much less idling than those in an urban area. Despite the various test cycles of the NIER modes, the NIER test modes only have discrepancies in driving speed without other driving conditions, such as road conditions, tire pressure changes, air conditioner use or ambient temperature [16,37].
The objective of this study is to examine the influence of vehicle speed and various driving conditions on gaseous and particulate emissions from GDI vehicles. Four test cycles, NIER #03, NIER #09, NIER #13 and WLTP, were used in this study, and five driving conditions (coast down (CD) value, test mass, air conditioner use, tire pressure, cold start) were evaluated to analyze their impact on the emission level. Furthermore, the engine operating parameters, such as engine speed, fuel injection pressure, air–fuel ratio and spark timing, were measured to investigate the correlations among driving conditions, engine parameters, and exhaust emissions [38,39,40].

2. Experimental Details

2.1. Test Vehicle and Fuel

The main characteristics of the tested vehicle are summarized in Table 1. An 11-MY 2.4 L naturally aspirated (NA) GDI engine with a compression ratio of 11.3:1, which complies with the ultra-low-emission vehicle (ULEV) II regulations, was used for the test vehicle. A TWC was equipped, and double split injection (DSI) strategies and spark timing delays were used in this test engine. An on-board diagnostic (OBD) scanner was used to monitor engine operating parameters, such as engine speed, fuel pressure, lambda value, and spark timing.
Previous studies show that the constituents in fuel, such as ethanol blends, sulfur, or metallic components, can increase PM and PN emissions [9,13,16,41,42]. Before the test, the test fuels were analyzed from K-Petro, Korea Petroleum Quality and Distribution Authority, and all tests were conducted with the same commercial fuel to minimize the influence of fuel characteristics. Table 2 shows the main features of the used test fuel and test method.

2.2. Experimental Apparatus

Figure 1 shows a schematic diagram of the experimental apparatuses used to measure PN and regulated emissions. A 48-inch single-roll chassis dynamometer (AVL), a full-flow constant volume sampler (CVS) exhaust dilution tunnel system (AVL), a gaseous emission analyzer (AVL, AMA i60), and PN measurement systems (AVL, AVL 489 Particle Counter and TSI, Engine Exhaust Particle Sizer) were employed. An engine exhaust particle sizer (EEPS) measured particle sizes ranging from 5.6 to 560 nm with a 10-Hz frequency resolution, while the AVL particle counter (APC) measured particle concentrations except for particles under 23 nm according to the European particle measurement program (PMP) [17,43,44]. The flow rate of the dilute exhaust gas through the CVS tunnel was 12 m3/min under standard conditions.

2.3. Test Cycles and Conditions

The average speed and driving conditions of test cycles affect gaseous and particulate emissions [13,37,45,46,47,48]. In the US, an S-federal test procedure (FTP) mode has recently been introduced because the original FTP cycle did not represent real-world driving conditions. Additionally, the European Union’s commission replaced the NEDC test mode with the WLTP test mode, which is similar to real-world driving conditions [14].
In this study, a total of four driving cycles were used to evaluate the impact of low, medium, and high speed: NIER #03, NIER #09, NIER #13, and WLTP. The NIER driving modes are test modes made by the National Institute of Environmental Research of South Korea, and those modes reflect the urban driving pattern in South Korea. The NIER #03 mode reflects the characteristics of urban areas that are congested and have low traffic speeds with frequent acceleration and deceleration. Repeated acceleration and deceleration with low speed are the main factors that produce much higher emission levels than that in rural or motorway areas where vehicles are driven at a fuel-efficient speed, so analyses at low speed test modes are crucial [43,48,49,50]. The medium-speed and high-speed tests are conducted with the NIER #09 and NIER #13 modes, and the WTLC mode can cover low- to extra-high-speed tests. Figure 2 and Table 3 indicate the characteristics of the NIER and WLTP modes.
The dominant variables related to the gaseous emissions of the vehicle—tire pressure, air conditioner use, test weight, and coast down (CD)—were chosen based on prior experimental results [27,28]. An extra 200 kg of weight was added to simulate additional passenger and load weight, and the tire pressure was reduced by approximately 0.5 bar according to statistics from the European Union [28].
Since the test vehicle was an in-use vehicle, which was released in 2011, there were probably some changes in the previously approved base coast down (referred as BCD in this study) values caused by its high mileage and the wear of its engine parts or chassis [51]. Additionally, an extra 200 kg of weight could affect the coast down value of the test vehicle. Therefore, we remeasured the coast down of the test vehicle twice, with 200 kg of additional mass and without 200 kg (referred as 200CD and RCD in this study, respectively).

3. Results and Discussions

3.1. Engine Operating Parameters and Regulated Gaseous Emissions

Table 4 shows the averaged engine operating parameters of each test. While the test vehicle was driven, the representative engine operating parameters, such as the air–fuel ratio (lambda value), fuel injection pressure, spark timing, and engine speed, were recorded by the OBD scanning tool.
With the use of the air conditioner, the engine load is increased and, to make up for this, the engine operating parameters change to supplement an additional engine load. According to Table 4, when the air conditioner is on, the increased engine load causes a faster average engine speed, richer fuel injection, higher fuel injection pressure, and delayed spark timing. As the tire deflates, its contact with the road surface becomes wide and leads to increased friction, which affects the engine operating conditions [34]. However, in this study, the test conditions, such as tire pressure and increased test weight, show an influence that is not linear, unlike the use of the air conditioner. The characteristics of the NIER #03 mode, e.g., repeated acceleration–deceleration with a long idle period, affect the richer fuel injection much more than the other test modes, and as the average speed of the vehicle increases, the test vehicle enters a more fuel-efficient area, so the lambda value increases. In addition, the spark timing was advanced by between 5 and 10° crank angle before top dead center (CA BTDC). since the engine required higher speeds to follow the NIER#09 and #13 test cycles. Road load also slightly affected engine operating parameters; fuel injecting pressure was increased, and spark timing was little retarded compared to base coast down condition. Coast down measurement tests showed that the driving energy was higher than the base coast down conditions when evaluated using the remeasured coast down values (RCD and 200CD conditions). For all coast down conditions, the engine speed was almost the same, but the engine load was different for each case due to the resistance of road load. Consequently, the spark timing was a little retarded due to the shortened combustion duration, which can occur with high-load driving. Cold- and hot-start tests were conducted for only the WLTP mode. Engine and emission aftertreatment systems need more fuel for the warm-up process after starting. The warming up process causes an increase in fuel injection and a higher fuel injection pressure than those of driving after the warmup, as indicated in Table 4.
Table 5 presents the regulated gaseous emission results of the tests. As mentioned, as the average speed of test vehicle increased, a large amount of air enters the engine, leading to a more lean air–fuel ratio. Moreover, the fuel injection pressure becomes higher than at a low speed and spark timing is advanced to increase the combustion efficiency and engine power. Therefore, the THC emissions decrease from 0.1195 g/km (NIER #03) to 0.0051 g/km (NIER #13). Higher THC emissions are produced during the cold-start test (WLTP) because of the increased fuel injection for the warming up process. The CO emissions show similar trends to that of the THC emissions. Both THC and CO emissions are sensitive to the lambda value and spark timing, but there is almost no correlation with fuel pressure [38]. The frequent transient characteristics of the NIER #03 mode caused more gaseous emissions than that of other tests, which are driven with less transient speed and idling and an increased steady speed. The gaseous emission results for other test modes fluctuate at similar levels. The emission standard of test vehicle complying with the ULEV II is as follows: 0.034 g/km for non-methane organic gas (NMOG), 1.31 g/km for CO, and 0.044 g/km for NOx. Even though the NIER test modes are not type approval test modes, the complete regulated gaseous emissions from the test vehicle were below the emission standard, except for air conditioner usage or cold start condition. These results may mean that a gasoline vehicle equipped with a three-way catalytic converter can fully respond to gaseous emission regulations under RDE tests which are separated test routes in urban, rural, and motorway areas. Gasoline-fueled vehicles are known for their lower NOx emissions than diesel vehicles. In this study, the results are similar to those of previous studies and indicate that the average NOx emission from all tests is 0.0263 g/km. However, the maximal NOx emission result is 0.1003 g/km, which exceeds both the European and US emission standards in the NIER #03 mode with the air conditioner on. It may be possible that the high load to the engine caused by the NIER #03 mode and use of the air conditioner affects the raw NOx emissions, which surpasses the purification capacity of the TWC of the test vehicle.

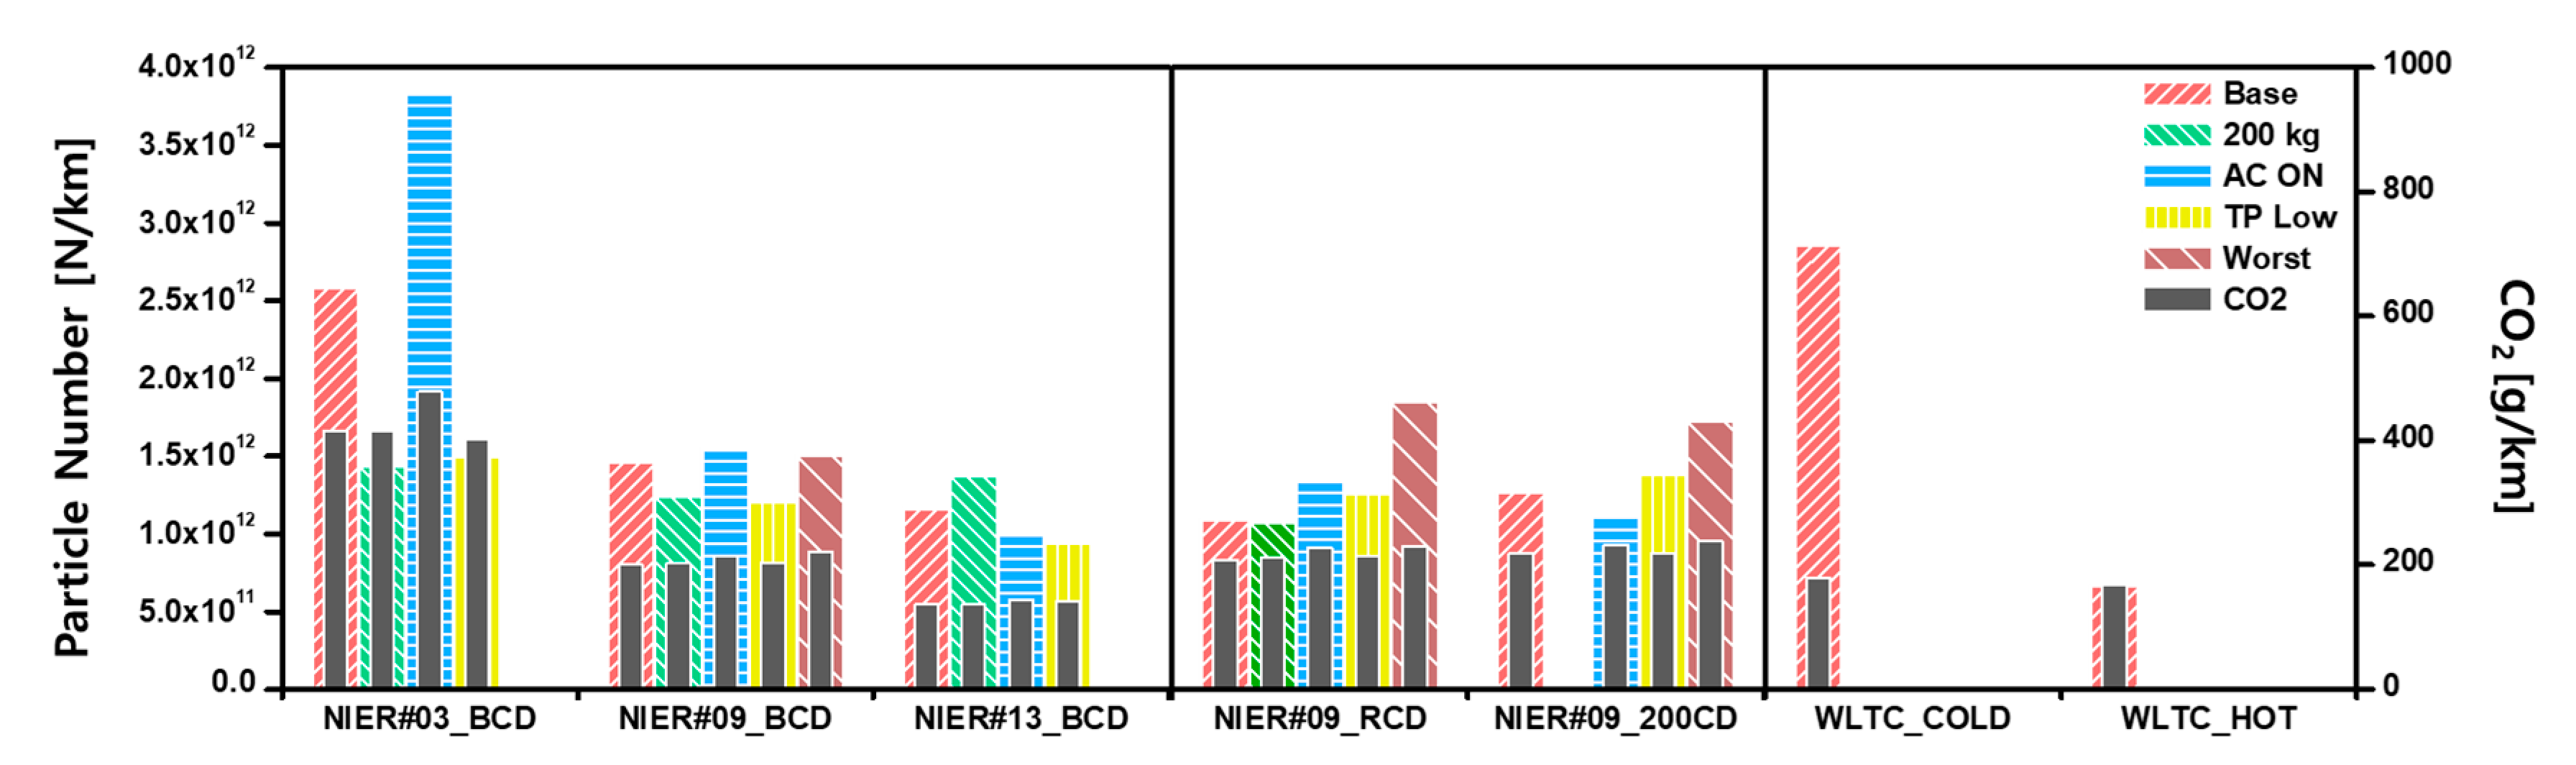
3.2. CO2 and PN Emission Results

Figure 3 shows the CO2 emissions and PN results of each test. The wide and patterned bar graph indicates the PN emissions and the CO2 emissions are presented with a narrow bar graph that is in front of the PN graph. The NIER #03 mode results show that, when the air conditioner is on, the PN emissions are affected and increase by approximately 48%. Furthermore, when the air conditioner is on, the air–fuel ratio becomes richer, fuel is injected at a higher pressure, and the spark timing is delayed much more compared with those in other tests, which presents contrary results to previous studies. A high fuel injection pressure helps with the atomization of fuels, which lowers the PN emissions [52]. In addition, the delayed spark timing due to the increased engine load can improve combustion conditions because of a sufficient air–fuel mixture time. Consequently, the PN emissions decrease when the well mixed air–fuel mixture is burned [10,13,39,40,53]. This increasing trend in PN, which is discordant with the engine operating parameters, may come from the characteristics of the NIER #03 mode reflecting congested and heavy traffic urban driving conditions. Repeated and frequent acceleration and deceleration can have more influence than engine operating conditions, such as fuel injection pressure or spark timing. Similar trends are shown under the lower tire pressure condition and extra test mass condition, in which the PN results decrease by approximately 44.7% and 42.1%, respectively. The CO2 emissions increase from 416.4 g/km to 479.0 g/km (approximately 15.1%) when the air conditioner is on and decrease by approximately 3.2% under lower tire pressure conditions. There is little difference in CO2 under extra test mass conditions (increased 0.1 g/km).
In the normal condition test, the PN result of the NIER #09 mode decreases by approximately 43.4% (2.59 × 10¹² #/km to 1.47 × 10¹² #/km) compared with that of the NIER #03 mode, and CO2 decreases by approximately 51.9% (416.4 g/km to 200.1 g/km). As the acceleration section portion decreases, the average air–fuel ratio and fuel injection pressure increases, and the spark timing is advanced. In a similar manner to the NIER #03 mode test, when the A/C is on, the tests show increasing PN emissions. Both fuel injection pressure and spark timing are changed to circumstances in which the PN emission will decrease, which is a high fuel pressure and delayed spark timing. However, considering the THC and CO2 emissions, more fuel may be injected than that under normal conditions, which causes an increase in PN emissions. When the A/C is on, CO2 emissions increase by 7.6% (A/C on) and 10.61% (worst case). In the case of an additional 200 kg and low tire pressure (TP) conditions, PN emissions decrease by approximately 15.2% and 17.7%, respectively, and these diminishing trends in PN are similar to the NIER #03 mode results. There are few changes in the engine operating parameters, so these differences may be caused by the tolerance of the measuring devices. Because the NIER #13 mode is the most fuel efficient among the tested cycles, the CO2 emissions are from 137.0 to 145.1 g/km, which is much less than those of the NIER #03 and NIER #09 test modes. Moreover, there is no idling in the NIER #13 test mode and only some acceleration sections, as seen in Figure 2, so there exists little influence from acceleration and deceleration. Therefore, a different aspect is shown in the NIER #13 mode: the PN emissions when the A/C is on decrease by approximately 14.1%, while the PN emissions under the extra mass condition increase by approximately 18.6%. The vehicle engine needs more load when the A/C is on and under low TP conditions. Thus, the average fuel injection pressure slightly increases by approximately 1.4 bar and, when the test vehicle accelerates, the maximum is 2.0 bar. The spark timing is also delayed, and this delayed timing may affect the decrease in PN emissions.
In Figure 3, the results of the coast down changing test over the NIER #09 mode and cold-start test over the WLTP mode are shown next to the NIER#13 mode results. Except for the worst-case test, the impact of coast down change is approximately −1.5% to 23.1% during the tests. However, in the case of the worst case, the PN emission increases by 69.2% when tested under RCD and 36.4% when tested under 200CD. When the vehicle is started under cold conditions, the engine and aftertreatment systems of the vehicle undergo a warming process that limits the reduction in PN and CO2 emissions. Consequently, approximately 60% of gaseous and particulate emissions are discharged when the engine starts. Since the NIER test modes are hot-start modes, additional WLTP mode tests were carried out to investigate repercussions under cold-start conditions. While 18.2% of total PN emissions are discharged in the low phase of WLTP under hot-start conditions, 84.3% of PN emissions are discharged during a cold-start test. The PN emissions emitted under the cold-start test are approximately three times more than those emitted under the hot-start condition, which has a PN emission result of 6.65 × 10¹¹.

3.3. Size-Resolved PN Concentration

Figure 4 and Figure 5 compares the size-resolved PN concentration and particle size distributions of each test mode and under each condition. The bar graphs indicate the ratio value of each PN size range: 0–23, 23–50, 50–100 and 100–560 nm. With these two types of graphs, the influence caused by the test modes and conditions can be analyzed. Bimodal size distribution results were observed over all of the tests. There are some deviations from the NIER #03 test mode among the test conditions, which shows an approximately 70% gap in terms of the maximum extent of the other modes. These differences are widened significantly at two peaks: one is the peak at 10 nm, and the other is at approximately 48.7 to 56.32 nm. The PN concentrations at the first peak are 1.30 × 10⁶, 6.53 × 10⁵, 1.56 × 10⁶, and 8.17 × 10⁵ N/cc for each test condition: normal, 200 kg, A/C on, and low TP, respectively; the PN concentrations of the second peak are 1.32 × 10⁶, 7.25 × 10⁵, 1.61 × 10⁶ and 7.61 × 10⁵ N/cc respectively. The sub-23 nm-sized PN composes a large portion, with a value of approximately 38.8%, and its portion decreases when the tests are conducted under several driving conditions. In particular, the proportion of the larger than 100 nm PN fraction increases greatly under the low TP test condition, which shows a value of 10.9% of all PN emissions, whereas the PN emissions are only 4.8% in the test under normal conditions.
The size-resolved PN results of the NIER #09 mode show few differences over the whole range of test conditions. In a similar manner to the NIER #03 mode, two peaks at 10 nm and 48.7 nm were observed, but the second PN peak, which was larger than the peak at 10 nm, shifted to the smaller side (left-hand of the graph) when tested with the air conditioner on. In each test mode, the PN concentrations of the first peak were 1.29 × 10⁶, 1.05 × 10⁶, 1.24 × 10⁶, 9.3 × 10⁵, and 1.27 × 10⁶ N/cc, and the PN concentrations of the second peak were 1.58 × 10⁶, 1.37 × 10⁶, 1.54 × 10⁶, 1.30 × 10⁶, and 1.49 × 10⁶ N/cc for the following conditions: normal, 200 kg, A/C on, low tire pressure, worst case. The test conditions conducted with low tire pressure show an increase in the large-sized PN fraction compared to those of the other test conditions. The PN fraction in excess of 100 nm increases from 4.31% under normal conditions to 13.43% under low TP conditions and 11.93% in tests under the worst conditions. By extending the range of the PN size to larger than 50 nm, the proportion of those sizes in the PN concentration increases to 43.2% under low TP conditions and 40.2% under worst-case conditions from 30.7% under normal conditions, while the nucleation mode and sub-23 nm-sized PN fraction decreases. When the tire pressure decreases, the contact area of the tire to the ground widens, and this expanded surface area causes a substantial increase in friction for the vehicle [28]. Such changes make it difficult for the test driver to follow the test mode speed profile and the engine speed is faster than under normal conditions; as a result, the combustion process may be changed, such as a shortened air and fuel mixing time, causing an increase in PN accumulation for the low TP mode.
The NIER #13 test mode results also show that there are slight deviations similar to those of the NIER #03 test mode results under the various test conditions. The PN concentrations of the first peak are 1.70 × 10⁶, 1.67 × 10⁶, 1.49 × 10⁶, and 1.22 × 10⁶ N/cc for each condition, and approximately 11.6 to 18% of the total PN is discharged in these first peaks. The PN concentrations of the second peak are 2.05 × 10⁶, 2.36 × 10⁶, 1.58 × 10⁶, and 1.70 × 10⁶ N/cc for each condition, and 51 to 66.6% of the total PN is discharged in the second peaks. The NIER #13 mode results also show a similar trend to other tests, in that low TP conditions discharge a greater fraction of PN larger than 100 nm. In particular, unlike other test modes, which sharply decrease at the second peak, the PN concentration decreases gradually after the second peak.
Figure 6 and Figure 7 indicate the impact of the change in CD value on the size-resolved PN concentration. When compared to the BCD value, the size of PN where the second peak is formed decreases and shifts to a size of 42.2 nm from 56.2 nm. Generally, the PN concentrations smaller than 100 nm decrease, but PN over the 100 nm size account for a higher percentage than that of the BCD condition. In a particular mode, the proportion of accumulated PN, which is larger than 100 nm and excludes PN under low TP conditions, is 4.31% to 5.29%, but the ratios of PN under the RCD and 200CD test conditions increase to 5.08% and 7.37%, respectively. Regarding the low TP condition, there is little difference in the PN concentration ratio above 100 nm under the RCD low TP condition, but the PN ratio over 100 nm in the other cases increases to 10.89%, 12.87%, and 11.49% for the RCD worst case, 200CD low TP case, and 200CD worst case, respectively.
Figure 6 and Figure 7 also shows the WLTP test results with a cold and hot start. Regarding the cold-start condition, the CO2 and particulate emission levels decrease because of the warming process of the engine and catalyst. Bimodal results are shown for each test, but there are some differences in PN concentrations above the 23 nm size. The concentration of the emitted PN fraction under the hot-start condition is approximately 8.7% (from 1.04 × 10⁶ to 0.93 × 10⁶), but the gap between the first and second peaks under the cold-start condition is much higher than that under the hot-start condition, increasing from 2.2 × 10⁶ to 4.89 × 10⁶ N/cc. The size distribution results show these trends in the cold-start condition test. The fraction of sub-23 nm-sized particles is 44.3% under the hot-start condition and 23.4% under the cold-start condition. On the other hand, in a particular mode, the proportion of accumulated PN above a 50 nm size increases from 24.7% under hot-start conditions to 46.1% under cold-start conditions. Although the air–fuel ratio and fuel injection pressure value of both the hot- and cold-start conditions are similar during the engine start and initial acceleration section, the air–fuel ratio becomes richer, and the fuel is injected at a high pressure when the test vehicle is started under cold-start conditions.

4. Conclusions

This study focused on the impact of various driving conditions that could affect real-world driving, such as extra weight, the use of an air conditioner, tire pressure, road load and engine coolant temperature, on gaseous and particulate emissions. NIER testing modes were used to reflect realistic driving patterns of urban, rural, and motorway driving in Korea along with the WLTP, which is the certification test mode of the EU. Regulated gaseous emission levels and engine operating parameters were used to analyze how the test conditions affected the test vehicle.
Because of the characteristics of the NIER #03 test mode, which had a low average speed, frequent acceleration, and increased idling than those of the other test modes, there was no consistent influence on gaseous and particulate emission levels under various test conditions.
The THC and CO emission levels are sensitive to the air–fuel ratio and spark timing, but not the fuel pressure. According to the engine operating parameters of each test, THC and CO emission results decrease under averaged high-speed test modes, such as NIER #13.
The most influential test condition over the whole range of test modes is the use of the air conditioner, in which both the CO2 and PN emission levels increased. The tire pressure affected the middle- and high-speed test modes, such as NIER #09 and NIER #13, which shows that the PN concentration that was larger than 100 nm and that it increased while the sub-23 nm-sized PN concentration decreased. The change in road load meant more loss due to friction than that under the BCD condition and could lead to deteriorated PN and CO2 emissions [51]. The CO2 emission results increased from 4.5% to 7.6% when compared with those of the BCD test under normal conditions, and there were few changes in the size distribution of the PN concentrations. Regarding the 200CD test conditions, the sub-23 nm-sized PN fraction slightly increased and, in a particular mode, the proportion of accumulated PN in a size range of 23 to 100 nm decreased.
The engine start under cold-start conditions requires sufficient time for the warming up process of the engine and aftertreatment systems that reduce the regulated gaseous emissions. Because the air–fuel ratio becomes richer and the spark timing is delayed, the PN emission level increased by approximately three times and the CO2 emission level increased by approximately 6.1% compared with those under the hot-start condition. The PN emission results also increased from 6.65 × 10¹¹ to 2.86 × 10¹² N/km and most of the increase occurred in phase 1, which included the engine start and warming up processes.
Our experimental results examined the effects of various driving conditions on exhaust emissions such as gaseous emissions, greenhouse emissions, and particulate emissions. Further research requires additional experiments to ensure the repeatability and reproducibility of these findings, and it is expected that various simulation tests or statistical methods might be helpful to obtain and analyze lots of test data [53,54]. In addition, particulate and CO2 emission characteristics investigated in this study may be useful to evaluate those simulation tests or statistical analyses. Moreover, the results of size-resolved PN concentrations support the need for further research involving sub-23 nm sized PN, since approximately 30% to 40% of the total PN emissions were very small-sized PNs of less than 23 nm.

Author Contributions

W.C. and M.K. performed vehicle experiments, measured emission and engine operating data; K.K., C.K. and C.-L.M. analyzed the experimental data and relationship between test conditions and test results; S.P. provided the academic advice for the test conditions, test cycles, and total results. All authors have read and agreed to the published version of the manuscript.

Funding

This research was funded by the Ministry of Land, Infrastructure and Transportation of Korea. And the APC was funded by the Hyundai Motor Company. This study was supported by the Hyundai Motor Company for technical assistance.

Conflicts of Interest

The authors declare no conflict of interest.

References

  1. Nesbit, M.; Fergusson, M.; Colsa, A.; Ohlendorf, J.; Hayes, C.; Paquel, K.; Schweitzer, J.-P. Comparative Study on the Differences between the EU and US Legislation on Emissions in the Automotive Sector; European Parliament: Brussels, Belgium, 2016; Volume 21, Available online: Https://Www.Dieselnet.Com/Stand./Eu/Ld.Php#StdsDiaksesPada (accessed on 19 May 2020).
  2. Johnson, T.; Joshi, A. Review of vehicle engine efficiency and emissions. SAE Int. J. Engines 2018, 11, 1307–1330. [Google Scholar] [CrossRef]
  3. European Environment Agency (EEA). Air Quality in Europe—2019 Report; EEA: Copenhagen, Denmark, 2019. [Google Scholar]
  4. Blanco-Rodriguez, D.; Vagnoni, G.; Holderbaum, B. EU6 C-Segment Diesel vehicles, a challenging segment to meet RDE and WLTP requirements. IFAC Pap. 2016, 49, 649–656. [Google Scholar] [CrossRef]
  5. O’Driscoll, R.; Stettler, M.E.J.; Molden, N.; Oxley, T.; ApSimon, H.M. Real world CO2 and NOx emissions from 149 Euro 5 and 6 diesel, gasoline and hybrid passenger cars. Sci. Total Environ. 2018, 621, 282–290. [Google Scholar] [CrossRef] [PubMed]
  6. Park, G.; Mun, S.; Hong, H.; Chung, T.; Jung, S.; Kim, S.; Seo, S.; Kim, J.; Lee, J.; Kim, K.; et al. Characterization of emission factors concerning gasoline, LPG, and diesel vehicles via transient chassis-dynamometer tests. Appl. Sci. 2019, 9, 1573. [Google Scholar] [CrossRef] [Green Version]
  7. Moody, A.; Tate, J. In service CO2 and NOx emissions of Euro 6/VI cars, light-and heavy-dutygoods vehicles in real London driving: Taking the road into the laboratory. J. Earth Sci. Geotech. Eng. 2017, 7, 51–62. [Google Scholar]
  8. Mathis, U.; Mohr, M.; Forss, A. Comprehensive particle characterization of modern gasoline and diesel passenger cars at low ambient temperatures. Atmos. Environ. 2005, 39, 107–117. [Google Scholar] [CrossRef]
  9. Myung, C.L.; Park, S. Exhaust nanoparticle emissions from internal combustion engines: A review. Int. J. Automot. Technol. 2011, 13, 9–22. [Google Scholar] [CrossRef]
  10. Kraft, D.K.M. Particle Formation and Models in Internal Combustion Engines; ComoChengCamAcUk; University of Cambridge: Cambridge, UK, 2014; pp. 1473–4273. [Google Scholar]
  11. Kontses, A.; Triantafyllopoulos, G.; Ntziachristos, L.; Samaras, Z. Particle number (PN) emissions from gasoline, diesel, LPG, CNG and hybrid-electric light-duty vehicles under real-world driving conditions. Atmos. Environ. 2020, 222. [Google Scholar] [CrossRef]
  12. Awad, O.I.; Ma, X.; Kamil, M.; Ali, O.M.; Zhang, Z.; Shuai, S. Particulate emissions from gasoline direct injection engines: A review of how current emission regulations are being met by automobile manufacturers. Sci. Total Environ. 2020, 718, 137302. [Google Scholar] [CrossRef]
  13. Qian, Y.; Li, Z.; Yu, L.; Wang, X.; Lu, X. Review of the state-of-the-art of particulate matter emissions from modern gasoline fueled engines. Appl. Energy 2019, 238, 1269–1298. [Google Scholar] [CrossRef]
  14. European Union. Commision Regulation (EU) 2017/1151; Official Journal of the European Union; European Union: Brussels, Belgium, 2017. [Google Scholar]
  15. Mock, P. Changes to the Motor Vehicle Type-Approval System in the European Union; International Council on Clean Transportation: Washington, DC, USA, 2018. [Google Scholar]
  16. Myung, C.-L.; Choi, K.; Cho, J.; Kim, K.; Baek, S.; Lim, Y.; Park, S. Evaluation of regulated, particulate, and BTEX emissions inventories from a gasoline direct injection passenger car with various ethanol blended fuels under urban and rural driving cycles in Korea. Fuel 2020, 262. [Google Scholar] [CrossRef]
  17. Myung, C.-L.; Ko, A.; Lim, Y.; Kim, S.; Lee, J.; Choi, K.; Park, S. Mobile source air toxic emissions from direct injection spark ignition gasoline and LPG passenger car under various in-use vehicle driving modes in Korea. Fuel Process. Technol. 2014, 119, 19–31. [Google Scholar] [CrossRef]
  18. Momenimovahed, A.; Handford, D.; Checkel, M.D.; Olfert, J.S. Particle number emission factors and volatile fraction of particles emitted from on-road gasoline direct injection passenger vehicles. Atmos. Environ. 2015, 102, 105–111. [Google Scholar] [CrossRef]
  19. Ko, J.; Kim, K.; Chung, W.; Myung, C.-L.; Park, S. Characteristics of on-road particle number (PN) emissions from a GDI vehicle depending on a catalytic stripper (CS) and a metal-foam gasoline particulate filter (GPF). Fuel 2019, 238, 363–374. [Google Scholar] [CrossRef]
  20. Suarez-Bertoa, R.; Valverde, V.; Clairotte, M.; Pavlovic, J.; Giechaskiel, B.; Franco, V.; Kregar, Z.; Astorga, C. On-road emissions of passenger cars beyond the boundary conditions of the real-driving emissions test. Environ. Res. 2019, 176, 108572. [Google Scholar] [CrossRef]
  21. Jang, J.; Lee, J.; Choi, Y.; Park, S. Reduction of particle emissions from gasoline vehicles with direct fuel injection systems using a gasoline particulate filter. Sci. Total Environ. 2018, 644, 1418–1428. [Google Scholar] [CrossRef]
  22. Varella, R.; Giechaskiel, B.; Sousa, L.; Duarte, G. Comparison of portable emissions measurement systems (PEMS) with laboratory grade equipment. Appl. Sci. 2018, 8, 1633. [Google Scholar] [CrossRef] [Green Version]
  23. Khan, T.; Frey, H.C. Comparison of real-world and certification emission rates for light duty gasoline vehicles. Sci. Total Environ. 2018, 622–623, 790–800. [Google Scholar] [CrossRef]
  24. Huang, Y.; Surawski, N.C.; Organ, B.; Zhou, J.L.; Tang, O.H.H.; Chan, E.F.C. Fuel consumption and emissions performance under real driving: Comparison between hybrid and conventional vehicles. Sci. Total Environ. 2019, 659, 275–282. [Google Scholar] [CrossRef]
  25. Gallus, J.; Kirchner, U.; Vogt, R.; Benter, T. Impact of driving style and road grade on gaseous exhaust emissions of passenger vehicles measured by a Portable Emission Measurement System (PEMS). Transp. Res. Part D Transp. Environ. 2017, 52, 215–226. [Google Scholar] [CrossRef]
  26. Franco, V.; Sánchez, F.P.; German, J.; Mock, P. Real-World Exhaust Emissions from Modern Diesel Cars; International Council on Clean Transportation Europe: Berlin, Germany, 2014. [Google Scholar]
  27. Kwon, S.; Park, Y.; Park, J.; Kim, J.; Choi, K.H.; Cha, J.S. Characteristics of on-road NOx emissions from Euro 6 light-duty diesel vehicles using a portable emissions measurement system. Sci. Total Environ. 2017, 576, 70–77. [Google Scholar] [CrossRef] [PubMed]
  28. Fontaras, G.; Zacharof, N.-G.; Ciuffo, B. Fuel consumption and CO2 emissions from passenger cars in Europe—Laboratory versus real-world emissions. Prog. Energy Combust. Sci. 2017, 60, 97–131. [Google Scholar] [CrossRef]
  29. Yang, Z.; Liu, Y.; Wu, L.; Martinet, S.; Zhang, Y.; Andre, M.; Mao, H. Real-world gaseous emission characteristics of Euro 6b light-duty gasoline- and diesel-fueled vehicles. Transp. Res. Part D Transp. Environ. 2020, 78. [Google Scholar] [CrossRef]
  30. Triantafyllopoulos, G.; Dimaratos, A.; Ntziachristos, L.; Bernard, Y.; Dornoff, J.; Samaras, Z. A study on the CO2 and NOx emissions performance of Euro 6 diesel vehicles under various chassis dynamometer and on-road conditions including latest regulatory provisions. Sci. Total Environ. 2019, 666, 337–346. [Google Scholar] [CrossRef]
  31. Weilenmann, M.F.; Vasic, A.-M.; Stettler, P.; Novak, P. Influence of mobile air-conditioning on vehicle emissions and fuel consumption: A model approach for modern gasoline cars used in Europe. Environ. Sci. Technol. 2005, 39, 9601–9610. [Google Scholar] [CrossRef]
  32. He, L.; Hu, J.; Zhang, S.; Wu, Y.; Zhu, R.; Zu, L.; Bao, X.; Lai, Y.; Su, S. The impact from the direct injection and multi-port fuel injection technologies for gasoline vehicles on solid particle number and black carbon emissions. Appl. Energy 2018, 226, 819–826. [Google Scholar] [CrossRef]
  33. Nikolian, A.; Fontaras, G.; Marotta, A.; Dilara, P. CO2 emissions for Euro 5 passenger cars over different driving and load conditions. In Proceedings of the 19th Transport and Air Pollution Conference, Thessaloniki, Greece, 16–27 November 2012. [Google Scholar]
  34. Sina, N.; Nasiri, S.; Karkhaneh, V. Effects of resistive loads and tire inflation pressure on tire power losses and CO2 emissions in real-world conditions. Appl. Energy 2015, 157, 974–983. [Google Scholar] [CrossRef]
  35. Fernandes, P.; Macedo, E.; Bahmankhah, B.; Tomas, R.F.; Bandeira, J.M.; Coelho, M.C. Are internally observable vehicle data good predictors of vehicle emissions? Transp. Res. Part D Transp. Environ. 2019, 77, 252–270. [Google Scholar] [CrossRef]
  36. Ramos, A.; Muñoz, J.; Andrés, F.; Armas, O. NOx emissions from diesel light duty vehicle tested under NEDC and real-word driving conditions. Transp. Res. Part D Transp. Environ. 2018, 63, 37–48. [Google Scholar] [CrossRef]
  37. Jung, S.; Lim, J.; Kwon, S.; Jeon, S.; Kim, J.; Lee, J.; Kim, S. Characterization of particulate matter from diesel passenger cars tested on chassis dynamometers. J. Environ. Sci. (China) 2017, 54, 21–32. [Google Scholar] [CrossRef]
  38. He, X.; Ratcliff, M.A.; Zigler, B.T. Effects of gasoline direct injection engine operating parameters on particle number emissions. Energy Fuels 2012, 26, 2014–2027. [Google Scholar] [CrossRef]
  39. Pei, Y.-Q.; Qin, J.; Pan, S.-Z. Experimental study on the particulate matter emission characteristics for a direct-injection gasoline engine. Proc. Inst. Mech. Eng. Part D J. Automob. Eng. 2014, 228, 604–616. [Google Scholar] [CrossRef]
  40. Raza, M.; Chen, L.; Leach, F.; Ding, S. A review of particulate number (PN) emissions from gasoline direct injection (GDI) engines and their control techniques. Energies 2018, 11, 1417. [Google Scholar] [CrossRef] [Green Version]
  41. Cho, J.; Si, W.; Jang, W.; Jin, D.; Myung, C.-L.; Park, S. Impact of intermediate ethanol blends on particulate matter emission from a spark ignition direct injection (SIDI) engine. Appl. Energy 2015, 160, 592–602. [Google Scholar] [CrossRef]
  42. Wu, T.; Yao, A.; Feng, J.; Wang, H.; Li, Z.; Liu, M.; Yao, C. A reduced PM index for evaluating the effect of fuel properties on the particulate matter emissions from gasoline vehicles. Fuel 2019, 253, 691–702. [Google Scholar] [CrossRef]
  43. Seigneur, C. Current understanding of ultrafine particulate matter emitted from mobile sources. J. Air Waste Manag. Assoc. 2009, 59, 3–17. [Google Scholar] [CrossRef]
  44. Wang, X.; Grose, M.A.; Avenido, A.; Stolzenburg, M.R.; Caldow, R.; Osmondson, B.L.; Chow, J.C.; Watson, J.G. Improvement of Engine Exhaust Particle Sizer (EEPS) size distribution measurement—I. Algorithm and applications to compact-shape particles. J. Aerosol. Sci. 2016, 92, 95–108. [Google Scholar] [CrossRef]
  45. Chen, L.; Liang, Z.; Zhang, X.; Shuai, S. Characterizing particulate matter emissions from GDI and PFI vehicles under transient and cold start conditions. Fuel 2017, 189, 131–140. [Google Scholar] [CrossRef]
  46. Karjalainen, P.; Pirjola, L.; Heikkilä, J.; Lähde, T.; Tzamkiozis, T.; Ntziachristos, L.; Keskinen, J.; Rönkkö, T. Exhaust particles of modern gasoline vehicles: A laboratory and an on-road study. Atmos. Environ. 2014, 97, 262–270. [Google Scholar] [CrossRef]
  47. Kumar Pathak, S.; Sood, V.; Singh, Y.; Channiwala, S.A. Real world vehicle emissions: Their correlation with driving parameters. Transp. Res. Part D Transp. Environ. 2016, 44, 157–176. [Google Scholar] [CrossRef]
  48. Chong, H.S.; Kwon, S.; Lim, Y.; Lee, J. Real-world fuel consumption, gaseous pollutants, and CO2 emission of light-duty diesel vehicles. Sustain. Cities Soc. 2020, 53. [Google Scholar] [CrossRef]
  49. Choudhary, A.; Gokhale, S. On-road measurements and modelling of vehicular emissions during traffic interruption and congestion events in an urban traffic corridor. Atmos. Pollut. Res. 2019, 10, 480–492. [Google Scholar] [CrossRef]
  50. Ronkko, T.; Pirjola, L.; Ntziachristos, L.; Heikkila, J.; Karjalainen, P.; Hillamo, R.; Keskinen, J. Vehicle engines produce exhaust nanoparticles even when not fueled. Environ. Sci. Technol. 2014, 48, 2043–2050. [Google Scholar] [CrossRef] [PubMed]
  51. Kim, C.; Lee, H.; Park, Y.; Myung, C.-L.; Park, S. Study on the criteria for the determination of the road load correlation for automobiles and an analysis of key factors. Energies 2016, 9, 575. [Google Scholar] [CrossRef] [Green Version]
  52. Wang, C.; Xu, H.; Herreros, J.M.; Wang, J.; Cracknell, R. Impact of fuel and injection system on particle emissions from a GDI engine. Appl. Energy 2014, 132, 178–191. [Google Scholar] [CrossRef] [Green Version]
  53. Zhang, M.; Hong, W.; Xie, F.; Su, Y.; Liu, H.; Zhou, S. Combustion, performance and particulate matter emissions analysis of operating parameters on a GDI engine by traditional experimental investigation and Taguchi method. Energy Convers. Manag. 2018, 164, 344–352. [Google Scholar] [CrossRef]
  54. Tsiakmakis, S.; Ciuffo, B.; Fontaras, G.; Anagnostopoulos, K.; Arcidiacono, V.; Praksova, R.; Marotta, A. Introducing a new emissions certification procedure for european light-duty vehicles: Monte carlo simulation of the potential effect on fleet carbon dioxide emissions. Transp. Res. Rec. 2016, 2572, 66–77. [Google Scholar] [CrossRef]
Figure 1. Schematic diagram of the experimental apparatuses.
Energies 13 02581 g001
Figure 2. (a) Speed profile of test modes. (b) Speed and acceleration of test modes.
Energies 13 02581 g002
Figure 3. Particle number and CO2 emissions of each test mode and condition.
Energies 13 02581 g003
Figure 4. Size-resolved particle number (PN) concentration under National Institute of Environmental Research (NIER) testing modes.
Energies 13 02581 g004
Figure 5. Size distribution of PN emissions with various driving conditions under NIER testing modes; red bar indicates PN size ranged 0 to 22 nm, blue bar indicates 23 to 49 nm, green bar indicates 50 to 99 nm and yellow bar indicates PN sized over 100 nm.
Energies 13 02581 g005
Figure 6. Size-resolved PN concentration with various CD values and in worldwide harmonized light-duty vehicle test procedure (WLTP) mode.
Energies 13 02581 g006
Figure 7. Size distribution of PN emissions with various CD values and in WLTP mode; red bar indicates PN size ranged 0 to 22 nm, blue bar indicates 23 to 49 nm, green bar indicates 50 to 99 nm and yellow bar indicates PN sized over 100 nm.
Energies 13 02581 g007
Table 1. Specifications of the test vehicle.
Specification
Engine typeIn-line 4 cylinder
Fuel Injection SystemStoichiometric GDI
Displacement (cm3)2359
Bore × Stroke (mm)88 × 97
Compression ratio11.3
Max. power (ps/rpm)201/6300
Max. torque (kgf∙m/rpm)25.5/4250
Transmission6-speed automatic
After-treatment system2-brick underfloor TWC
Regulation categoryULEV II, PZEV
Unloading weight (kg)1465
Table 2. Properties of tested gasoline fuel.
SpecificationTest ResultTest Method
Density (kg/m3 @ 15 °C)721.7KS M ISO 12185:2003
Research Octane Number91KS M 2039:2006
Distillation 10% (°C)55.3ASTM D86-16a
Distillation 50% (°C)83.7
Distillation 90% (°C)145.6
Final boiling point (°C)185.8
Distillation residue (%vol.)1.0
DVPE (kPa @ 37.8 °C)54.3ASTM D5191-15
Aromatics (%vol.)13.5KS M 2963:2008
Benzene (%vol.)0.5
Olefins (%vol.)13.5
Oxygen content (%vol.)1.9
Sulfur content (mg/kg)7KS M 2027:2010
Table 3. Detailed information of test modes.
Test ModeNIER#03NIER#09NIER#13WLTP
Duration (s)8789268491800
Distance (km)2.638.7718.2423.27
Avg./Max. Speed (km/h)10.8/6334.1/7177.4/9846.5/131.3
Avg. Acceleration (m/s2)0.640.530.250.41
Idle Fraction (%)4013013
Table 4. Averaged engine operating parameters.
Test ModeTest ConditionLambda
(λ)
Fuel Pressure
(bar)
Spark Timing
(BTDC CA)
Engine Speed
(rpm)
NIER #3Normal1.04048.320.408935
+200 kg1.03748.119.623922
A/C1.03851.219.394940
TP Low1.02047.319.448919
NIER #9
(BCD/RCD/200CD)
Normal1.136/1.126/1.12651.8/51.4/52.126.6/26.8/25.71250/1253/1263
+200 kg1.128/1.100/- 151.3/51.9/-27.8/26.2/-1251/1253/-
A/C1.094/1.110/1.12753.0/53.9/54.225.9/24.6/23.31229/1252/1259
TP Low1.149/1.096/1.12651.6/52.3/52.327.2/26.9/25.61255/1261/1269
Worst1.090/1.080/1.11853.6/54.2/54.824.6/25.6/24.81241/1247/1266
NIER #13Normal1.23859.130.31573
+200 kg1.25859.130.01572
A/C1.23360.528.21577
TP Low1.26959.729.11587
WLTPCold Start1.05553.126.31166
Hot Start1.08750.126.51139
1 There are no tests +200 kg condition with 200 coast down (CD) because 200CD includes 200 kg mass.
Table 5. Regulated gaseous emissions.
Test ModeTest ConditionTHC
(g/km)
CO
(g/km)
NOx
(g/km)
NIER #3Normal0.11950.56400.0923
+200 kg0.01620.17890.0052
A/C0.12860.68340.1003
TP Low0.04650.20500.0276
NIER #9
(BCD/RCD/200CD)
Normal0.0215/0.0055/0.02230.2589/0.0858/0.23060.0437/0.0071/0.0350
+200 kg0.0050/0.0044/- 10.0396/0.1140/-0.0093/0.0064/-
A/C0.0321/0.0063/0.02920.2152/0.1336/0.28670.0367/0.0119/0.0353
TP Low0.0042/0.0057/0.01640.0976/0.1258/0.30910.0075/0.0076/0.0259
Worst0.0347/0.0095/0.02530.2991/0.1121/0.33050.0446/0.0197/0.0403
NIER #13Normal0.00510.06520.0112
+200 kg0.00430.10850.0078
A/C0.00500.15760.0066
TP Low0.00250.09670.0070
WLTPCold Start0.13681.70620.0224
Hot Start0.01790.06500.0197
1 There are no tests +200 kg condition with 200CD because 200CD includes 200 kg mass.

