Comparative and Relational Trajectory of Economic Growth and Greenhouse Gas Emission: Coupled or Decoupled?
Abstract
1. Introduction
- (a)
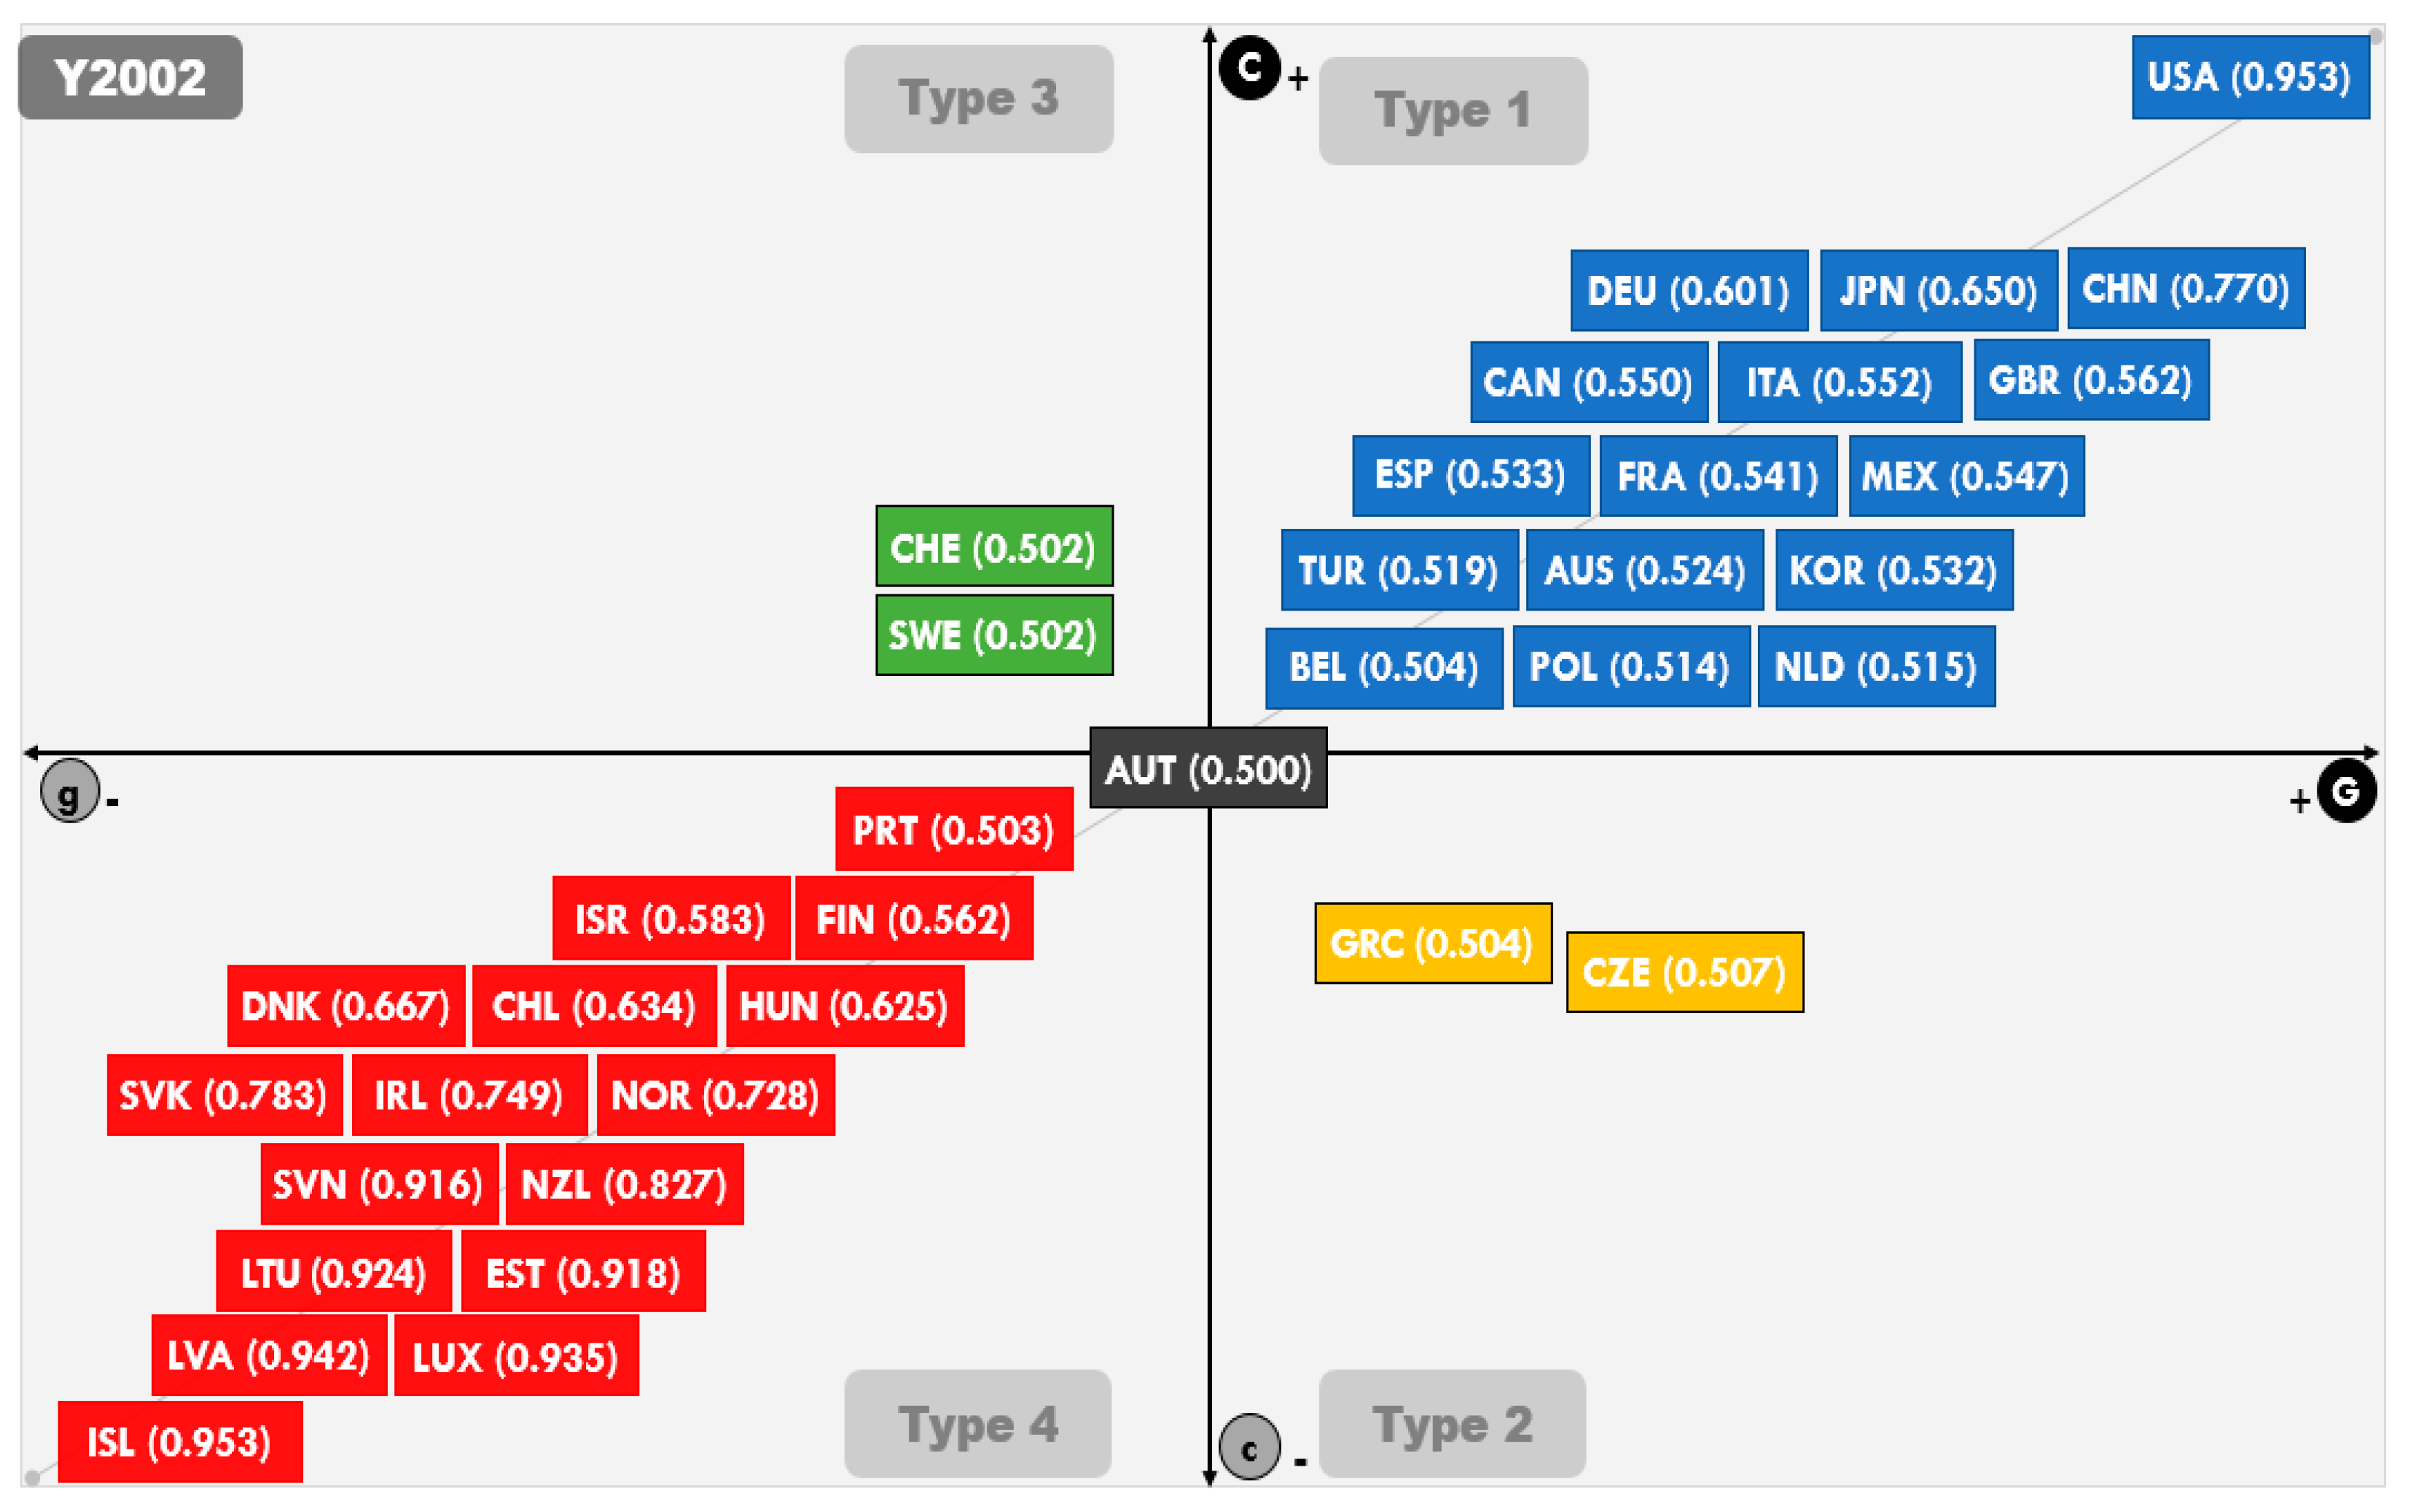
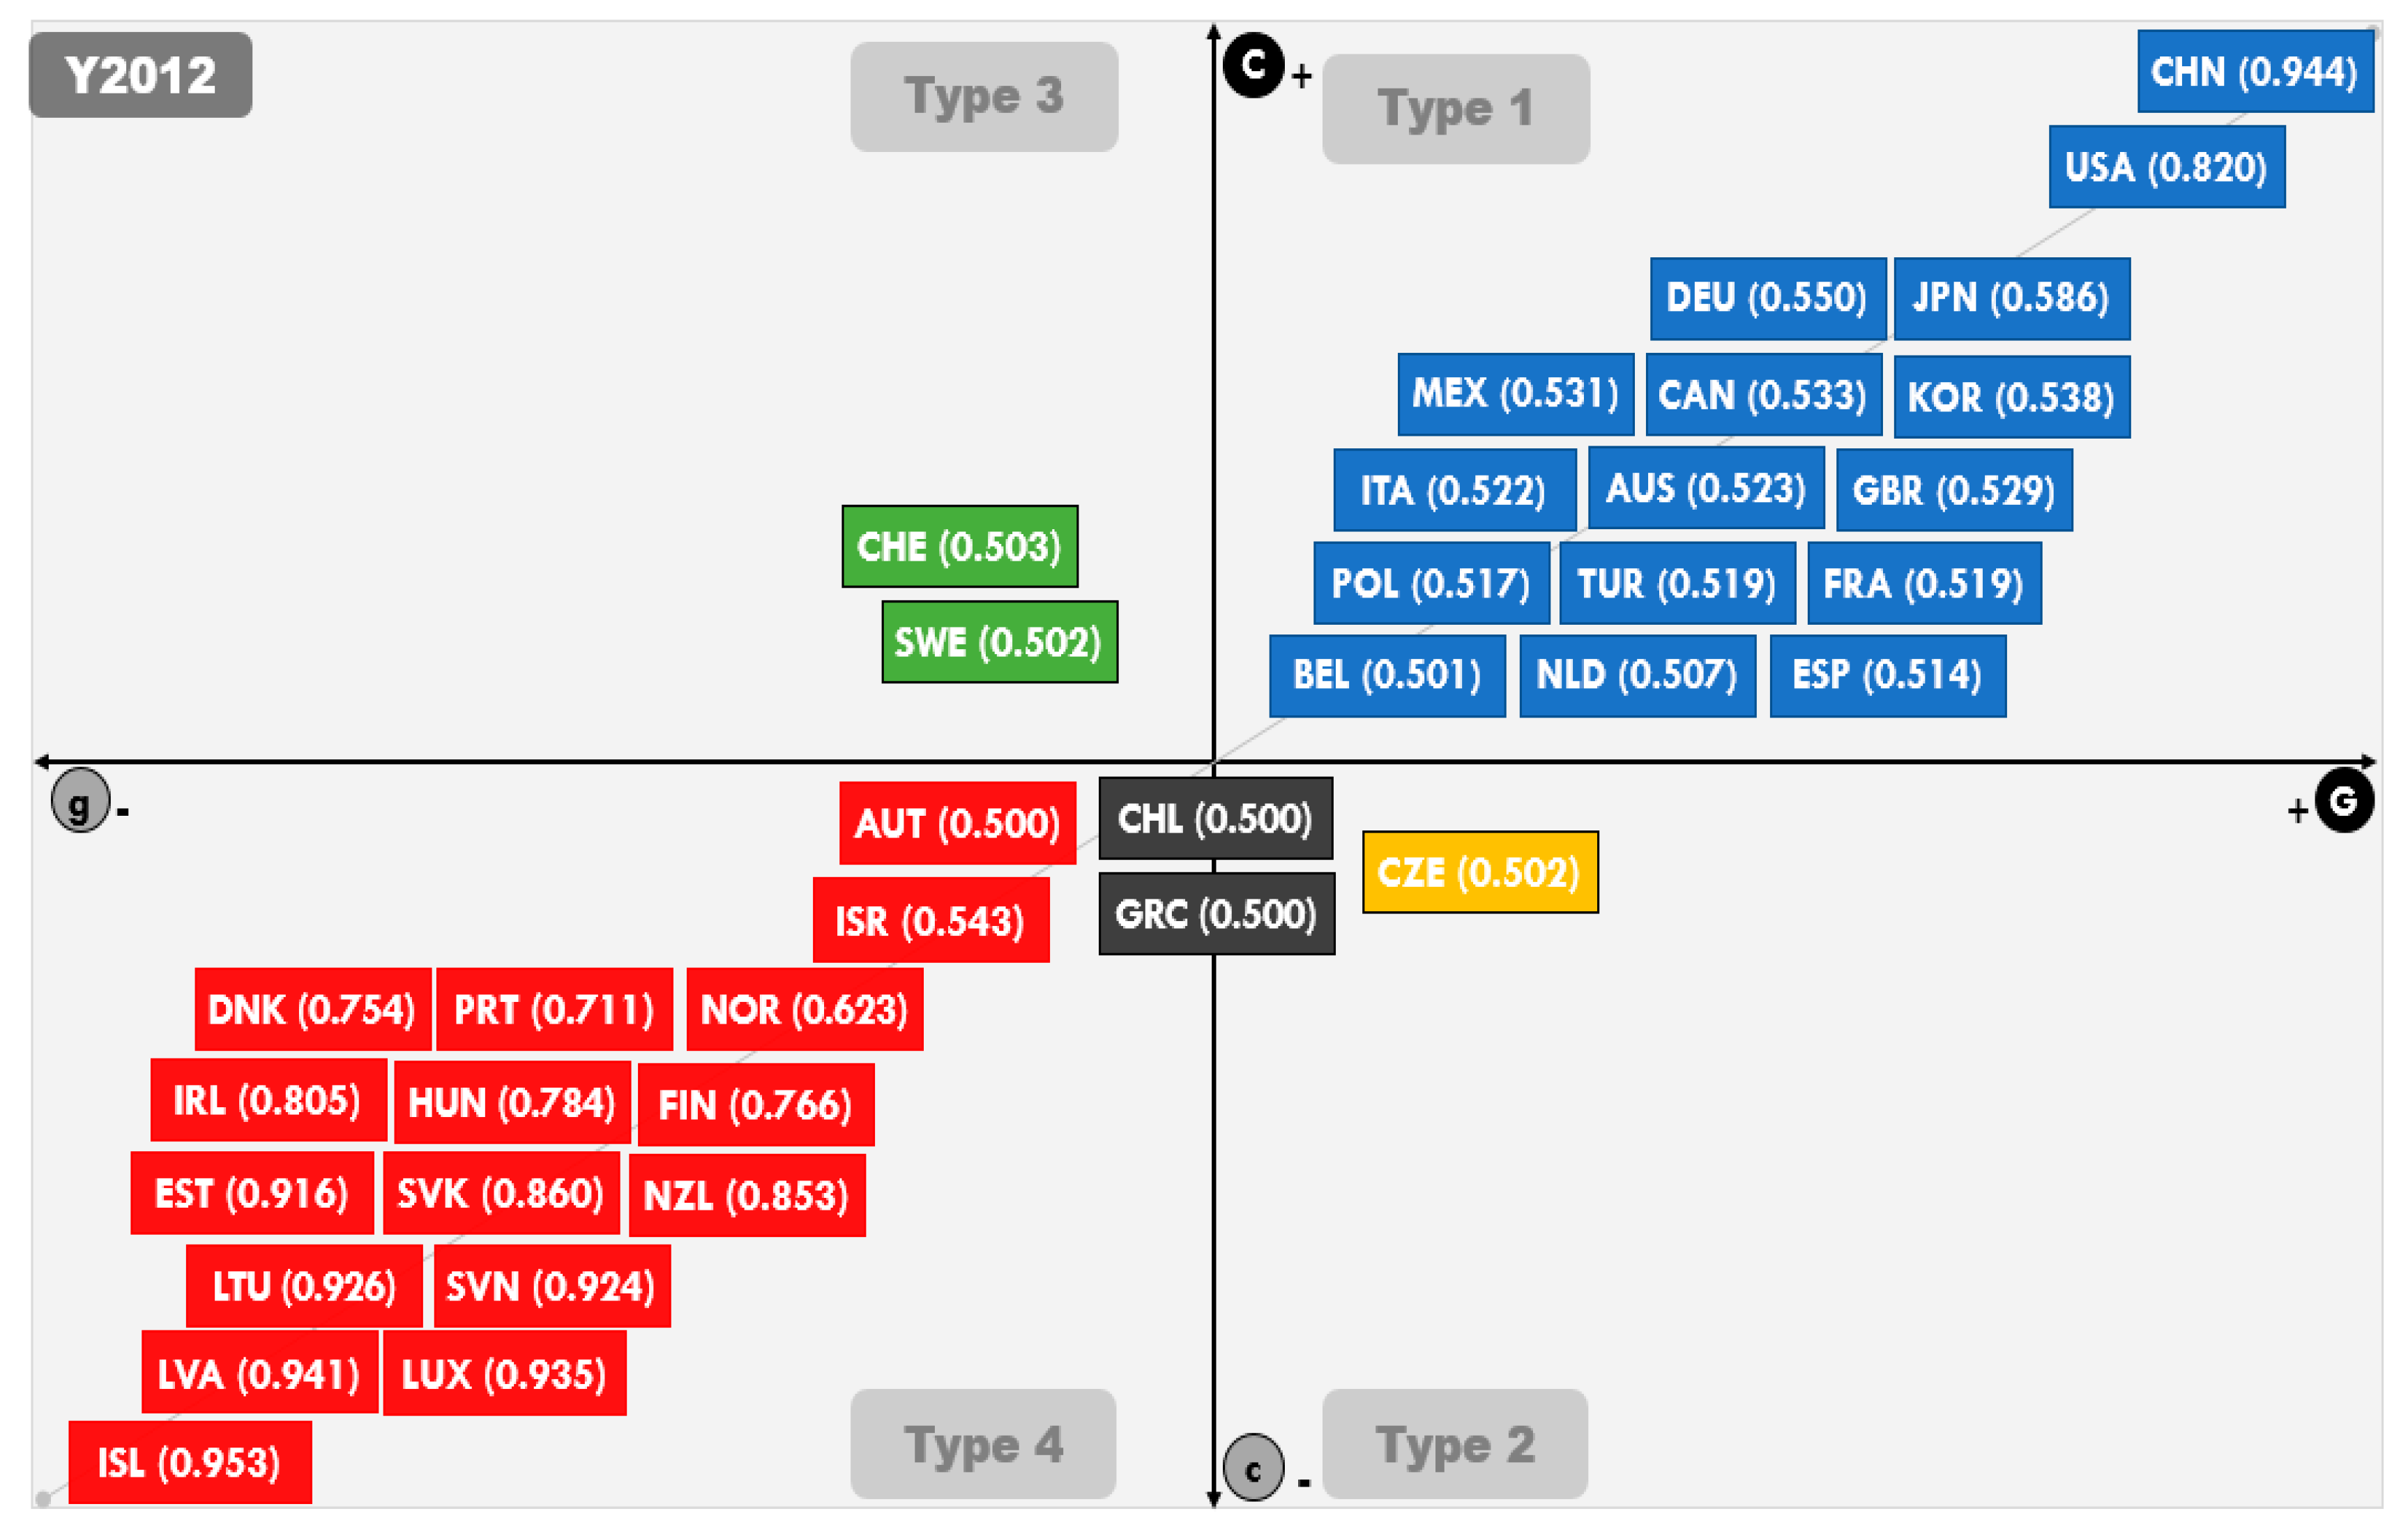
- Does the fuzzy-set ideal type analysis show a relational trajectory of the transition to a global low-carbon economy?
- (b)
- Does the change in the trajectory of a low-carbon economy occur at the time of major international agreements on sustainable development? (Y1992, Y2002, Y2012)?
- (c)
- Does the relationship between GHG (CO2 (carbon dioxide)) and economic growth (GDP) appear to be coupled or decoupled?
2. Theoretical Background
2.1. Global Efforts for Sustainable Development and Climate Change
2.2. Low Carbon Economies: Decoupling of GHG Emissions and Economic Growth
3. Methodology and Measurement Framework
4. Findings of Fussy-Set Ideal Type Analysis
5. Discussion and Conclusions
Funding
Conflicts of Interest
References
- Groningen Growth and Development Centre. Maddison Project Database; University of Groningen, Groningen Growth and Development Centre: Groningen, The Netherlands, 2018. [Google Scholar]
- Organization for Economic Co-operation and Development. Towards Green Growth; OECD: Paris, France, 2011. [Google Scholar]
- KPMG. Future State 2030: The Global Megatrends Shaping Governments; KPMG International Cooperative: Amstelveen, The Netherlands, 2014. [Google Scholar]
- UN Commission on Sustainable Development. The Future We Want; CSD: New York, NY, USA, 2012. [Google Scholar]
- UK Department of Energy and Climate Change. The Carbon Plan: Delivering our Low Carbon Future; DECC: London, UK, 2011.
- UN Economic and Social Commission for Asia and the Pacific. Low Carbon Green Growth Roadmap for Asia and the Pacific: Turning Resource Constraints and the Climate Crisis into Economic Growth Opportunities; UNESCAP: Bangkok, Thailand, 2012. [Google Scholar]
- World Bank. Transition to a Low Carbon Economy in Poland; WB: Washington, DC, USA, 2011. [Google Scholar]
- The White House. The U.S. Mid-Century Strategy for Deep Decarbonization; The White House: Washington, DC, USA, 2016.
- World Commission on Environment and Development. Our Common Future; Oxford University Press: New York, NY, USA, 1987. [Google Scholar]
- Rieu-clake, A. An Overview of Stakeholder Participation within the Danube Basin: What Current Practice and Future Challenges? In Stakeholder Participation in Transboundary Water Management—Selected Case Studies; Earle, A., Malzbender, D., Eds.; African Centre for Water Research: Cape Town, South Africa, 2006. [Google Scholar]
- UNFCCC. Aggregate Effect of the Intended Nationally Determined Contributions: An Update; UNFCCC: New York, NY, USA, 2016. [Google Scholar]
- Mckinsey & Company. Pathways to Low Carbon Economy; Mckinsey & Company: New York, NY, USA, 2009. [Google Scholar]
- European Commission. Energy Roadmap 2050; BC: Brussels, Belgium, 2011. [Google Scholar]
- Handrich, L.; Kemfert, C.; Mattes, A.; Pavel, F.; Traber, T. Turning Point: Decoupling Greenhouse Gas Emissions from Economic Growth; Heinrich-Boll-Stiftung: Cologne, Germany, 2015. [Google Scholar]
- International Energy Agency. Decoupling of Global Emissions and Economic Growth Confirmed; IEA: Paris, France, 2016. [Google Scholar]
- Pearce, D.W.; Markandya, A.; Edward, B.; Barbier, E.B. Blueprint for a Green Economy; Earthscan: Milton Park, UK, 2013. [Google Scholar]
- Ekins, P.; Anandarjah, G.; Strachan, N. Towards a low-carbon economy: Scenarios and policies for the UK. Clim. Policy 2011, 11, 865–882. [Google Scholar] [CrossRef]
- Agras, J.; Chapman, D.A. Dynamic Approach to the Environmental Kuznets Curve Hypothesis. Ecol. Econ. 1999, 28, 267–277. [Google Scholar] [CrossRef]
- Canas, A.; Ferrao, P.; Conceicao, P. A New Environmental Kuznets Curve? Relationship Between Direct Material Input and Income per Capita: Evidence from Industrialised Countries. Ecol. Econ. 2003, 45, 1–13. [Google Scholar] [CrossRef]
- International Energy Agency. CO2 Emissions from Fuel Combustion; IEA: Paris, France, 2016. [Google Scholar]
- International Monetary Fund. World Economic Outlook 2018; IMF: Washington, DC, USA, 2018. [Google Scholar]
- Berkeley Roundtable on the International Economy. Shaping the Green Growth Economy: A Review of the Public Debate and the Prospects for Green Growth; Green Growth Leaders Report; BRIE: Oakland, CA, USA, 2011. [Google Scholar]
- Bataille, C.; Tu, J.; Jaccard, M. Permit sellers, permit buyers: China and Canada’s roles in a global low-carbon society. Clim. Policy 2008, 8, 93–107. [Google Scholar] [CrossRef]
- US Energy Information Administration. Energy Outlook 2018; Office of Integrated and International Energy Analysis; EIA: Washington, DC, USA, 2018.
- Korea Economic Research Institute. Trends and Implications of Deregulation of Greenhouse Gas Emissions and Economic Growth in Major Countries; KERI: Seoul, Korea, 2017. [Google Scholar]
- Strachan, N.; Foxon, T.; Fujino, J. Policy implications from the Low-Carbon Society (LCS) modelling project. Clim. Policy 2008, 8, 17–29. [Google Scholar] [CrossRef]
- Remme, U.; Blesl, M. A global perspective to achieve a low-carbon society (LCS): Scenario analysis with the ETSAP-TIAM model. Clim. Policy 2008, 8, 60–75. [Google Scholar] [CrossRef]
- Friedl, B.; Getzner, M. Determinants of CO2 Emissions in a Small Open Economy. Ecol. Econ. 2003, 45, 133–148. [Google Scholar] [CrossRef]
- Ragin, C.C. Fuzzy-Set Social Science; University of Chicago Press: Chicago, IL, USA, 2000. [Google Scholar]
- Ragin, C.C. Redesigning Social Inquiry Fuzzy Sets and Beyond; University of Chicago Press: Chicago, IL, USA, 2008. [Google Scholar]
- Choi, Y.J. Social science method: Fuzzy ideal center of analysis and factor analysis. J. Gov. Stud. 2009, 15, 307–337. [Google Scholar]
- Schneider, C.Q.; Rohlfing, I. Case studies nested in fuzzy-set QCA on sufficiency: Formalizing case selection and causal inference. Sociol. Methods Res. 2016, 45, 526–568. [Google Scholar] [CrossRef]
- Seok, J.E. Towards a Sustainable Welfare State: An Evaluation and Typology of OECD Countries Through the Fuzzy-set Ideal Types Analysis. Health Soc. Welf. Rev. 2014, 34, 5–35. [Google Scholar] [CrossRef]
- Yang, J.J.; Jung, Y.R. An Empirical Research of the Underdevelopment of the Welfare State. Korean Political Sci. Rev. 2012, 46, 79–97. [Google Scholar] [CrossRef]
- Kvist, J. Welfare reform in the Nordic countries in the 1990s: Using fuzzy-set theory to assess conformity to ideal types. J. Eur. Soc. Policy 1999, 9, 231–252. [Google Scholar] [CrossRef]
- Kvist, J. Fuzzy set ideal type analysis. J. Bus. Res. 2007, 60, 474–481. [Google Scholar] [CrossRef]
- Li, G.; Kou, G.; Lin, C.; Xu, L.; Liao, Y. Multi-attribute decision making with generalized fuzzy numbers. J. Oper. Res. Soc. 2015, 66, 1793–1803. [Google Scholar] [CrossRef]
- THE WORLD BANK. WB Data—CO2 Emissions. Available online: https://data.worldbank.org/indicator/EN.ATM.CO2E.PC (accessed on 10 March 2019).
- OECD. OECD Data—Gross Domestic Product (GDP). Available online: https://data.oecd.org/gdp/gross-domestic-product-gdp.htm (accessed on 10 March 2019).
- Rihoux, B. Qualitative Comparative Analysis (QCA) and Related Systematic Comparative Methods: Recent Advance and Remaining Challenges for Social Science Research. Int. Sociol. 2006, 21, 679–706. [Google Scholar] [CrossRef]
- Andreoni, J.; Levinson, A. The Simple Analytics of the Environmental Kuznets Curve. J. Public Econ. 2001, 80, 269–286. [Google Scholar] [CrossRef]
- Mor, S.; Jindal, S. Estimation of Environmental Kuznets Curve and Kyoto Parties: A Panel Data Analysis. Int. J. Comput. Eng. Manag. 2012, 15, 5–9. [Google Scholar]
- Yoon, J.Y.; Song, J.M. Empirical Study on the Impact of Urban Economic Growth on the Quality of Environment: With a focus on 95 cities in the world. J. Korea Plan. Assoc. 2015, 50, 145–158. [Google Scholar] [CrossRef]
- Unruh, G.C.; Moomaw, W.R. An Alternative Analysis of Apparent EKC-Type Transitions. Ecol. Econ. 1998, 25, 221–229. [Google Scholar] [CrossRef]
- Choi, C.I.; Kim, J.H. An International Comparative Study on the Relationship between Economic Growth and Environmental Pollution: Testing the existence of EKC in CO2. J. Korea Plan. Assoc. 2006, 41, 153–166. [Google Scholar]
- Kim, S.; Choi, J.K. Emission Trading System as Market-based Regulatory Alternative. Korean Soc. Public Adm. 2016, 26, 165–194. [Google Scholar]
- UK Government Office for Science. Distributed Ledger Technology: Beyond Block Chain; UK Government Office for Science: London, UK, 2016.
- Organization for Economic Co-operation and Development. Towards Global Carbon Pricing, Direct and Indirect Linking of Carbon Markets; OECD: Paris, France, 2010. [Google Scholar]
- Limpaitoon, T.; Chen, Y.; Oren, S. The Impact of Imperfect Competition in Emission Permits Trading on Oligopolistic Electricity Markets. Energy J. 2014, 35, 145–166. [Google Scholar] [CrossRef]


| Categories | Variables | References (Year) | |
|---|---|---|---|
| C | Greenhouse Gas Emission | CO2 emissions (kt) | World Bank Group (1992, 2002, 2012, 2014) [38] |
| G | Economic Growth | GDP (millions, USD) | OECD (1992, 2002, 2012, 2014) [39] |
| Ideal Type | Features of Types |
|---|---|
| 1: C*G | High CO2 Emission & High Economic Growth |
| 2: C*g | High CO2 Emission & low economic growth |
| 3: c*G | low CO2 emission & High Economic Growth |
| 4: c*g | low CO2 emission & low economic growth |
| Year | CO2 Emissions (kt) | GDP (million USD) | ||||||
|---|---|---|---|---|---|---|---|---|
| Mean | Min | p50 | Max | Mean | Min | p50 | Max | |
| 1992 | 382,964.1 | 1818.8 | 60,395.5 | 4,909,534 | 575,504.7 | 5711.9 | 166,690.6 | 6,520,327 |
| 2002 | 451,038.3 | 2170.9 | 67,073.1 | 5,641,309 | 975,658.1 | 9351.4 | 251,984.8 | 10,936,418 |
| 2012 | 603,077.4 | 1800.5 | 80,043.3 | 10,028,573.9 | 1,693,032.2 | 13,446.5 | 391,635.2 | 16,197,007 |
| 2014 | 606,568.6 | 1983.8 | 67,318.8 | 10,291,926.9 | 1,874,851.8 | 14,966.4 | 417,059.5 | 18,259,747 |
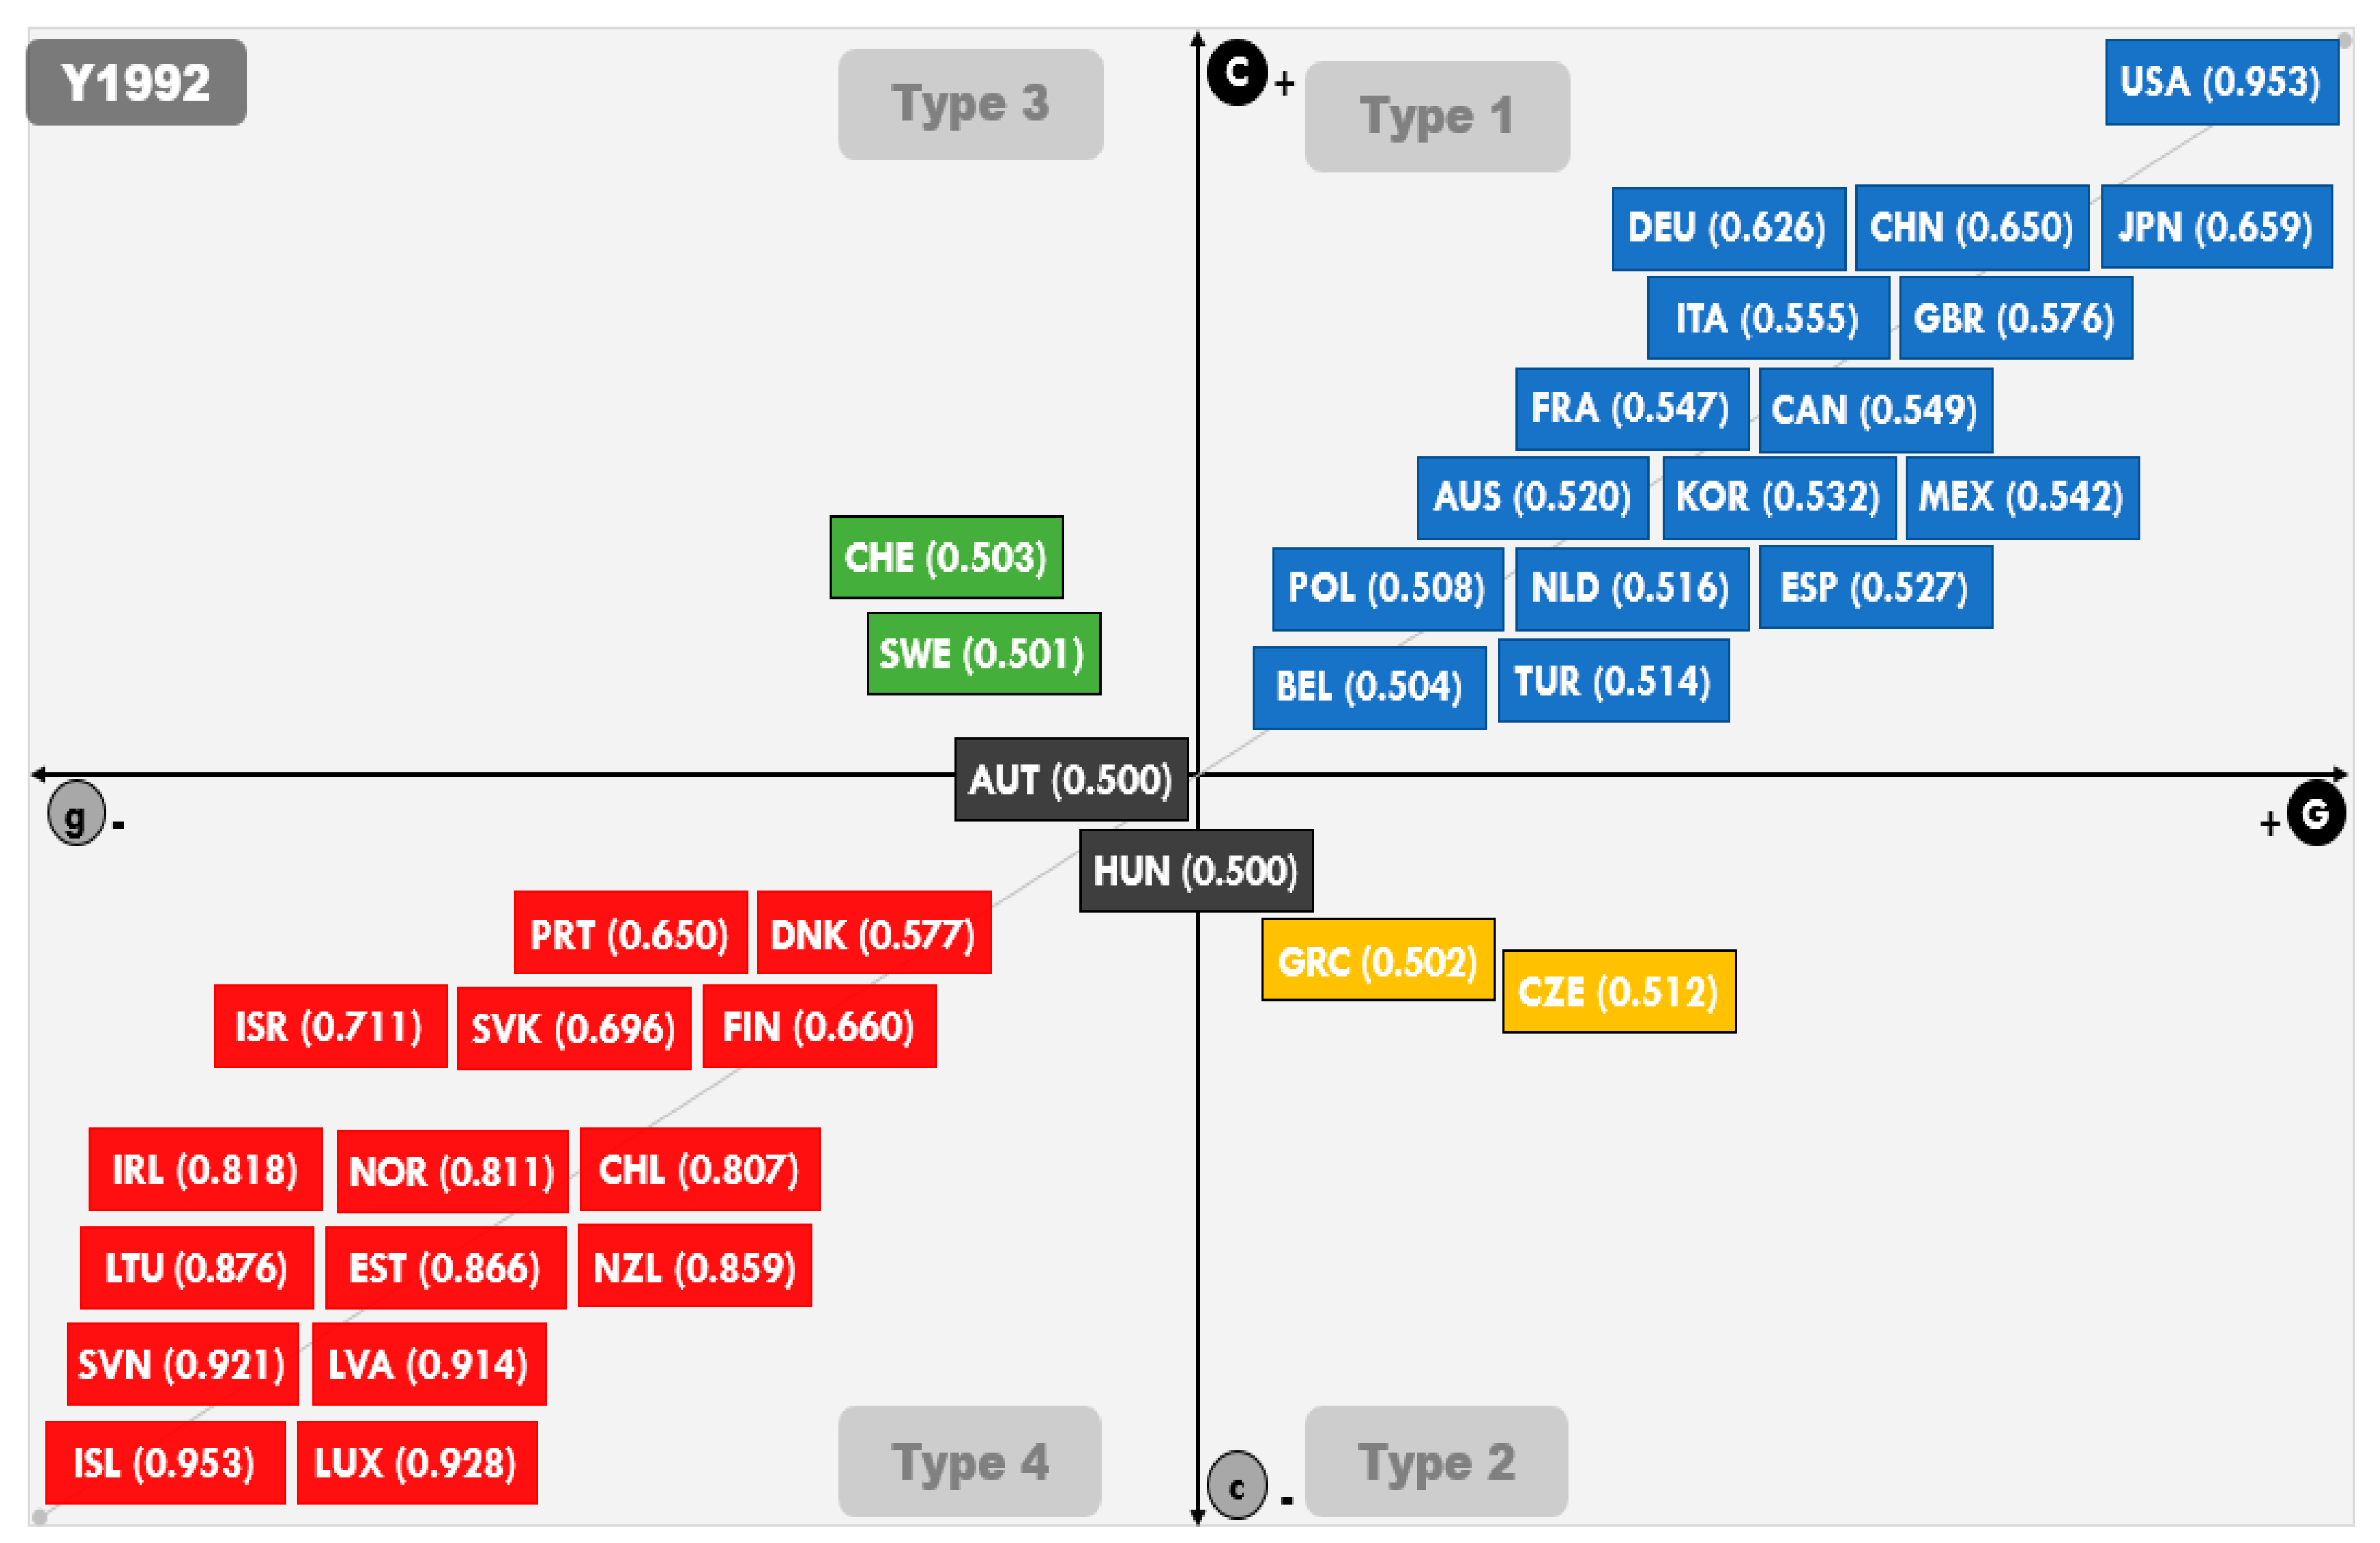
| Type | CO2 Emissions Fuzzy Score | GDP Fuzzy Score | 1 | 2 | 3 | 4 | Ideal Type | |
|---|---|---|---|---|---|---|---|---|
| Country | E*S*T | E*S*t | E*s*T | E*s*t | ||||
| USA | 0.953 | 0.953 | 0.953 | 0.047 | 0.047 | 0.047 | Type 1: C*G | |
| JPN | 0.659 | 0.765 | 0.659 | 0.235 | 0.341 | 0.235 | ||
| CHN | 0.836 | 0.650 | 0.650 | 0.350 | 0.164 | 0.164 | ||
| DEU | 0.626 | 0.678 | 0.626 | 0.322 | 0.374 | 0.322 | ||
| GBR | 0.576 | 0.598 | 0.576 | 0.402 | 0.424 | 0.402 | ||
| ITA | 0.555 | 0.613 | 0.555 | 0.387 | 0.445 | 0.387 | ||
| CAN | 0.559 | 0.549 | 0.549 | 0.451 | 0.441 | 0.441 | ||
| FRA | 0.547 | 0.610 | 0.547 | 0.390 | 0.453 | 0.390 | ||
| MEX | 0.542 | 0.564 | 0.542 | 0.436 | 0.458 | 0.436 | ||
| KOR | 0.535 | 0.532 | 0.532 | 0.468 | 0.465 | 0.465 | ||
| ESP | 0.527 | 0.549 | 0.527 | 0.451 | 0.473 | 0.451 | ||
| AUS | 0.532 | 0.520 | 0.520 | 0.480 | 0.468 | 0.468 | ||
| NLD | 0.516 | 0.518 | 0.516 | 0.482 | 0.484 | 0.482 | ||
| TUR | 0.514 | 0.541 | 0.514 | 0.459 | 0.486 | 0.459 | ||
| POL | 0.545 | 0.508 | 0.508 | 0.492 | 0.455 | 0.455 | ||
| BEL | 0.508 | 0.504 | 0.504 | 0.496 | 0.492 | 0.492 | ||
| CZE | 0.512 | 0.302 | 0.302 | 0.512 | 0.302 | 0.488 | Type 2: C*g | |
| GRC | 0.502 | 0.417 | 0.417 | 0.502 | 0.417 | 0.498 | ||
| CHE | 0.289 | 0.503 | 0.289 | 0.289 | 0.503 | 0.497 | Type 3 c*G | |
| SWE | 0.382 | 0.501 | 0.382 | 0.382 | 0.501 | 0.499 | ||
| ISL | 0.047 | 0.047 | 0.047 | 0.047 | 0.047 | 0.953 | Type 4 c*g | |
| LUX | 0.072 | 0.054 | 0.054 | 0.072 | 0.054 | 0.928 | ||
| SVN | 0.079 | 0.064 | 0.064 | 0.079 | 0.064 | 0.921 | ||
| LVA * | 0.086 | 0.056 | 0.056 | 0.086 | 0.056 | 0.914 | ||
| LTU ** | 0.124 | 0.063 | 0.063 | 0.124 | 0.063 | 0.876 | ||
| EST *** | 0.134 | 0.050 | 0.050 | 0.134 | 0.050 | 0.866 | ||
| NZL | 0.141 | 0.107 | 0.107 | 0.141 | 0.107 | 0.859 | ||
| IRL | 0.182 | 0.109 | 0.109 | 0.182 | 0.109 | 0.818 | ||
| NOR | 0.189 | 0.188 | 0.188 | 0.189 | 0.188 | 0.811 | ||
| CHL | 0.193 | 0.166 | 0.166 | 0.193 | 0.166 | 0.807 | ||
| ISR | 0.289 | 0.184 | 0.184 | 0.289 | 0.184 | 0.711 | ||
| SVK | 0.304 | 0.083 | 0.083 | 0.304 | 0.083 | 0.696 | ||
| FIN | 0.340 | 0.185 | 0.185 | 0.340 | 0.185 | 0.660 | ||
| PRT | 0.350 | 0.340 | 0.340 | 0.350 | 0.340 | 0.650 | ||
| DNK | 0.423 | 0.232 | 0.232 | 0.423 | 0.232 | 0.577 | ||
| HUN | 0.500 | 0.180 | 0.180 | 0.500 | 0.180 | 0.500 | Type 2&4 | |
| AUT | 0.452 | 0.500 | 0.452 | 0.452 | 0.500 | 0.500 | Type 3&4 | |
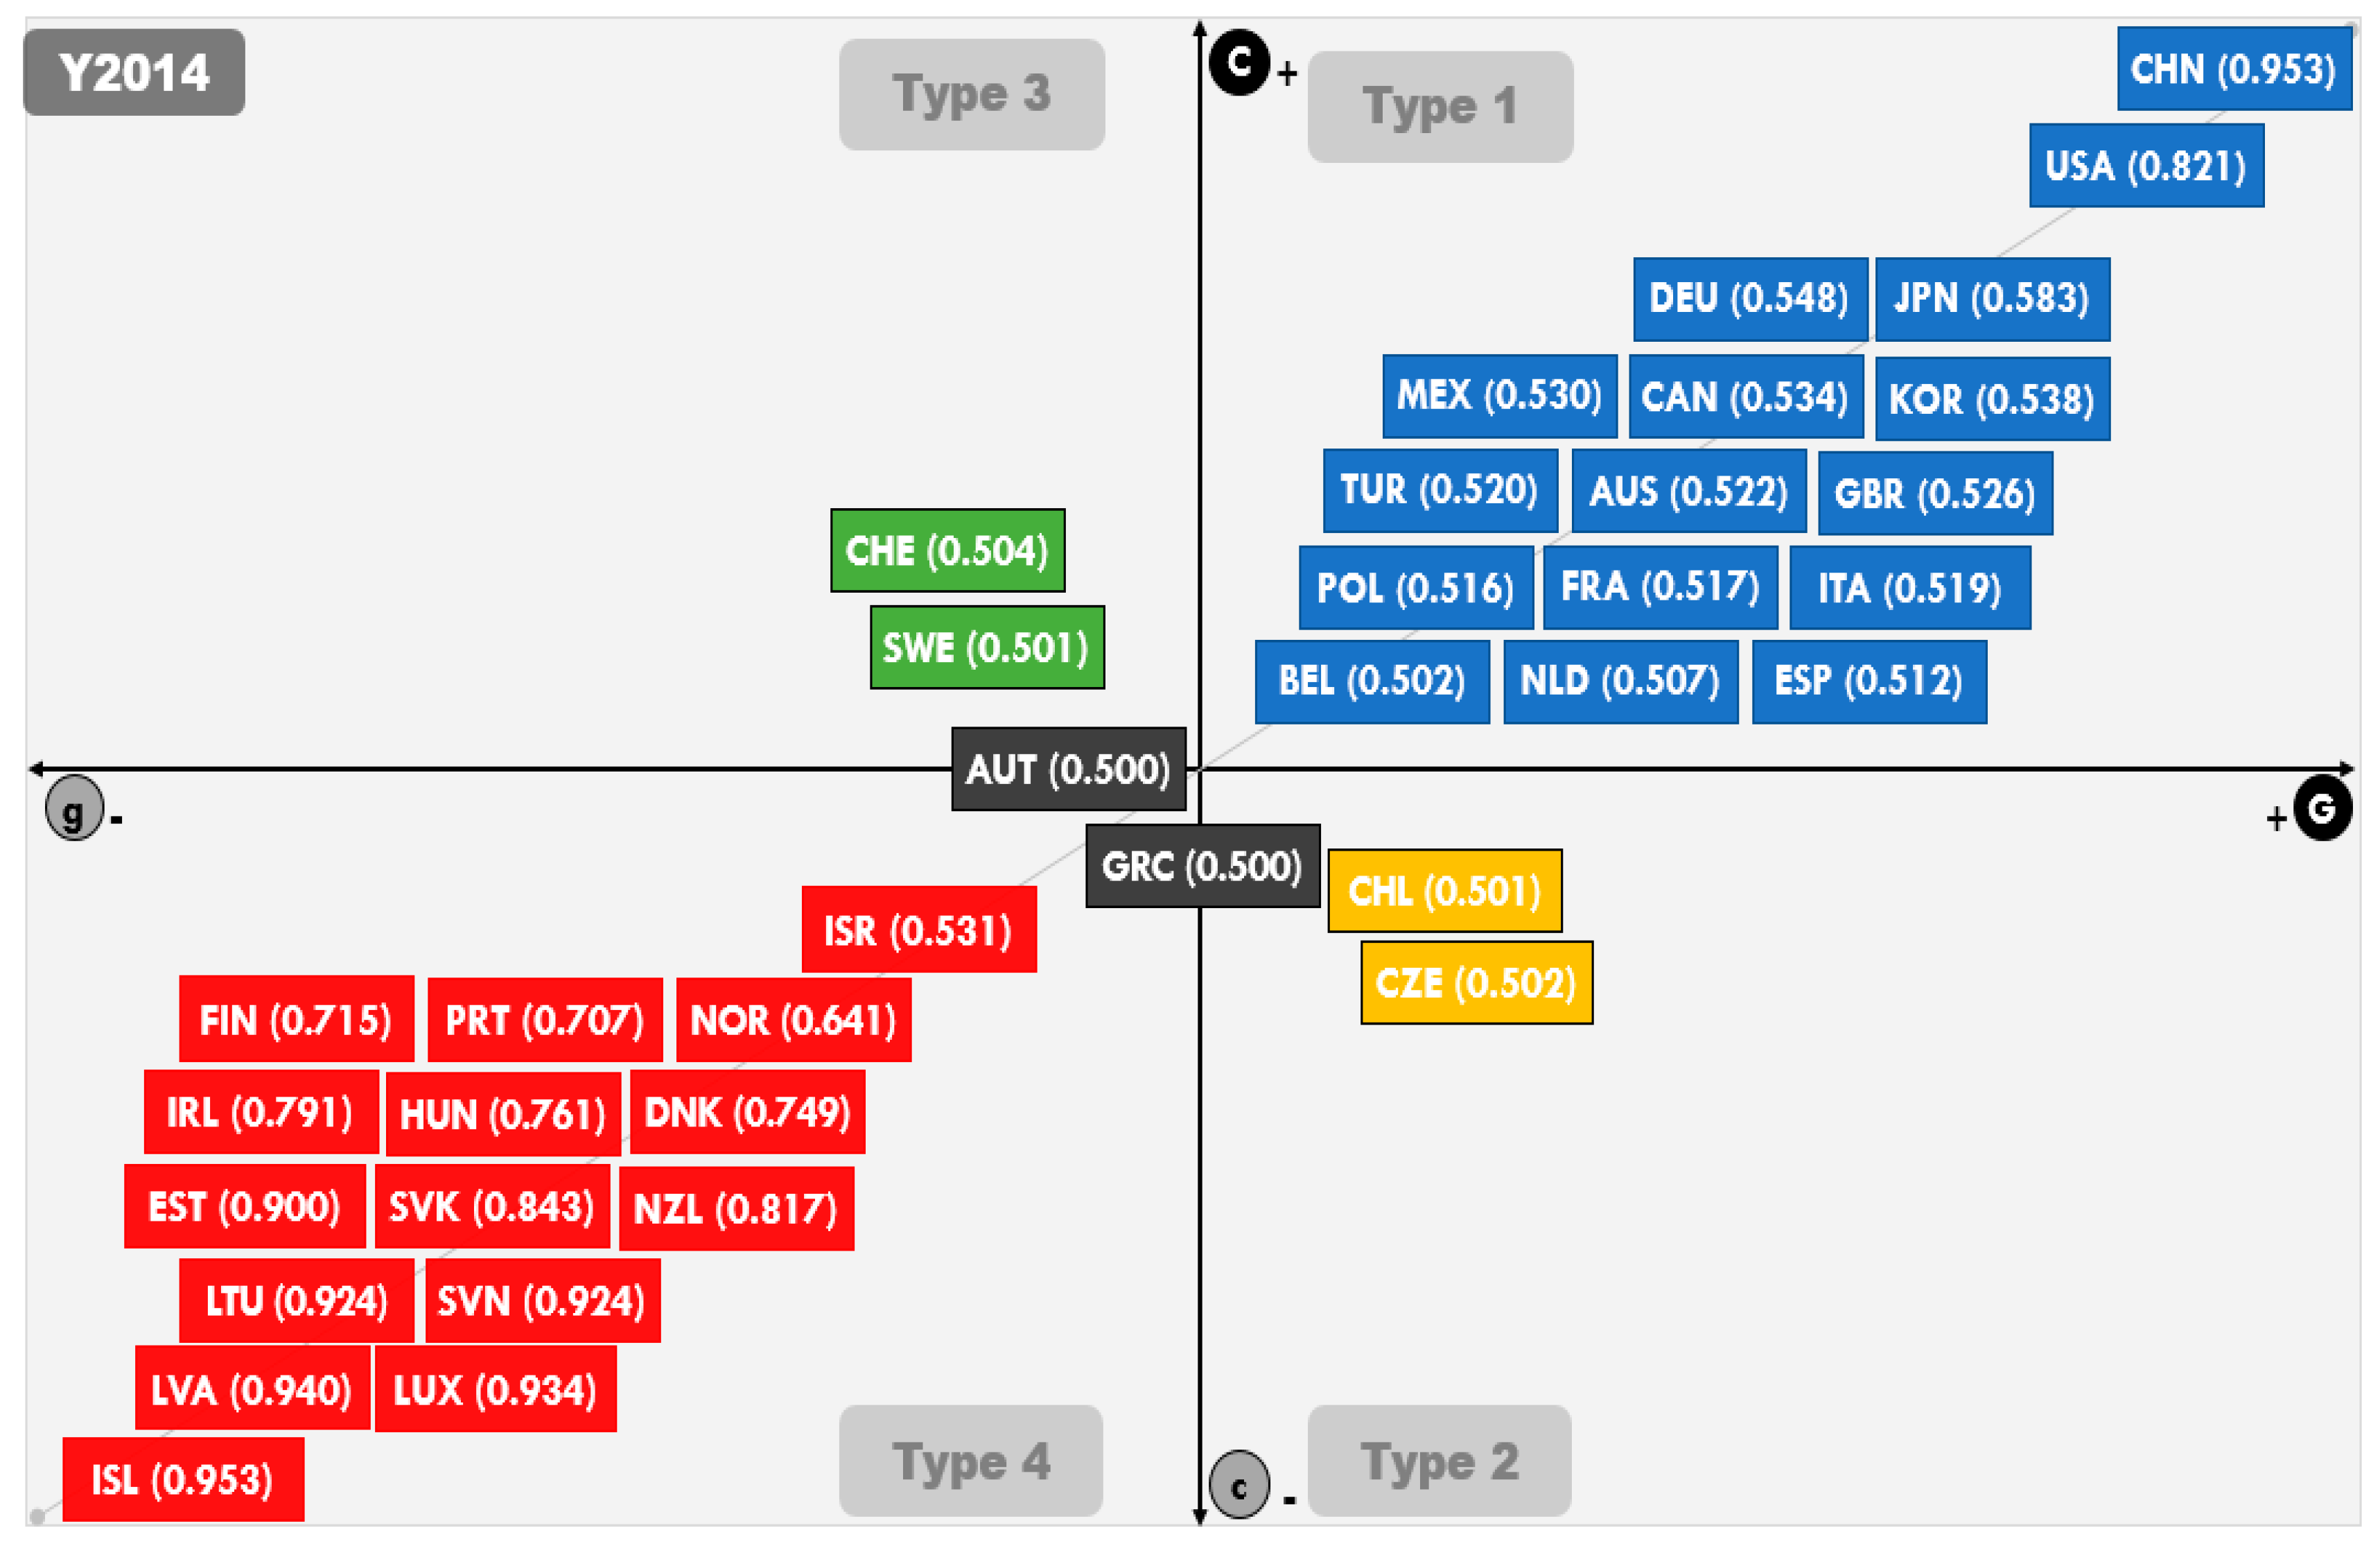
| Type | CO2 Emissions Fuzzy Score | GDP Fuzzy Score | 1 | 2 | 3 | 4 | Ideal Type | |
|---|---|---|---|---|---|---|---|---|
| Country | E*S*T | E*S*t | E*s*T | E*s*t | ||||
| CHN | 0.953 | 0.953 | 0.953 | 0.047 | 0.047 | 0.047 | Type 1: C*G | |
| USA | 0.821 | 0.947 | 0.821 | 0.053 | 0.179 | 0.053 | ||
| JPN | 0.583 | 0.683 | 0.583 | 0.317 | 0.417 | 0.317 | ||
| DEU | 0.548 | 0.639 | 0.548 | 0.361 | 0.452 | 0.361 | ||
| KOR | 0.538 | 0.554 | 0.538 | 0.446 | 0.462 | 0.446 | ||
| CAN | 0.534 | 0.550 | 0.534 | 0.450 | 0.466 | 0.450 | ||
| MEX | 0.530 | 0.573 | 0.530 | 0.427 | 0.470 | 0.427 | ||
| GBR | 0.526 | 0.592 | 0.526 | 0.408 | 0.474 | 0.408 | ||
| AUS | 0.522 | 0.529 | 0.522 | 0.471 | 0.478 | 0.471 | ||
| TUR | 0.520 | 0.560 | 0.520 | 0.440 | 0.480 | 0.440 | ||
| ITA | 0.519 | 0.574 | 0.519 | 0.426 | 0.481 | 0.426 | ||
| FRA | 0.517 | 0.593 | 0.517 | 0.407 | 0.483 | 0.407 | ||
| POL | 0.516 | 0.523 | 0.516 | 0.477 | 0.484 | 0.477 | ||
| ESP | 0.512 | 0.548 | 0.512 | 0.452 | 0.488 | 0.452 | ||
| NLD | 0.507 | 0.517 | 0.507 | 0.483 | 0.493 | 0.483 | ||
| BEL | 0.502 | 0.503 | 0.502 | 0.497 | 0.498 | 0.497 | ||
| CZE | 0.502 | 0.359 | 0.359 | 0.502 | 0.359 | 0.498 | Type 2: C*g | |
| CHL | 0.501 | 0.477 | 0.477 | 0.501 | 0.477 | 0.499 | ||
| CHE | 0.187 | 0.504 | 0.187 | 0.187 | 0.504 | 0.496 | Type 3 c*G | |
| SWE | 0.250 | 0.501 | 0.250 | 0.250 | 0.501 | 0.499 | ||
| ISL | 0.047 | 0.047 | 0.047 | 0.047 | 0.047 | 0.953 | Type 4 c*g | |
| LVA | 0.059 | 0.060 | 0.059 | 0.059 | 0.060 | 0.940 | ||
| LUX | 0.066 | 0.063 | 0.063 | 0.066 | 0.063 | 0.934 | ||
| SVN | 0.076 | 0.067 | 0.067 | 0.076 | 0.067 | 0.924 | ||
| LTU | 0.076 | 0.076 | 0.076 | 0.076 | 0.076 | 0.924 | ||
| EST | 0.100 | 0.056 | 0.056 | 0.100 | 0.056 | 0.900 | ||
| SVK | 0.157 | 0.125 | 0.125 | 0.157 | 0.125 | 0.843 | ||
| NZL | 0.183 | 0.135 | 0.135 | 0.183 | 0.135 | 0.817 | ||
| IRL | 0.178 | 0.209 | 0.178 | 0.178 | 0.209 | 0.791 | ||
| HUN | 0.239 | 0.226 | 0.226 | 0.239 | 0.226 | 0.761 | ||
| DNK | 0.175 | 0.251 | 0.175 | 0.175 | 0.251 | 0.749 | ||
| FIN | 0.285 | 0.194 | 0.194 | 0.285 | 0.194 | 0.715 | ||
| PRT | 0.265 | 0.293 | 0.265 | 0.265 | 0.293 | 0.707 | ||
| NOR | 0.288 | 0.359 | 0.288 | 0.288 | 0.359 | 0.641 | ||
| ISR | 0.469 | 0.267 | 0.267 | 0.469 | 0.267 | 0.531 | ||
| GRC | 0.500 | 0.283 | 0.283 | 0.500 | 0.283 | 0.500 | Type 2&4 | |
| AUT | 0.402 | 0.500 | 0.402 | 0.402 | 0.500 | 0.500 | Type 3&4 | |
© 2020 by the author. Licensee MDPI, Basel, Switzerland. This article is an open access article distributed under the terms and conditions of the Creative Commons Attribution (CC BY) license (http://creativecommons.org/licenses/by/4.0/).
Share and Cite
Huh, T. Comparative and Relational Trajectory of Economic Growth and Greenhouse Gas Emission: Coupled or Decoupled? Energies 2020, 13, 2550. https://doi.org/10.3390/en13102550
Huh T. Comparative and Relational Trajectory of Economic Growth and Greenhouse Gas Emission: Coupled or Decoupled? Energies. 2020; 13(10):2550. https://doi.org/10.3390/en13102550
Chicago/Turabian StyleHuh, Taewook. 2020. "Comparative and Relational Trajectory of Economic Growth and Greenhouse Gas Emission: Coupled or Decoupled?" Energies 13, no. 10: 2550. https://doi.org/10.3390/en13102550
APA StyleHuh, T. (2020). Comparative and Relational Trajectory of Economic Growth and Greenhouse Gas Emission: Coupled or Decoupled? Energies, 13(10), 2550. https://doi.org/10.3390/en13102550


