Article

The Use of Generalized Gaussian Distribution in Vibroacoustic Detection of Power Transformer Core Damage

by
Robert Krupiński
* and
Eugeniusz Kornatowski
Department of Signal Processing and Multimedia Engineering, Faculty of Electrical Engineering, West Pomeranian University of Technology, Sikorskiego 37, 70-313 Szczecin, Poland
*
Author to whom correspondence should be addressed.
Energies 2020, 13(10), 2525; https://doi.org/10.3390/en13102525
Submission received: 1 April 2020 / Revised: 13 May 2020 / Accepted: 13 May 2020 / Published: 16 May 2020

Abstract

:
Vibroacoustic diagnostics (VM—Vibroacoustic Method) is one of the methods for diagnosing the active part of power transformers. Measurement technologies have been refined over the past several years, but the methods of analyzing data obtained in VM diagnostics are still in development. In most cases, they are based on a simple frequency spectrum analysis, and the diagnostic conclusions are subjective and depend on the expert’s professional experience. The article presents an objective method for the detection of transformer unit core damage, based on the analysis of the statistical properties of the vibration signal registered on the surface of the tank of an unloaded transformer in the steady state of vibrations (VM). The algorithm for proceeding further is: FFT analysis of the vibroacoustic signal, with the determination of the relative changes in vibration power as a function of frequency P r ( f ) and, finally, the determination of the statistic properties of the dataset P r ( f ) . The Generalized Gaussian Distribution (GGD) is used to describe the P r ( f ) set. The detector output values are the λ and p parameters of the GGD distribution. These two numerical values form the basis for the classification of the technical condition of the transformer unit core. The correctness of the described solution was verified on the example of ten pieces of 16 MVA power transformers with different operating times and degrees of wear.

1. Introduction

Transformers are one of the most important elements of the power system. The high costs of production and repairs are forcing operators to take special care of their technical condition. Although transformers’ reliability is high, their faults have usually serious consequences, both technical and economical. Preventive diagnostics is the basic tool guaranteeing the optimization of the costs related to the maintenance of the energy distribution network, including transformers. A very important part of the transformer diagnostics are vibration measurements of its construction. The vibroacoustic method in general is based on recording the signal of vibrations’ acceleration of the transformer tank, followed by numerical analysis of the recorded data. The mathematical tools usually applied in vibroacoustic signal analysis are the Fourier transform and sometimes the wavelet transform. Technological devaluation of quality criteria used for decades to diagnose transformer design with vibroacoustics, as well as progress in the development of Digital Signal Processing (DSP) mean that in addition to verification of vibroacoustic quality indicators, there is a need to develop new digital analysis methods reflecting the vibration acceleration. It is important to keep the method of the presentation of the analysis clear and legible and without redundant information. Digitally recorded signal parameters must be carefully chosen so that the use of mathematical tools of DSP does not introduce additional errors.

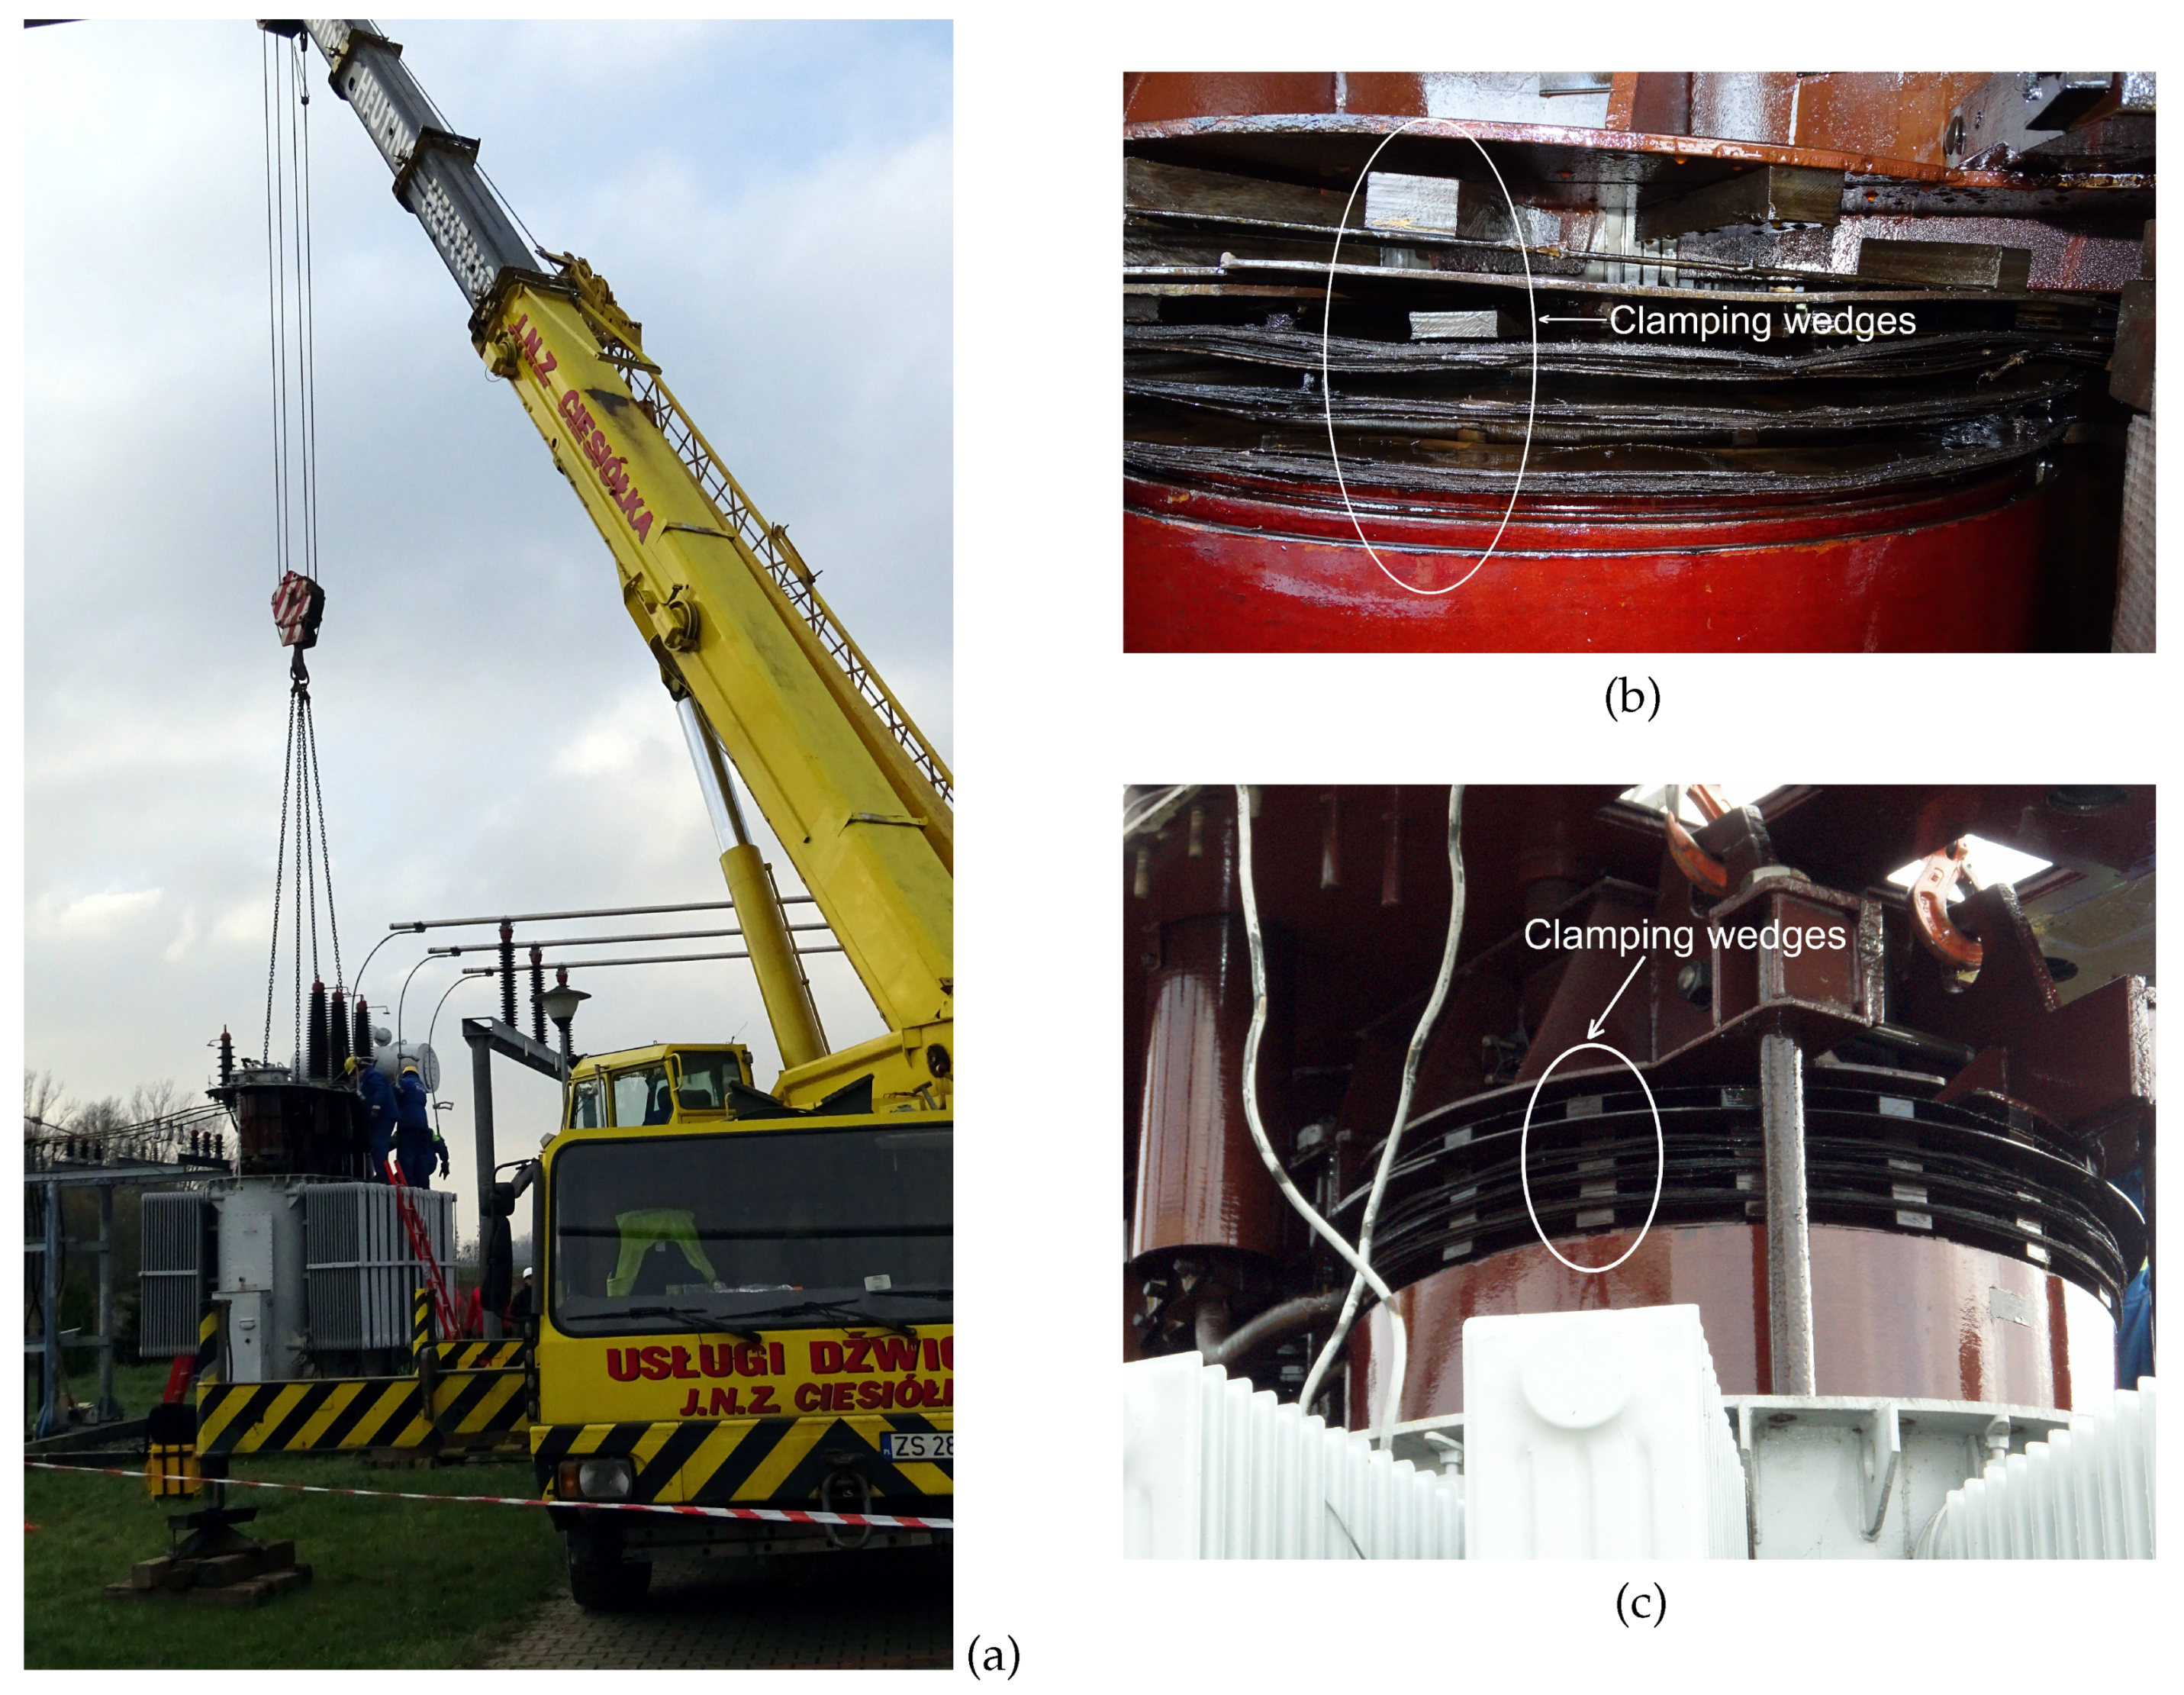
Characteristics of the Vibroacoustic Diagnostic Method

Inside the transformer, electromagnetic forces and forces caused by magnetorestriction act on the windings and core, causing mechanical vibration. Such vibration is transmitted to the tank surface in two ways:
(a)
via transformer oil;
(b)
via the lid and base in direct mechanical contact with the active part.
Loosening of windings and core sheets causes harmonic frequencies recorded on the transformer tank surface.
The direct cause of vibration is the phenomenon of magnetorestriction, which changes the geometric dimensions of a magnetic material placed in a magnetic field. The magnetic field size in the core placed inside the winding depends on the winding supply voltage. Based on Faraday’s law, the change of the length of the core placed in a coil can be estimated according to the following relationship:
Δ L ( t ) = ϵ S U m a x 2 L z S ω B S c o s 2 Ω t ,
where: L—length of the sheets in the core, ϵ S —coefficient of magnetorestriction saturation, z—number of turns in winding, S—core section area, B S —magnetic induction of saturation, Ω —pulsation ( 2 π f ) , and U m a x —supply voltage amplitude. Calculating the second time derivative from Δ L ( t ) , it is possible to determine the momentary value of core acceleration caused by magnetorestriction:
a r = d 2 Δ L d t 2 = 2 ϵ S U m a x 2 L z S B S 2 c o s 2 Ω t .
The analysis of this relationship indicates that the basic harmonic frequency of core vibration is two times greater that the supply voltage frequency, and the vibration amplitude is directly proportional to the supply voltage amplitude squared. The observation that the core vibration does not depend on the current flowing through the windings, and consequently does not depend on the transformer load, is very important. Hence, at constant voltage amplitude, the acceleration amplitude should a r be constant.
The transformer structure vibration recorded by an accelerometer fastened to the tank is a superposition of the aforementioned core and windings’ vibration. The latter are subject to electrodynamic forces proportional to the square of the current flowing through them. As the force is directly proportional to acceleration, it can be inferred that the windings’ vibration acceleration is directly proportional to the square of the current with amplitude I m a x :
α Z ( t ) i 2 ( t ) = I m a x 2 c o s 2 Ω t = 0.5 · I m a x 2 c o s ( 2 Ω t ) + 1 .
Furthermore, in this case, the vibration frequency (basis harmonic) is two times greater than the supply frequency, and thus is the same as in the case of core vibration. If the frequency of the power network is 50 Hz, then the basic harmonic vibration is 100 Hz (as it is in Poland).
Measurement of steady vibration during transformer operation without load can provide important information on the condition of transformer sheets’ fixing. Figure 1 shows the vibration signal (acceleration) recorded on the tank surface of a T0Na800/15 800 kVA transformer running without load.
Three vibration areas can be seen here: from powering up to about 5 s, vibration steadying, then vibration with a steady amplitude, and finally, transient vibration caused by powering down. In the steady state without load, the source of vibration is only the core if we assume that the current in the winding is negligibly small (relative to the rated current). If the supply voltage amplitude is constant, the analysis of vibration from this range will allow an evaluation of the core mechanical condition, because the vibration caused by magnetorestriction dominates at that time. The OLCM (On-Load Current Method) transformer monitoring known from the literature is based on such an assumption [1].
Taking into account the mentioned causes of transformer structure vibration, the vibroacoustic diagnostic method with the use of vibration signal analysis (tank vibration acceleration) separately in two time intervals: steady vibration and transient vibration (without load), was described in [2]. The vibration signal analysis in the case of steady vibration allows determining the mechanical quality of the core. The following quality criterion (relative changes of vibration power) was formulated in order to evaluate the core condition [3]:
P r ( f ) = P ( f , f t ) P ( 0 , f t ) , for   0 f f t ,
where P ( f , f t ) —power of vibration with frequency 0 f f t and P ( 0 , f t ) —total vibration power. With this core quality criterion, it is possible to evaluate the core condition noting that the case of a perfect mechanical state and perfect conditions of vibration measurement is P r ( f ) = 1 for 0 f 100 Hz and P r ( f ) = 0 for 100 Hz < f f t . The progressing core degradation will make the speed of descent of function P r ( f ) for f > 100 Hz lower and lower for a 50 Hz power grid.
For example, Figure 2 shows the frequency amplitude spectra and graph P r ( f ) of two transformers of the same power rating.
The graphs from Figure 2b were made assuming the frequency f t = f s 2 = 25.6 kHz, that is the maximum frequency at a sampling frequency of f s = 51.2 kHz. The range of the shown graphs was limited to 1.5 kHz in order to improve the legibility of the results. Interpreting the physical significance of function P r ( f ) , it can be said that it describes the relative vibration power in the frequency range from the present value f to the maximum f t . If the threshold value P r is assumed, e.g., at 50 % of maximum power, the vibration power is less than the threshold value starting from 780 Hz for transformer Tr1 and above 200 Hz for transformer Tr2. Further, it can be noted that the vibration power is less than 10 % of the maximum power from about 700 Hz for Tr2. In the case of Tr1, the vibration power does not reduce below 10 % until the frequency ranges from 3 kHz to f t (outside the frequency range shown in the figure). One can therefore suppose that of the two transformers, Tr1 has the poorest core technical condition. This conclusion is not so obvious if only the averaged vibration amplitude spectrum is analyzed (Figure 2a). The vibroacoustic diagnosis was confirmed by the internal transformer inspection, which showed a significant degradation of fixed insulation and of the wedges blocking the windings’ discs, as well as insulation damage between the core sheets. Vibroacoustic diagnostics of steady vibrations of the transformer tank working without load enable the detection of core damage. At the same time, other damages to the active part cannot be excluded, as demonstrated by internal inspection of the transformer unit being diagnosed.
In practice, diagnostic conclusions are formulated by an expert, a diagnostician, and the basis of inference is his/her professional experience. It is obvious that in this case, critical errors cannot be excluded. It would be extremely beneficial to formulate an objective quality criterion on the basis of which, unambiguously, it would be possible to estimate the mechanical state of the transformer unit core.
In the following, the article proposes the criterion for estimating the mechanical quality of the power transformer core, defined on the basis of the analysis of the relative vibration power of the tank in the steady state of vibrations without load (Figure 2b).
The article is organized in the following manner. In Section 2.1, the density function based on the transformer data is defined. The pseudo random generator is introduced in Section 2.2, and then, the applied statistical model is revised in Section 2.3. In Section 3, the detector transformer tool is presented.

2. Materials and Methods

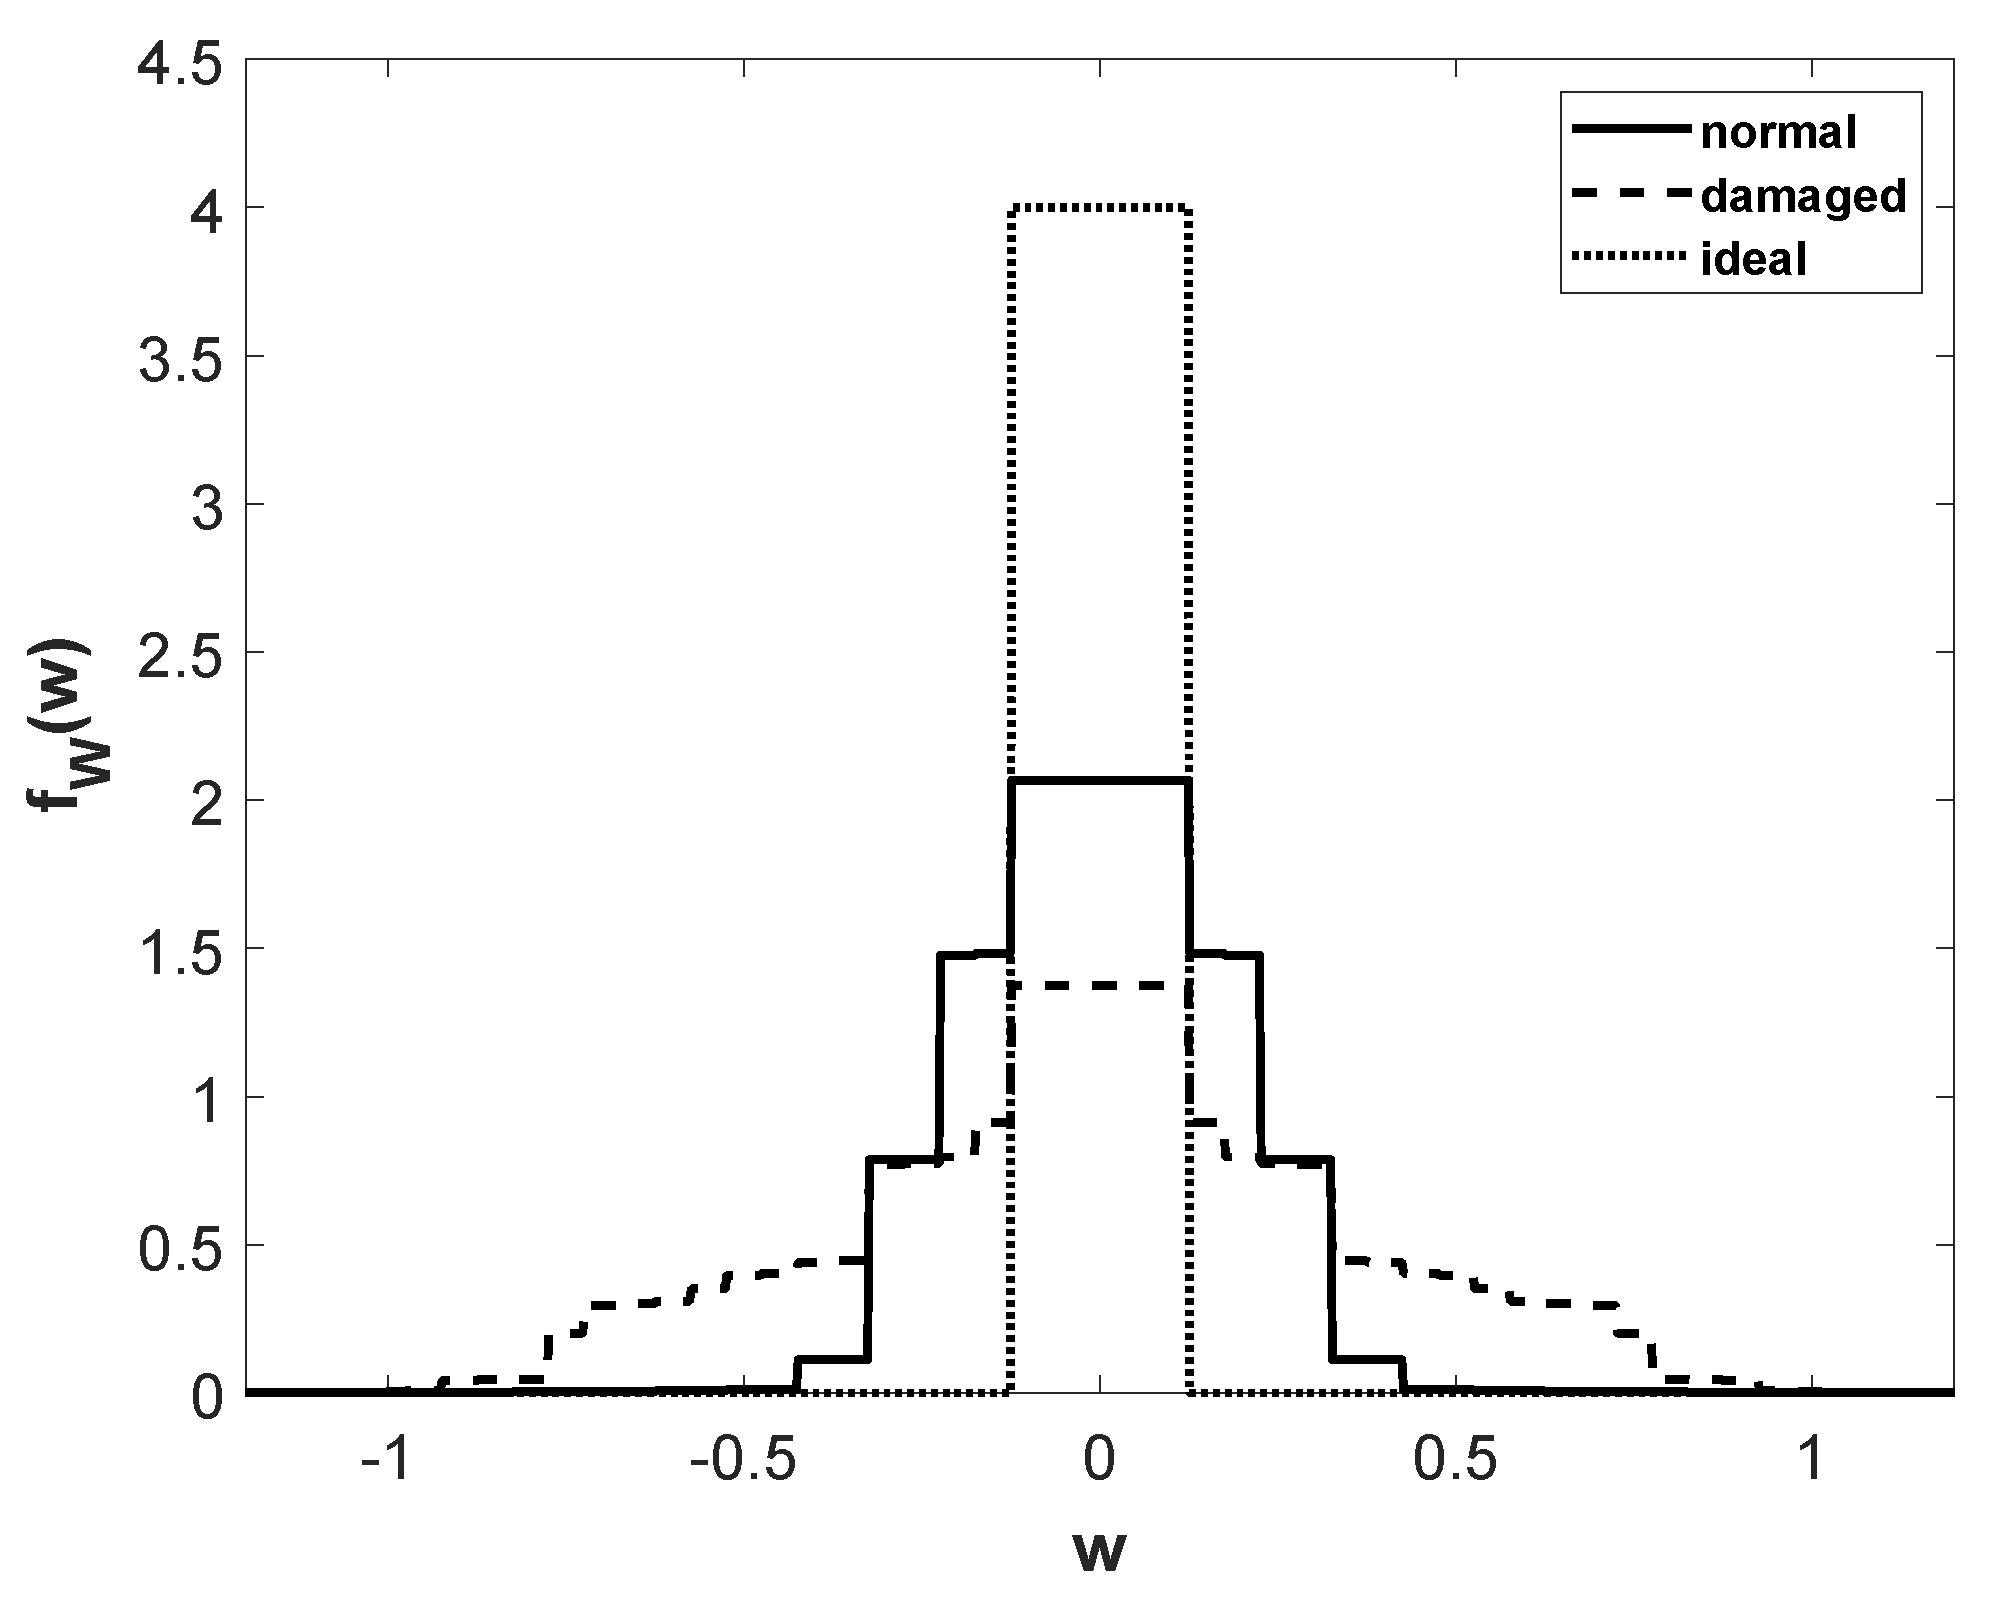
2.1. Density Function of Transformer Detector

The main goal is to find a way to identify a damaged transformer. For measured transformer data, after any transformations, a parametric model could approximate the final data. Instead of fitting a parametric model through any optimization method to transformer data, an alternative approach could be incorporated. A statistical model can be designed based on transformer data and any known statistical tool applied to obtain its parameters. The latter approach is used in the article.
A cumulative distribution function dependent on transformer data is defined. Then, the random samples are generated with this distribution. A well-known probability density function is selected to approximate the distribution of the random variables, and the parameters of this selected pdf are estimated. These parameters are used to detect the quality of a transformer.
From measured transformer data after the manipulations, the set of points h i = P r ( x i ) for i = 0 , , M , where x i < x i + 1 , is received.
Assuming a distribution with points x i with corresponding probabilities h i , the probability density function h ( x ) can be written using the Dirac delta function δ ( x ) as:
h ( x ) = i = 0 M h i · δ ( x x i ) , for   x 0 .
The probability density function h ( x ) of a normally working transformer is shown in Figure 3.
In the next step, the cumulative distribution function will be derived from the integration of the probability density function. In order to start the integration from the smallest probability values h i and from x = , h ( x ) is mirrored:
g ( x ) = h ( x ) = i = 0 M h i · δ ( x + x i ) , for   x 0 .
An unnormalized cumulative distribution function can be written as:
H ( t ) = t g ( x ) d x = i = 0 M h i · u ( t + x i ) , for   t 0 ,
where u ( t ) is the Heaviside step function:
u ( t ) = 1 , for   x 0 0 , for   x < 0 .
The cumulative distribution function is found by dividing H ( t ) by the whole area of g ( x ) :
G ( t ) = H ( t ) g ( x ) d x = i = 0 M g i · u ( t + x i ) , for   t 0 ,
where:
g i = h i A
and the normalization factor is:
A = i = 0 M h i .
This cumulative distribution function for a normally working transformer is shown in Figure 4.
The values y i = G ( x i ) for the points x i can be calculated in two ways: recursively (12) and nonrecursively (13).
y i = y i + 1 + g i , where   y M + 1 = 0
y i = j = i M g j
The points y i are drawn in Figure 4.
It would be better to enhance the G ( t ) function as piece-wise linear, instead of generating a random variable with such a cumulative density function by the inversion of G ( t ) . The piece-wise linear cumulative density function with the control points y i can be defined as:
L ( t ) = u ( t ) · y 0 + i = 0 M 1 t + x i + 1 x i + x i + 1 · y i y i + 1 + y i + 1 · u ( t + x i + 1 ) u ( t + x i ) , for   t 0 .
This piece-wise linear cumulative distribution function for a normally working transformer is shown in Figure 4.
The inversion of L ( t ) is required to obtain the random variable T.
T = L 1 ( Z ) ,
where Z is a uniformly distributed random variable:
f Z ( z ) = 1 , Z 0 , 1 .
The distribution of T is found through the density transformation as:
f T ( t ) = f Z ( z ) · d z d t = d L ( t ) d t , for   t 0 .
In order to create a symmetric density function, another random variable S is applied. It is drawn from the Rademacher distribution, where the probability mass function is:
f S ( s ) = 0.5 , for   s = 1 0.5 , for   s = 1 0 , otherwise .
Due to the independence of T and S:
f T S ( t , s ) = f T ( t ) · f S ( s ) ,
the joint distribution of T and S is:
f T S ( t , s ) = d L ( t ) d t · 0.5 , for   t 0 | s | = 1 .
The new random variable W created is:
W = T · S ,
where the joint distribution of W is found through the density transformation as:
f W ( w ) = d L ( | w | ) d w · 0.5 , for   w R .
A symmetric density function for normally working, damaged, and ideal transformers is depicted in Figure 5.

2.2. Generator for the Damaged Transformer Detector

Given the x i and h i coefficients, the procedure for generating samples with pdf (22) can be outlined in the following steps:
  • Generate a uniformly distributed random variable Z (16).
  • Calculate a random variable T from (15).
  • Generate a random variable S with (18).
  • Calculate a random variable W from (21).
The symmetric density function of W will be approximated by GGD.

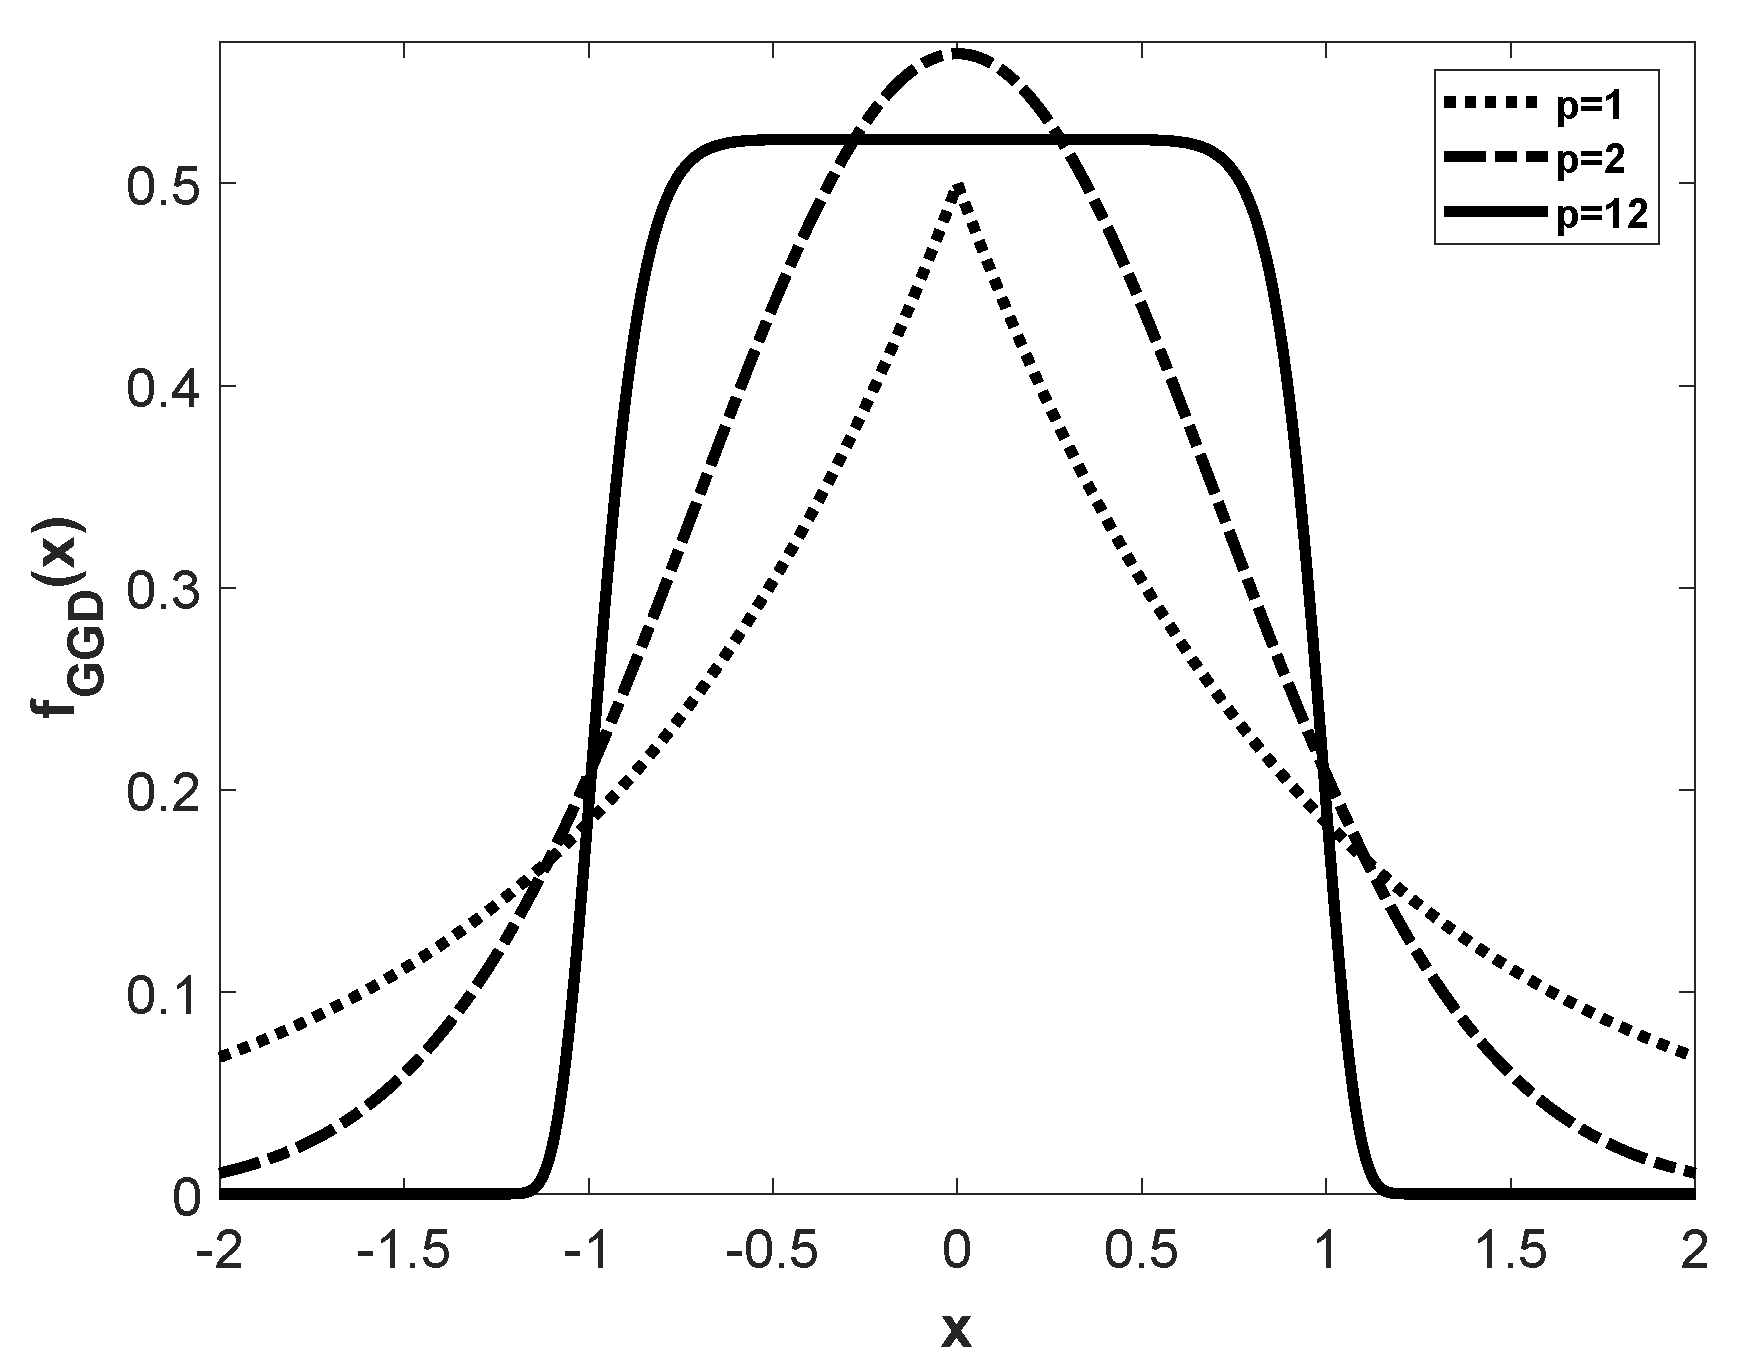
2.3. Generalized Gaussian Distribution

The statistical behavior of a multimedia signal can often be described using GGD. This distribution is used in the modeling of different types of signals in image and signal processing applications. GGD includes many widely-known distributions as special cases for various values of the exponent p:
  • p = 1 corresponds to the Laplacian Distribution (LD).
  • p = 2 corresponds to the Gaussian Distribution (GD).
  • When p , the GGD density function becomes a uniform distribution.
  • When p 0 , f ( x ) approaches an impulse function.
  • p = 1 / 2 was considered in [4].
  • p = 1 / 3 was discussed in [5].
  • A more general approach for the exponents 1 / m , m = 2 , 3 , was introduced in [6].
The probability density function of the continuous random variable of GGD is defined by the equation [7,8]:
f ( x ) = λ · p 2 · Γ 1 p e [ λ · | x | ] p ,
where λ is related to the standard deviation σ of the distribution, p is the shape parameter, and Γ ( z ) = 0 t z 1 e t d t , z > 0 [9]. The density function of GGD for different exponents is depicted in Figure 6.
GGD has been applied in many research areas, for instance:
  • The stereoscopic image quality assessment tool was designed in [10].
  • More facial details in the initial image synthesis were introduced in [11].
  • An efficient method to remove haze from a single image was given in [12].
  • The statistical properties of natural images used to get the Natural Scene Statistics (NSS) model were modeled in [13].
  • An alternative approach to the binarization of historical degraded document images was presented in [14].
Yu et al. [15] compared different approaches to the estimation of the shape parameter. The fast approximated estimator of the GGD shape parameter for real-time applications was introduced in [16]. In the article, the estimation of the shape parameter derived from the Maximum Likelihood (ML) method [8] was used.
The λ parameter is also determined by the ML method. Firstly, it is necessary to find the maximum likelihood function of (23) and to maximize it with respect to λ . After certain transformations, the maximum likelihood estimator can be obtained:
λ = N p · i = 1 N | x i | p 1 p ,
where N denotes the number of observed variables, and { x 1 , x 2 , , x N } is the collection of N i.i.d. zero-mean random variables.

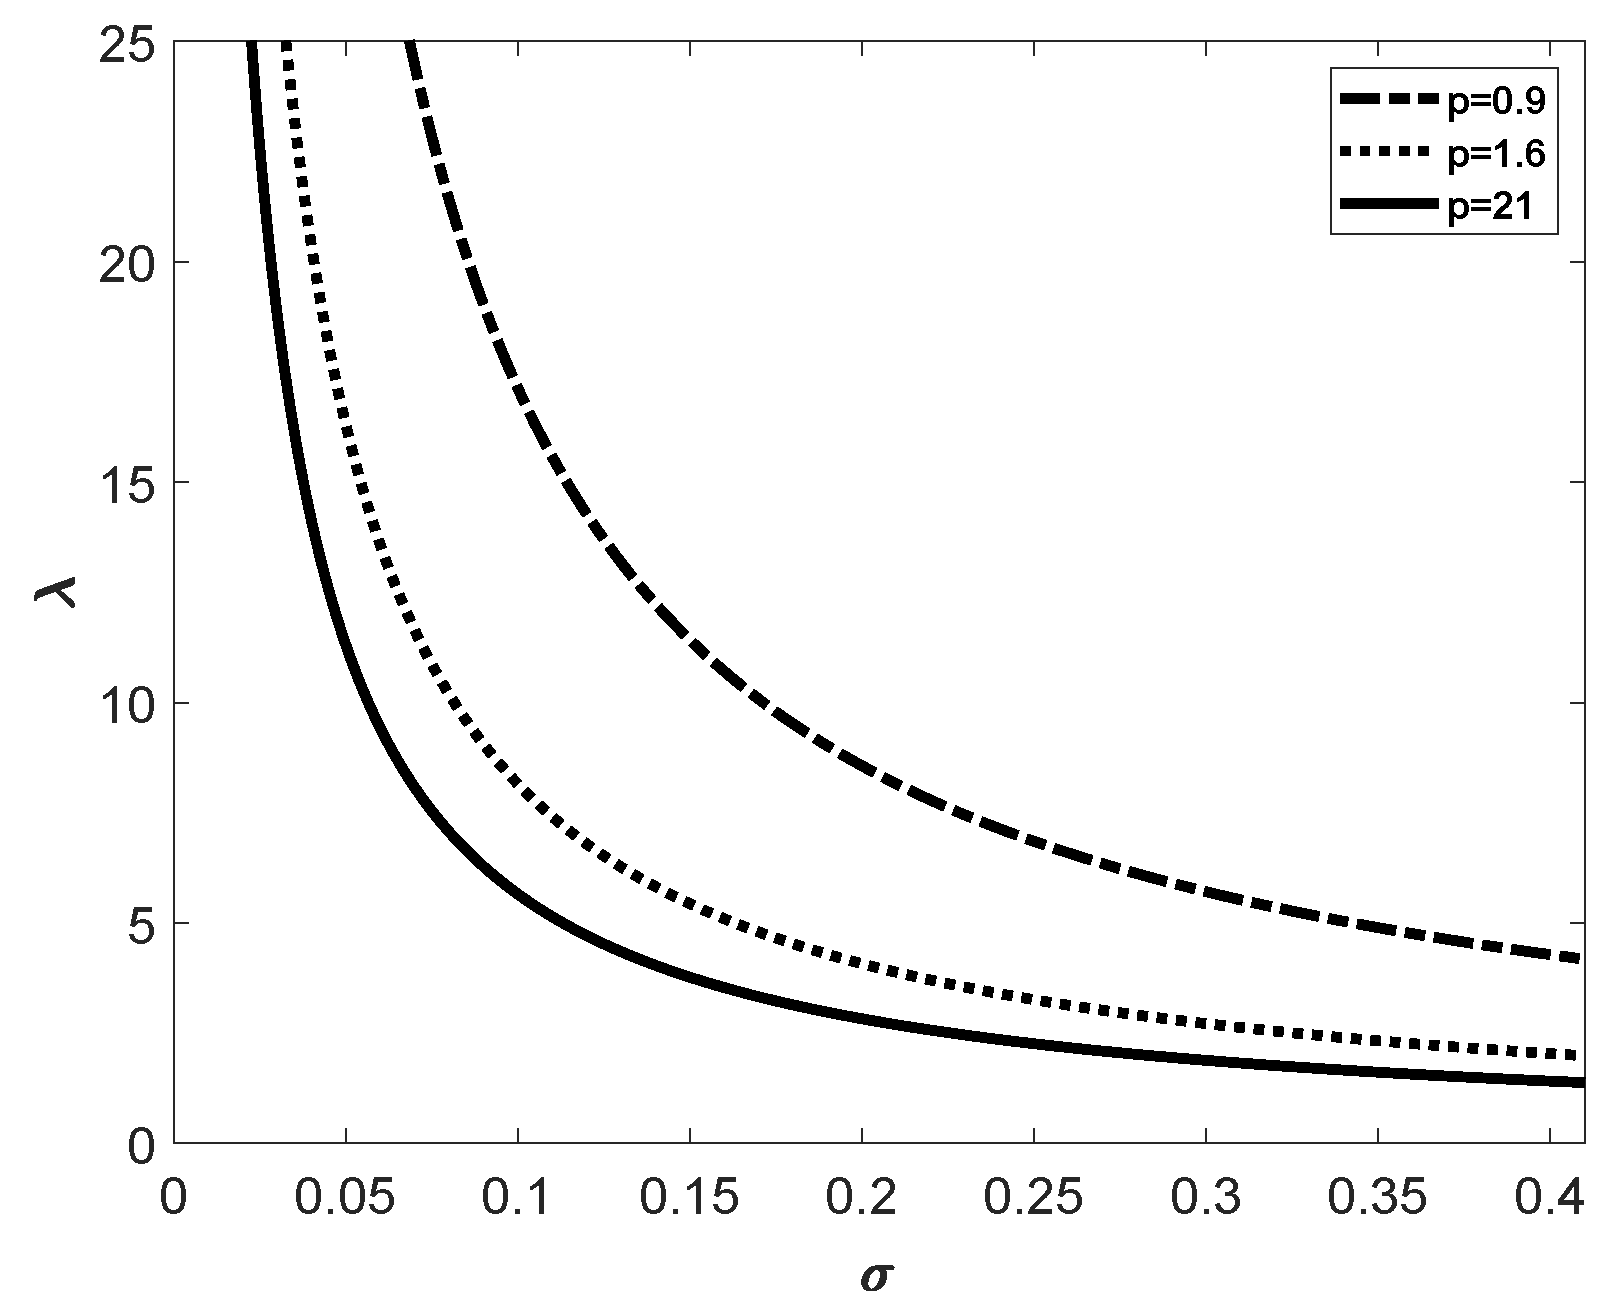
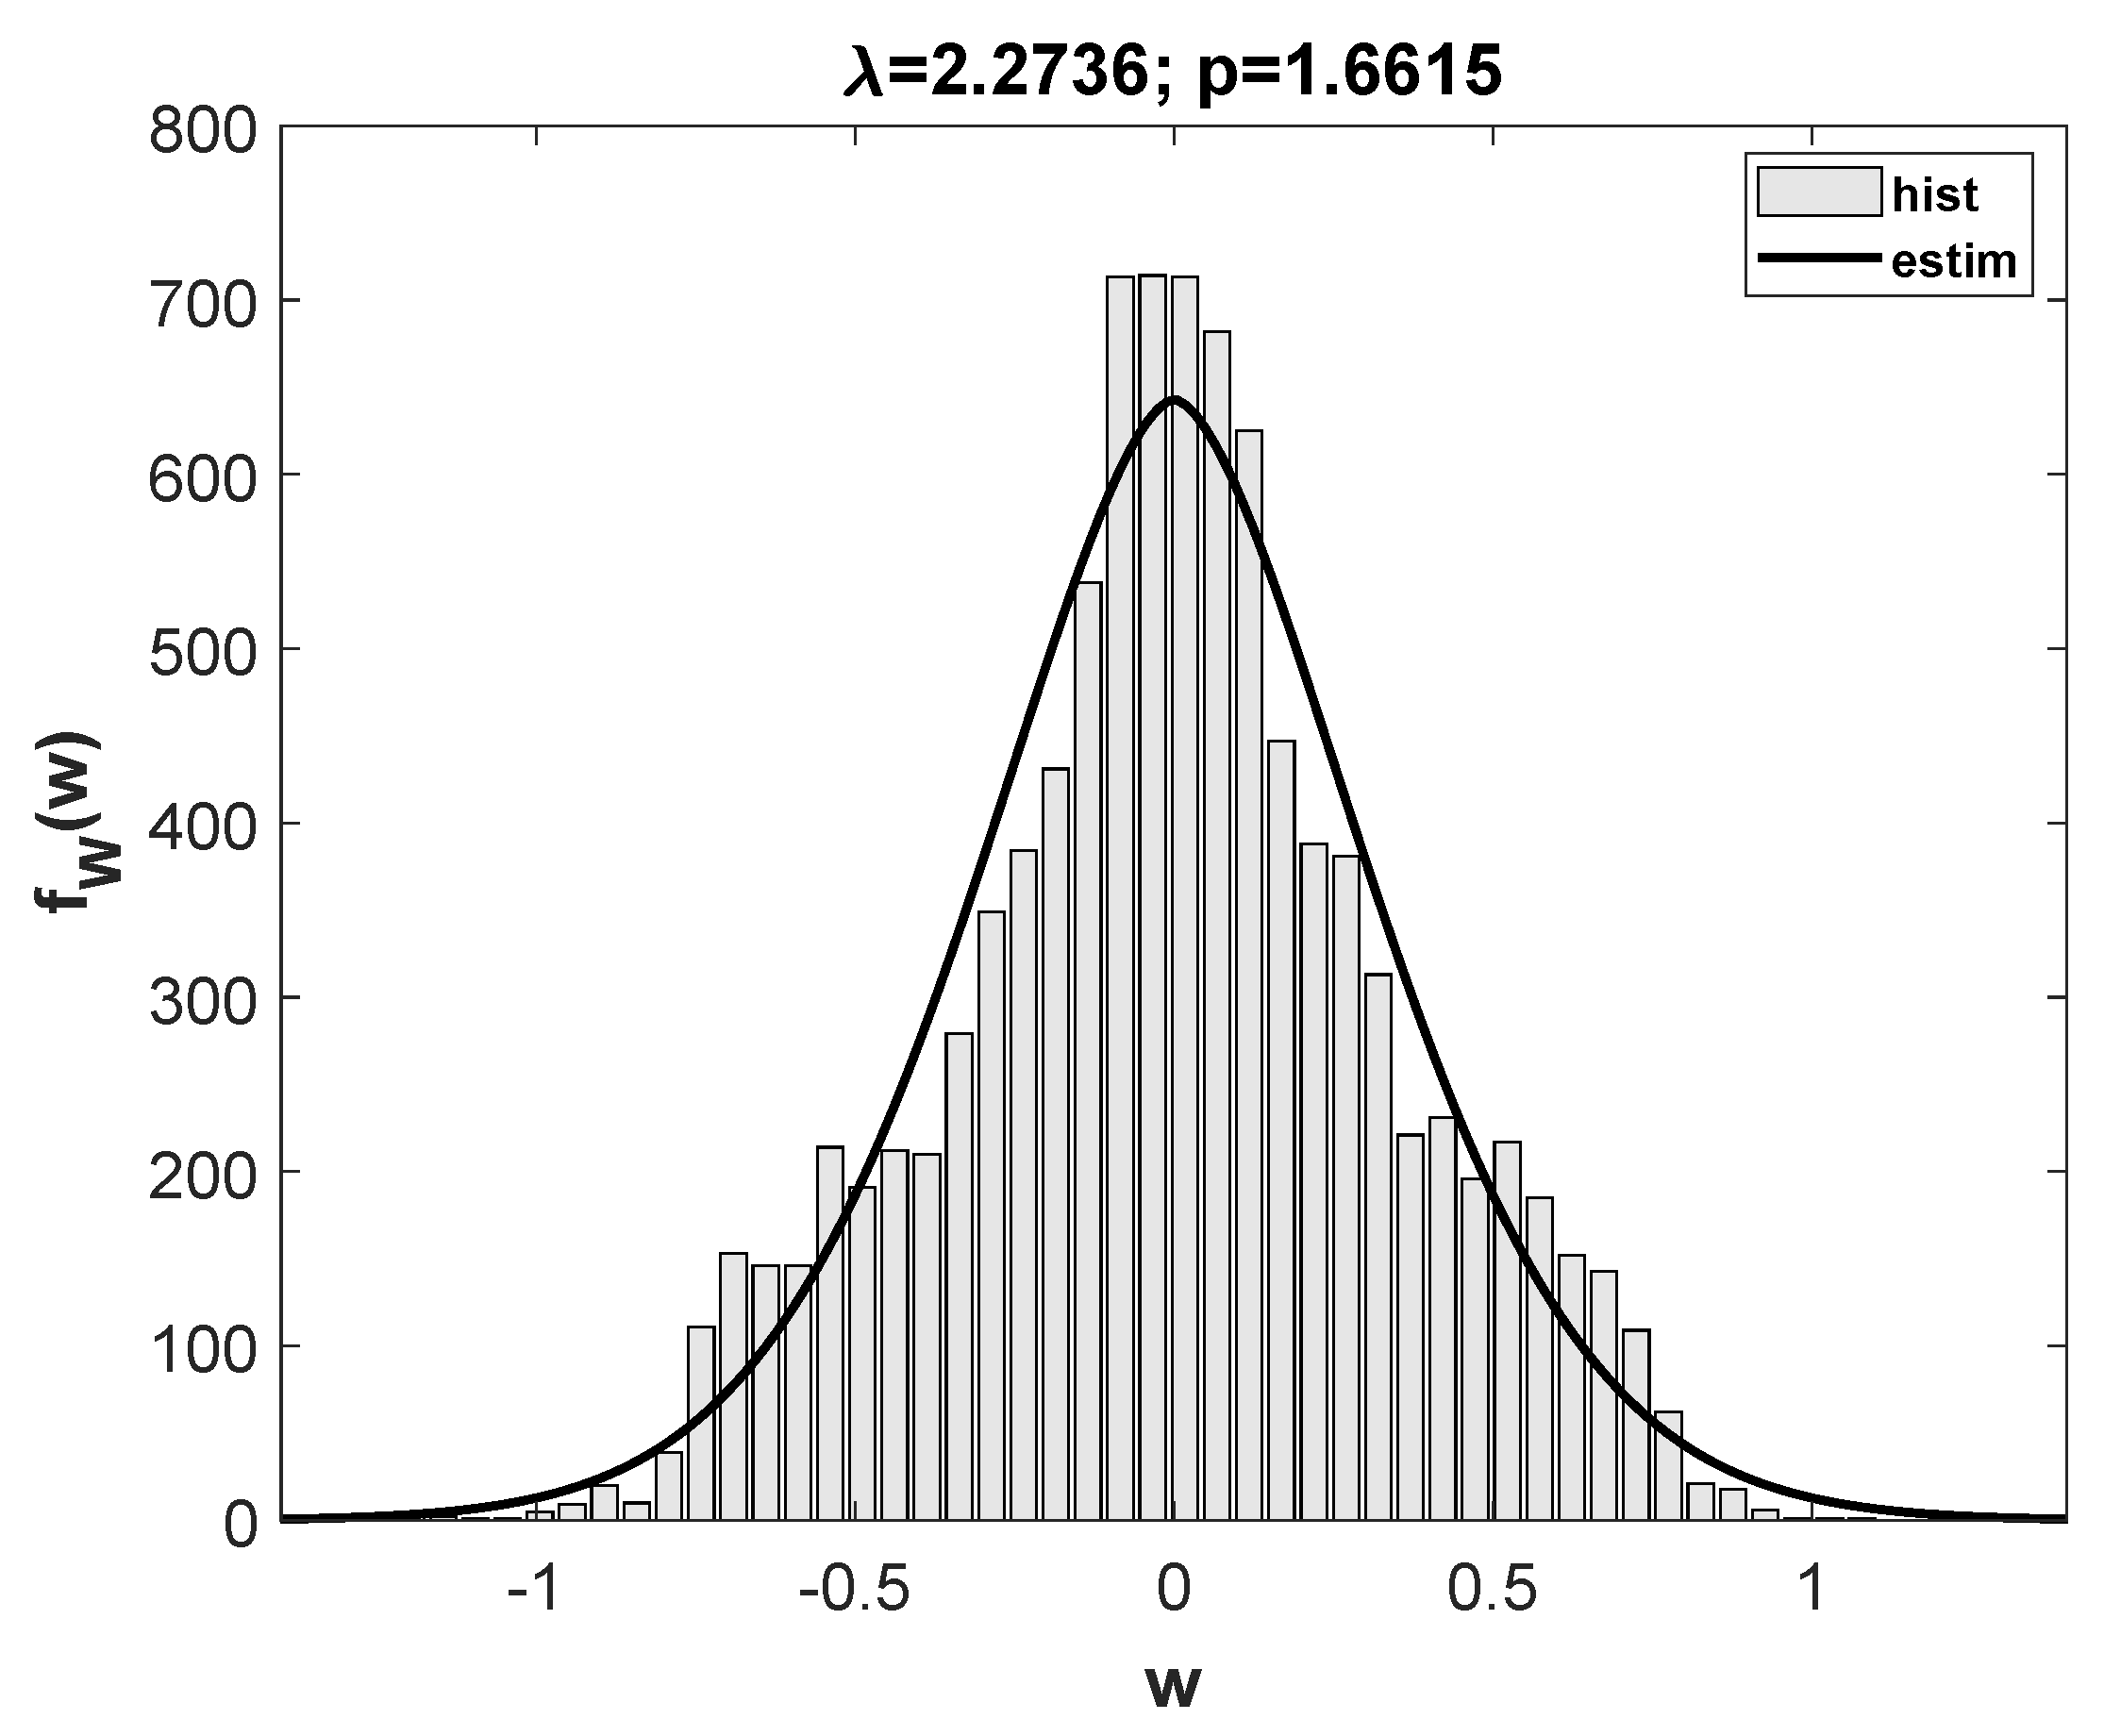
2.4. The GGD Parameters
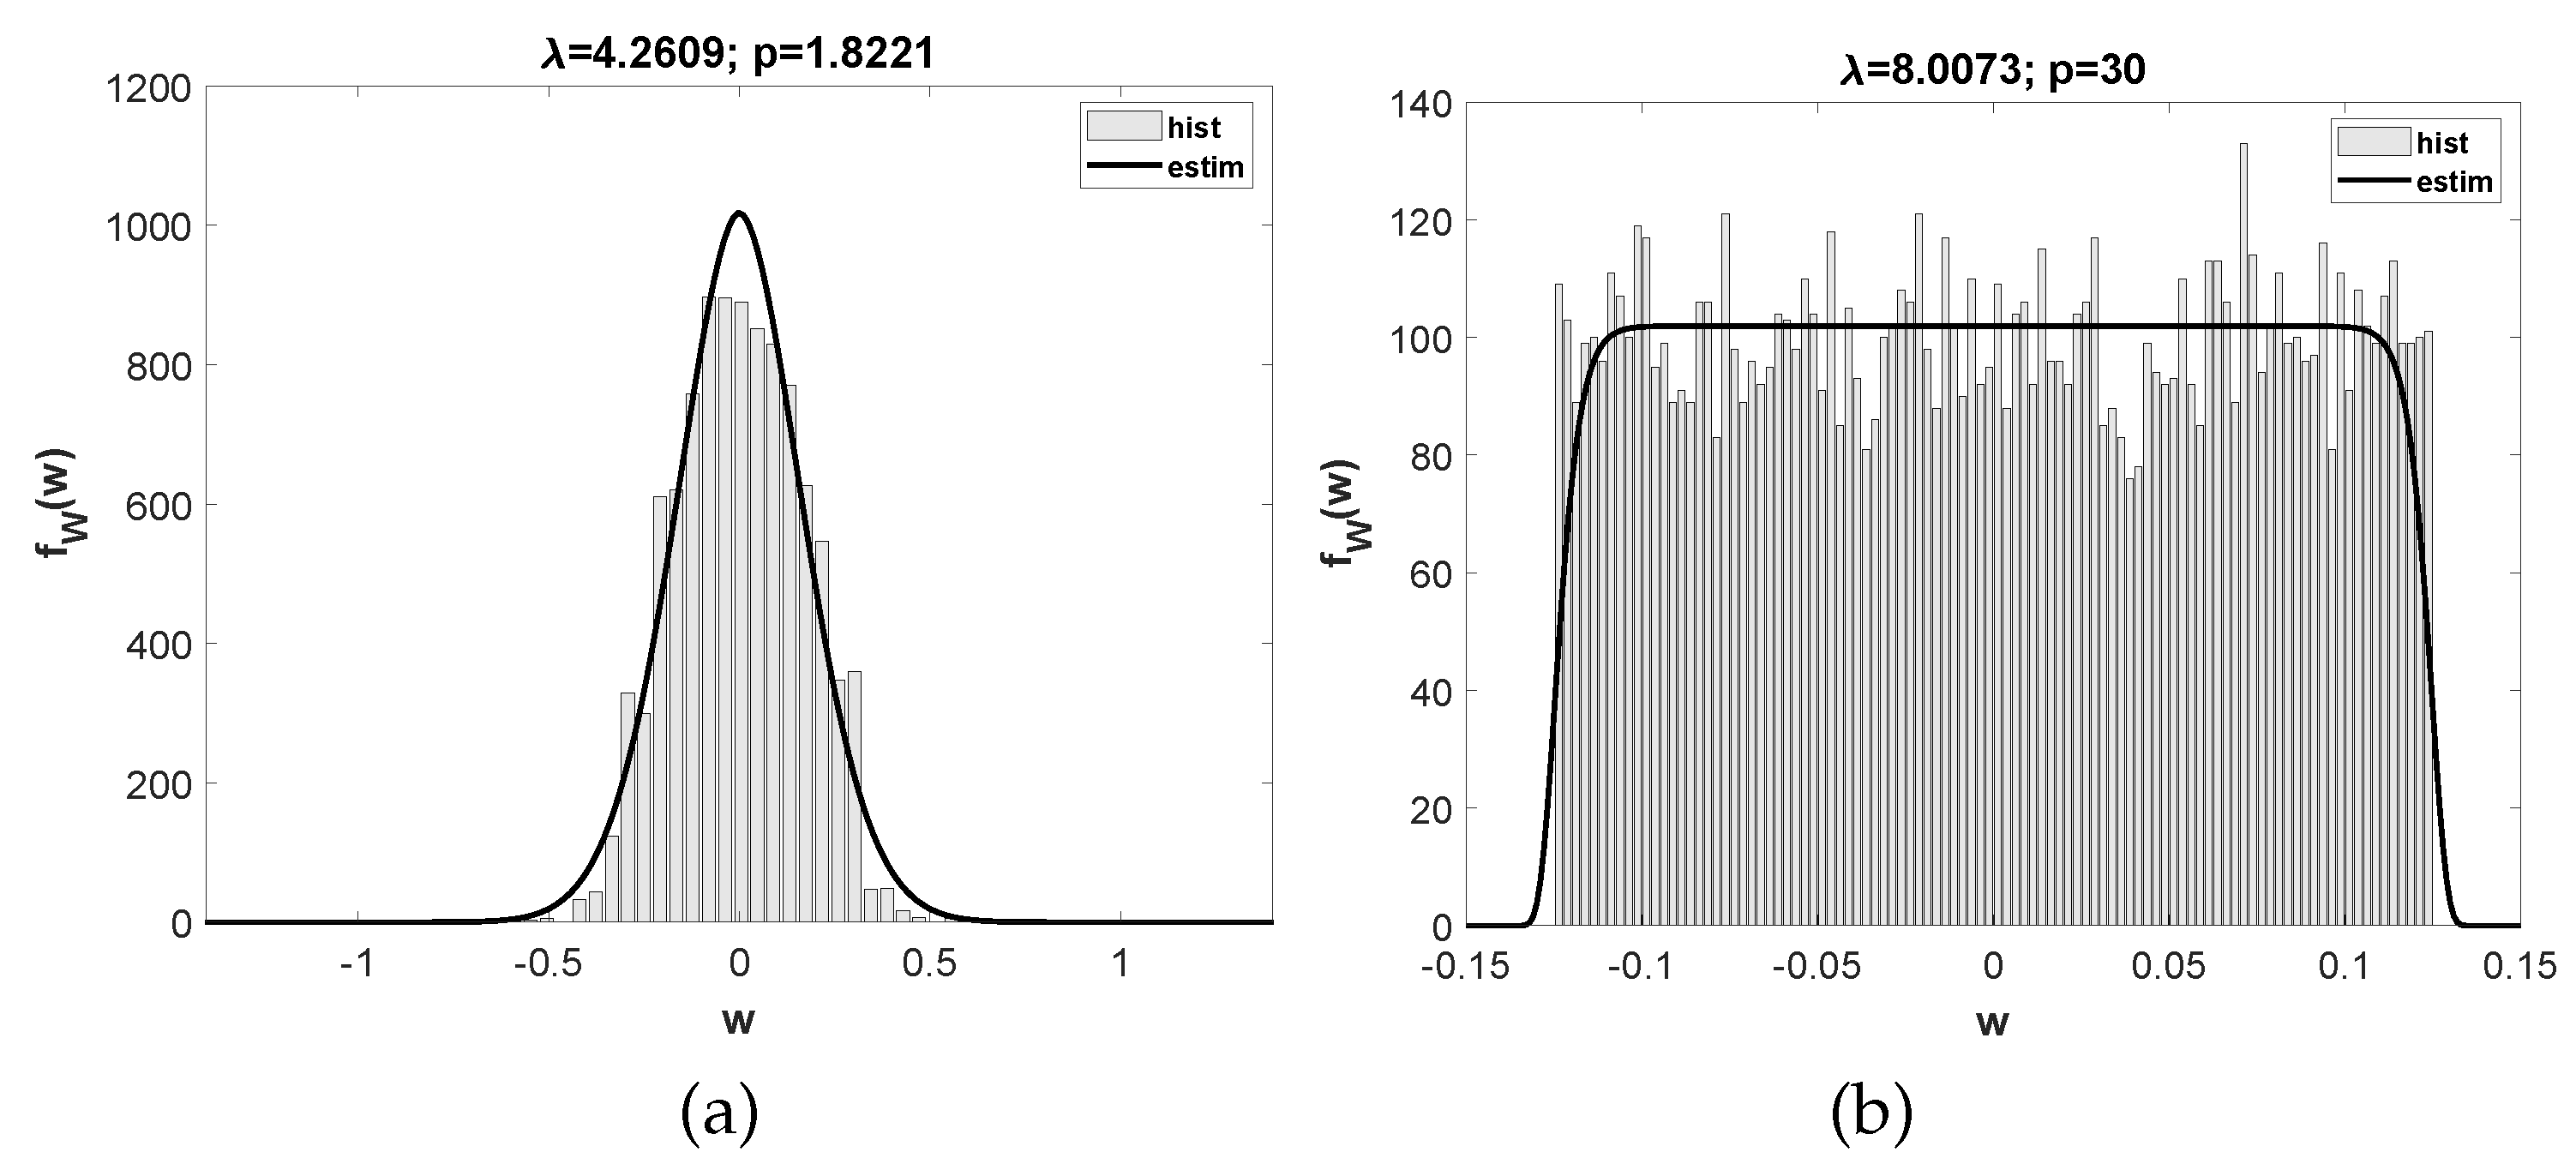
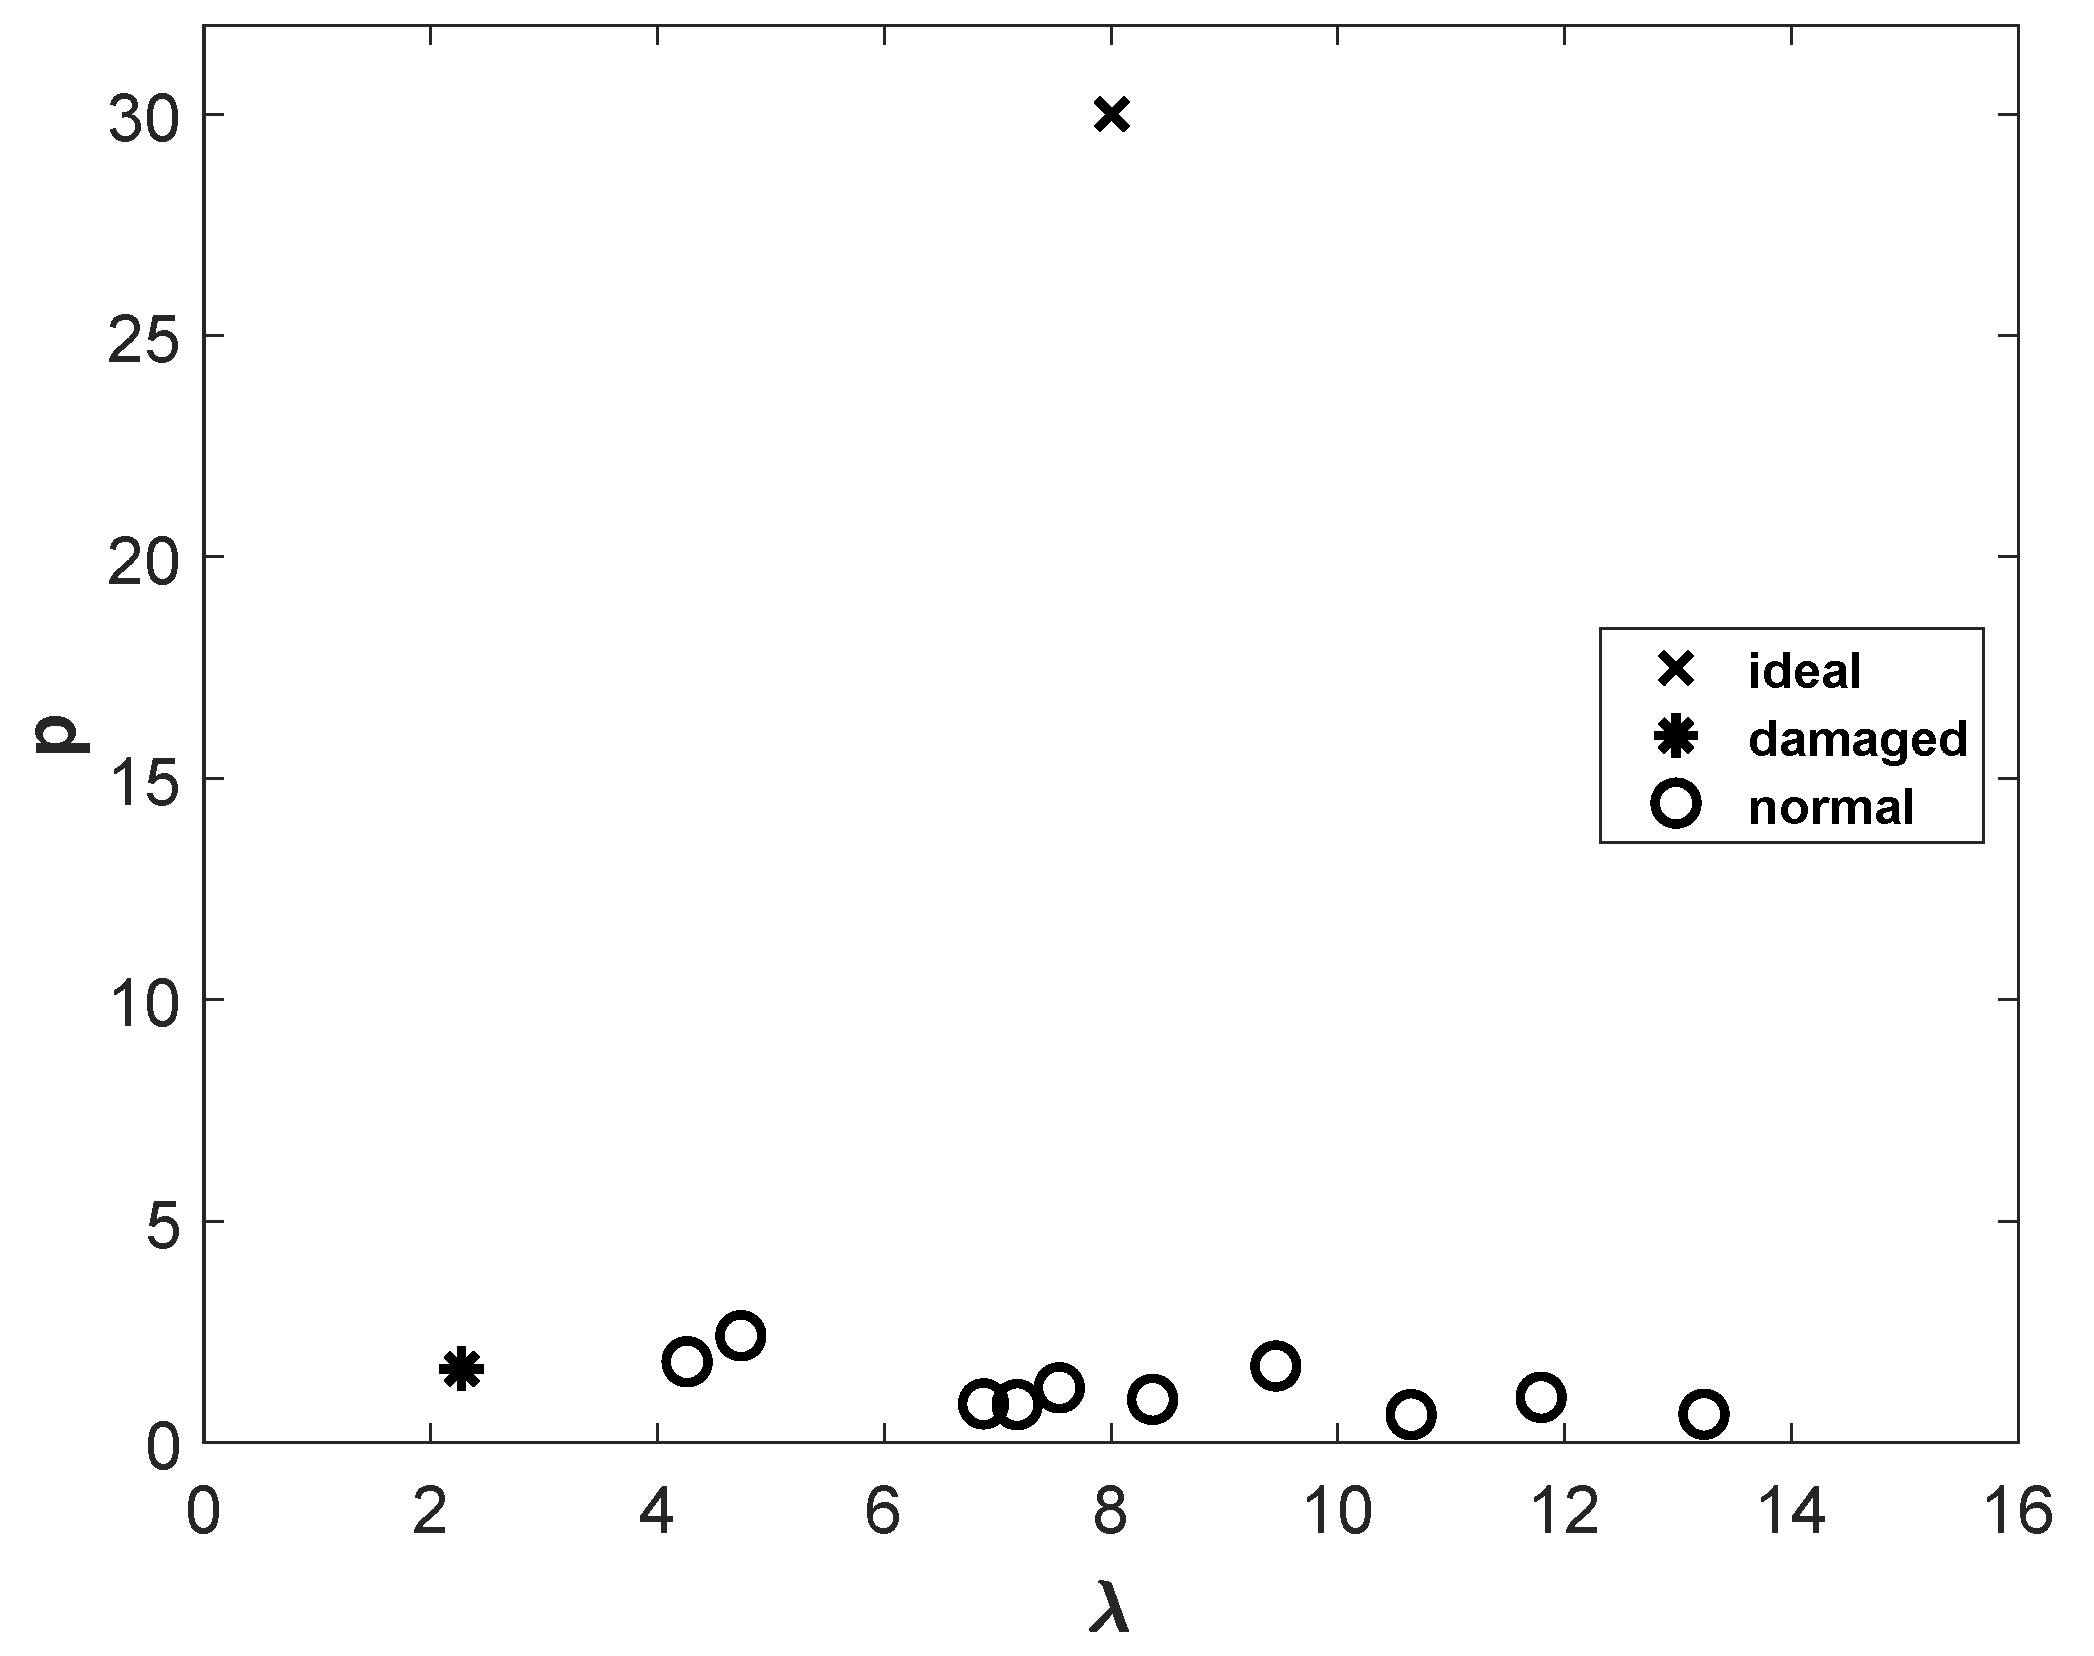
The exponent p of GGD affects the shape of the distribution. The influence of this parameter on the shape is shown in Figure 6. Three GGD distributions for three different p values are presented. It can be noticed that for smaller values of p ( p = 1 ), the pdf is getting more peaky; whereas, for p = 2 , it has the shape of the Gaussian distribution. As the value of p increases, the shape approaches a rectangular one ( p = 12 ), which corresponds to a uniform distribution.
The relation between the λ parameter and the standard deviation σ of the distribution is described by the equation [17]:
λ ( p , σ ) = 1 σ Γ ( 3 p ) Γ ( 1 p ) 1 2 .
Changes in the λ values depending on the change in the standard deviation value σ for different p parameters are shown in Figure 7. Based on the graphs, it can be seen that as the variance of the GGD distribution increases, the λ parameter value decreases. Thus, small λ values mean a higher value of variance.

3. Results

In order to analyze the operation of the algorithm, measurements for ten different normally functioning transformers and one damaged one were collected. Then, the relative changes of vibration power P r ( f ) (4) were determined for all cases. The ideal case was also added to the measurements producing 12 sets { h i = P r ( x i ) } . For each set, in accordance with Section 2.2, the corresponding random samples were generated, giving 12 sets of random samples. In the following step, the ML methods of GGD were applied to each sequence of random samples to find the parameters p and λ , producing 12 pairs ( p , λ ) .
The histograms for a normally working transformer and fitted GGD (23) are shown in Figure 8a.
The histograms of ideal and damaged transformers and fitted GGD distributions are depicted in Figure 8b and Figure 9, respectively.
The number of random samples was selected as 10,000 to obtain the outcome relatively fast. In the case of the ideal transformer, the solution of the ML equation for the shape parameter p went to infinity; therefore, the exponent p was limited to 30.
The estimated parameters p and λ for all considered transformers are collected in Figure 10. It is easily distinguishable that the damaged and ideal transformers were located in separate areas from the normally working ones.
The calculation results shown in Figure 10 relate to transformers of equal power of 16 MVA with different usage periods and degrees of wear. The transformer whose GGD parameters in Figure 10 were marked with the symbol * was in operation the longest: it was produced in 1975. According to the operation history of this unit, it failed several times as a result of overloads. The coordinates on the p λ plane and Figure 9 indicate that the λ parameter of this transformer was the smallest of all those analyzed with the ideal case combined. On the other hand, the transformer with the GGD parameters marked in Figure 10 on the right (the symbol o, λ 13 ) was the newest unit, produced in 2007, working flawlessly to this day. The technical condition of all transformers whose vibroacoustic analysis data were used in this work was verified by other diagnostic methods, in particular:
  • Frequency Response Analysis (FRA method),
  • gas chromatography (DGA—Dissolved Gas Analysis),
  • measurements of furans contents,
  • measurements of water contents,
  • tests of basic electrical properties: dielectric losses coefficient (tan δ ), volume resistivity, and dielectric strength.
The diagnostic results—with a time-consuming process of diagnosis—were consistent with the results obtained using the vibroacoustic method using GGD. Because the diagnosis (especially vibroacoustic GGD) of the transformer from 1975 indicated a high probability of significant degradation of the active part (in particular, the core), it was decided to perform an internal inspection. Figure 11 shows the dismantling process of the active part of this unit. For comparison, Figure 11c shows the appearance of the wedges blocking the active part of a healthy transformer.
The inspection result was clear: numerous deformations of the windings were found, and the core pressing loosened. Winding deformations were the result of a loss of clamping wedges (Figure 11b) due to, among others, excessive core vibration due to unpacking of sheets constituting its construction. The transformer was decommissioned.
Internal inspection proved that the transformer unit being diagnosed had damages in the entire active part. Winding defects were a secondary phenomenon: the proposed method of analyzing the state of steady vibrations determined during transformer operation without load allowed the identification of core defects, because the reason for the vibrations in this operating state was the phenomenon of magnetostriction. As the practice of vibroacoustic diagnostics of several dozen copies of transformers with different power shows, core unpacking is almost always accompanied by loosening of the winding blocking wedges and very often the deformation of turns.

4. Conclusions

The article proposed a method of detecting defects in the mechanical structure of a power transformer core. The basis of the diagnostic process was vibroacoustic tests of tank vibrations in a steady state, without load, and the mathematical apparatus based on the generalized Gaussian distribution analysis. At the current stage of development of the method of using GGD analysis in vibroacoustic diagnostics of the mechanical state of the active part of the power transformer, and in particular of the core state, it is not yet possible to define the boundary (critical) values of the p and λ parameters precisely. This is due to the fact that these values should be experimentally verified for individual groups of transformers. The power of the unit, voltages, and design features related to, e.g., the winding connection should be taken into account. In the article, on the example of 11 copies of transformers of the same type, the values of the p and λ parameters of the generalized Gaussian distribution depending on the mechanical quality of the transformer core were shown, and they could be used for fault detection. It was not possible to identify the type of damage accurately, which did not reduce the value of the proposed method. In the diagnostics of transformers, finding the existence of a defect with high probability is extremely valuable. This way, you can avoid unnecessary, in the absence of a defect, very expensive internal inspection. The conducted experimental research and comparison of the results with other diagnostic methods proved that the method could be used without the intervention of an expert diagnostician. The low costs of the industrial use of the proposed solution made it very attractive.
The implementation of the developed method was conditional on conducting numerous tests on transformer units with different power, design features, and service life. It was obvious that these tests were time-consuming and expensive, mainly due to the need for an internal inspection, which guaranteed unequivocal confirmation of the correctness of the GGD detection results. Works on the implementation of the vibroacoustic diagnosis of transformer units are currently carried out in cooperation with the Polish company Energo-Complex from Piekary Śla̧skie.

Author Contributions

Conceptualization, R.K. and E.K.; methodology, R.K. and E.K.; software, R.K.; validation, E.K.; formal analysis, R.K. and E.K.; investigation, R.K. and E.K.; resources, E.K.; writing—original draft preparation, R.K. and E.K.; writing—review and editing, R.K. and E.K.; visualization, R.K. All authors have read and agreed to the published version of the manuscript.

Funding

This research received no external funding.

Conflicts of Interest

The authors declare no conflict of interest.

References

  1. Ji, S.; Luo, Y.; Li, Y. Research on extraction technique of transformer core fundamental frequency vibration based on OLCM. IEEE Trans. Power Deliv. 2006, 21, 1981–1988. [Google Scholar] [CrossRef]
  2. Kornatowski, E.; Banaszak, S. Diagnostics of a Transformer’s Active Part with Complementary FRA and VM Measurements. IEEE Trans. Power Deliv. 2014, 29, 1398–1406. [Google Scholar] [CrossRef]
  3. Kornatowski, E. Mechanical-Condition Assessment of Power Transformer Using Vibroacoustic Analysis. Key Eng. Mater. 2012, 500, 40–44. [Google Scholar] [CrossRef]
  4. Chapeau-Blondeau, F.; Monir, A. Numerical Evaluation of the Lambert W Function and Application to Generation of Generalized Gaussian Noise With Exponent 1/2. IEEE Trans. Signal Process. 2002, 50, 2160–2165. [Google Scholar] [CrossRef] [Green Version]
  5. Krupiński, R. Reconstructed quantized coefficients modeled with generalized Gaussian distribution with exponent 1/3. Image Process. Commun. 2016, 21, 5–12. [Google Scholar] [CrossRef] [Green Version]
  6. Krupiński, R. Modeling Quantized Coefficients with Generalized Gaussian Distribution with Exponent 1/m, m = 2, 3, …. In Proceedings of the Man-Machine Interactions 5: 5th International Conference on Man-Machine Interactions, ICMMI 2017, Kraków, Poland, 3–6 October 2017; Gruca, A., Czachórski, T., Harezlak, K., Kozielski, S., Piotrowska, A., Eds.; Springer International Publishing: Cham, Switzerland, 2018; pp. 228–237. [Google Scholar]
  7. Clarke, R.J. Transform Coding of Images; Academic: New York, NY, USA, 1985. [Google Scholar]
  8. Du, Y. Ein sphärisch invariantes Verbunddichtemodell für Bildsignale. Archiv für Elektronik und Übertragungstechnik 1991, AEÜ-45, 148–159. [Google Scholar]
  9. Olver, F.W.J. Asymptotics and Special Functions; Academic Press: New York, NY, USA, 1974. [Google Scholar]
  10. Ma, L.; Wang, X.; Liu, Q.; Ngan, K.N. Reorganized DCT-based image representation for reduced reference stereoscopic image quality assessment. Neurocomputing 2016, 215, 21–31. [Google Scholar] [CrossRef]
  11. Song, C.; Li, F.; Dang, Y.; Gao, H.; Yan, Z.; Zuo, W. Structured detail enhancement for cross-modality face synthesis. Neurocomputing 2016, 212, 107–120. [Google Scholar] [CrossRef]
  12. Wang, R.; Li, R.; Sun, H. Haze removal based on multiple scattering model with superpixel algorithm. Signal Process. 2016, 127, 24–36. [Google Scholar] [CrossRef]
  13. Zhang, Y.; Wu, J.; Xie, X.; Li, L.; Shi, G. Blind image quality assessment with improved natural scene statistics model. Digit. Signal Process. 2016, 57, 56–65. [Google Scholar] [CrossRef]
  14. Krupiński, R.; Lech, P.; Tecław, M.; Okarma, K. Binarization of Degraded Document Images with Generalized Gaussian Distribution. In Computational Science—ICCS 2019; Rodrigues, J.M.F., Cardoso, P.J.S., Monteiro, J., Lam, R., Krzhizhanovskaya, V.V., Lees, M.H., Dongarra, J.J., Sloot, P.M., Eds.; Springer International Publishing: Cham, Switzerland, 2019; pp. 177–190. [Google Scholar]
  15. Yu, S.; Zhang, A.; Li, H. A review of estimating the shape parameter of generalized Gaussian distribution. J. Comput. Inf. Syst. 2012, 21, 9055–9064. [Google Scholar]
  16. Krupiński, R.; Purczyński, J. Approximated fast estimator for the shape parameter of generalized Gaussian distribution. Signal Process. 2006, 86, 205–211. [Google Scholar] [CrossRef]
  17. Krupiński, R. Approximated fast estimator for the shape parameter of generalized Gaussian distribution for a small sample size. Bull. Polish Acad. Sci. Tech. Sci. 2015, 63, 405–411. [Google Scholar] [CrossRef] [Green Version]
Figure 1. Transformer tank vibration signal; a—momentary value of acceleration, n ( t ) —steady vibration caused by magnetorestriction.
Energies 13 02525 g001
Figure 2. Frequency amplitude spectra (a) and relative changes of vibration power P r ( f ) (b) of two transformers: Tr1 (left), Tr2 (right).
Energies 13 02525 g002
Figure 3. Probability density function h ( x ) (5) for a selected normally working transformer for the points x i with corresponding probabilities h i .
Energies 13 02525 g003
Figure 4. Cumulative distribution function for a normally working transformer G ( t ) and the corresponding piece-wise linear cdf L ( t ) , and y i = G ( x i ) .
Energies 13 02525 g004
Figure 5. A symmetric density function (22) for a normally working, a damaged, and an ideal transformer.
Energies 13 02525 g005
Figure 6. Density function of GGD with λ = 1 for three selected exponents p = 1 , p = 2 , and p = 12 .
Energies 13 02525 g006
Figure 7. Relation between λ and σ of Generalized Gaussian Distribution (GGD) (25).
Energies 13 02525 g007
Figure 8. Histogram of a normally working transformer (a) and an ideal transformer (b), and the fitted GGD.
Energies 13 02525 g008
Figure 9. Histogram of a damaged transformer (22), and the fitted GGD.
Energies 13 02525 g009
Figure 10. A 2D plane of the GGD parameters p and λ for normally working, ideal, and damaged transformers.
Energies 13 02525 g010
Figure 11. Disassembly of the active part of the power transformer (a), mechanical damage to the active part with visible clamping wedges (b), and the blocking wedges of a “healthy” transformer (c).
Energies 13 02525 g011

