Abstract
The aim of this study is to assess how the use of fossil and nuclear power in different renovation scenarios affects the environmental impacts of a multi-family dwelling in Sweden, and how changes in the electricity production with different energy carriers affect the environmental impact. In line with the Paris Agreement, the European Union has set an agenda to reduce greenhouse gas emissions by means of energy efficiency in buildings. It is estimated that by the year 2050, 80% of Europe’s population will be living in buildings that already exist. This means it is important for the European Union to renovate buildings to improve energy efficiency. In this study, eight renovation scenarios, using six different Northern European electricity mixes, were analyzed using the standard of the European Committee for Standardization for life cycle assessment of buildings. This study covers all life cycle steps from cradle to grave. The renovation scenarios include combinations of photovoltaics, geothermal heat pumps, heat recovery ventilation, and improvement of the building envelope. The results show that while in some electricity mixes a reduction in the global warming potential can be achieved, it can be at the expense of an increase in radioactive waste production, and, in mixes with a high share of fossil fuels, the global warming potential of the scenarios increases with time, compared with that of the original building. It also shows that in most electricity mixes, scenarios that reduce the active heat demand of the building end up in reducing both the global warming potential and radioactive waste, making them less sensitive to changes in the energy system.
1. Introduction
According to the Intergovernmental Panel on Climate Change (IPCC) [1] the global mean temperature has increased within a probable range of 0.8 to 1.2 °C from pre-industrial levels, and will reach 1.5 °C between 2030 and 2052, if it continues to increase at the current rate. Climate change has been becoming more serious than shown in previous reports, and there is a need to decrease greenhouse gas (GHG) emissions drastically in order to meet the 1.5 °C target. Within the European Union, (EU) the energy industries represent 26% of the total GHG emissions [2]. The European Union (EU) has set goals to reduce GHG emissions by 40% by the year 2030 compared with 1990 levels [3]. Buildings represent 40% of the energy use and 36% of GHG emissions within the EU [4].
By the year 2050, around 80% of the buildings that exist today will remain in use [5], being in need of energy efficient renovation. This is based on the current replacement rate of 1% to 3% [2] Therefore energy efficiency measures in existing buildings are of greater importance than designing new buildings with a low energy demand.
In renovation for improved energy efficiency, the aim is to decrease energy use and greenhouse gas (GHG) emissions, while also improving the indoor air quality and architectural qualities [6]. There are different approaches to achieve these goals, and the most widespread solutions are changes in the building envelope, changes in the architectural properties of the building, or retrofitting building services. Life cycle assessment (LCA) is a strategy that has been used to analyze these types of renovation strategies [7,8], where different renovation strategies are mainly analyzed one by one and not combined.
Sweden has an unusually large share of electrical heating compared with other EU countries [9] and the current requirements for nearly zero energy building in Sweden favor heat pumps (HP) [10]. According to Swing Gustafsson et al. [11] the Swedish electricity consumption is dependent on the weather due to a large share of electrical space heating. Thus, they argue that strategies that focus on changing energy carriers for space heating in a building using district heating (DH) increase the electricity demand.
In order to meet future electricity demands there is a need to change the energy conversion to meet environmental needs [12]. However, energy supply transitions are complex, uncertain and difficult to evaluate [13]. Additionally, there is a necessity to consider energy system models as emergent energy technologies appear. To address the complexity of the question it is possible to illustrate consequences of changes in the electricity production by applying different electricity mixes.
One of the possible scenarios that the IPCC have proposed to the meet the 1.5 °C target is to increase the share of nuclear power [1]. Even if uranium is a non-renewable resource, it is not a fossil fuel and has very low GHG emissions from a life-cycle perspective. However, nuclear power is a problematic topic. Problems include risks for nuclear accidents, mining problems [14] and ionization of nuclear waste [15]. Additionally, according to Eriksson [16] the production of nuclear power is not resource efficient. However, the calculated risk for nuclear radiation damage to human beings and other living organisms is quite low [17].
It has been discussed that some of the IPCC scenarios, in line with the 1.5 °C targets, with the increase of nuclear power can lead to shifting the burden in life cycle environmental impacts [18] with additional problems related to nuclear waste and access to fresh water. The authors argue that these scenarios, because of GHG emission reductions in the short run, will end up with policies that are more astringent. The aim of this study is to:
- (1)
- Assess the life cycle environmental impacts of the use of fossil power and nuclear power in different renovation strategies for multi-dwelling buildings in a Nordic climate.
- (2)
- Identify and discuss the implications of how changes in the electricity production mix affect the environmental impacts when changing energy carriers for building space heating and domestic hot water use.
2. Methodology
2.1. Case Study Building
The case study building is a three-story multi-family dwelling located in the municipality of Borlänge, Sweden, 250 km north of Stockholm. The building was built between the years 1969–1971 and is a typical representative of the Million Programme where a million homes were to be built during a ten-year period to provide homes at a reasonable price. The gross building area is 2822 m2. All the different renovation scenarios are applied to the same building. This study is based on an estimated lifespan of 50 years.
For this building, eight renovation scenarios were assessed (already defined in [19]). Different combinations of renovation measures were assessed, such as added insulation, energy efficient windows, and heat recovery ventilation (HRV). Different combinations of District heating (DH), geothermal heat pumps (GHP) and photovoltaics (PV) were also taken into consideration for heating and electricity for utilities. The different combinations are found in Table 1.

Table 1.
Renovation packages.
2.2. Building Energy Simulation
The building was simulated using the software IDA-ICE V.4.7.1 (EQUA AB, Stockholm, Sweden) [20]. It is a software that simulates indoor climate and energy use in buildings. According to the software producers it is possible to simulate any particular installations configuration. The energy demand considered in this study was the active heating demand, domestic hot water, and facility electricity consumption. More data can be found in the Supplementary Materials. The PV electricity production was calculated using Photovoltaic geographical information system (PVGIS) [21]. The energy demand estimated for this study complies with the Swedish building code [22] regarding space heating, domestic hot water, and electricity to facilities.
2.3. Life Cycle Assessment
The life cycle assessment of the different renovation alternatives was carried out in accordance with the EN Standard for LCA of buildings [23]. The goal of the LCA is to investigate how different renovation strategies affect the global warming potential (GWP) and the production of radioactive waste (RW) with respect to electricity generation. The functional unit is the entire case study building in use over a period of 50 years, thereafter the building is considered to be suitable for renovation or demolition.
This study is a cradle to grave study excluding the benefit and loads beyond the system boundaries. As this study complies with the EN 15978 standard this means an attributional LCA. This study assesses eight renovation scenarios using six different electricity mixes. In order to simplify the study, it is considered that the building would keep the same DH energy mix. The scenarios reflected here are either more or less material intense. Different energy carriers are investigated, replacing DH with geothermal heat pumps (GHP). Information about the scenarios is presented in the Supplementary Materials.
2.4. Life Cycle Inventory
The proposed measures have previously been studied by Ramirez-Villegas et al. [19], who consider the electricity mix in Sweden, whereas in this study the electricity mix for different countries has been considered. In Table 2 all used material data is compiled. The datasets adopted in this study are product-specific environmental product declarations (EPD). When more than one EPD was possible to be used, the one with the more relevant geographic data was adopted. For materials with no EPD available, generic data from Ecoinvent and GaBi were used. To reflect the potential environmental impact for material production, the datasets were compensated according to the CEN/TR 15941 method. All the material used was provided by a local building construction company. All distances were based on average data from the Nordic countries (60 km, trailer combination 40 tonnes, 100% fill rate). All upstream data are from Ecoinvent and GaBi databases.
Table 2.
Material datasets.
The assumption in this study is that the energy use of the building would remain unchanged for the next 50 years. The building is located in the municipality of Borlänge, with access to district heating utilizing domestic waste incineration with energy recovery and industrial excess heat as the main sources as show in Table 3. As the selected software only allows data that is verified in an EPD, the nearest possible verified data when it comes to emissions, were used from Göteborg Energy Partille Ale.
Table 3.
Fuel use (%) for district heating 2016.
2.5. Environmental Impact Assessment
The EN standard for the LCA of a building [23] requires the use of the CML 2002 impact assessment method proposed by the Center of Environmental Science at the University of Leiden. This methodology is restricted to quantitative modeling in order to reduce uncertainties based on an approach where results are grouped in common midpoint categories. In this study, two relevant impact categories are considered: global warming potential (GWP) and radioactive waste disposal (RW). GWP indicates the relevant impact globally, where a large part is from energy use. RW is relevant as nuclear power is largely used in electricity generation in many countries such as Sweden and it also represents the future where nuclear power may increase.
2.6. Environmental Payback
According to Asdubrali et al. [24] it is possible to extend economic analysis in environmental fields. One of the indicators that can be used is the payback times using LCA: The environmental payback (EP) can be a suitable way to present results from such a point of view.
In order to calculate the “Environmental Payback (EP)” a method described by Nydahl et al. [25] is used. The methodology output is illustrated in Figure 1.
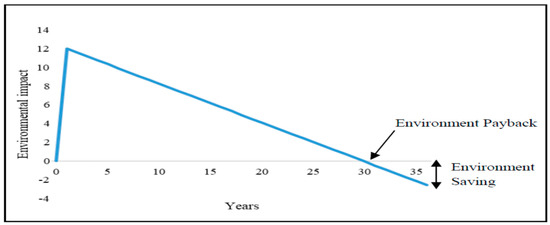
Figure 1.
Environmental payback.
Figure 1 illustrates that during the production stages (A1–A5) (see Figure 2) the added embodied environmental impact (AEEI) increases due to the environmental impact that is related to construction materials, transport, and the building process. Then, as the energy refurbishment is made the environmental impact decreases compared with the environmental impact of the original building. The change in the operational environmental impact (ΔOEI = OEIunrefurbished – OEIrefurbished) would compensate (or increase) the total environmental impact. The EP of a building is given as:
giving, finally, the environmental return of investment (eROI), based on the projected service life of the building (SL):
when the eROI is above 1, it can be assumed that a refurbishment package gives a positive environmental impact compared to the original building. Otherwise, the total renovation impact on the environment is negative, being a non-desirable scenario.
EP = AEEI/ΔOEI
eROI = SL/EP
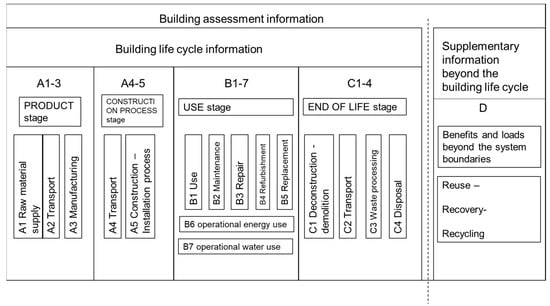
Figure 2.
Building Life Cycle Assessment (EN 15978) [23].
3. Results
The energy use of the building during the operation phase is shown in Table 4. Note that scenario 0 refers to the building in its current state.
Table 4.
Annual energy use.
Figure 3 and Figure 4 show results for the different renovation scenarios where the environmental payback is compared to the original building. The visualization implies that all stages A1–5 will result in an increase in environmental impact. A decrease in energy use will result in a corresponding decrease in environmental impact and an increase (such as increased use of electricity) will lead to higher impact compared to the original building. The rate of the environmental savings depends on the amount of energy used and the changes in the electricity mix.
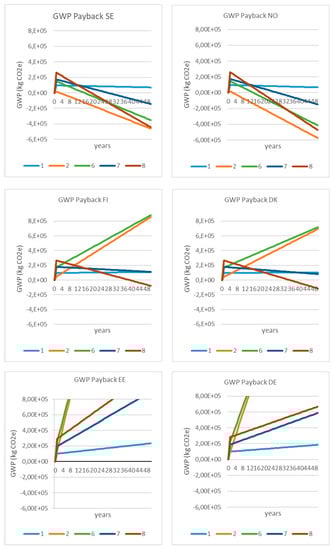
Figure 3.
GWP Payback of the renovation scenarios based on different electricity mixes.
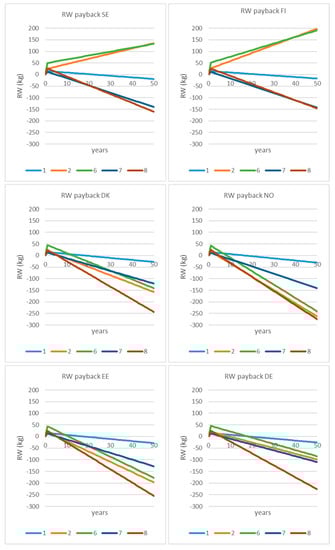
Figure 4.
RW Payback of the different renovation scenarios with different national electricity mixes.
In order to simplify the results visually, only the five scenarios with the most noticeable impacts are shown. The results of all scenarios are found in the Supplementary Materials. The diagrams excluded in the results section are scenarios with a significance somewhere in between the displayed scenarios.
Figure 3 shows the selected scenarios in terms of GWP payback. It can be seen in the figure that there are three different groups with similar GWP impacts but different energy sources. At the top of the figure are Sweden and Norway (SE and NO) that have low carbon electricity mixes, then there are Denmark and Finland (DK and FI) that have moderate carbon intensive electricity mixes, and at the bottom are Estonia and Germany (EE and DE) that have carbon intensive electricity mixes.
The result for the low fossil mixes seems almost identical, as most of the selected renovation scenarios decrease the GHG of the building. Special attention should be given to scenarios 2 and 6 (that are dependent on electricity as an energy carrier) which give EPs that have a high environmental return of investment. Then there is scenario 8 that has the highest coefficient due to both the decrease of energy use and the use of GHP. Finally, scenario 1 does not have an environmental payback due to the low solar irradiation at northern latitudes.
In the moderate carbon mixes, (FI and DK) there is a more interesting development. Scenarios 2 and 6, that mainly depend on the change of the energy carrier, have a negative performance on GWP (they increase GHG emissions), scenario 1 has an unchanged performance and scenario 7 has a negative coefficient, but not enough to have an EROI bigger than 1. However, particular attention should be given to scenario 8, that, even if it increases the electricity use, decreases GHG emissions enough to give a good environmental performance, due to the reduced active heating demand and the use of geothermal energy.
Then in high carbon mixes (EE and DE) it can be seen that results are similar, with a slight difference in the coefficients, showing that all selected scenarios increase GHG emissions. As seen previously, scenarios 2 and 6 are of special interest. Due to the increased use of fossil intensive electricity production, these scenarios are the ones with the fastest increase in GHG emissions. Scenarios 7 and 8 have lower coefficients, but there is an increase in electricity consumption, due to the installations, that leads to increased GHG emissions. Then scenario 1 has a similar performance as with low carbon mixes.
Figure 4 shows the selected scenarios’ RW payback. It can be seen in the figure that there are two different groups that have similar RW impacts, but different energy sources. At the top of the figure are Sweden and Finland (SE and FI) that have high shares of nuclear power, then there are Denmark, Norway, Estonia and Germany (EE and DE) that have low to no nuclear power.
The results for the low nuclear power mixes seem almost identical, as most of the selected renovation scenarios decrease the RW of the building. Special attention should be paid to scenario 8 that decreases RW the most due to the decrease of the active heating demand. Scenario 8 also has the highest (negative) coefficient due to both the decrease of energy use and the use of GHP. Scenario 1 shows a positive environmental payback regarding RW, with an environmental payback of between 20 and 30 years.
In the high nuclear power mixes, (SE and FI) there is different development. Scenarios 2 and 6, that mainly depend on the change in the energy carrier, have a negative performance on RW (they increase nuclear power use). Scenario 1 has an unchanged performance. In scenarios 7 and 8, RW decreases enough to give a good environmental performance even when electricity use increases, due to the reduced active heating demand in both cases and the use of geothermal energy in case of scenario 8.
4. Discussion
Regarding environmental impacts of renovation strategies, it is interesting to note how these impacts are related to the electricity mix. Scenarios 2 and 6 are of special importance in this study because they show possible solutions for reducing GHG emissions in low carbon mixes. The use of a GHP decreases GWP impact radically in Sweden by shifting the burden to RW. This poses a problem in Sweden, a country that aims to have a 100% renewable energy system. It can be seen in these scenarios that a small shift in the production of electricity gives a large increase in GWP, making them really sensitive to the way electricity is produced. This means that, in a case like the German Energiwende, where nuclear power was scaled down favoring coal fueled power, the GHG emission savings can swiftly be an increase in emissions.
Particular attention can also be paid to scenario 1, which relies on PV as a renovation alternative. The PV modules installed in the scenario have a low output of electricity produced, mainly because that, even if Sweden has made great efforts to subsidize PV [26], many housing companies complain that electricity production taxes for large installations make this kind of investment unattractive, even if there is a great interest [27]. Also, given the particular situation of Nordic countries like Sweden, PVs have very low electricity generation when the active heating demand of the house is needed, during the darkest months of the year. On the contrary, during spring and summer most of the PV electricity produced is exported to the grid, outside the system boundaries of the study, which follows the EN standard. Also, the relative short lifetime of PV panels in comparison with both their environmental payback and the lifetime of the building makes the installation of such a system counterproductive. As Petrovic et al [28] noted the production stages of the PV panels contribute more to GWP than the potential environmental benefits from them.
Scenarios 7 and 8 can be seen from an interesting perspective. For four of the six electricity mixes (Sweden, Finland, Norway and Denmark) they result in decreases of both GWP and RW. Even in carbon-rich mixes (Estonia and Germany) they represent the options that have the more gentle slopes when it comes to GWP and have a decrease in RW mainly because they decrease the active heating demand, reducing the electricity demand for the different installations. Even if these scenarios represent high environmental impacts during the production phase, the reduction of active heating demand compensates for the increased impact of the materials and the construction phases.
As has been discussed, there is a coupling between energy efficiency and the chosen energy carrier. In a district heating system, such as the one in Borlänge, it is possible to reduce GHG emissions by changing the energy carriers only when the electricity mix is almost carbon free (as in Sweden and Norway). However, such changes make the system completely dependent on the electricity mix, and can lead to an increase in the required effect during the coldest days of the year, which can result in an increase of marginal electricity production that at the same time results in the use of fossil fuels. This daily and hourly need for effect has not been considered in this study. If this effect is combined with the proposed phase out of nuclear power in Sweden, it can give a high increase in GHG emissions in a relative short time-span.
It is also important to consider the time perspective. This study is based on an EN standard that is based on an attributional LCA, meaning that the energy system is in a steady state. This approach is problematic in itself considering that optimization of the energy system takes place all the time. An example is the migration from fossil-based to biofuels that district heating in Sweden has carried out since the 1970s. Attributional LCA does not allow one to foresee how the electricity production can shift during the lifetime of the building. In this study possible future scenarios have been analyzed by using different electricity mixes from neighboring countries.
5. Conclusions
In this study, different renovation strategies were investigated for a building in Borlänge Sweden. Different Northern European electricity mixes were used to carry out the analysis. This study focuses on LCA for two different environmental categories: GWP and RW.
It focuses on how different energy carriers can affect the environmental impacts of the building and how changes in the way electricity is produced can improve or worsen these impacts.
As shown in the results, a change in energy carriers in Sweden can be seen as a good alternative in order to reduce GWP. However, this is at the cost of increased RW. In a system with 100% renewables it seems to be the best option, but if it is necessary to use other energy sources changing the energy carrier can be counterproductive. In all electricity mixes (other than Norway) there is a tradeoff between environmental impacts, when changing energy carriers.
Reducing the active heating demand of a building is the best alternative in order to reduce GWP and RW, taking into consideration that a building that reduces the energy demand is less vulnerable to changes in the energy system, and that the environmental gains are comparable to other scenarios, even if the initial environmental impacts for the production stages are high.
The study also shows that PV installations cannot compensate for the environmental impacts of their own production in Northern latitudes, due to a very limited output.
It is also important to note that the 50 years perspective of the analysis does not take into account changes in the energy systems that can lead to both decrease or increase in the environmental impacts.
Supplementary Materials
Supplementary Materials can be found at https://www.mdpi.com/1996-1073/13/1/80/s1.
Author Contributions
Conceptualization, R.R.-V., O.E. and T.O.; Formal analysis, R.R.-V., O.E. and T.O.; Investigation, R.R.-V.; Methodology, R.R.-V. and O.E.; Software, R.R.-V.; Supervision, O.E. and T.O.; Validation, R.R.-V.; Visualization, R.R.-V.; Writing – original draft, R.R.-V., O.E. and T.O.; Writing – review & editing, R.R.-V., O.E. and T.O. All authors have read and agreed to the published version of the manuscript.
Funding
This work was carried out under the auspices of the industrial post-graduate school Reesbe, which is financed by the Knowledge Foundation (KK-stiftelsen) and Byggpartner i Dalarna AB.
Acknowledgments
The authors would specially like to thank Kristian Haglund from ByggPartner i Dalarna AB, for contributing with his professional advice.
Conflicts of Interest
The authors declare no conflict of interest.
Nomenclature
| IPCC | Intergovernmental Panel on Climate Change |
| GHG | Greenhouse gas |
| EU | European Union |
| LCA | Life cycle assessment |
| HP | Heat pump |
| DH | District heating |
| HRV | Heat recovery ventilation |
| GHP | Geothermal heat pump |
| PV | Photovoltaics |
| IDA-ICE | Implicit differential algebraic equations system solver-Indoor climate and energy |
| RW | Radioactive waste |
| CEN | European Committee for Standardization |
| TR | Technical report |
| GWP | Global warming potential |
| EPD | Environmental product declaration |
| COP | Coefficient of performance |
| CML | Center of environmental science of Leiden University |
| eROI | Environmental return of investment |
| PVGIS | Photovoltaic geographical information system |
| SL | Service life |
| SE | Sweden |
| NO | Norway |
| FI | Finland |
| DK | Denmark |
| DE | Germany |
| EE | Estonia |
References
- IPCC Global Warming of 1.5 °C An IPCC Special Report on the Impacts of Global Warming of 1.5 °C Above Pre-Industrial Levels and Related Global Greenhouse Gas Emission Pathways, in the Context of Strengthening the Global Response to the Threat of Climate Change; IPCC: Geneva, Switzerland, 2018.
- GHG Emissions by Aggregated Sector—European Environment Agency. Available online: https://www.eea.europa.eu/data-and-maps/daviz/ghg-emissions-by-aggregated-sector-2#tab-dashboard-01 (accessed on 22 October 2019).
- European Commission Communication from the Commission to the European Parliament and The Council. Energy Efficiency and Its Contribution to Energy Security and the 2030 Framework for Climate and Energy Policy; European Commission Communication: Brussels, Belgium, 2014. [Google Scholar]
- European Commission Buildings-European Commission. Available online: https://ec.europa.eu/energy/en/topics/energy-efficiency/buildings (accessed on 13 May 2015).
- Vilches, A.; Garcia-Martinez, A.; Sanchez-Montã, B. Life cycle assessment (LCA) of building refurbishment: A literature review. Energy Build. 2017, 135, 286–301. [Google Scholar] [CrossRef]
- Rabani, M.; Madessa, H.B.; Nord, N. A state-of-art review of retrofit interventions in buildings towards nearly zero energy level. Energy Procedia 2017, 134, 317–326. [Google Scholar] [CrossRef]
- Moschetti, R.; Brattebø, H.; Skeie, K.S.; Lien, A.G. Performing quantitative analyses towards sustainable business models in building energy renovation projects: Analytic process and case study. J. Clean. Prod. 2018, 199, 1092–1106. [Google Scholar] [CrossRef]
- Malmgren, L.; Mjörnell, K.; Malmgren, L.; Mjörnell, K. Application of a Decision Support Tool in Three Renovation Projects. Sustainability 2015, 7, 12521–12538. [Google Scholar] [CrossRef]
- Swedish Energy Agency. Energy in Sweden 2015—An Overall Picture of the Energy Situation in Sweden; Swedish Energy Agency: Stockholm, Sweden, 2015. [Google Scholar]
- Gustafsson, M.; Thygesen, R.; Karlsson, B.; Ödlund, L. Rev-changes in primary energy use and CO2 emissions-An impact assessment for a building with focus on the swedish proposal for nearly zero energy buildings. Energies 2017, 10, 978. [Google Scholar] [CrossRef]
- Gustafsson, M.S.; Myhren, J.A.; Dotzauer, E. Potential for district heating to lower peak electricity demand in a medium-size municipality in Sweden. J. Clean. Prod. 2018, 186, 1–9. [Google Scholar] [CrossRef]
- Verbong, G.; Geels, F. The ongoing energy transition: Lessons from a socio-technical, multi-level analysis of the Dutch electricity system (1960–2004). Energy Policy 2007, 35, 1025–1037. [Google Scholar] [CrossRef]
- Treyer, K.; Turconi, R.; Boyano, A. Life Cycle Management of Energy and Energy Transitions—Managing the Complexity of Todays and Future Energy Systems with a Life Cycle Focus: Challenges and Methodological Solutions. In Designing Sustainable Technologies, Products and Policies; Springer International Publishing: Cham, Switzerland, 2018; pp. 243–247. [Google Scholar]
- Verbruggen, A. Renewable and nuclear power: A common future? Energy Policy 2008, 36, 4036–4047. [Google Scholar] [CrossRef]
- Frischknecht, R.; Braunschweig, A.; Hofstetter, P.; Suter, P. Human health damages due to ionising radiation in life cycle impact assessment. Environ. Impact Assess. Rev. 2000, 20, 159–189. [Google Scholar] [CrossRef]
- Eriksson, O. Nuclear Power and Resource Efficiency—A Proposal for a Revised Primary Energy Factor. Sustainability 2017, 9, 1063. [Google Scholar] [CrossRef]
- Glaumann, M.; Assefa, G.; Kindembe, B.; Eriksson, O.N. Miljövärdering av Bebyggelse: Extern Miljöpåverkan, Beskrivning av Olika Miljöpåverkanskategorier; FOU-Rapport; Högskolan i Gävle: Gävle, Sweden, 2009. [Google Scholar]
- Algunaibet, I.M.; Guillén-Gosálbez, G. Life cycle burden-shifting in energy systems designed to minimize greenhouse gas emissions: Novel analytical method and application to the United States. J. Clean. Prod. 2019, 229, 886–901. [Google Scholar] [CrossRef]
- Ramírez-Villegas, R.; Eriksson, O.; Olofsson, T. Life Cycle Assessment of Building Renovation Measures–Trade-off between Building Materials and Energy. Energies 2019, 12, 344. [Google Scholar] [CrossRef]
- EQUA. Use Manual IDA Indoor Climate and Energy; EQUA: Stockholm, Sweden, 2013. [Google Scholar]
- European Commission, J.R.C. JRC Photovoltaic Geographical Information System (PVGIS)-European Commission. Available online: http://re.jrc.ec.europa.eu/ (accessed on 5 Febuary 2019).
- Boverket Regelsamling för Energideklaration Med Kommentarer; Boverket: Karlskrona, Sweden, 2010; ISBN 9789186342586.
- European Commitee for Standarization (CEN) EN 15978. Sustainability of Construction Work-Assessment of Environmental Performance of Buildings-Calculation Methods; CEN: Brussels, Belgium, 2011. [Google Scholar]
- Asdrubali, F.; Ballarini, I.; Corrado, V.; Evangelisti, L.; Grazieschi, G.; Guattari, C. Energy and environmental payback times for an NZEB retrofit. Build. Environ. 2019, 147, 461–472. [Google Scholar] [CrossRef]
- Nydahl, H.; Andersson, S.; Åstrand, A.P.; Olofsson, T. Building Refurbishment from a Life Cycle Perspective—An Environmental Return on Investment Approach: Sustainable Buildings in Cold Climates; Springer: Cham, Switzerland, 2018; pp. 253–263. ISBN 978-3-030-00661-7. [Google Scholar]
- National Audit Office. Support to Solar Power; RiR 2017:29; National Audit Office: London, UK, 2017. [Google Scholar]
- Solelkommissionen Energiskatt. Available online: http://www.solelkommissionen.se/energiskatt/ (accessed on 2 April 2019).
- Petrovic, B.; Myhren, J.A.; Zhang, X.; Wallhagen, M.; Eriksson, O. Life cycle assessment of a wooden single-family house in Sweden. Appl. Energy 2019, 251, 113253. [Google Scholar] [CrossRef]


© 2019 by the authors. Licensee MDPI, Basel, Switzerland. This article is an open access article distributed under the terms and conditions of the Creative Commons Attribution (CC BY) license (http://creativecommons.org/licenses/by/4.0/).