Article

Effects of Salinity on Formation Behavior of Methane Hydrate in Montmorillonite

1
Key Laboratory of Gas Hydrate, Guangzhou Institute of Energy Conversion, Chinese Academy of Sciences, Guangzhou 510640, China
2
Guangdong Provincial Key Laboratory of New and Renewable Energy Research and Development, Guangzhou 510640, China
3
Guangzhou Center for Gas Hydrate Research, Chinese Academy of Sciences, Guangzhou 510640, China
4
University of Chinese Academy of Sciences, Beijing 100049, China
*
Author to whom correspondence should be addressed.
Energies 2020, 13(1), 231; https://doi.org/10.3390/en13010231
Submission received: 6 December 2019 / Revised: 25 December 2019 / Accepted: 31 December 2019 / Published: 2 January 2020

Abstract

:
In marine sediments, seawater influences the phase behavior of natural gas hydrate. As a porous medium, the water distribution and physical properties of montmorillonite are influenced by the salt ions in seawater. In this work, the bound-water content in, and crystal structure of, montmorillonite is measured to investigate the effect of salt ions on the water distribution in montmorillonite. It can be determined from the results that the bound-water content in montmorillonite decreases as the salt-ion concentration increases. Salt ions affect the intercalation of water molecules in montmorillonite, and they then inhibit the expansion effect of montmorillonite. Next, the phase behaviors of methane hydrate in montmorillonite with NaCl solution are investigated using high-pressure micro-differential scanning calorimetry. The phase behavior of hydrate in montmorillonite with NaCl solution is discussed. In montmorillonite with NaCl solution, the phase equilibrium temperatures and the conversion rate of methane hydrate both decrease with increasing NaCl concentration. The results show that methane hydrate in montmorillonite is influenced not only by the phase-equilibrium effect of salt ions, but also by the formation effect of the salt ions on the bound-water content in montmorillonite.

Graphical Abstract

1. Introduction

The hydrate formation behavior in porous sediments plays a pivotal part in reservoir research and gas hydrate drilling. The phase equilibrium conditions of hydrate are influenced by capillary forces and fluid properties in porous sediments [1,2,3,4]. In recent years, the phase behavior of hydrate in quartz sand and other porous media have been studied through experiments and simulations [5,6,7,8,9]. Gas hydrate formation and decomposition is a kinetics process of multi-phase and multi-element interaction. The formation of hydrate consists of two processes: nucleation and growth. The research into the kinetics of bulk hydrate systems is carried out with respect to pressure, temperature, rate constant, specific surface area, characteristics of host sediment, etc. [10]. Owing to the complex properties and diverse conditions of natural sediments, it is difficult to directly study the conditions for hydrate formation in it. Montmorillonite is an important component of natural gas hydrate reservoirs. Analysis of Nanhai sea-mud samples shows that the content of montmorillonite in most areas is greater than 20%, and the content of montmorillonite in the western continental slope and outer continental shelf of Dongsha is greater than 40% [11,12]. At the same time, montmorillonite is considered to be the main carrier of methane hydrate formation, and its absorbability, hydrability, and expansibility exhibit the corresponding characteristics of submarine submersibles. Therefore, studying the conditions for the formation of hydrate in montmorillonite is of great significance to further exploring the formation rules and influencing factors of hydrates in natural sediments.
Montmorillonite is a 2:1 type hydrated aluminosilicate, and each layer consists of a central octahedral alumina layer and two outer tetrahedral silicate layers, which is a monoclinic crystal system, as shown in Figure 1. Therefore, the clay is described as a tetrahedral octahedral tetrahedral (TOT) layer mineral. The mineral formula of it is (Al,Mg)2[Si2O10](OH)2·nH2O. Due to the rich characteristics, montmorillonite has been widely used in many industries such as construction, petrochemical, medicine, agriculture, food and metallurgy. The central cations Si4+ and Al3+ in the tetrahedron and octahedron of montmorillonite undergo plasmoid replacement, resulting in the negative charge of the montmorillonite lamellar structure and the adsorption of exchangeable cations (H+, K+, Na+, Ca2+, Mg2+) and water molecules between the layers to achieve charge balance [13]. The bound-water content in some montmorillonite can be up to 60% of the mass of dry montmorillonite. The hydration expansion of montmorillonite is mainly affected by the surface hydration force, osmotic hydration force and capillary force. In addition, the water adsorbed by montmorillonite can be divided into bound water and free water according to their different structures and properties. Bound water in montmorillonite is dominated by hydrogen bonding forces and electrostatic attraction. Free water in montmorillonite is mainly affected by the van der Waals force. In addition to particle surface hydrates, intercalated hydrocarbon hydrates can also be formed in montmorillonite, and the layer spacing of montmorillonite increases [14]. In the interlayer of montmorillonite, a part of Na+ are adjacent to the tetrahedral negative charge sites and binding directly to the clay surface to form semi-clathrate hydrate; the remaining Na+ are adjacent to the octahedral negative charge sites and form complete cages with six water molecules [15]. The Na+ ions occupy the site of the network. So the cage is distorted, unlike the cage of ideal hydrate clathrates [16]. The methane molecules transfer from the bulk solution region into the montmorillonite region [17], and accommodate through a combination of hydration to about 13 water molecules and 6 siloxane oxygen atoms. The total coordination number is around 19 oxygen atoms surrounding each methane particle [18]. The interlayer diffusion of methane depends strongly on the water content and burial depth [15]. Montmorillonite behaves like good thermodynamic promoters [19], but other than that, the formation of hydrate is affected by the swelling capacity and the tetrahedral charge [20]. The swelling capacities of montmorillonite depend on physical-chemical conditions such as salinity, interlayer cation composition, temperature, and pressure. At the same time, its unique surface properties and layered structure have a certain influence on the phase equilibrium conditions of hydrate formation [21,22]. Uchida et al. [23] found that the decomposition of hydrate in montmorillonite can be divided into the high-temperature stage in free water and the low-temperature stage in bound water. At the same time, the decomposition temperature of bound water hydrate also depends on the initial water content and is controlled by the thickness of hydrate layer between mineral layers [23,24]. Nguyen et al. [25] found that low-concentration montmorillonite solution had a thermodynamic promoting effect on the formation of hydrate. Park and Sposito [26] studied the methane hydrate on the surface of montmorillonite through molecular simulation, and obtained the thermodynamic promoting effect of montmorillonite. Kotkoskie et al. [27] found that during the formation of hydrate, the promoting effect of montmorillonite competes with the inhibiting effect of electrolyte dissolved in mineral solution. With the increase of montmorillonite content, the promoting effect gradually turns into inhibiting effect. Therefore, the measure of the bound-water content in montmorillonite is important for research on hydrate formation.
In marine sediments, there are some salt ions in the pore water of the sediments [29,30]. Owing to the reduction of the chemical potential of the water by the ions in the brine solution [31], the salinity of water affects the thermodynamic stability of natural gas hydrate [32,33]. At very low concentration, it is likely to be a hydrate promoter to some extent [32,33]. In addition, the solubility of natural gas in the solution decreases, while the salinity of water increases, and the promoting effect gradually changes to an inhibiting effect and increases at the same time [31]. The chemical composition and salinity in marine sediments not only affect the stability of marine gas hydrate, but also inhibit the hydration of montmorillonite, so that the content of bound water changes significantly with the change of salinity [34]. Bound water also exists in sand to some extent, but due to the absence of a layered structure in sand, it is mainly adsorbed on the surface of the particles, and its content varies less with the change of salinity. Therefore, in addition to the direct influence of salinity, taking consideration of the influence of bound water content on hydrate phase equilibrium conditions is of great significance in studying the stability of hydrate in natural saline sediments. The natural co-existence of gas hydrate, free gas and hypersaline pore water can occur in shallow sediment on Hydrate Ridge, and in other regions of high upward methane flux. Milkov et al. [35] found that gas hydrate formation can increase salinity of surrounding pore water to the level when gas hydrates can no longer form, and they co-exist with free gas. Salinity greatly affects the physical properties of bulk sediment and the formation of hydrate. Therefore, this experiment is conducive to further studying the influence of salinity on the physical properties of montmorillonite and exploring the influence rule of salinity on the hydrate formation in montmorilonite, so as to provide better guidance for further exploration and estimation of hydrate reserves. In this work, the bound-water content of montmorillonite in brine solution with different concentrations is measured. The effects of salt ions on the dehydration of montmorillonite and on the crystal structure are analyzed. The relationship between salt-ion content, bound-water content, and hydrate phase behavior is discussed. High-pressure differential scanning calorimetry (HP-DSC) is used to study the salt-ion effect on the phase equilibrium conditions of hydrate in the montmorillonite system.

2. Materials and Methods

2.1. Materials

99.999% pure methane and nitrogen were supplied by Foshan MS Messer Gas Co., Ltd. (Foshan, China) and 99.8% pure NaCl was supplied by Shanghai Aladdin Bio-Chem Technology Co., Ltd. (Shanghai, China). Deionized water with a resistivity of 18.25 mΩ/cm was prepared by an ultra-pure water equipment that was produced by the Nanjing Ultrapure Water Technology, Co., Ltd. (Nanjing, China). 98% pure Na-montmorillonite was produced by American NANOCOR Company (Chicago, IL, USA). The elements of montmorillonite are as follows: 48.53 wt% O; 4.76 wt% Na; 2.36 wt% Mg; 12.32 wt% Al; 28.95 wt% Si; 0.01 wt% P; 0.13% S; 0.18 wt% K; 0.21 wt% Ca; 0.11 wt% Ti; 0.02 wt% Mn; 2.25 wt% Fe. Its cation exchange capacity is 145 meq/100 g, its aspect ratio is 200–400, and its average particle size is 16–22 μm.

2.2. Procedure

To study the influence of the water salinity on the bound-water and free-water content of montmorillonite, montmorillonite samples containing NaCl solution of different salinities were prepared. First, the montmorillonite was dried in an oven at 100 °C. After drying, it was put into the NaCl solution of corresponding mass and concentration, and sealed at room temperature (25 °C) for 48 h to allow it to fully hydrate to obtain the water-dispersed samples. The hydrated samples were placed in an oven at 75 °C for drying. The free water in the samples was removed, and then the hydrated samples crushed to obtain the dried samples.
The thermogravimetric (TG) method is a kind of thermal analysis method used to measure the component changes of samples by weighing the weight lost during heating. A thermal analysis–gas chromatography system (STA 409 PC, NETZSCH, Selb, Germany) was used to determine the water content in the montmorillonite samples. The temperature increased from 25 °C to 300 °C at a rate of 5 °C/min, and the atmosphere was N2. The samples used in TG are dried samples.
X-ray diffraction (XRD) is a research method used to obtain information such as the composition of materials and the structure or morphology of atoms or molecules inside materials through X-ray diffraction analysis of the materials. An X-ray diffractometer (X’Pert3 Powder, PANanalytical, Almelo, The Netherlands) was used to determine the diffraction pattern of the montmorillonite samples, and the interlayer spacing of montmorillonite crystals calculated using Bragg’s law according to d(001). A Cu Kα ray was used, and the incident wavelength was λ = 0.15406 nm, the working voltage and current were 40 kV and 40 mA, respectively, and the scanning range was 2θ = 5°–90°. Experimental data were collected automatically by computer, and analytical scanning electron microscopy (SEM; SU-70, Hitachi, Tokyo, Japan) was used to take SEM images of XRD samples at room temperature.
Differential scanning calorimetry (DSC) is a thermal analysis method used to measure the power difference and temperature of a sample and its reference. HP-DSC (BT2.15, Setaram, Inc., Lyon, France) was used to measure the phase equilibrium conditions of methane hydrate in the montmorillonite samples. The hydrate is directly generated in the DSC sample cell. The volume of the sample cell is 12.5 mL, the pressure range is 0–60 Mpa, and the temperature range is −170–200 °C. A certain number of samples were weighed for the DSC experiments, and the experimental procedure proceeded as follows: The temperature decreased from 20 °C to −10 °C at a rate of 0.02 °C/min; the temperature was then held constant for 6 h; finally, the temperature increased from −10 °C to 20 °C at a rate of 0.05 °C/min.

3. Results and Discussion

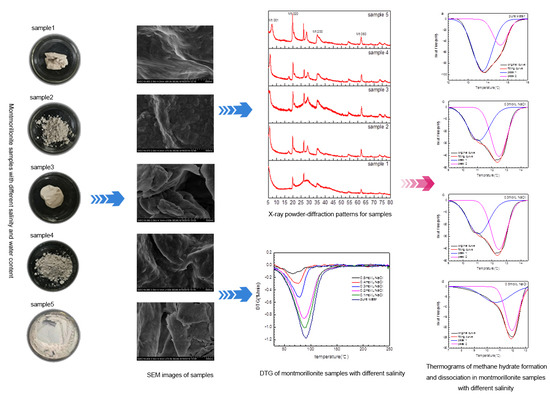
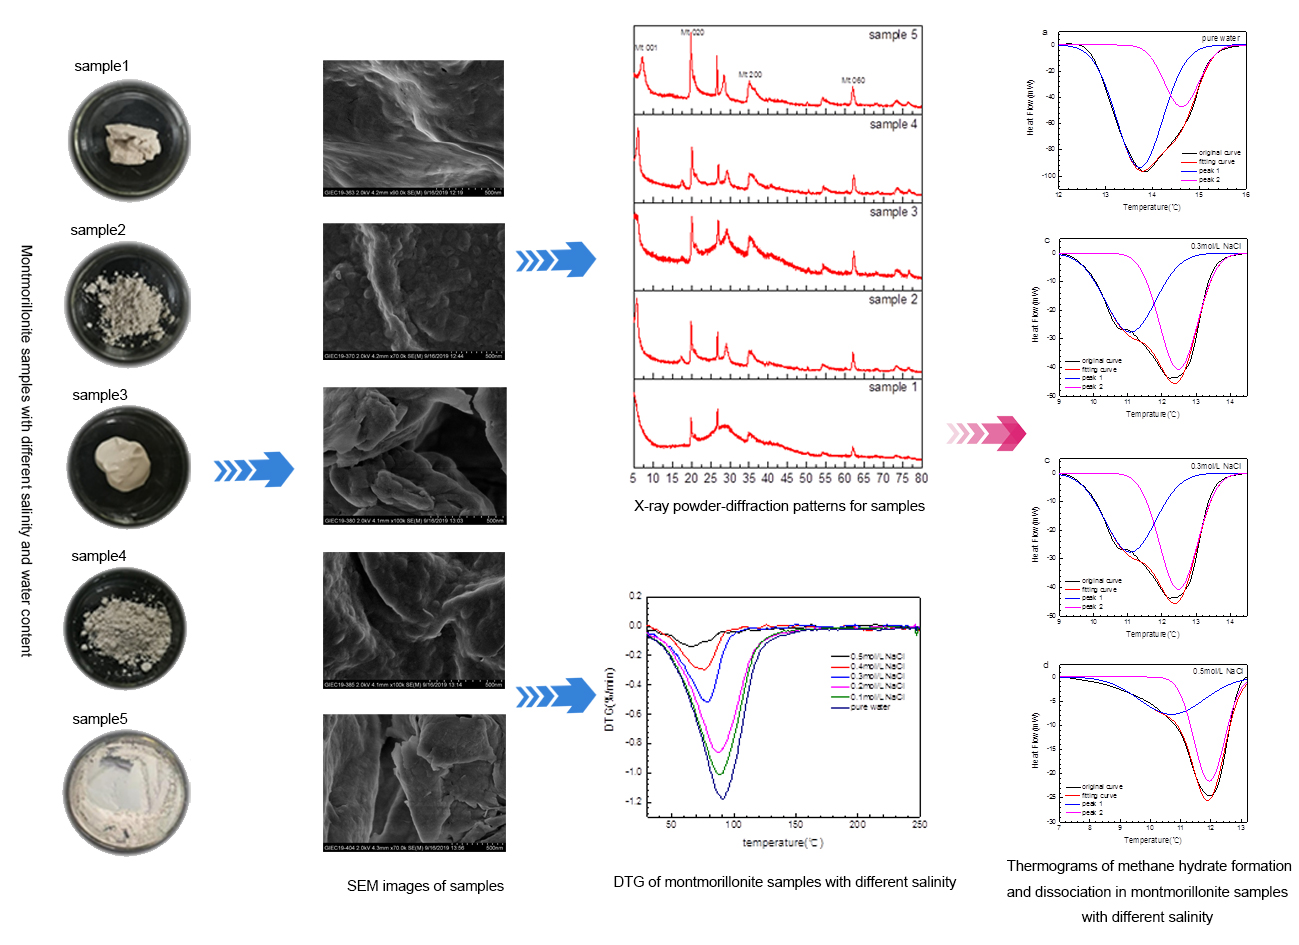
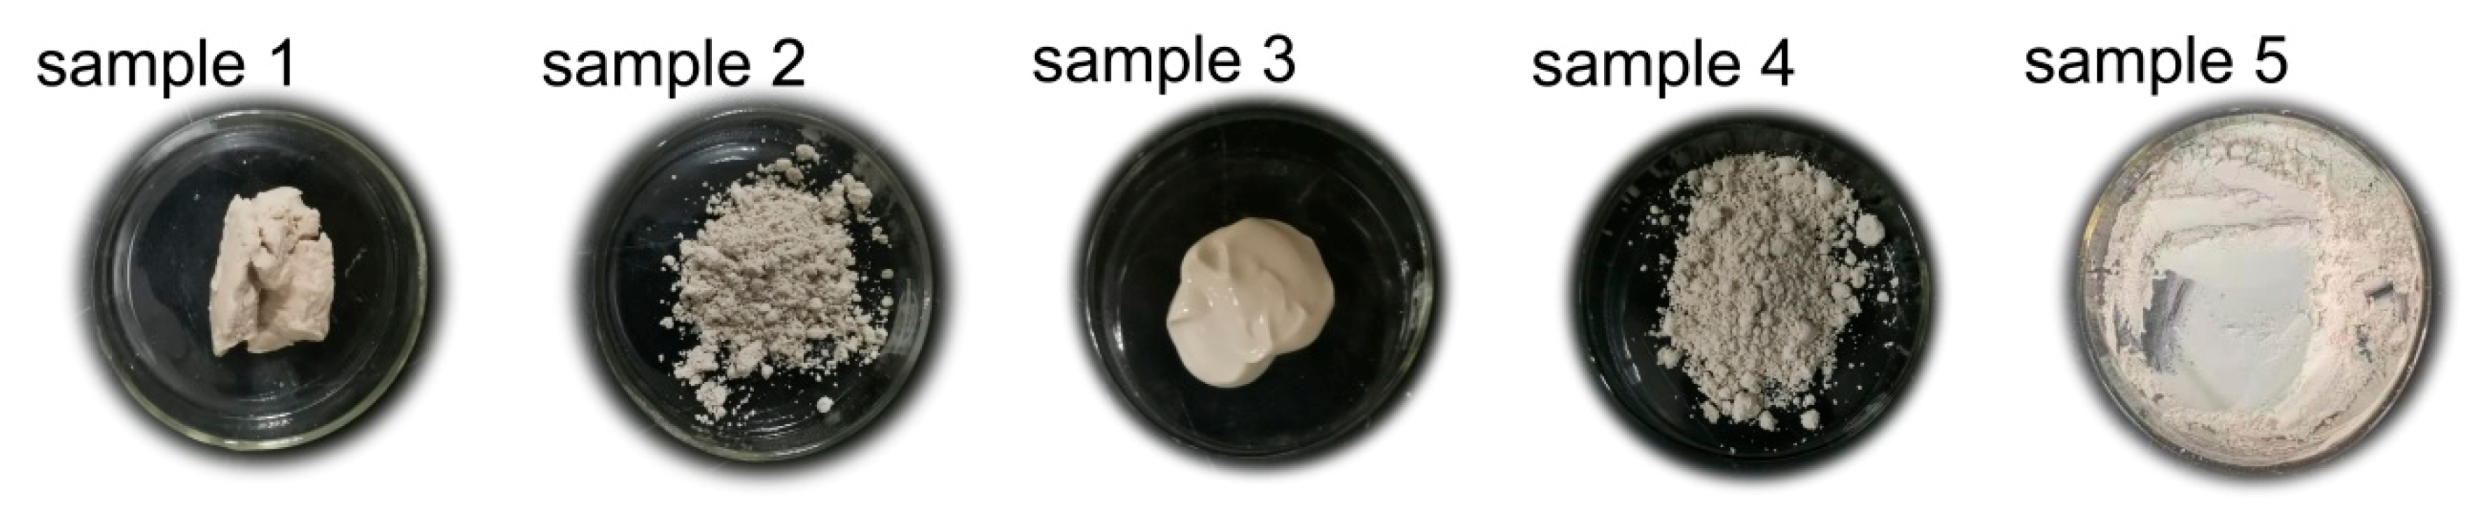
3.1. Water Content in Montmorillonite Samples

The sample preparation method of water content experiment is shown in Section 2.2, and the concentrations of solution are shown in Table 1. 75 °C is the boundary point of the free water and bound water [36]. Thus, the montmorillonite samples that were fully hydrated for 48 h were dried in an oven at 75 °C to remove the free water. Then, the weight-loss rate of montmorillonite samples was determined with the TG system. The TG temperature increased from 25 °C to 300 °C. Figure 2 shows the TG curves of the dried montmorillonite samples. As shown in the figure, the mass of samples began to decrease at approximately 30 °C, and then decreased with increasing temperature, finally reaching equilibrium at approximately 150 °C. As can be seen from Figure 2, with increasing solution salinity, the final residual mass of the montmorillonite samples increases. The weight-loss ratio of each sample is listed in Table 1. It can be found from the table that the bound-water content of the montmorillonite samples decreases continuously with increasing brine solution concentration. When the external solution of montmorillonite contains Na+, the ion concentration difference inside and outside the layer decreases, resulting in the osmotic potential difference decreases. Therefore, the bound water content decreases with the increase of the salinity of solution. Figure 3 shows the DTG curve obtained by the first-order differential of the TG experimental results. The DTG curve represents the change of the weight-loss rate of samples with increasing temperature in the experiment. As can be seen from Figure 3, the dehydration peak of the bound water in montmorillonite shifted to the direction of lower temperature with increasing brine solution concentration. The inflection-point temperatures of the DTG curves of each sample can be found in Table 1, which reflects the maximum reaction rate of dehydration. The inflection point decreases with increasing brine solution concentration, which indicates that the bound water in the montmorillonite sample is easier to remove at a lower temperature at this condition. The results show that the bound-water content of montmorillonite is influenced by the solution salinity. In montmorillonite, the sample surface and bound water are subjected to hydrogen bonding and electrostatic attraction [37]. The presence of salt ions in the samples has a great influence on the hydrogen-bond balance between the surface of the montmorillonite and the bound water, and affects the dehydration process of montmorillonite to some extent. Therefore, the presence of saline ions affects the ability of montmorillonite to bind with water. With increasing solution salinity, the effect on the bound-water content becomes greater.

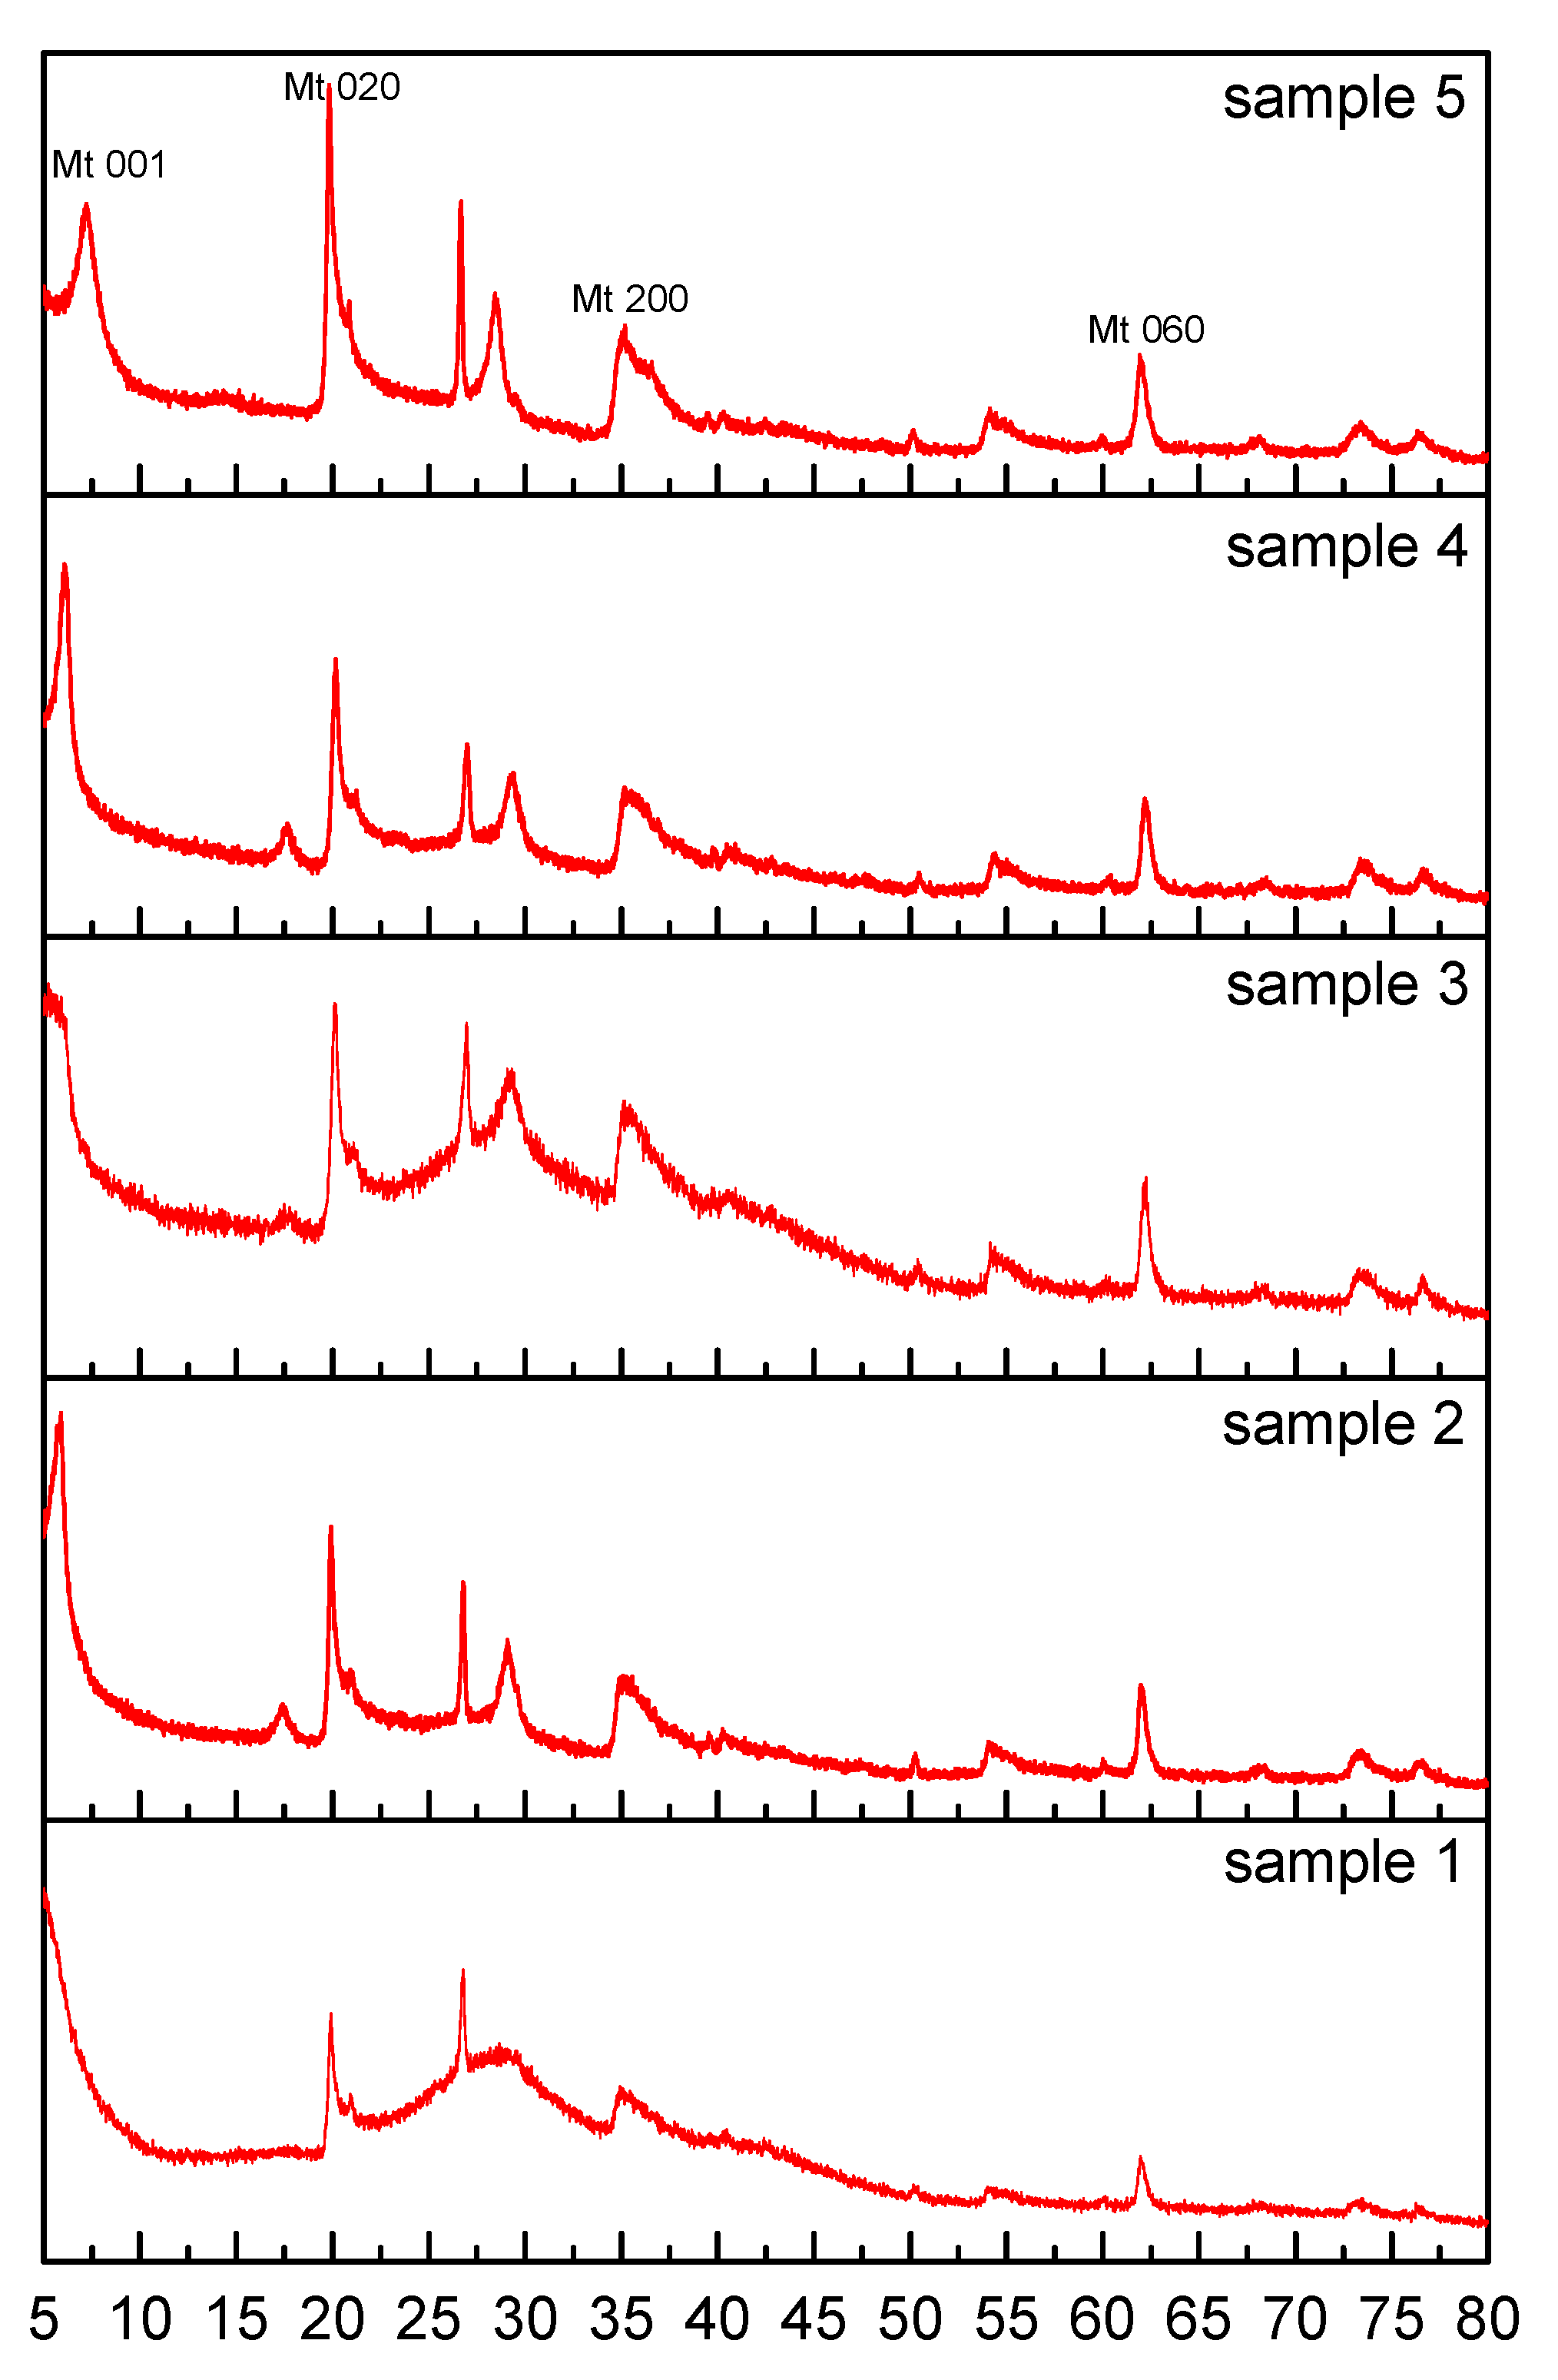
3.2. Crystal Characterization of Montmorillonite Samples

The decomposition temperature of interlayer hydrate depends on the initial water content and is influenced by the thickness of the interlayer water [23]. Therefore, the study of the number of water-molecule layers in the interlayers of montmorillonite is of guiding significance for further study on the phase behavior of the interlayer hydrate. To study the effect of salt ions on the water content in montmorillonite, crystal-structure measurements were carried out by XRD. Five montmorillonite samples were used in the experiments, as shown in Figure 4. The contents of the pure water and NaCl solution in samples are shown in Table 2. The ‘water content’ in the table represents the mass ratio of the added solution to the dried montmorillonite. From Figure 4, it can be seen that sample 1 presents a clay block. In sample 2, the montmorillonite powder combines with the small montmorillonite particles for hydration agglomeration, but it is still relatively dry. Sample 3 is viscous clay that can be compared with sample 1 to show that the water absorption of montmorillonite is significantly weakened when salt ions are present. The state of montmorillonite in sample 4 is the same as that in sample 2. The aggregate particles of montmorillonite in sample 4 are slightly larger than those in sample 2. Sample 5 is montmorillonite dried at 100 °C. The montmorillonite powder is light gray and extremely fine. Figure 5 shows SEM images of the samples, in which a rough surface with sharp edges can be seen, which is caused by the irregular surface of the samples. The excess water that cannot enter the interlayer makes the samples a sticky and viscous clay. When the water content is low, there are many small protrusions on the sample surface. With increasing water content, the sample surface tends to be flat and the number of small protrusions decreases. When the moisture content is the same, the aggregate particles are smaller, but there are fewer small protrusions on the surface of the samples with salt. At the same time, the dry montmorillonite samples showed the sharper edge of a flake structure.
The X-ray powder-diffraction pattern of the montmorillonite samples is listed in Figure 6. Montmorillonite is a kind of monoclinic system with crystal cell parameters of a0 = 0.523 nm, b0 = 0.906 nm, c0 = 0.96–2.05 nm, α = γ = 90°, β ≈ 100°, and Z = 2 [38]. By comparing the results of the samples, it was found that the diffraction-peak positions of the montmorillonite samples are the same, except for the diffraction-peak position of (0 0 1). JADE software was used to calculate the experimental results. The lattice constants a, b, and c of the samples were obtained, as shown in Table 3. There are no significant changes in a and b with different samples, indicating that the basic pattern of shapes, sizes, and mutual positions of the tetrahedral and octahedral structures in the montmorillonite samples do not change. However, the lattice constant c exhibits significant change in the samples, which is due to the water absorption and expansion of montmorillonite. Water intercalated into the montmorillonite with swelling of the basal spacing d(001) [39].
In the XRD result, d(001) refers to the layer spacing of layered minerals [40,41]. The number of water-molecule layers in interlayers of montmorillonite can be estimated by d(001). As can be seen from Figure 6, the diffraction peaks of d(001) are wide in samples 1 and 3 due to the abundant water content. The value of d(001) cannot be obtained in these two samples. The peaks of d(001) of samples 2 and 4 are clear and sharp. Table 4 shows the values of d(001) in the samples. The basal spacing is calculated according to Bragg’s law (λ = 2dsinθ). The thickness of a single water layer is approximately 2.8 Å. Therefore, the basal spacing of 1-water-layer montmorillonite is approximately 12.10–13.00 Å, and the basal spacing of 2-water-layers montmorillonite is approximately 14.50–16.50 [42]. From Table 4, it can be seen that the two water layers intercalate into the montmorillonite in samples 2 and 4. This indicates that water is absorbed in montmorillonite and expands its basal spacing. Compared with samples 2 and 4, the basal spacing of sample 4 is less than that of sample 3. This means that the salt ions influenced the water content of montmorillonite.

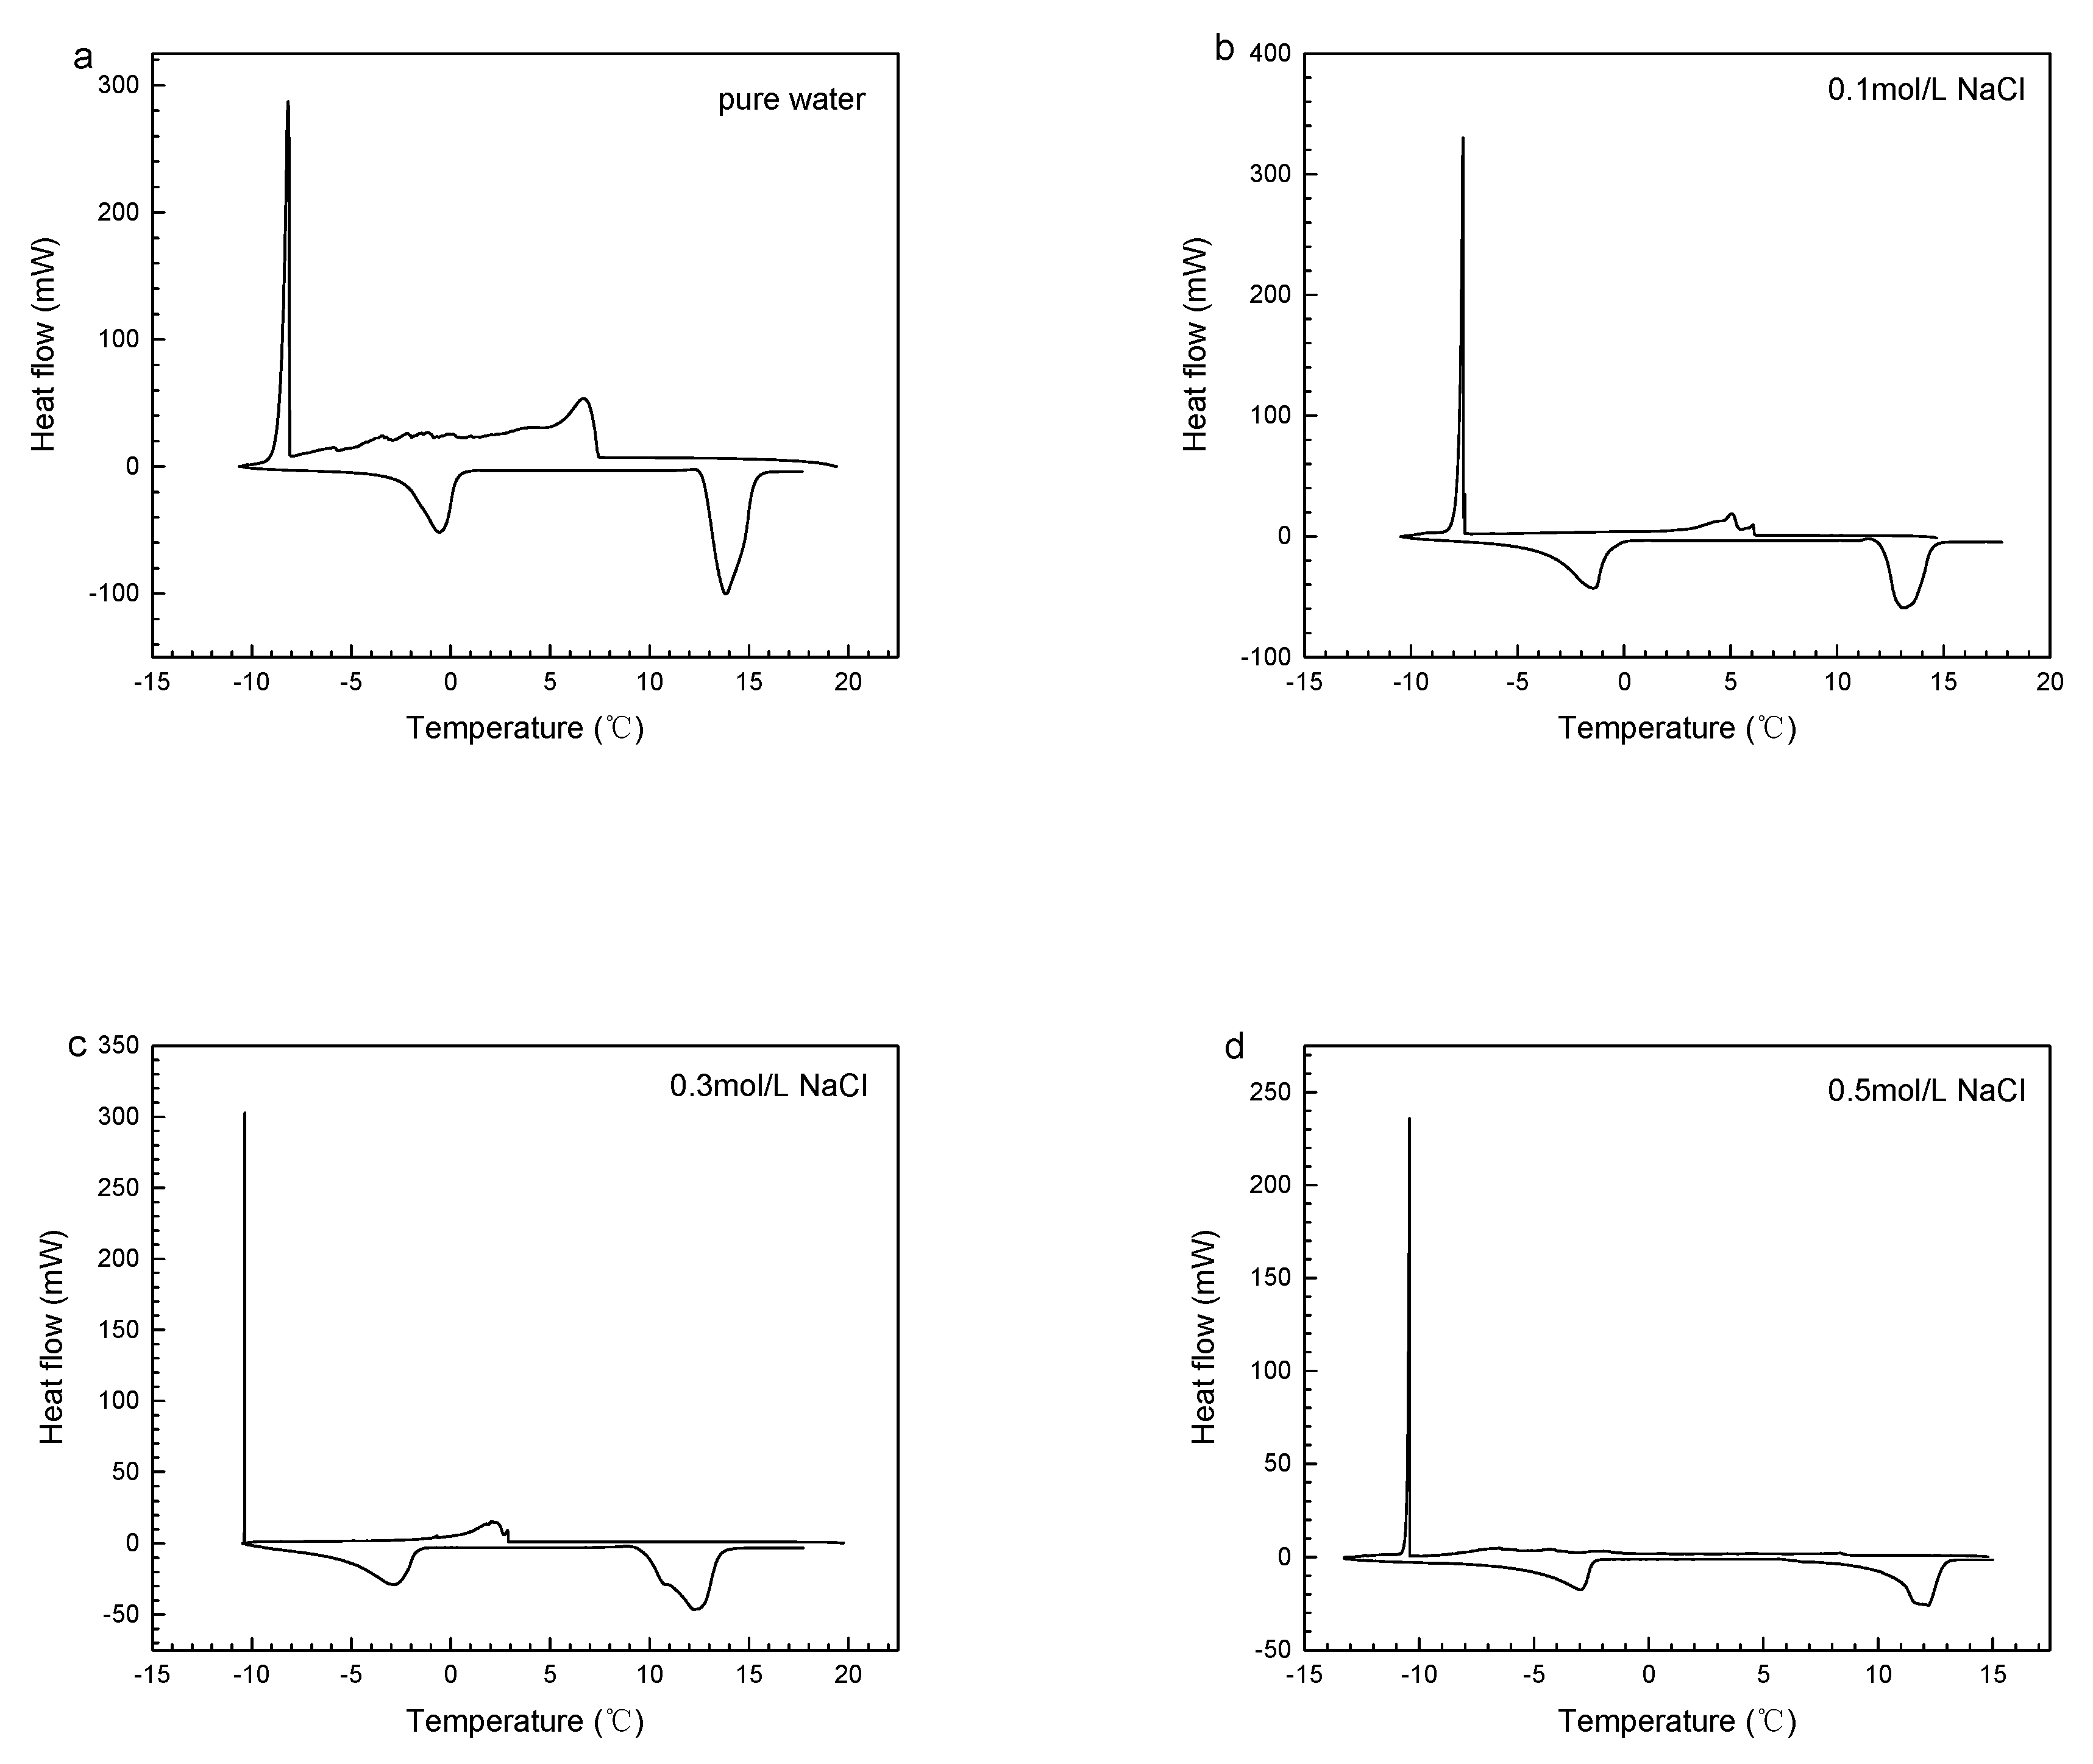
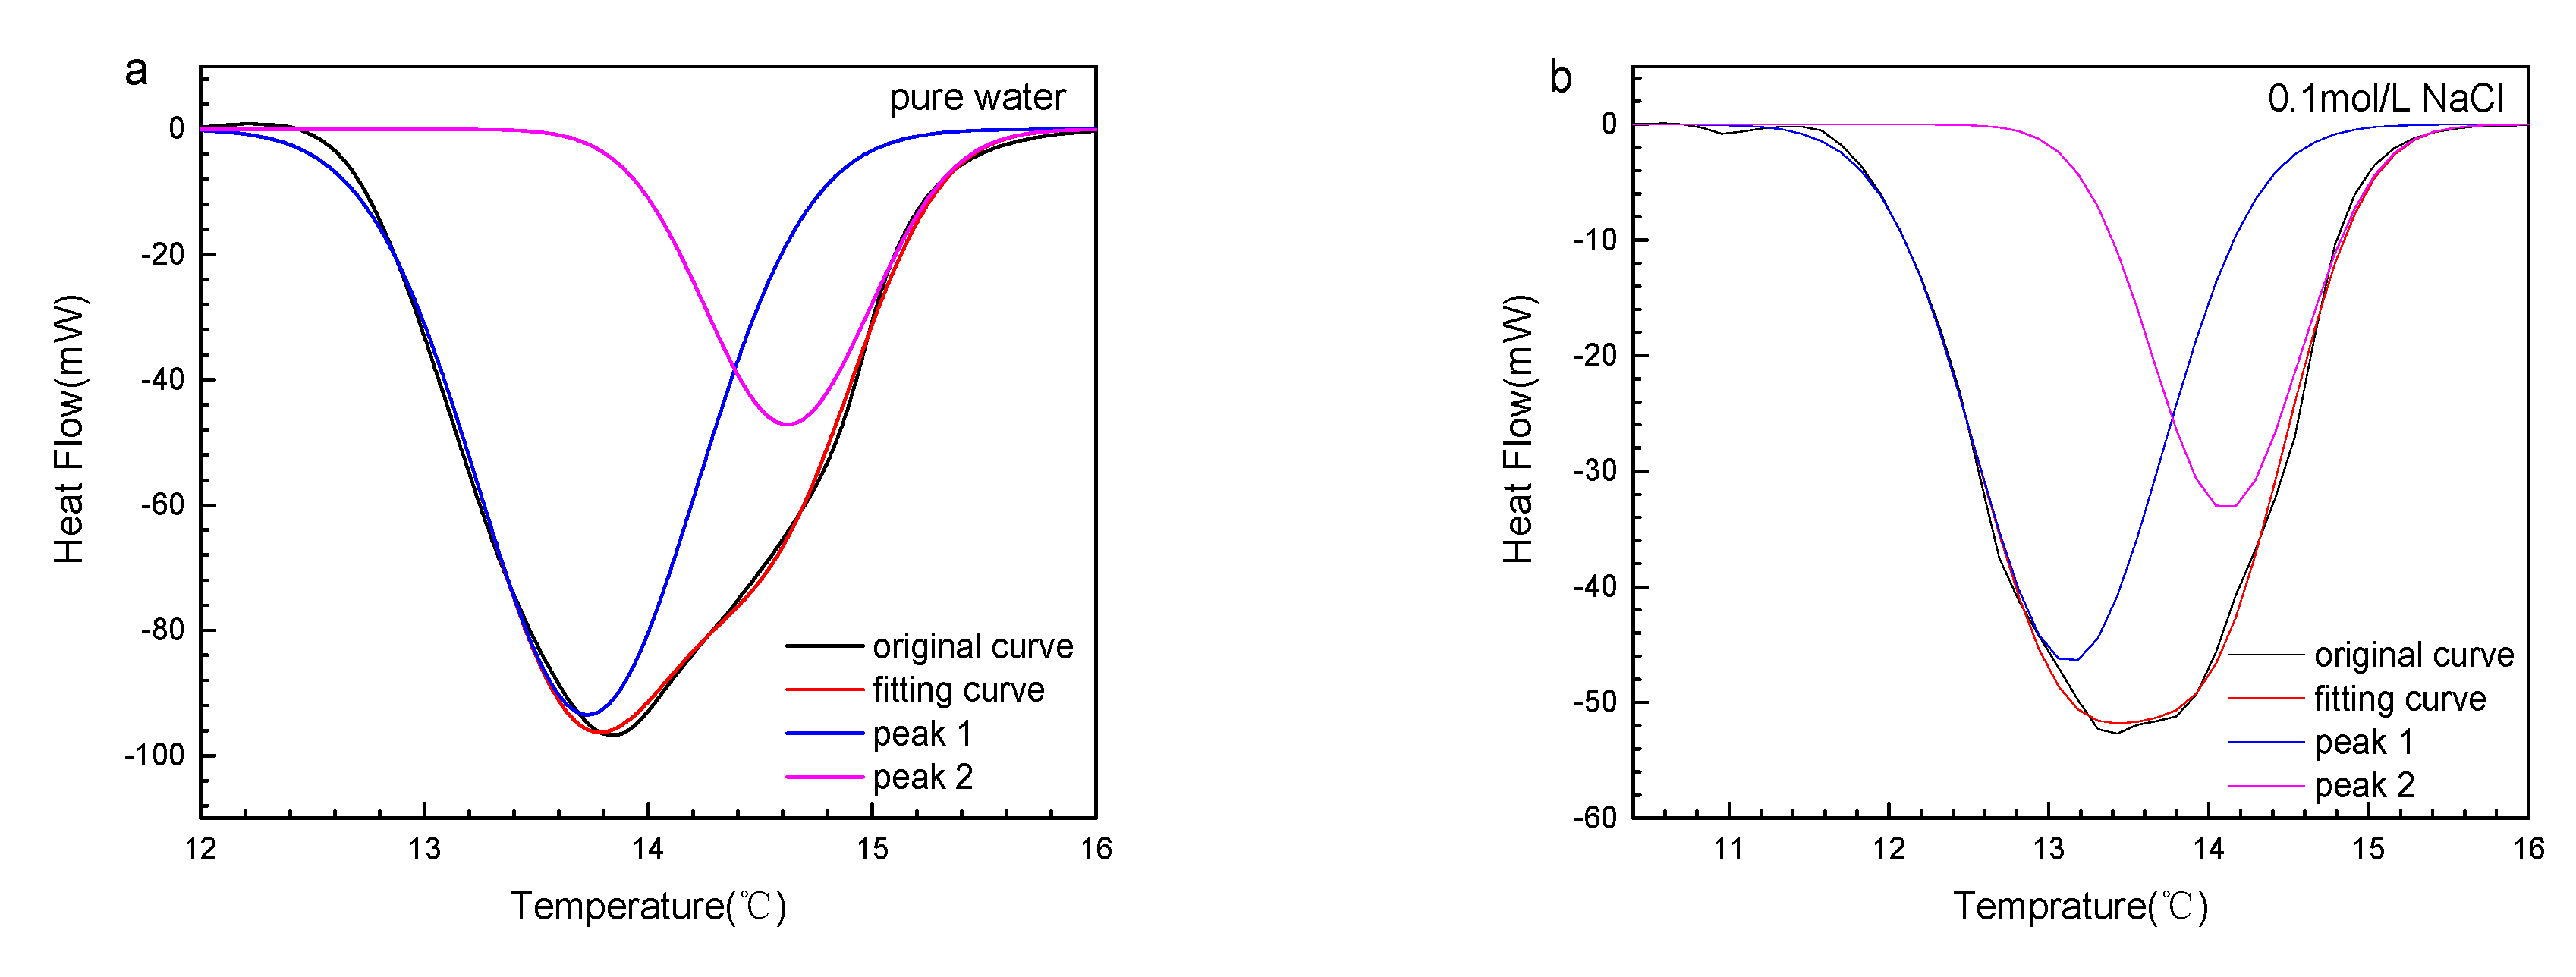
3.3. Phase Behavior of Methane Hydrate in Montmorillonite Samples

Owing to their adsorption characteristics and layered structure, the montmorillonite samples contain bound water. The hydrate formation in the montmorillonite samples is different from other porous media because of the presence of bound water, which changes the P-T curve of hydrate formation and decomposition [23]. The promotion effect of montmorillonite and the inhibition effect of electrolyte compete in the mineral solution, causing the promotion of the formation of hydrate thermodynamics with increasing montmorillonite content when the concentration of montmorillonite is low [25]. At the same time, hydrate formation would be inhibited by a high concentration of montmorillonite [27]. In this work, the formation of methane hydrate in the montmorillonite samples with different concentrations of NaCl solution was carried out. The samples used in this experiment had a mass ratio of montmorillonite to brine solution of 2:1, with the concentration of brine solution shown in Table 5. DSC is used to measure the heat flow during the formation and decomposition process of hydrate in the montmorillonite samples. In the experiment, sufficient water content, sufficient hydration time and sufficient agitation before the experiment were carried out on the samples to ensure the uniformity of the samples as far as possible. Of course, there were also partial differences in water content and salinity, but they had little impact on the experimental results. Figure 7 shows thermograms of the methane hydrate formation and dissociation in the montmorillonite samples. To some extent, the integral value of the hydrate peak represents the amount of hydrate. During the cooling stage, there are two major exothermic peaks that correspond to ice freezing and hydrate formation. From Figure 7, it can be seen that there are several irregular peaks of hydrate formation. It is speculated that the presence of the TOT structure in montmorillonite makes water exist in the form of small independent droplets similar to water-in-oil dispersions. Each small drop acts as an independent system, and hydrates are successively formed in each system [43,44,45,46]. In the interim, as the solution salinity increases, the ice peak temperature moves to the left, which means that water freezes at a lower temperature. The decomposition peak of hydrate also shifts to low temperature with increasing brine solution concentration, while the decomposition peak value decreases at the same time.
By analyzing the thermogram of each sample, the freezing point, water conversion rate, and initial extrapolation temperature can be obtained, as shown in Table 5. It can be found from the table that, the reaction heat of hydrate decomposition decreases with increasing brine solution concentration. CALIST0 was used to obtain the extrapolated initial temperature of the hydrate decomposition peak and freezing point. As shown in Table 5, with increasing brine solution concentration, the freezing point keeps decreasing, and the extrapolation initial temperature also decreases to some extent. The conversion rate of water also decreases at the same time. The results show that the salt ions influence the stability of hydrate in montmorillonite. At the same time, we find that when montmorillonite is present the conversion rate of water increases with a salt-free system under the same pressure [47,48]. This indicates that the presence of montmorillonite at this concentration could promote hydrate formation.
The onset point of the decomposition peak of hydrate in the DSC test can be considered to be at approximately the phase equilibrium temperature of the hydrate [49,50]. Figure 8 shows the phase equilibrium curve of methane hydrate in a pure water system, 0.5 mol/L NaCl solution, and montmorillonite with a water content of 76% [23,51]. As illustrated in Figure 8, the phase equilibrium temperature of methane hydrate in a pure water system under 10 MPa pressure is 12.81 °C, which is only 0.1 °C different from the phase equilibrium temperature of hydrate decomposition in sample 1. Moreover, in the pure montmorillonite samples, the phase equilibrium temperature is approximately 13.41 °C at 10 MPa, which changes slightly to the pure-water system. At this concentration, montmorillonite appears to be a weak promoter of hydrate formation. Figure 8 illustrates that the NaCl solution with a concentration similar to seawater (0.5 mol/L) affects methane hydrate phase equilibrium conditions slightly. When the pressure is 10 MPa, the phase equilibrium temperature of methane hydrate in 0.5 mol/L NaCl solution is 12.23 °C, but that of the NaCl solution montmorillonite system under the same concentration and experimental pressure is approximately 10.705 °C, which is a decrease of approximately 1.5 °C. Therefore, the salt solution (without porous media) and the montmorillonite system with pure water both have little effect on the hydrate phase equilibrium conditions. It means that the effect of salt ions on the stability of hydrate is enhanced by the presence of montmorillonite, which is the result of the combined effect of salt ions on the dehydration of montmorillonite and the direct effect on the stability of hydrate.
PEAKFIT was used to fit the hydrate decomposition peak of the DSC curve. The fitting results are shown in Figure 9, with separated peak 1 being the endothermic peak of bound water hydrate and separated peak 2 being the endothermic peak of free water hydrate [36,52]. As shown in Figure 9, the area of peak 1 decreases continuously with increasing NaCl concentration, while peak 2 increases continuously. As the brine solution concentration increases, the hydration expansion of montmorillonite is inhibited, and the bound water in the sample decreases continuously. With a porous medium to water ratio of 1:2, the free-water content increases as the bound-water content decreases. At the same time, with increasing brine solution concentration, both peaks shift to lower temperature. The variation law is consistent with TG experimental results.

4. Conclusions

In the work described in this paper, the bound-water content, basal spacing, crystal cell parameters, and heat flow during hydrate formation and decomposition in hydrated montmorillonite samples with different solution salinities were measured. The effects of NaCl solution concentration on the expansion properties of montmorillonite and the phase equilibrium conditions of methane hydrate in the montmorillonite are discussed. The effects of water content and brine solution concentration on the crystal characteristics of montmorillonite are compared. The results show that the bound-water content decreases with the increase of salt-ion concentration in the water dispersed samples, and approaches a minimum value near 0.2 mol/L. it is due to the influence of salt ions on the hydrogen-bond balance between the surface of the montmorillonite and the bound water. In addition, to some extent, it affects the dehydration process of montmorillonite. However, the number of interlayer water molecules is not affected obviously by the change of brine solution concentration and the water content. A large amount of bound water is adsorbed on the surface of the montmorillonite particles in other forms. Ions have a great influence on the moisture content of porous media. The change of initial water content and the influence of salt ions on the stability of methane hydrate together affect the phase equilibrium condition of methane hydrate. The phase equilibrium temperature of hydrate decreases with increasing brine solution concentration. Therefore, the hydrate in marine sediments is not only influenced by the stability-influence of salt ions, but also impacted by bound-water content, which is influenced by solution salinity. This work can provide fundamental information for the investigation of the formation and exploitation of natural gas hydrate in deep-sea sediments.

Author Contributions

All the authors contributed to this paper. Y.T., K.Y., and X.L. conceived and designed the experiments; Y.T., K.Y., and Z.C. performed the experiments and wrote the paper; Y.Y. and C.X. prepared the experiments and analyzed the data. All authors have read and agreed to the published version of the manuscript.

Funding

The research received no external funding.

Acknowledgments

This work was supported by the Key Program of the National Natural Science Foundation of China (51736009), the Natural Science Foundation of Guangdong Province of China (2017A030313301), the Special project for marine economy development of Guangdong Province (GDME-2018D002), the National Key R&D Program of China (2016YFC0304002, 2017YFC0307306), the Science and Technology Apparatus Development Program of the Chinese Academy of Sciences (CAS) (YZ201619), the Frontier Sciences Key Research Program of the Chinese Academy of Sciences (QYZDJ-SSW-JSC033), the Key Research Program of Frontier Sciences, CAS (ZDBS-LY SLH041), and the Key Laboratory of Ocean Energy Utilization and Energy Conservation of Ministry of Education(LOEC-201802), Key Research Program of Frontier Sciences, CAS (ZDBS-LY SLH041), the Natural Science Foundation of Guangdong Province of China (2019A1515012086).

Conflicts of Interest

The authors declare no conflicts of interest.

References

  1. Chen, L.T.; Sun, C.Y.; Chen, G.J.; Nie, Y.Q. Thermodynamics Model of Predicting Gas Hydrate in Porous Media Based on Reaction-Adsorption Two-Step Formation Mechanism. Ind. Eng. Chem. Res. 2010, 49, 3936–3943. [Google Scholar] [CrossRef]
  2. Li, X.-S.; Zhang, Y.; Li, G.; Chen, Z.-Y.; Yan, K.-F.; Li, Q.-P. Gas hydrate equilibrium dissociation conditions in porous media using two thermodynamic approaches. J. Chem. Thermodyn. 2008, 40, 1464–1474. [Google Scholar] [CrossRef]
  3. Llamedo, M.; Anderson, R.; Tohidi, B. Thermodynamic prediction of clathrate hydrate dissociation conditions in mesoporous media. Am. Miner. 2004, 89, 1264–1270. [Google Scholar] [CrossRef]
  4. Peddireddy, S.; Lee, S.Y.; Lee, J.W. Variable contact angle model for gas hydrate equilibrium in porous media. AIChE J. 2006, 52, 1228–1234. [Google Scholar] [CrossRef]
  5. Anderson, R.; Llamedo, M.; Tohidi, B.; Burgass, R.W. Experimental measurement of methane and carbon dioxide clathrate hydrate equilibria in mesoporous silica. J. Phys. Chem. B 2003, 107, 3507–3514. [Google Scholar] [CrossRef]
  6. Kang, S.-P.; Lee, J.-W.; Ryu, H.-J. Phase behavior of methane and carbon dioxide hydrates in meso- and macro-sized porous media. Fluid Phase Equilibria 2008, 274, 68–72. [Google Scholar] [CrossRef]
  7. Turner, D.J.; Cherry, R.S.; Sloan, E.D. Sensitivity of methane hydrate phase equilibria to sediment pore size. Fluid Phase Equilibria 2005, 228–229, 505–510. [Google Scholar] [CrossRef]
  8. Uchida, T.; Ebinuma, T.; Ishizaki, T. Dissociation condition measurements of methane hydrate in confined small pores of porous glass. J. Phys. Chem. B 1999, 103, 3659–3662. [Google Scholar] [CrossRef]
  9. Zhang, W.; Wilder, J.W.; Smith, D.H. Interpretation of ethane hydrate equilibrium data for porous media involving hydrate-ice equilibria. AIChE J. 2002, 48, 2324–2331. [Google Scholar] [CrossRef]
  10. Li, X.-S.; Xu, C.-G.; Zhang, Y.; Ruan, X.-K.; Li, G.; Wang, Y. Investigation into gas production from natural gas hydrate: A review. Appl. Energy 2016, 172, 286–322. [Google Scholar] [CrossRef] [Green Version]
  11. Liu, J.; Chen, M.; Chen, Z.; Yan, W. Clay mineral distribution in surface sediments of the South China Sea and its significance for in sediment sources and transport. Chin. J. Oceanol. Limnol. 2010, 28, 407–415. [Google Scholar] [CrossRef]
  12. Liu, Z.; Colin, C.; Li, X.; Zhao, Y.; Tuo, S.; Chen, Z.; Siringan, F.P.; Liu, J.T.; Huang, C.-Y.; You, C.-F.; et al. Clay mineral distribution in surface sediments of the northeastern South China Sea and surrounding fluvial drainage basins: Source and transport. Mar. Geol. 2010, 277, 48–60. [Google Scholar] [CrossRef]
  13. Brindley, G.W. Bentonites—Geology, Mineralogy, Properties and Uses; Elsevier: Amsterdam, The Netherlands, 1979; Volume 15, pp. 78–79. [Google Scholar]
  14. Guggenheim, S.; van Groos, A.F.K. New gas-hydrate phase: Synthesis and stability of clay-methane hydrate intercalate. Geology 2003, 31, 653–656. [Google Scholar] [CrossRef]
  15. Titiloye, J.O.; Skipper, N.T. Molecular dynamics simulation of methane in sodium montmorillonite clay hydrates at elevated pressures and temperatures. Mol. Phys. 2001, 99, 899–906. [Google Scholar] [CrossRef]
  16. Yan, K.; Li, X.; Xu, C.; Lv, Q.; Ruan, X. Molecular dynamics simulation of the intercalation behaviors of methane hydrate in montmorillonite. J. Mol. Model. 2014, 20, 2311. [Google Scholar] [CrossRef]
  17. Yan, K.; Li, X.; Chen, Z.; Zhang, Y.; Xu, C.; Xia, Z. Methane hydrate formation and dissociation behaviors in montmorillonite. Chin. J. Oceanol. Limnol. 2019, 27, 1212–1218. [Google Scholar] [CrossRef]
  18. DeJong, P.H.K.; Wilson, J.E.; Neilson, G.W.; Buckingham, A.D. Hydrophobic hydration of methane. Mol. Phys. 1997, 91, 99–103. [Google Scholar] [CrossRef]
  19. Radhika, I.; Burla, S.K.; Kandadai, S.; Ch, E.; Prasad, P.S.R.; Babu, D.S. Influence Of Sediment Structural Properties And Their Dynamics In The Formation And Dissociation Of Methane Hydrates. Mater. Today Proc. 2018, 5, 17572–17578. [Google Scholar] [CrossRef]
  20. Martos-Villa, R.; Guggenheim, S.; Pilar Mata, M.; Ignacio Sainz-Diaz, C.; Nieto, F. Interaction of methane hydrate complexes with smectites: Experimental results compared to molecular models. Am. Miner. 2014, 99, 401–414. [Google Scholar] [CrossRef]
  21. Wu, Z.; Li, Y.; Sun, X.; Li, M.; Jia, R. Experimental study on the gas phase permeability of montmorillonite sediments in the presence of hydrates. Mar. Pet. Geol. 2018, 91, 373–380. [Google Scholar] [CrossRef]
  22. Zhang, Q.; Wu, Q.; Zhang, H.; Zhang, B.-y.; Xia, T. Effect of montmorillonite on hydrate-based methane separation from mine gas. J. Cent. South Univ. 2018, 25, 38–50. [Google Scholar] [CrossRef]
  23. Uchida, T.; Takeya, S.; Chuvilin, E.M.; Ohmura, R.; Nagao, J.; Yakushev, V.S.; Istomin, V.A.; Minagawa, H.; Ebinuma, T.; Narita, H. Decomposition of methane hydrates in sand, sandstone, clays, and glass beads. J. Geophys. Res. Solid Earth 2004, 109. [Google Scholar] [CrossRef] [Green Version]
  24. Yan, K.; Li, X.; Chen, Z.; Xu, C.; Zhang, Y.; Xia, Z. The Formation of CH4 hydrate in the slit nanopore between the smectite basal surfaces by molecular dynamics simulation. Energy Fuels 2018, 32, 6467–6474. [Google Scholar] [CrossRef]
  25. Nguyen, N.N.; Nguyen, A.V. The dual effect of sodium halides on the formation of methane gas hydrate. Fuel 2015, 156, 87–95. [Google Scholar] [CrossRef]
  26. Park, S.H.; Sposito, G. Do montmorillonite surfaces promote methane hydrate formation? Monte Carlo and molecular dynamics simulations. J. Phys. Chem. B 2003, 107, 2281–2290. [Google Scholar] [CrossRef]
  27. Kotkoskie, A.U.; Al-Ubaidi, B.; Wildeman, T.R.; Sloan, E.D. Inhibition of gas hydrates in water-based drilling muds. SPE Drill. Eng. 1992, 7, 130–136. [Google Scholar] [CrossRef]
  28. Pusch, R.; Karnland, O. Physico chemical stability of smectite clays. Eng. Geol. 1996, 41, 73–85. [Google Scholar] [CrossRef]
  29. Cao, C.; Lei, H. Geochemical characteristics of pore water in shallow sediments from north continental slope of South China Sea and their significance for natural gas hydrate occurrence. Procedia Environ. Sci. 2012, 12, 1017–1023. [Google Scholar] [CrossRef] [Green Version]
  30. Hoareau, G.; Monnin, C.; Odonne, F. The stability of gypsum in marine sediments using the entire ODP/IODP porewater composition database. Mar. Geol. 2011, 279, 87–97. [Google Scholar] [CrossRef]
  31. Husebo, J.; Ersland, G.; Graue, A.; Kvamme, B. Effects of salinity on hydrate stability and implications for storage of CO(2) in natural gas hydrate reservoirs. Energy Procedia 2009, 1, 3731–3738. [Google Scholar] [CrossRef] [Green Version]
  32. Kim, K.-S.; Kang, J.W.; Kang, S.-P. Tuning ionic liquids for hydrate inhibition. Chem. Commun. 2011, 47, 6341–6343. [Google Scholar] [CrossRef] [PubMed]
  33. Qi, Y.; Wu, W.; Liu, Y.; Xie, Y.; Chen, X. The influence of NaCl ions on hydrate structure and thermodynamic equilibrium conditions of gas hydrates. Fluid Phase Equilibria 2012, 325, 6–10. [Google Scholar] [CrossRef]
  34. Lu, H.; Matsumoto, R. Experimental studies on the possible influences of composition changes of pore water on the stability conditions of methane hydrate in marine sediments. Mar. Chem. 2005, 93, 149–157. [Google Scholar] [CrossRef]
  35. Milkov, A.V.; Dickens, G.R.; Claypool, G.E.; Lee, Y.J.; Borowski, W.S.; Torres, M.E.; Xu, W.; Tomaru, H.; Tréhu, A.M.; Schultheiss, P. Co-existence of gas hydrate, free gas, and brine within the regional gas hydrate stability zone at Hydrate Ridge (Oregon margin): Evidence from prolonged degassing of a pressurized core. Earth Planet. Sci. Lett. 2004, 222, 829–843. [Google Scholar] [CrossRef]
  36. Torikai, Y.; Sato, S.; Ohashi, H. Thermodynamic properties of water in compacted sodium montmorillonite. Nucl. Technol. 1996, 115, 73–80. [Google Scholar] [CrossRef]
  37. Yan, K.F.; Li, X.S.; Chen, Z.Y.; Xia, Z.M.; Xu, C.G.; Zhang, Z.Q. Molecular Dynamics simulation of the crystal nucleation and growth behavior of methane hydrate in the presence of the surface and nanopores of porous sediment. Langmuir 2016, 32, 7975–7984. [Google Scholar] [CrossRef]
  38. Greene, R.S.B.; Posner, A.M.; Quirk, J.P. Factors affecting formation of quasi-crystals of montmorillonite. Soil Sci. Soc. Am. J. 1973, 37, 457–460. [Google Scholar] [CrossRef]
  39. Karaborni, S.; Smit, B.; Heidug, W.; Urai, J.; vanOort, E. The swelling of clays: Molecular simulations of the hydration of montmorillonite. Science 1996, 271, 1102–1104. [Google Scholar] [CrossRef] [Green Version]
  40. Benrhaiem, H.; Tessier, D.; Pons, C.H. Swelling behavior and structural and textural evolution of montmorillonites during a dessication humectation cycle 1 calcium montmorillonites. Clay Miner. 1986, 21, 9–29. [Google Scholar] [CrossRef]
  41. Morodome, S.; Kawamura, K. Swelling behavior of Na- and Ca-montmorillonite up to 150 degrees c by In Situ X-ray diffraction experiments. Clays Clay Miner. 2009, 57, 150–160. [Google Scholar] [CrossRef]
  42. Li, Y.; Wang, X.; Wang, J. Cation exchange, interlayer spacing, and thermal analysis of Na/Ca-montmorillonite modified with alkaline and alkaline earth metal ions. J. Therm. Anal. Calorim. 2012, 110, 1199–1206. [Google Scholar] [CrossRef]
  43. Turner, D.J.; Miller, K.T.; Sloan, E.D. Direct conversion of water droplets to methane hydrate in crude oil. Chem. Eng. Sci. 2009, 64, 5066–5072. [Google Scholar] [CrossRef]
  44. Turner, D.J.; Miller, K.T.; Sloan, E.D. Methane hydrate formation and an inward growing shell model in water-in-oil dispersions. Chem. Eng. Sci. 2009, 64, 3996–4004. [Google Scholar] [CrossRef]
  45. Xue, H.; Lu, S.; Fu, X. Forecasting model of solubility of CH4, CO2 and N2 in crude oil. Oil Gas Geol. 2005, 26, 444–449. [Google Scholar]
  46. Zhong, D.L.; Yang, C.; Liu, D.P.; Wu, Z.M. Experimental investigation of methane hydrate formation on suspended water droplets. J. Cryst. Growth 2011, 327, 237–244. [Google Scholar] [CrossRef]
  47. Zhang, Y.; Li, X.-S.; Chen, Z.-Y.; Li, G.; Wang, Y. Effects of particle and pore sizes on the formation behaviors of methane hydrate in porous silica gels. J. Nat. Gas Sci. Eng. 2016, 35, 1463–1471. [Google Scholar] [CrossRef]
  48. Zhang, Y.; Wu, H.-J.; Li, X.-S.; Chen, Z.-Y.; Li, G.; Zeng, Z.-Y. Dissociation Behavior of Methane Hydrate in Porous Media. Chem. J. Chin. Univ. Chin. 2010, 31, 1848–1854. [Google Scholar]
  49. Harris, J.D.; Rusch, A.W. Identifying hydrated salts using simultaneous thermogravimetric analysis and differential scanning calorimetry. J. Chem. Educ. 2013, 90, 235–238. [Google Scholar] [CrossRef]
  50. Semenov, M.E.; Manakov, A.Y.; Shitz, E.Y.; Stoporev, A.S.; Altunina, L.K.; Strelets, L.A.; Misyura, S.Y.; Nakoryakov, V.E. DSC and thermal imaging studies of methane hydrate formation and dissociation in water emulsions in crude oils. J. Therm. Anal. Calorim. 2015, 119, 757–767. [Google Scholar] [CrossRef]
  51. Maekawa, T. Equilibrium conditions for gas hydrates of methane and ethane mixtures in pure water and sodium chloride solution. Geochem. J. 2001, 35, 59–66. [Google Scholar] [CrossRef]
  52. Mignon, P.; Ugliengo, P.; Sodupe, M.; Hernandez, E.R. Ab initio molecular dynamics study of the hydration of Li+, Na+ and K+ in a montmorillonite model. Influence of isomorphic substitution. Phys. Chem. Chem. Phys. 2010, 12, 688–697. [Google Scholar] [CrossRef] [PubMed]
Figure 1. Crystal structure of montmorillonite [28].
Energies 13 00231 g001
Figure 2. TG curves of dispersed montmorillonite samples.
Energies 13 00231 g002
Figure 3. DTG curves of dispersed montmorillonite samples.
Energies 13 00231 g003
Figure 4. Montmorillonite samples for crystal characterization experiments as Table 2.
Energies 13 00231 g004
Figure 5. SEM images of samples.
Energies 13 00231 g005
Figure 6. X-ray powder-diffraction patterns for montmorillonite samples.
Energies 13 00231 g006
Figure 7. Thermograms of methane hydrate formation and dissociation in montmorillonite samples: (a) sample 1, (b) sample 2, (c) sample 3, and (d) sample 4.
Energies 13 00231 g007
Figure 8. Phase equilibrium curves of methane hydrate in montmorillonite [23,51].
Energies 13 00231 g008
Figure 9. Thermograms of methane hydrate dissociation in montmorillonite samples: (a) sample 1, (b) samples 2, (c) sample 3, and (d) sample 4.
Energies 13 00231 g009aEnergies 13 00231 g009b
Table 1. Weight-loss ratios and inflection points of montmorillonite samples.
NumberSampleWeight-Loss Ratio (%) Inflection Point (°C)
1pure water5.8590.94
20.1 mol/L NaCl5.0189.23
30.2 mol/L NaCl4.2886.75
40.3 mol/L NaCl3.9278.07
50.4 mol/L NaCl2.0776.27
60.5 mol/L NaCl1.4165.73
Table 2. Montmorillonite samples for crystal characterization experiments.
NumberSolution ConcentrationWater Content (%)
1pure water200
2pure water47
30.5 mol/L200
40.5 mol/L47
5dry montmorillonite≈ 0
Table 3. Lattice constants of XRD samples.
Numbera (Å)b (Å)c (Å)
15.2059.02818.547
25.2338.98815.573
35.2698.98618.677
45.2358.98215.492
55.2508.9989.820
Table 4. XRD results of montmorillonite samples.
NumberPeak d(001) 2θ (°)Basal Spacing (Å)Number of Water Molecules
1---
25.89 14.982
3---
46.1314.412
59.129.640
Table 5. DSC experimental results of montmorillonite samples soaked in NaCl solution of different concentrations.
NumberSolution ConcentrationReaction Heat (j/g) Onset Point (°C) Freezing Point (°C) Conversion Rate (%)
1pure water216.08312.718−2.31865.4
20.1 mol/L NaCl159.00712.065−3.50163.6
30.3 mol/L NaCl153.2529.778−5.70860.1
40.5 mol/L NaCl135.53410.774−5.43958.3

