Evaluation of an Offshore Wind Farm by Using Data from the Weather Station, Floating LiDAR, Mast, and MERRA
Abstract
1. Introduction
2. Materials and Methods
2.1. Measurement Setup
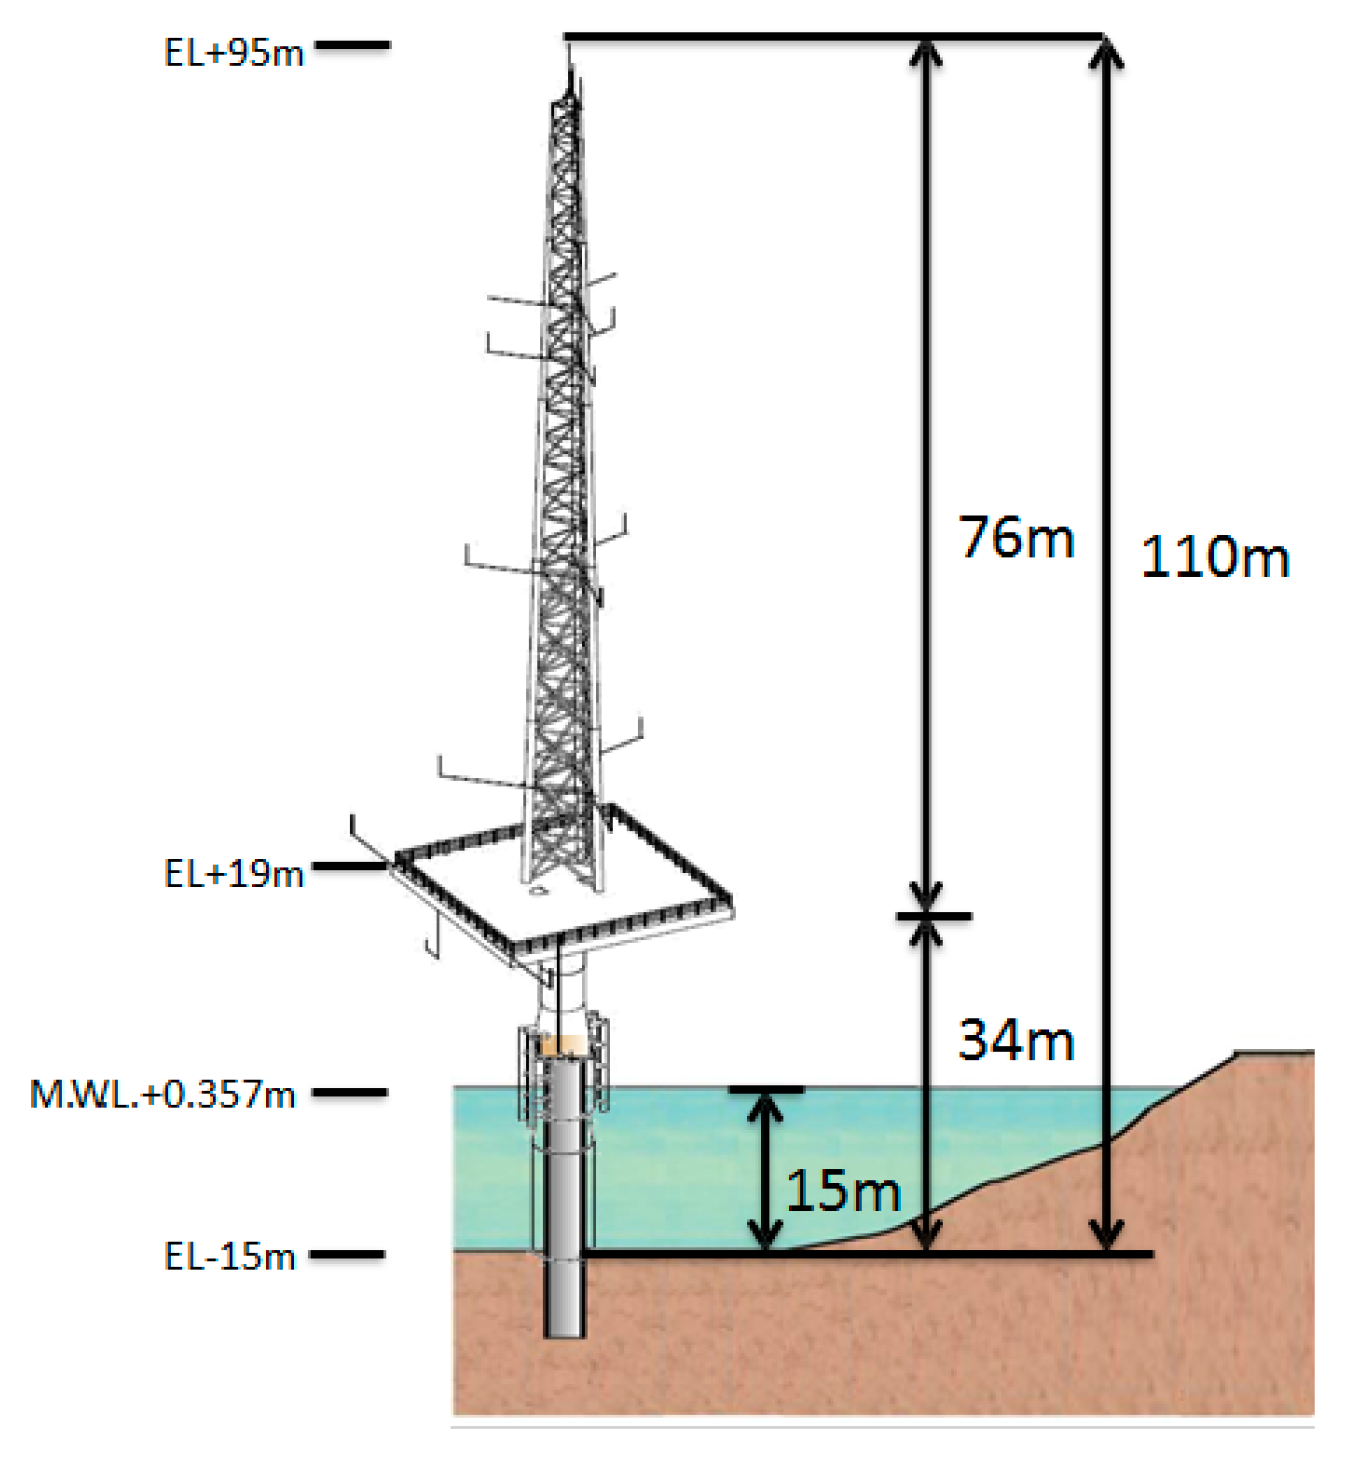
2.1.1. Meteorological Mast
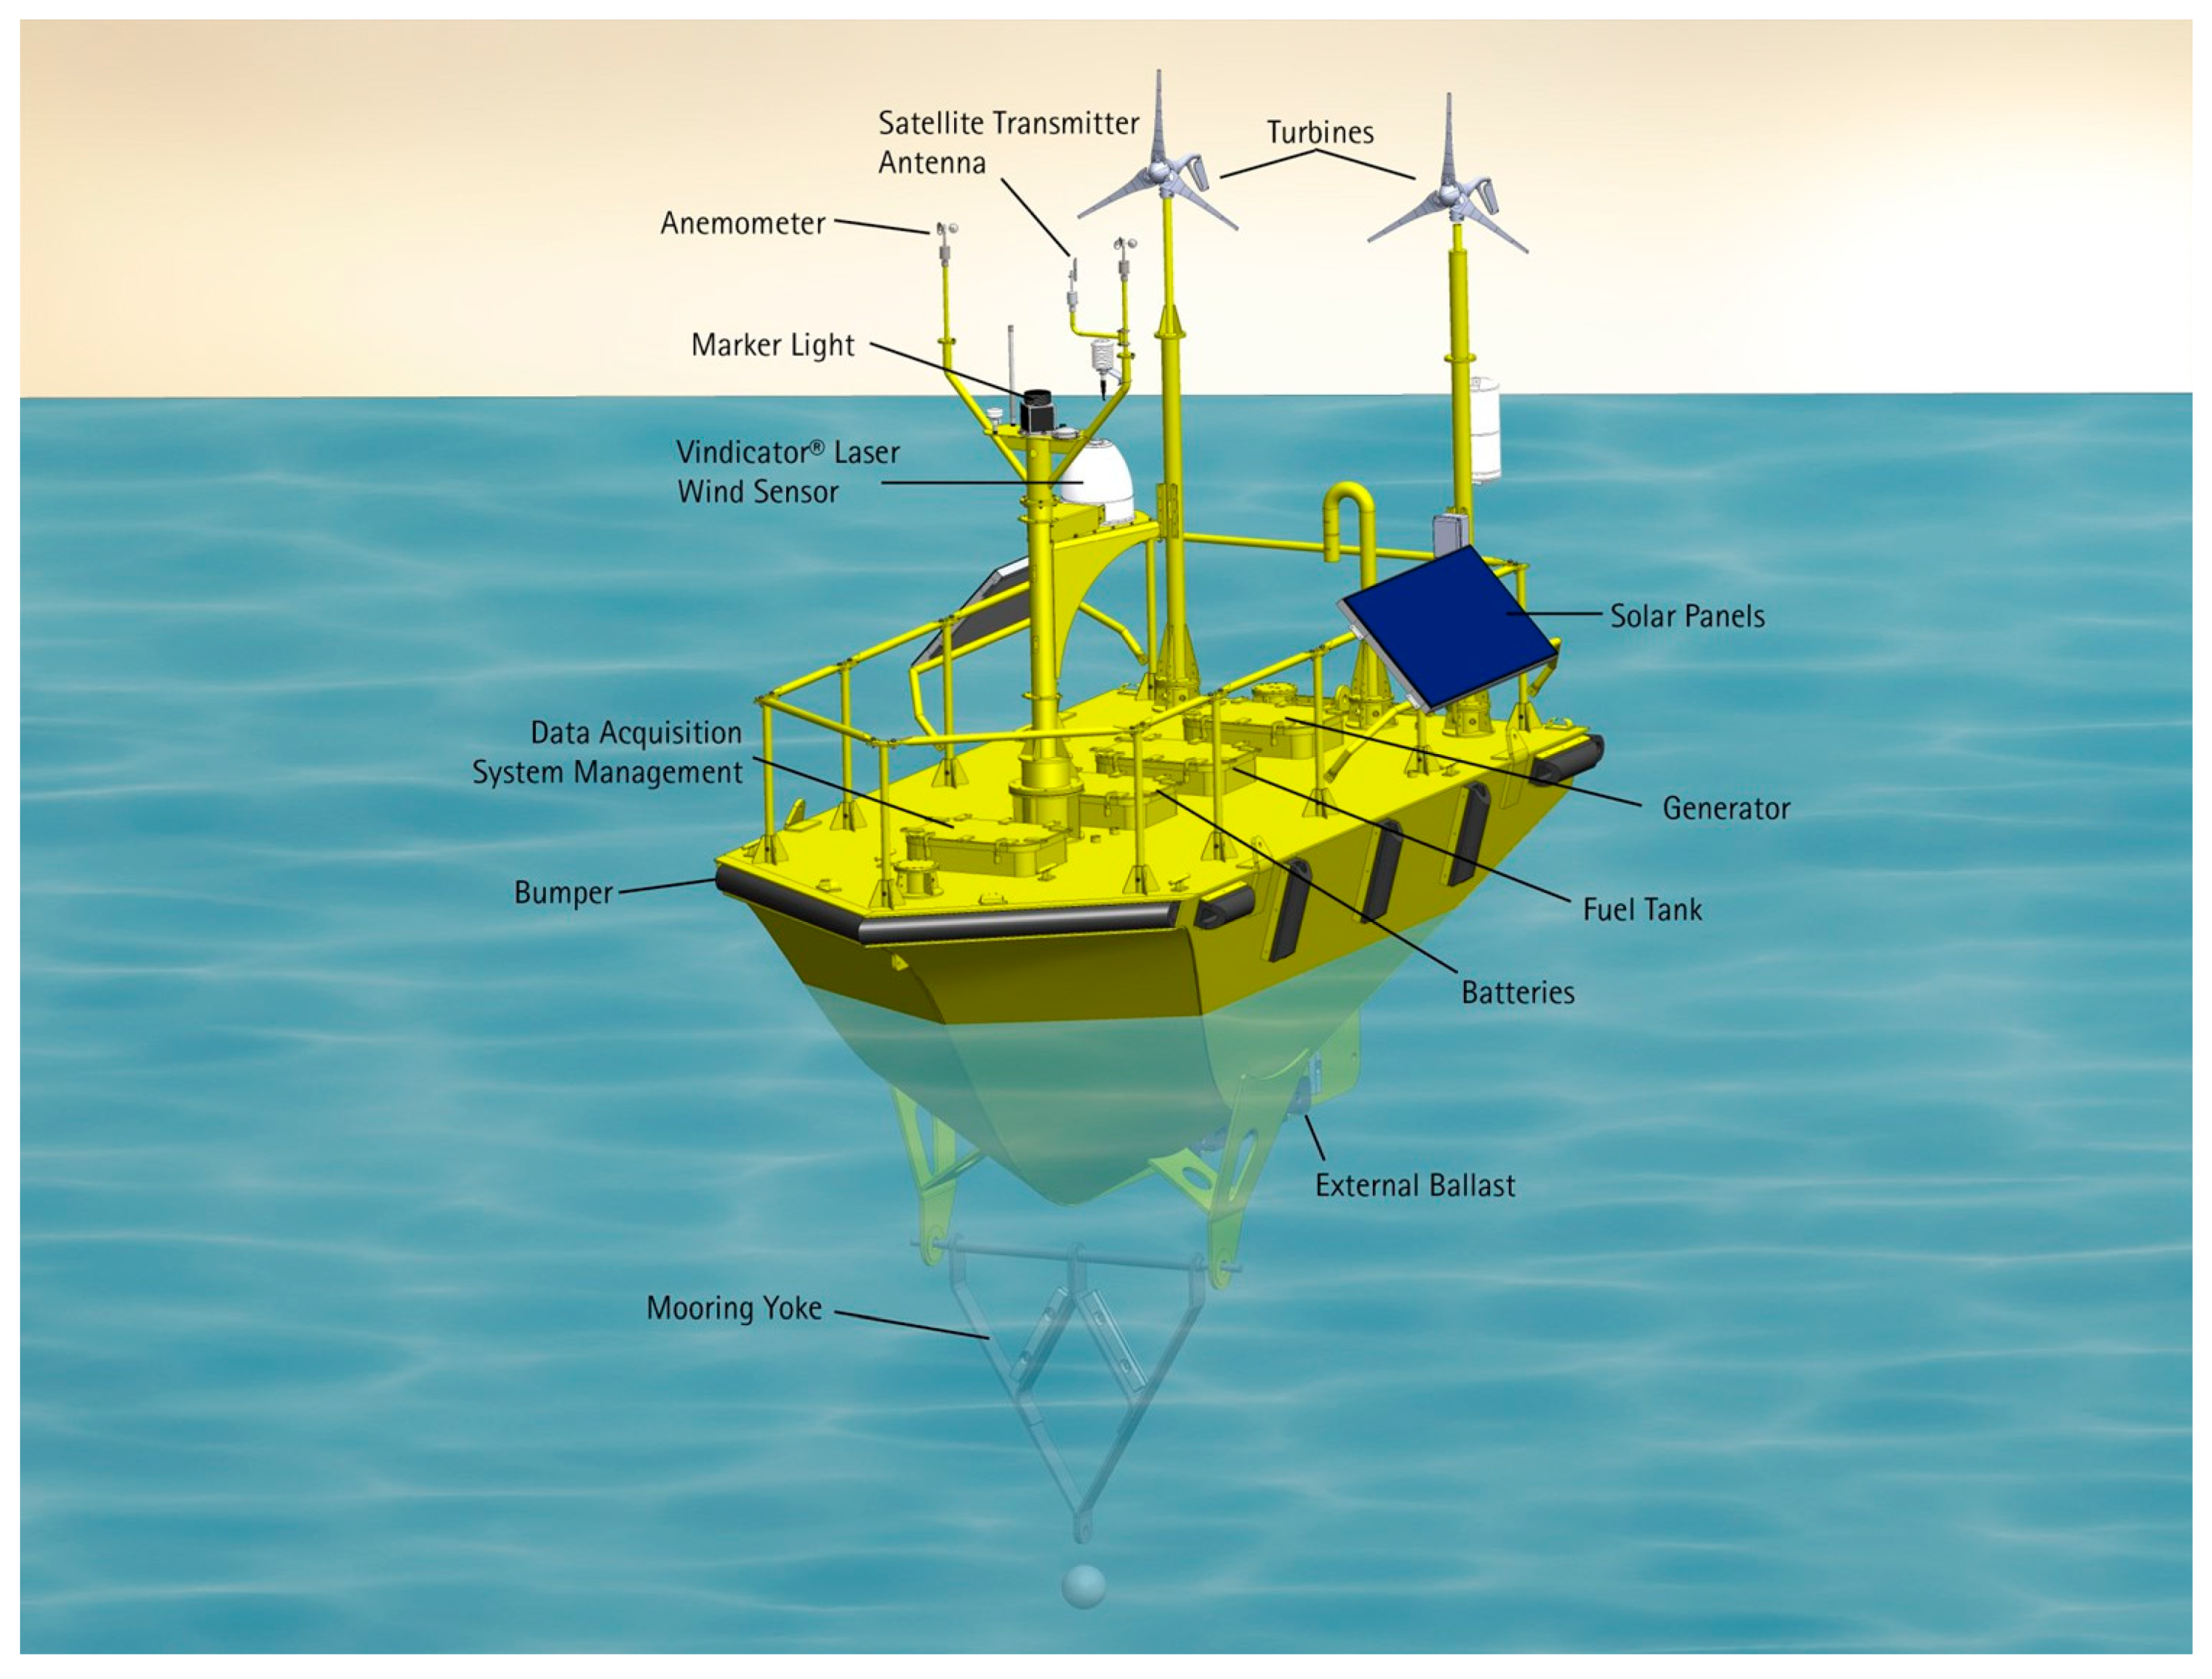
2.1.2. Floating LiDAR Device
2.2. Datasets
2.3. Measure-Correlate-Predict
2.4. Wake Effect of Turbine
2.5. Annual Energy Production
2.6. WindSim Model
2.7. Wind Turbine
2.8. Wind Farm Optimization
2.9. Uncertainty in Wind Resource Assessment
3. Results and Discussion
3.1. Estimating the Long-Term Power Production of a Wind Farm Using MCP
3.1.1. Floating LiDAR Device
3.1.2. Mast
3.2. Wind Resource Map
3.3. Wind Farm Optimization
3.4. Annual Energy Production
3.5. Prediction of Annual Energy Production
4. Conclusions
Author Contributions
Funding
Acknowledgments
Conflicts of Interest
Nomenclature
| Shadow area of wake stream | |
| Area of wake stream | |
| Thrust coefficient | |
| Distance between two turbines measured in the across wind direction | |
| Wind direction in degrees | |
| Rotor diameter | |
| Diameter of air after wind blow in a distance | |
| Component of rate of deformation | |
| Weibull distribution function | |
| Shape parameter | |
| Decay coefficient | |
| Distance between turbine i and the intersection of and A measured in the across wind direction | |
| Number of hours in a year | |
| Np | Number of years used for estimating uncertainty in the future |
| Power curve | |
| Energy production for probability x | |
| Radius of wake stream | |
| Geographic spacing between turbines i and j | |
| Velocity component | |
| Upstream wind speed before it goes through a turbine | |
| Wind speed after it go through turbine i | |
| Velocity deficit affected by multi-turbines | |
| Wind speed of turbine j contains shadow part | |
| Wind speed of turbine j affected by k upstream turbines | |
| Upstream wind speed | |
| Downstream wind speed of single wake model | |
| Distance between two turbines measured in the wind direction | |
| z | Value of normal distribution for a specific probability |
| Angle between the north direction (0°) and the segment linking the two turbines | |
| Scale parameter | |
| Eddy viscosity | |
| Uncertainty for 1 year | |
| Uncertainty of climate change | |
| Uncertainty in the future | |
| Uncertainty of the years for prediction |
Abbreviations
| AEP | Annual Energy Production |
| CWB | Central Weather Bureau |
| GCV | General Collocated Velocity |
| GEOS-5 | Goddard Earth Observing System Model, Version 5 |
| LiDAR | Light Detection and Ranging |
| LLS | Linear Least Squares |
| MCP | Measure Correlate Predict |
| MERRA | Modern-Era Retrospective Analysis for Research and Applications |
| NOMAD | Navy Oceanographic Meteorological Automatic Device |
| RMSE | Root Mean Square Error |
References
- Intergovernmental Panel on Climate Change (IPCC). Global Warming of 1.5 °C. 2018. Available online: https://www.ipcc.ch/sr15/ (accessed on 15 July 2019).
- National Development Council (NDC). The Statistical Yearbook of Construction and Planning 2018; National Development Council: Taipei, Taiwan, 2019. [Google Scholar]
- 4C Offshore, Global Offshore Wind Speeds Rankings. 2018. Available online: http://www.4coffshore.com/windfarms/windspeeds.aspx (accessed on 24 April 2018).
- Ministry of Economic Affairs. Program of National Energy Development; Ministry of Economic Affairs: Taipei, Taiwan, 2017.
- Kim, J.-Y.; Oh, K.-Y.; Kim, M.-S.; Kim, K.-Y. Evaluation and characterization of offshore wind resources with long-term met mast data corrected by wind lidar. Renew. Energy 2019, 144, 41–55. [Google Scholar] [CrossRef]
- Ørsted A/S. Offshore Wind Data. Ørsted A/S, 2019. Available online: https://orsted.com/en/Our-business/Offshore-wind/Wind-Data (accessed on 3 September 2019).
- Sharma, P.K.; Warudkar, V.; Ahmed, S. Application of lidar and measure correlate predict method in offshore wind resource assessments. J. Clean. Prod. 2019, 215, 534–543. [Google Scholar] [CrossRef]
- Brower, M. Wind Resource Assessment: A Practical Guide to Developing a Wind Project; John Wiley & Sons: New York, NY, USA, 2012. [Google Scholar]
- Rienecker, M.M.; Suarez, M.J.; Gelaro, R.; Todling, R.; Bacmeister, J.; Liu, E.; Bosilovich, M.G.; Schubert, S.D.; Takacs, L.; Kim, G.K.; et al. MERRA: NASA’s Modern-Era Retrospective Analysis for Research and Applications. J. Clim. 2011, 24, 3624–3648. [Google Scholar] [CrossRef]
- Ren, G.; Wan, J.; Liu, J.; Yu, D. Characterization of wind resource in China from a new perspective. Energy 2019, 167, 994–1010. [Google Scholar] [CrossRef]
- Bosilovich, M.G.; Lucchesi, R.; Suarez, M. MERRA-2: File Specification. NASA Global Modeling and Assimilation Office, Note Number 9 (Version 1.1). 2016. Available online: http://gmao.gsfc.nasa.gov/pubs/office_notes (accessed on 16 July 2019).
- Bansal, J.C.; Farswan, P. Wind farm layout using biogeography based optimization. Renew. Energy 2017, 107, 386–402. [Google Scholar] [CrossRef]
- Patel, J.; Savsani, V.; Patel, V.; Patel, R. Layout optimization of a wind farm using geometric pattern-based approach. Energy Procedia 2019, 158, 940–946. [Google Scholar] [CrossRef]
- Park, J.; Law, K.H. Layout optimization for maximizing wind farm power production using sequential convex programming. Appl. Energy 2015, 151, 320–334. [Google Scholar] [CrossRef]
- Sanderse, B. Aerodynamics of Wind Turbine Wakes Literature Review; Energy Research Centre of Netherlands ECN-E-09-016: Sint Maartensvlotbrug, The Netherlands, 2009. [Google Scholar]
- Shakoor, R.; Hassan, M.Y.; Raheem, A.; Wu, Y.-K. Wake effect modeling: A review of wind farm layout optimization using Jensen’s model. Renew. Sustain. Energy Rev. 2016, 58, 1048–1059. [Google Scholar] [CrossRef]
- Larsen, G.C. A Simple Wake Calculation Procedure; Risø National Laboratory: Roskilde, Denmark, 1988. [Google Scholar]
- Frandsen, S.T. Turbulence and Turbulence-Generated Structural Loading in Wind Turbine Clusters; Risø National Laboratory: Roskilde, Denmark, 2007. [Google Scholar]
- Jensen, N.O. A Note on Wind Generator Interaction; Risø National Laboratory: Roskilde, Denmark, 1983. [Google Scholar]
- Ministry of Economic Affairs. Essentials of Capacity Allocation for Offshore Wind Power Planning Sites. Ministry of Economic Affairs of Taiwan. Available online: https://www.moeaboe.gov.tw/ECW/populace/Law/Content.aspx?menu_id=2870 (accessed on 8 December 2019).
- 4C Offshore, Global Offshore Wind Farms. 2018. Available online: https://www.4coffshore.com/windfarms/windfarms.aspx?windfarmid=TW11&windfarmid=TW11 (accessed on 24 April 2018).
- Mes, J.C.; de Goffau, P.L. Stabilizing Control System of a Platform on a Buoy for Offshore Wind Assessment; Delft University of Technology: Delft, The Netherlands, 2014. [Google Scholar]
- Han, T. The Assessment of Dynamic Wake Effects on Loading. Master’s Thesis, Department of Aerospace Engineering, Delft University of Technology, Delft, Netherlands, 2011. [Google Scholar]
- Manwell, J.F.; McGowan, J.G.; Rogers, A.L. Wind Energy Explained—Theory, Design and Application; John Wiley & Sons: Chichester, UK, 2002. [Google Scholar]
- Abbes, M.; Allagui, M. Centralized control strategy for energy maximization of large array wind turbines. Sustain. Cities Soc. 2016, 25, 82–89. [Google Scholar] [CrossRef]
- WindSim, A.S. Introduction of WindSim Software; WindSim AS: Tønsberg, Norway, 2015. [Google Scholar]
- Meissner, C.; Mana, M.; de Groot, T. Recent developments of WindSim. In Proceedings of the WindSim 14th User Meeting, Tønsberg, Norway, 5–6 June 2019. [Google Scholar]
- Meissner, C.; Vogstad, K.; Welle-Strand Horn, U. Park optimization using IEC constraints for wind quality. In Proceedings of the European Wind Energy Conference, Brussels, Belgium, 14–17 March 2011. [Google Scholar]
- Meissner, C. WindSim: Getting Started; WindSim AS: Tønsberg, Norway, 2019. [Google Scholar]
- Hwang, C.; Jeon, J.H.; Kim, G.H.; Kim, E.; Park, M.; Yu, I.K. Modeling and simulation of the wake effect in a wind farm. J. Int. Counc. Electr. Eng. 2015, 5, 74–77. [Google Scholar] [CrossRef]
- Garrad Hassan, G.L. Uncertainty Analysis. In WindFarmer Theory Manual; Garrad Hassan, G.L., Ed.; Garrad Hassan & Partners Ltd.: Bristol, UK, 2011; pp. 6–39. [Google Scholar]
- Kwon, S.D. Uncertainty analysis of wind energy potential assessment. Appl. Energy 2010, 87, 856–865. [Google Scholar] [CrossRef]
- Lira, A.; Rosas, P.; Araujo, A.; Castro, N. Uncertainties in the estimate of wind energy production. In Proceedings of the Energy Economics Iberian Conference, Lisbon, Portugal, 4–5 February 2016. [Google Scholar]
- Central Weather Bureau (CWB). CWB Observation Data Inquire System. Available online: http://e-service.cwb.gov.tw/HistoryDataQuery/ (accessed on 12 December 2019).
- Chang, P.C.; Hung, J.B.; Lin, T.H. The Analysis of Wind Characteristics at Taiwan Using the Floating LiDAR. In Proceedings of the 37th Ocean Engineering Conference in Taiwan, Taichung, Taiwan, 12–13 November 2015. [Google Scholar]

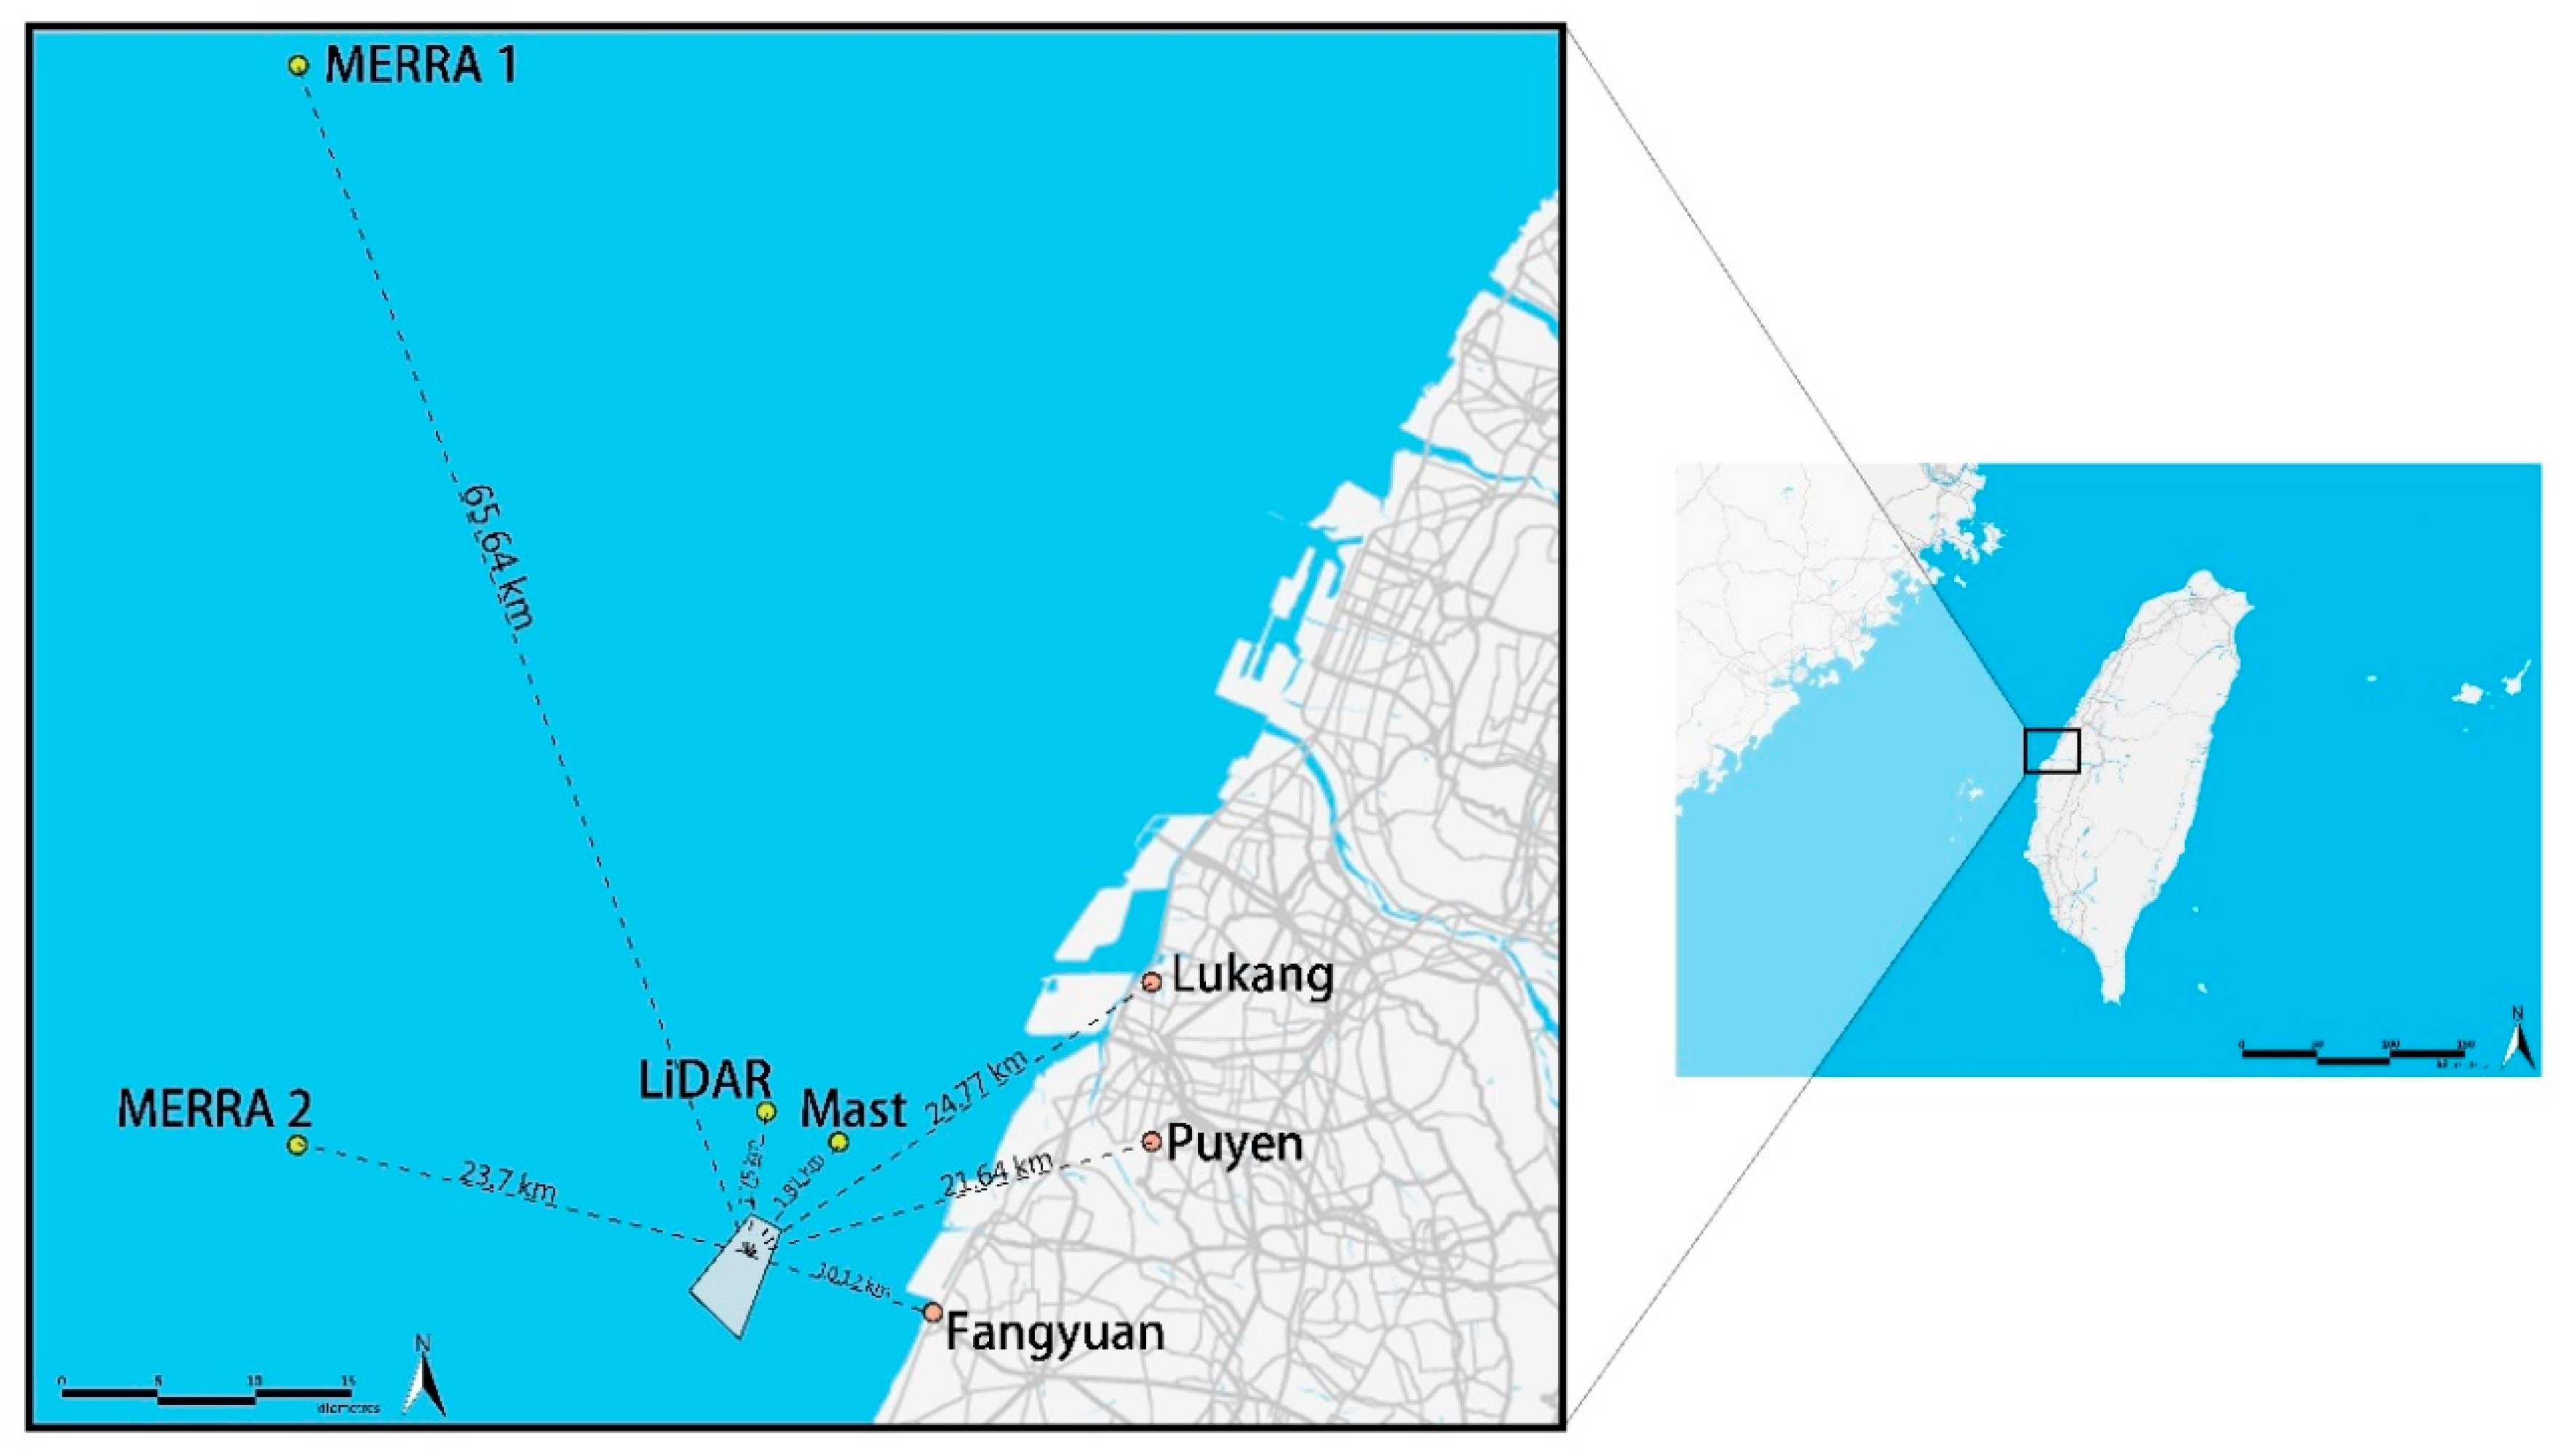



| Sea Name | Taiwan Strait |
|---|---|
| Centre latitude | 23.949 |
| Centre longitude | 120.223 |
| Area | 8 km2 |
| Depth range | 17 m–26 m |
| Distance from shore | 5.7 km |
| Distance from shore (computed from center) | 8 km |
| Specification | Value |
|---|---|
| Operating Wavelength | 1550 nm |
| Wind Speed Range | 0–90 m/s |
| Sensing Range | 30 to 150 m |
| Number of Range Gates | 3–6 |
| Range Gate Depth | ±20 m |
| Wind Speed Accuracy | ±0.5 m/s |
| Wind Direction Accuracy | ±1° |
| Relative Angular Accuracy | ±2° |
| Data Output Rate | 1 Hz |
| Data Source | Data Collection Period | Data Collection Heights (m) | |
|---|---|---|---|
| From | To | ||
| Floating LiDAR | 22 August 2014 | 5 February 2015 | 90 |
| Mast | 1 April 2016 | 31 March 2017 | 95 |
| MERRA | 5 February 2008 | 4 February 2018 | 10, 50, 62.5 |
| Properties | Categories | Parameters | Value |
|---|---|---|---|
| Terrain | Roughness | Roughness height | Read from grid gws file |
| Wind fields | Boundary and initial conditions | Height of boundary layer | 1000 m |
| Speed above boundary layer height | 15 m/s | ||
| Boundary condition at top | No-friction wall | ||
| Physical models | Potential temperature | Disregard temperature | |
| Air density | 1.225 | ||
| Turbulence model | Standard k-ε | ||
| Calculation parameters | Solvers | GCV | |
| Wind Resources | Wind resource map | Heights | 105 |
| Energy | IEC Classification * | Wind speeds range Ieff | IEC standards * |
| Probability of Exceedance (%) | z |
|---|---|
| 99 | 2.326 |
| 95 | 1.645 |
| 90 | 1.282 |
| 85 | 1.036 |
| 84 | 1.000 |
| 80 | 0.842 |
| 75 | 0.674 |
| 50 | 0 |
| 25 | 0.674 |
| 10 | 1.282 |
| 1 | 2.326 |
| Station | Measurement Height (m) | Year | Annual Average Wind Speed (m/s) | Annual Average Wind Direction (Degree) | Environment |
|---|---|---|---|---|---|
| Fangyuen | 12 | 2016 | 2.5 | 58 | Surrounded by low-rise buildings |
| 2017 | 2.5 | 62 | |||
| 2018 | 2.5 | 40 | |||
| Lukang | 17 | 2016 | 3.0 | 49 | Few buildings around, surrounded by undeveloped wetlands |
| 2017 | 2.9 | 27 | |||
| 2018 | 2.6 | 47 | |||
| Puyen | 15 | 2016 | 3.3 | 32 | Few buildings around, mostly surrounded by farmland |
| 2017 | 3.1 | 47 | |||
| 2018 | 3.0 | 38 |
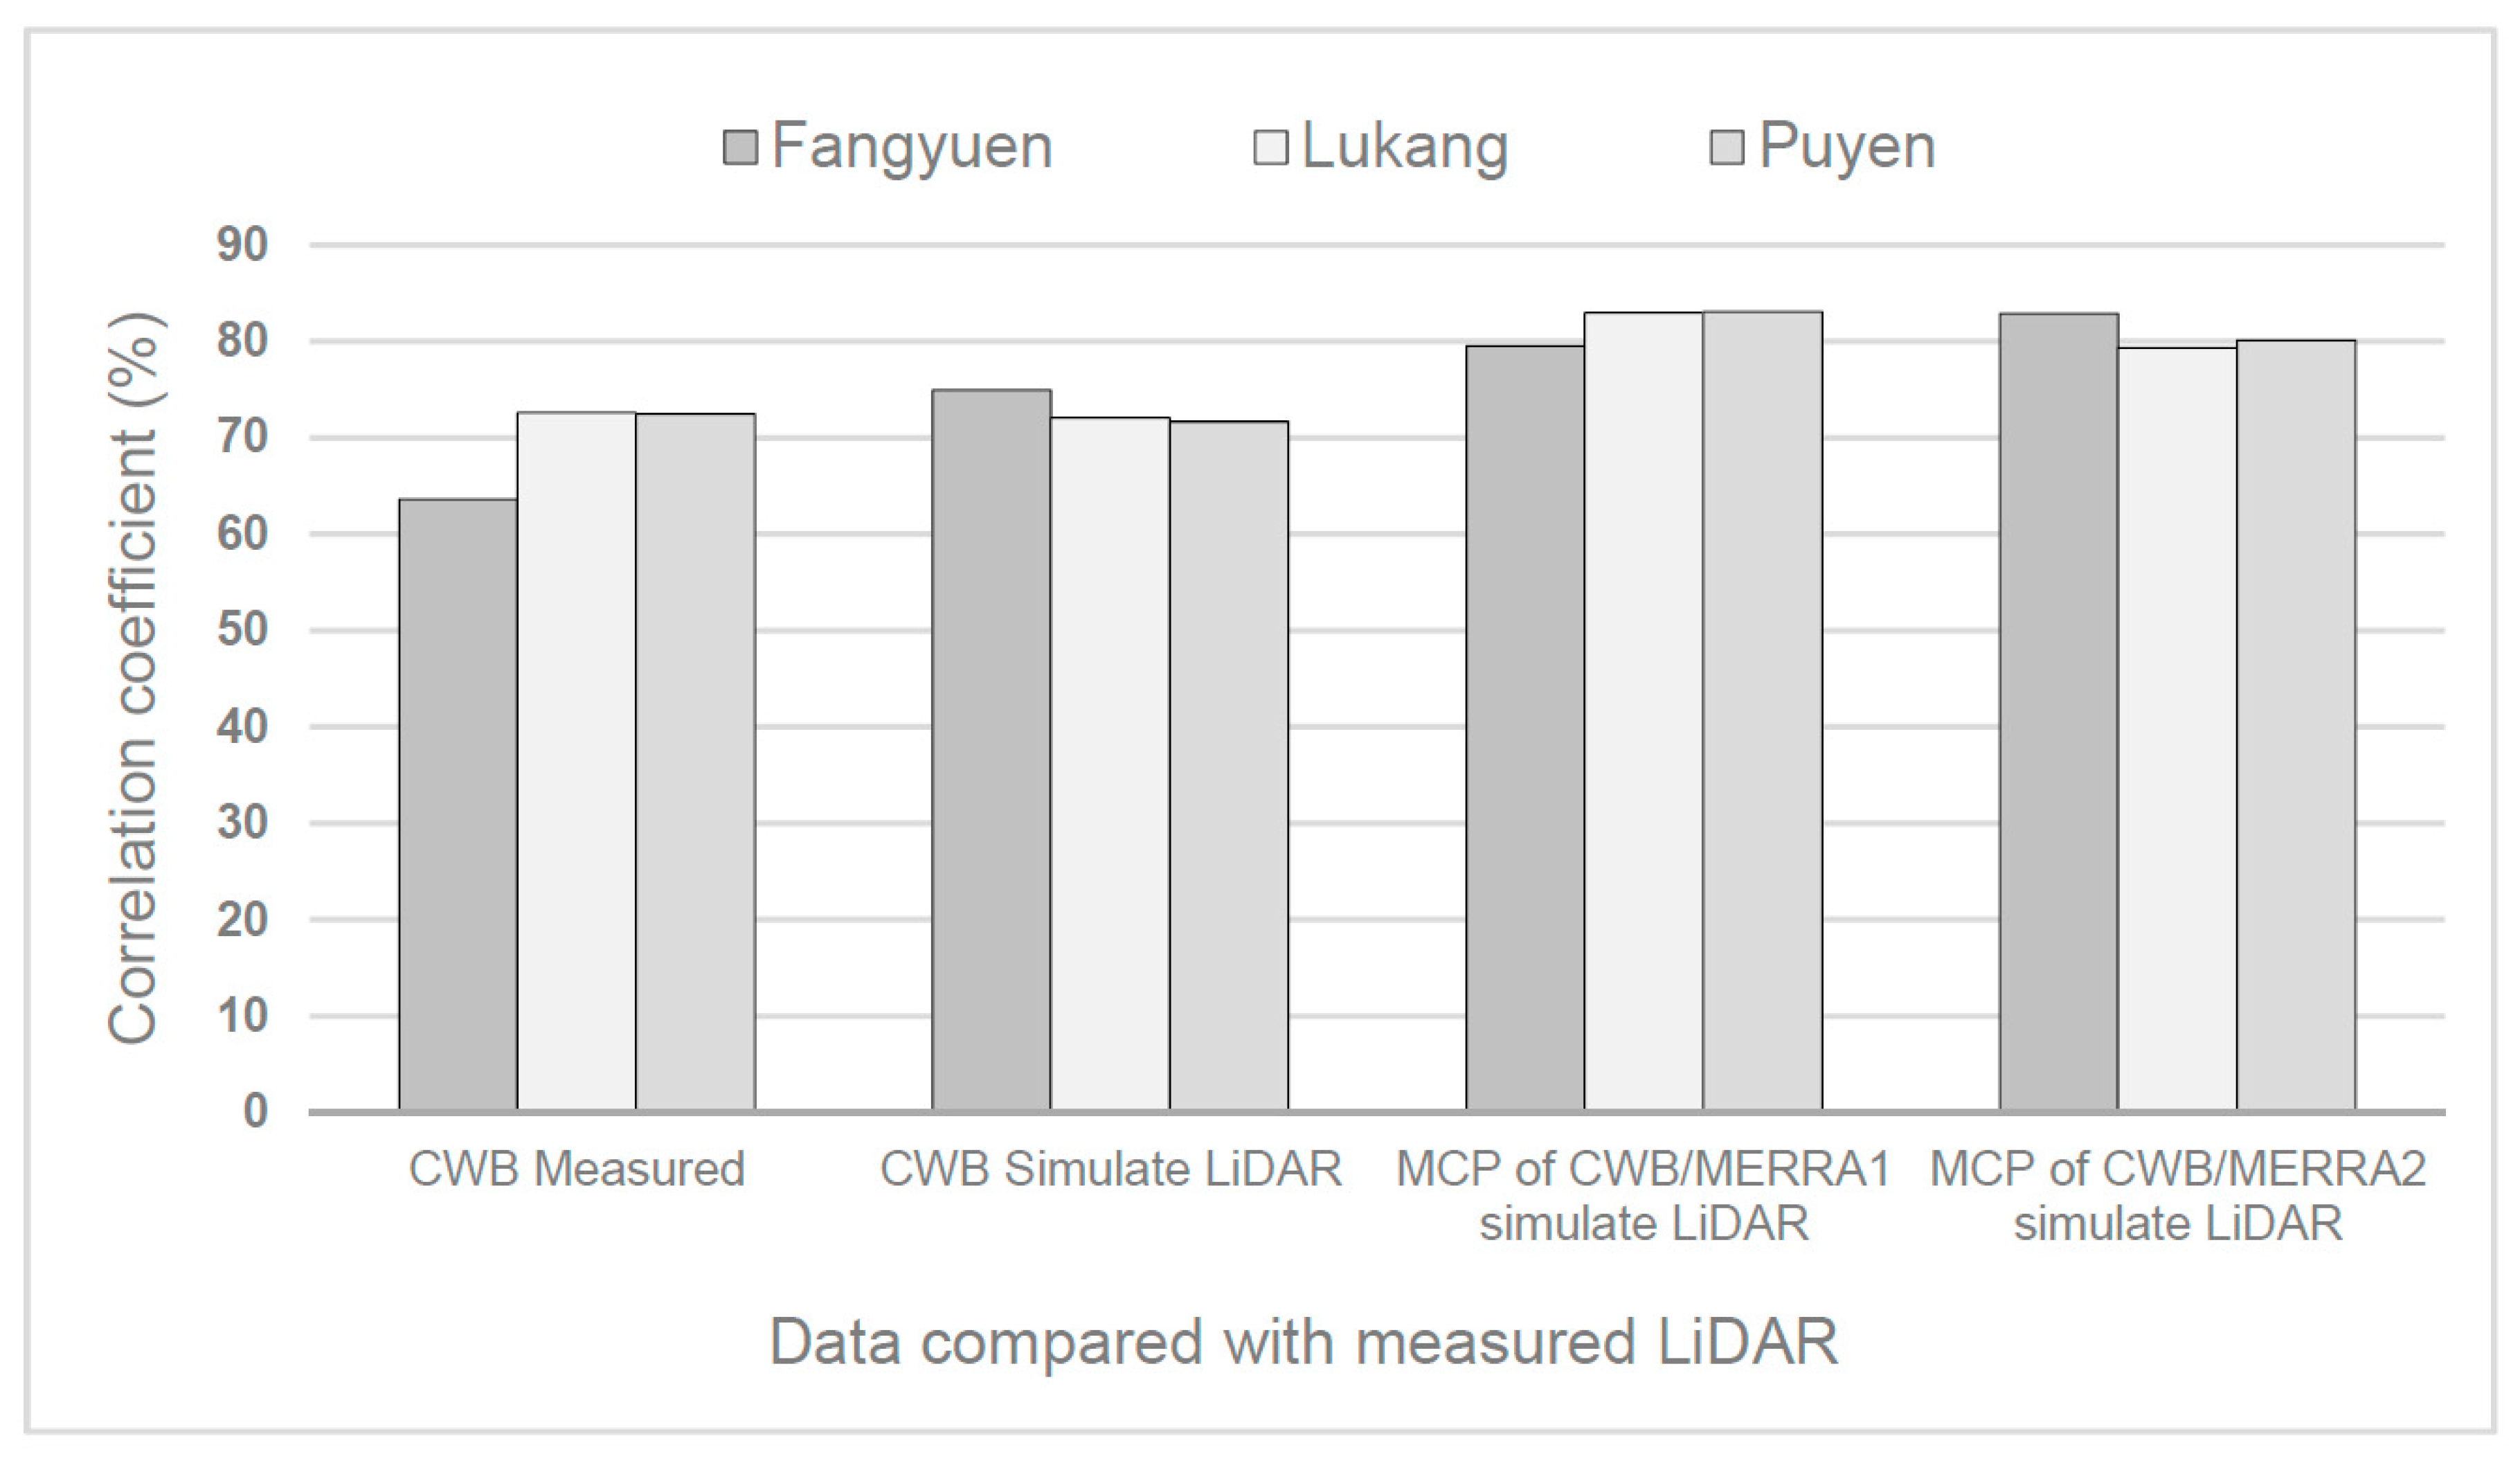
| CWB Stations | MERRA Locations | R2 (%) | RMSE (m/s) |
|---|---|---|---|
| Lukang | 1 | 83.0 | 4.8 |
| 2 | 79.4 | 5.7 | |
| Puyen | 1 | 83.1 | 4.4 |
| 2 | 80.2 | 8.2 |
| Turbine Number | Wind Speed (m/s) | Wind Speed Including Wake Losses (m/s) | Power Density (W/m2) | Gross AEP (MWh/y) | AEP with Wake Losses (MWh/y) | Wake Loss (%) | Full Load Hours (h/y) |
|---|---|---|---|---|---|---|---|
| 1 | 8.03 | 7.98 | 678.0 | 34,522.1 | 34,087.2 | 1.26 | 3588.1 |
| 2 | 8.02 | 7.87 | 677.7 | 34,485.8 | 33,258.8 | 3.56 | 3500.9 |
| 3 | 8.03 | 7.84 | 677.9 | 34,505.1 | 32,936.8 | 4.55 | 3467.0 |
| 4 | 8.03 | 7.87 | 678.5 | 34,540.3 | 33,132.1 | 4.08 | 3487.6 |
| 5 | 8.00 | 7.55 | 671.9 | 34,302.8 | 30,636.5 | 10.69 | 3224.9 |
| 6 | 7.99 | 7.54 | 669.5 | 34,235.0 | 30,445.9 | 11.07 | 3204.8 |
| 7 | 8.01 | 7.53 | 675.0 | 34,401.0 | 30,362.7 | 11.74 | 3196.1 |
| 8 | 8.02 | 7.60 | 676.3 | 34,473.3 | 30,856.0 | 10.49 | 3248.0 |
| 9 | 8.00 | 7.48 | 672.7 | 34,341.7 | 29,876.6 | 13.00 | 3144.9 |
| 10 | 8.02 | 7.47 | 675.5 | 34,429.9 | 29,853.7 | 13.29 | 3142.5 |
| All | - | - | - | 344,237.0 | 315,446.3 | - | - |
| Mean | 8.02 | 7.67 | 675.3 | - | - | 8.36 | 3320.5 |
| Turbine Number | Wind Speed (m/s) | Wind Speed Including Wake Losses (m/s) | Power Density (W/m2) | Gross AEP (MWh/y) | AEP with Wake Losses (MWh/y) | Wake Loss (%) | Full Load Hours (h/y) |
|---|---|---|---|---|---|---|---|
| 1 | 7.99 | 7.94 | 664.3 | 34,294.8 | 33,860.7 | 1.27 | 3564.3 |
| 2 | 7.98 | 7.83 | 664.0 | 34,257.3 | 33,001.2 | 3.67 | 3473.8 |
| 3 | 7.99 | 7.82 | 664.8 | 34,311.0 | 32,879.9 | 4.17 | 3461.0 |
| 4 | 7.98 | 7.80 | 664.2 | 34,276.3 | 32,679.0 | 4.66 | 3439.9 |
| 5 | 7.98 | 7.56 | 662.6 | 34,245.0 | 30,657.9 | 10.47 | 3227.1 |
| 6 | 7.97 | 7.49 | 661.2 | 34,171.4 | 30,135.4 | 11.81 | 3172.1 |
| 7 | 7.95 | 7.50 | 655.6 | 34,008.5 | 30,246.4 | 11.06 | 3183.8 |
| 8 | 7.97 | 7.43 | 661.7 | 34,200.1 | 29,623.7 | 13.38 | 3118.3 |
| 9 | 7.96 | 7.51 | 658.0 | 34,071.3 | 30,432.0 | 10.68 | 3203.4 |
| 10 | 7.96 | 7.44 | 658.9 | 34,112.6 | 29,651.2 | 13.08 | 3121.2 |
| All | - | - | - | 341,948.3 | 313,167.4 | - | - |
| Mean | 7.97 | 7.63 | 661.5 | - | - | 8.42 | 3296.5 |
| Sector | Wind Speed (m/s) | AEP with Wake Losses (MWh/y) | ||
|---|---|---|---|---|
| Floating LiDAR | Mast | Floating LiDAR | Mast | |
| 345°–15° | −0.05% | −0.05% | −0.09% | −0.09% |
| 15°–45° | −0.02% | −0.02% | −0.03% | −0.03% |
| 45°–75° | −0.02% | −0.02% | −0.09% | −0.08% |
| 75°–105° | −0.02% | −0.02% | −0.19% | −0.19% |
| 105°–135° | -0.01% | −0.01% | −0.04% | −0.04% |
| 135°–165° | 0.00% | −0.01% | −0.02% | −0.02% |
| 165°–195° | −0.07% | −0.07% | −0.14% | −0.14% |
| 195°–225° | −0.03% | −0.03% | −0.07% | −0.07% |
| 225°–255° | −0.03% | −0.03% | −0.08% | −0.08% |
| 255°–285° | −0.04% | −0.04% | −0.14% | −0.14% |
| 285°–315° | −0.01% | −0.01% | −0.04% | −0.04% |
| 315°–345° | −0.01% | −0.01% | −0.02% | −0.02% |
| Parameter | Uncertainty (%) | |
|---|---|---|
| Wind resource | Measurement | 2.04 |
| Tower effect | 0.5 | |
| Historical wind resource | 4 | |
| Future wind resource (10yrs) | 1.4 | |
| Long-term correlation | Inconstant | |
| Energy level | Wind flow model | 6 |
| Power curve | 6 | |
| Energy losses (wake effect) | Inconstant |
| Inconstant | ||
|---|---|---|
| Long-Term Correlation (%) | Energy Losses (%) | |
| Floating LiDAR | 1.61 | 8.36 |
| Mast | 4.05 | 8.42 |
© 2020 by the authors. Licensee MDPI, Basel, Switzerland. This article is an open access article distributed under the terms and conditions of the Creative Commons Attribution (CC BY) license (http://creativecommons.org/licenses/by/4.0/).
Share and Cite
Yue, C.-D.; Chiu, Y.-S.; Tu, C.-C.; Lin, T.-H. Evaluation of an Offshore Wind Farm by Using Data from the Weather Station, Floating LiDAR, Mast, and MERRA. Energies 2020, 13, 185. https://doi.org/10.3390/en13010185
Yue C-D, Chiu Y-S, Tu C-C, Lin T-H. Evaluation of an Offshore Wind Farm by Using Data from the Weather Station, Floating LiDAR, Mast, and MERRA. Energies. 2020; 13(1):185. https://doi.org/10.3390/en13010185
Chicago/Turabian StyleYue, Cheng-Dar, Yi-Shegn Chiu, Chien-Cheng Tu, and Ta-Hui Lin. 2020. "Evaluation of an Offshore Wind Farm by Using Data from the Weather Station, Floating LiDAR, Mast, and MERRA" Energies 13, no. 1: 185. https://doi.org/10.3390/en13010185
APA StyleYue, C.-D., Chiu, Y.-S., Tu, C.-C., & Lin, T.-H. (2020). Evaluation of an Offshore Wind Farm by Using Data from the Weather Station, Floating LiDAR, Mast, and MERRA. Energies, 13(1), 185. https://doi.org/10.3390/en13010185


