Article

Analysis of Influence of Ship Roll on Ship Power System with Renewable Energy

College of Automation, Harbin Engineering University, Harbin 150001, China
*
Author to whom correspondence should be addressed.
Energies 2020, 13(1), 1; https://doi.org/10.3390/en13010001
Submission received: 20 November 2019 / Revised: 13 December 2019 / Accepted: 16 December 2019 / Published: 18 December 2019

Abstract

:
Renewable energy ship was regarded as one of the ship energy technologies with a good prospect. In order to study the application of solar and wind energy on ships in the marine environment and the impact of ship rolling on the system, the feasibility of applying solar energy and wind energy to ships was analyzed, and the structural composition of ship power system incorporating renewable energy source was studied. The model of the ship power system integrated with renewable energy was built in PSCAD/EMTDC simulation software. The layout of wind power generation system and photovoltaic power generation system was given for the actual ship, and the ship parameters and specific parameters of each simulation module were determined. It can be seen that the rolling of ship will cause fluctuations in the grid-connected power of the photovoltaic power generation system and the wind power generation system from the comparison of the simulation curves. Finally, a simulation experiment is provided to prove the access of the battery can well suppress the grid-connected power fluctuation caused by the rolling of the ship, which has an important impact on the stability of the ship power system with renewable energy.

1. Introduction

With the gradual depletion of oil resources and the increasing global demand for oil, economists predict the global oil resources will be exhausted around 2050, leaving the energy problem needs to be solved. At the same time, it is urgent to develop green ships to cope with global warming in order to protect the environment [1]. Ecological ships, which introduce solar energy and wind energy as ship power energy, cannot only completely change this unfavorable situation but also bring significant economic benefits [2,3,4]. Ecological ship with renewable energy has better endurance and redundancy, less fuel consumption, less pollution, low noise and many other advantages compared with traditional ship, which is regarded as one of the promising ship energy technologies [5,6,7]. The degree of automation and electrification of modern ships has been continuously improved, and the stability of ship power system has increasingly become the guarantee for the normal navigation of ship and the safety of people on board [8,9,10]. Therefore, the key to ensuring the smooth development of green ships is how to improve the stability of ship power system incorporating renewable energy sources [11].
For the stability of renewable energy power generation system, there are the following related studies. In [12], the influence of wind speed disturbance on the dynamic stability of wind power generation system is studied, and a new control strategy is proposed for the variable-speed operation of wind turbines with permanent magnet synchronous generators. In addition, the influence of wind power fluctuation on the voltage stability of grid connected wind power under different wind speeds is studied in [13]. The research in [14,15], respectively, shows the impact of different light intensities on photovoltaic power generation systems and the impact of photovoltaic grid connection on the stability of the whole power system. For the ship power system, not only the renewable energy itself but also the ship rolling affect the stability of the output of the renewable energy power generation system. Ship rolling refers to the periodic reciprocating motion of the ship around its longitudinal axis under the action of wind and wave. A ship sailing on the sea will produce six degrees of freedom motion, in which the rolling motion has a large swing angle, and it has the greatest impact on the operation of the ship [16]. Especially for the ship integrated with renewable energy, rolling will affect the output of the renewable energy power generation system arranged on the ship and put the output of the system in a state of fluctuation.
The previous research [17,18,19] only realized the application and stability analysis of photovoltaic system in ship power system and established pv/diesel/ess hybrid power system, considering the use of flywheel energy storage to reduce the impact of ship rolling. In addition, the whole system was optimized to reduce the cost of the hybrid ship power system and greenhouse gas emissions. Therefore, on the basis of the original research, this paper uses the battery with lower price and studies the wind power generation system and photovoltaic power generation system at the same time. In addition, the container ship is chosen as the research object, and the layout of new energy power generation system on this ship is proposed. Photovoltaic panels are laid by installing a photovoltaic panel bracket at the bow and stern of the ship, and a permanent magnet synchronous wind generator with a rated power of 10 kW is installed at the center of the ship, simultaneously. Then, PSCAD/EMTDC simulation software is used for simulation analysis of ship power system, photovoltaic power generation system, wind power generation system and energy storage system. Through the renewable energy experimental platform, the influence of photovoltaic power generation system and wind power generation system on the stability of ship power system after accessing the ship power system and the influence of ship roll on the stability of ship power system are studied. It is verified that the battery can suppress the fluctuation of system output caused by ship rolling.
The rest of the paper is organized as follows: Section 2 briefly describes the system configuration and establishes the mathematical model of the renewable energy ship power system. Section 3 presents a control strategy of ship rolling. Section 4 analyzes the influence of ship rolling on the stability of the renewable energy ship power system through simulations. Section 5 draws conclusions.

2. Hybrid Power Ship Modeling and Analysis

Wind power generation and photovoltaic power generation are applied on container ship. A wind generator is built in the center of the ship deck and photovoltaic panels are laid on the photovoltaic panel bracket. Diesel engine is the main power source of ship power system; wind power generator and photovoltaic power system are finally integrated into the ship grid.

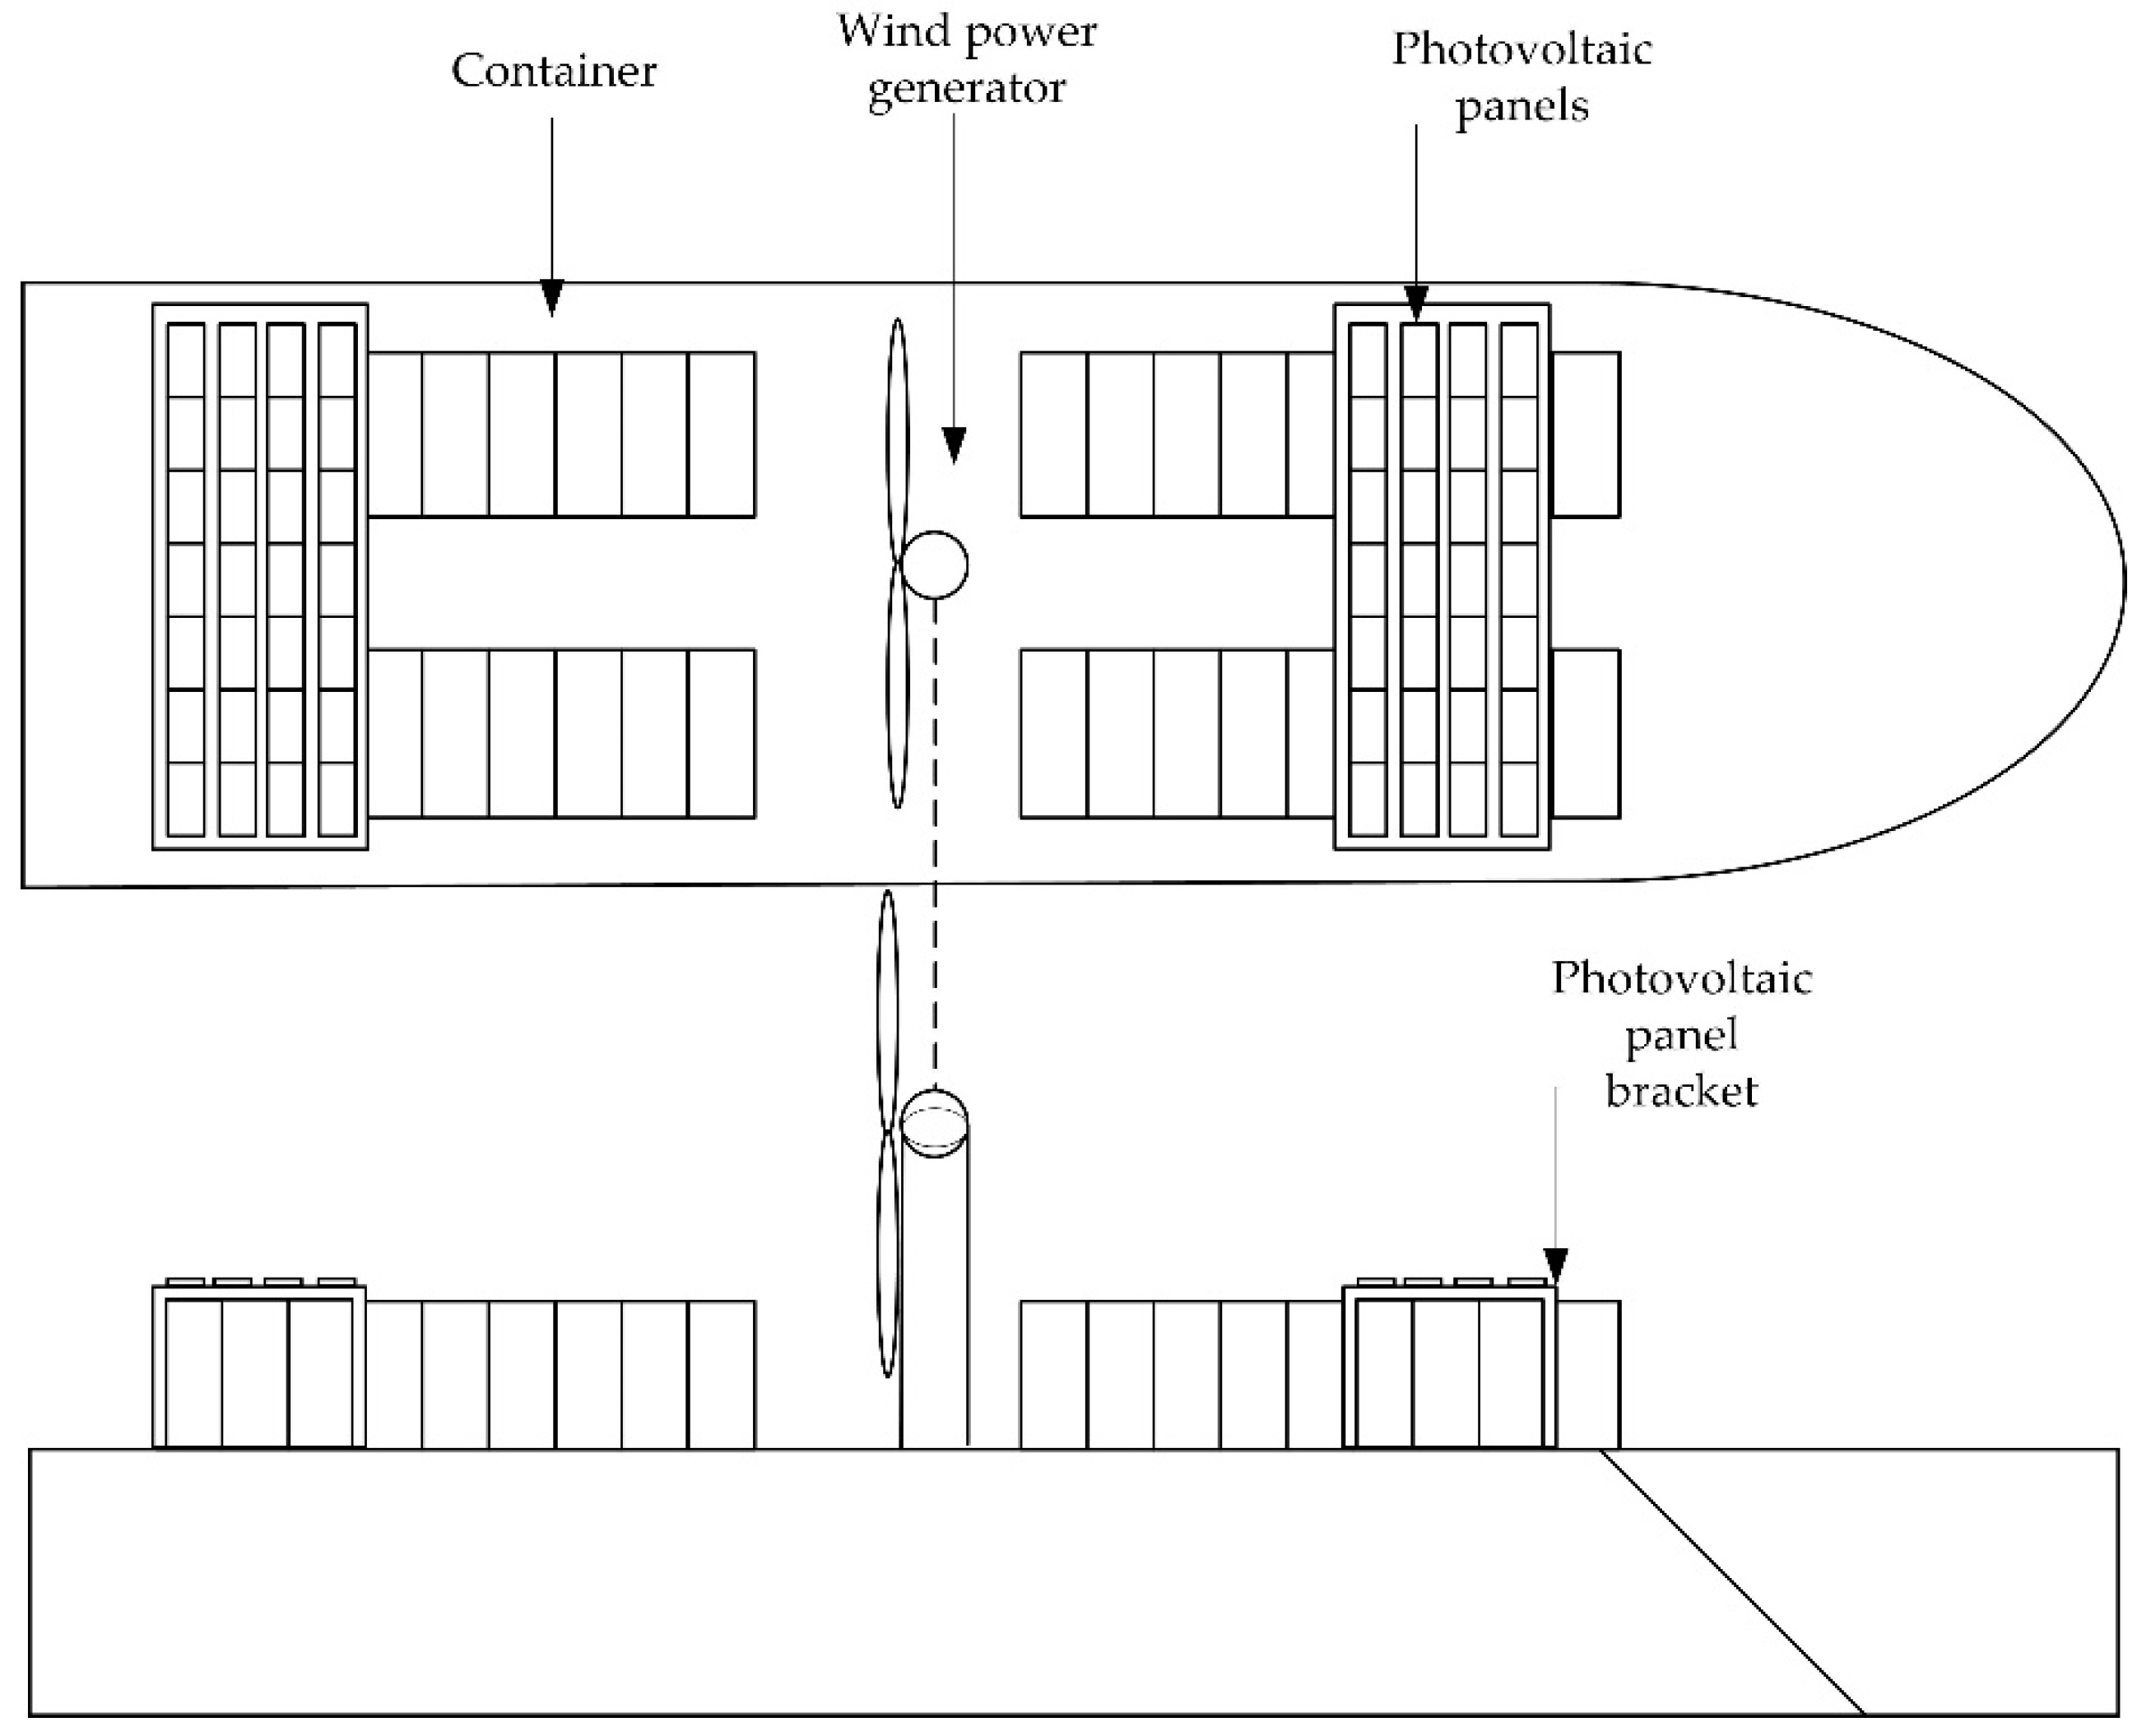
2.1. System Configuration

In this paper, a container ship is chosen. The main parameters of the ship are shown in Table 1, and the hull view is shown in Figure 1.
Taking the parameters of YGE235 series photovoltaic panels of Yingli Green Energy Holding Co., Ltd. as the simulation parameters of this paper. Photovoltaic modules test conditions: irradiance is 1000 W/m2, battery temperature is 25 °C, air mass (AM) is 1.5. The electrical performance parameters of this series of photovoltaic modules under standard test conditions are shown in Table 2.
The selected wind turbine is a three-phase permanent magnet synchronous generator with rated output power of 10 kW. The main parameters are shown in Table 3.
Batteries: lead-acid batteries are used as energy storage batteries. There are 16 batteries whose terminal voltage is 12 V and capacity is 250 Ah.
The schematic diagram of photovoltaic panels and wind turbines on the ship is shown in Figure 1. The installation of photovoltaic panel bracket in two areas of the bow and stern can make the ship have enough large area to lay photovoltaic panels, and photovoltaic panels are laid on the photovoltaic panel bracket. The bracket can be moved horizontally back and forth so as not to affect the loading and unloading of containers while loading or unloading. The wind turbine is located in the center of the ship, so it can minimize the shadow of wind turbine tower and wind turbine blade on the photovoltaic panel, regardless of the ship’s course. The advantage of the arrangement is that it minimizes the influence of wind turbines and towers on the stability of the ship.
The area of each photovoltaic panel bracket is about 200 m2, and the total is about 400 m2. The number of photovoltaic panels laid in each region is about 110, and the maximum output power of photovoltaic panels in each region is about 25 kW. The photovoltaic power generation systems in the two regions are respectively integrated into the ship power system, and the total grid-connected power of the two photovoltaic systems is about 50 kW.
Hybrid energy system integrated with wind, solar, diesel and energy storage belongs to the direct current (AC)/alternating current (DC) hybrid system, in which the grid-connected operation of wind turbines needs to decouple the frequency relationship between the power grid and the generator. There is a DC access point, so the system structure needs to consider the following points: Adopt DC bus structure—the output of the wind turbine only needs to be connected with the DC bus through the AC/DC converter, which has a simple structure and low reliability of power supply. Adopt AC bus structure—the wind turbine set needs to be connected to the AC bus through the AC-DC-AC link, and other DC sources also need to be connected to the AC bus through the DC/AC converter, which has a complex structure and high power supply reliability [20,21]. After comprehensive consideration, DC bus structure is proposed to be adopted, as shown in Figure 2.

2.2. Component Modeling of Hybrid Ship Power System

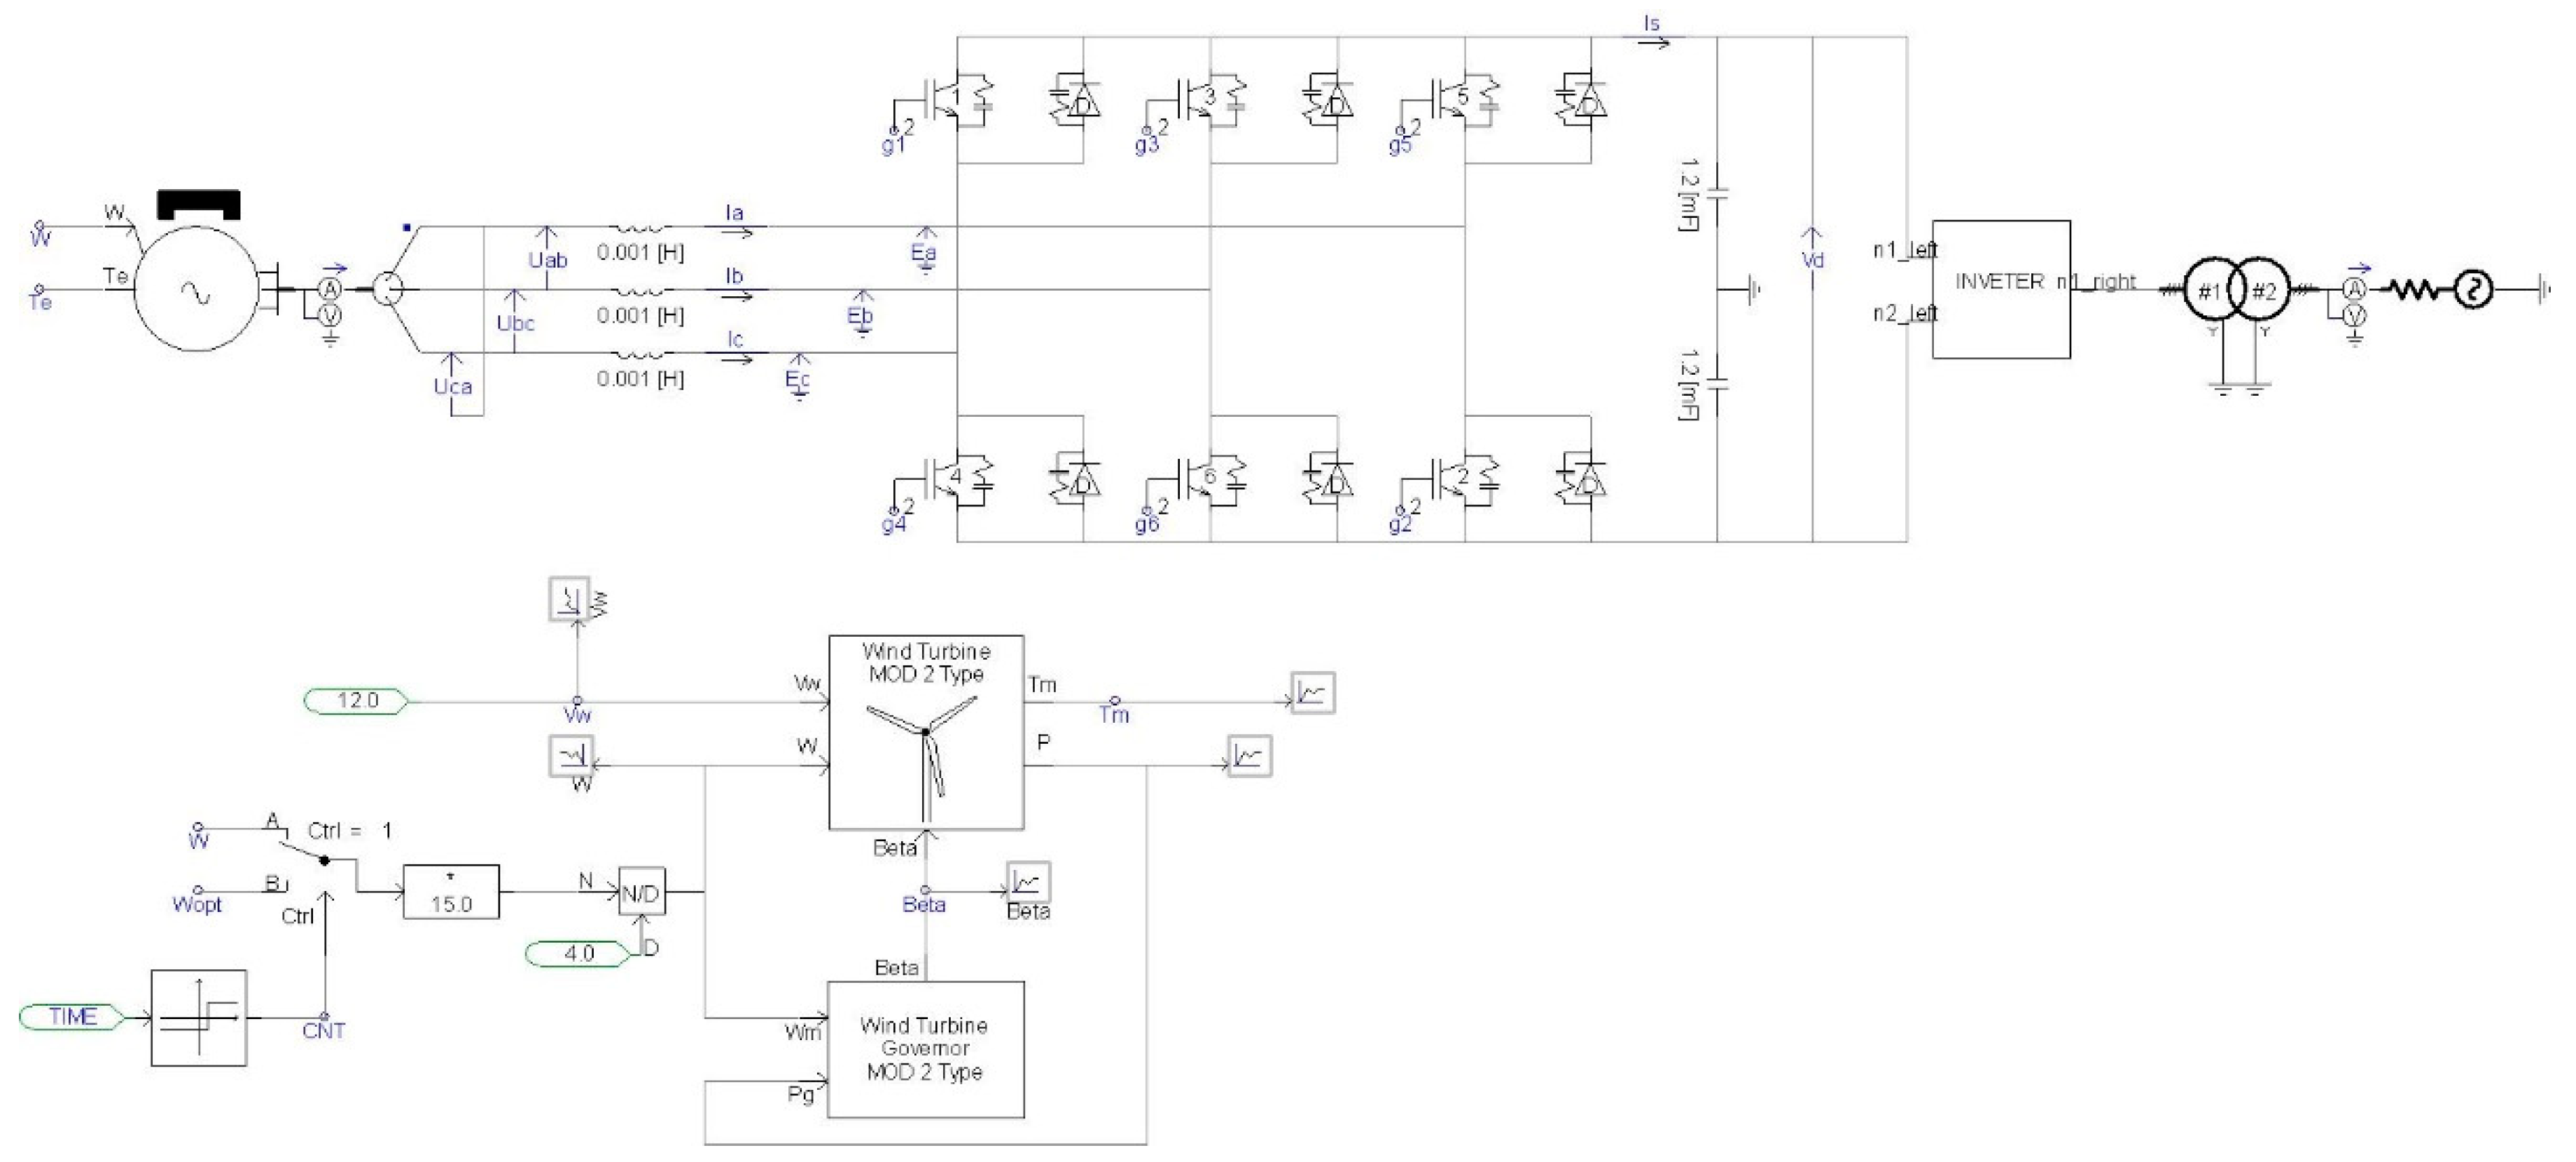
2.2.1. Wind Power Generation System

The wind turbine drives the permanent magnet synchronous wind generator to rotate through the rotating shaft and the gearbox. The AC generated by the generator becomes DC after passing through the uncontrollable rectifier circuit and then becomes AC through the inverter circuit after passing through the capacitor voltage regulation and then into the ship power system [22]. The topological structure of wind turbine generator set, rectifier and inverter circuit is shown in Figure 3.
The original dynamic model of permanent magnet synchronous generator is very complex. We usually need to simplify by coordinate transformation in the theoretical research. After simplification, it leads to the following:
T e = 3 2 p i s q [ ψ f + ( L q L d ) i s d ]
where T e is the electromagnetic torque of generator, p is the number of pole pairs, ψ f is the flux of the rotor, L d and L q are self-induction of stator coil of direct axis and quadrature axis, respectively; i s d and i s q are the stator current of direct axis and quadrature axis, respectively.
The wind turbine is a non-salient pole permanent magnet synchronous wind power generator with uniform air gap. The inductance on d-axis is the same as that on q-axis, that is, L q = L d = L . The electromagnetic torque of Equation (1) can be further simplified as:
T e = 1.5 p ψ f i s q
It is assumed that Equation (1) contains two parts: One part is the torque component of stator axis current and the permanent magnet torque generated by the flux linkage of permanent magnet itself, that is T e 1 ; the other part is the reluctance torque T e 2 generated by the excitation component and torque component of the stator current generated by the salient pole effect. The torque of these two parts is proportional to the stator current i s q , so in fact, the generator’s electromagnetic torque is only controlled by the stator current component i s q .
The blades convert the wind energy into mechanical energy when the wind blows and then drives the wind turbine to rotate through the transmission mechanism. The permanent magnet synchronous wind generator converts the mechanical energy of the impeller rotation into electrical energy. The process of wind turbine capturing wind energy involves complicated aerodynamic knowledge, which is analyzed in detail by leaf element theory. Since it can hardly be realized in engineering application, the approximate method is usually used to study the aerodynamic characteristics of wind turbines [23].
The power generated by the wind turbine can be described by the following equation:
P = 1 2 C P A ρ v 3
where ν is the wind speed, ρ is the gas density, A is the area swept by the blade rotation, C p is the wind energy utilization factor. This value can be used as a function of the pitch angle of the blade θ and the tip speed ratio λ under conditions where the wind turbine is constant:
λ = ω M R v
where ω M is the rotor angular velocity, R is the radius of area swept by the blade.
According to the relationship between torque and power, the torque of the wind turbine can be described as follows:
T M = P ω M = 1 2 C P ( λ , θ ) ρ π R 5 ω M 2 λ 3
The relationship between wind energy utilization coefficient C p and θ can be approximately described as:
C P = ( 0.44 0.0167 θ ) sin π ( λ 2 ) 13 0.3 θ 0.00184 ( λ 2 ) θ

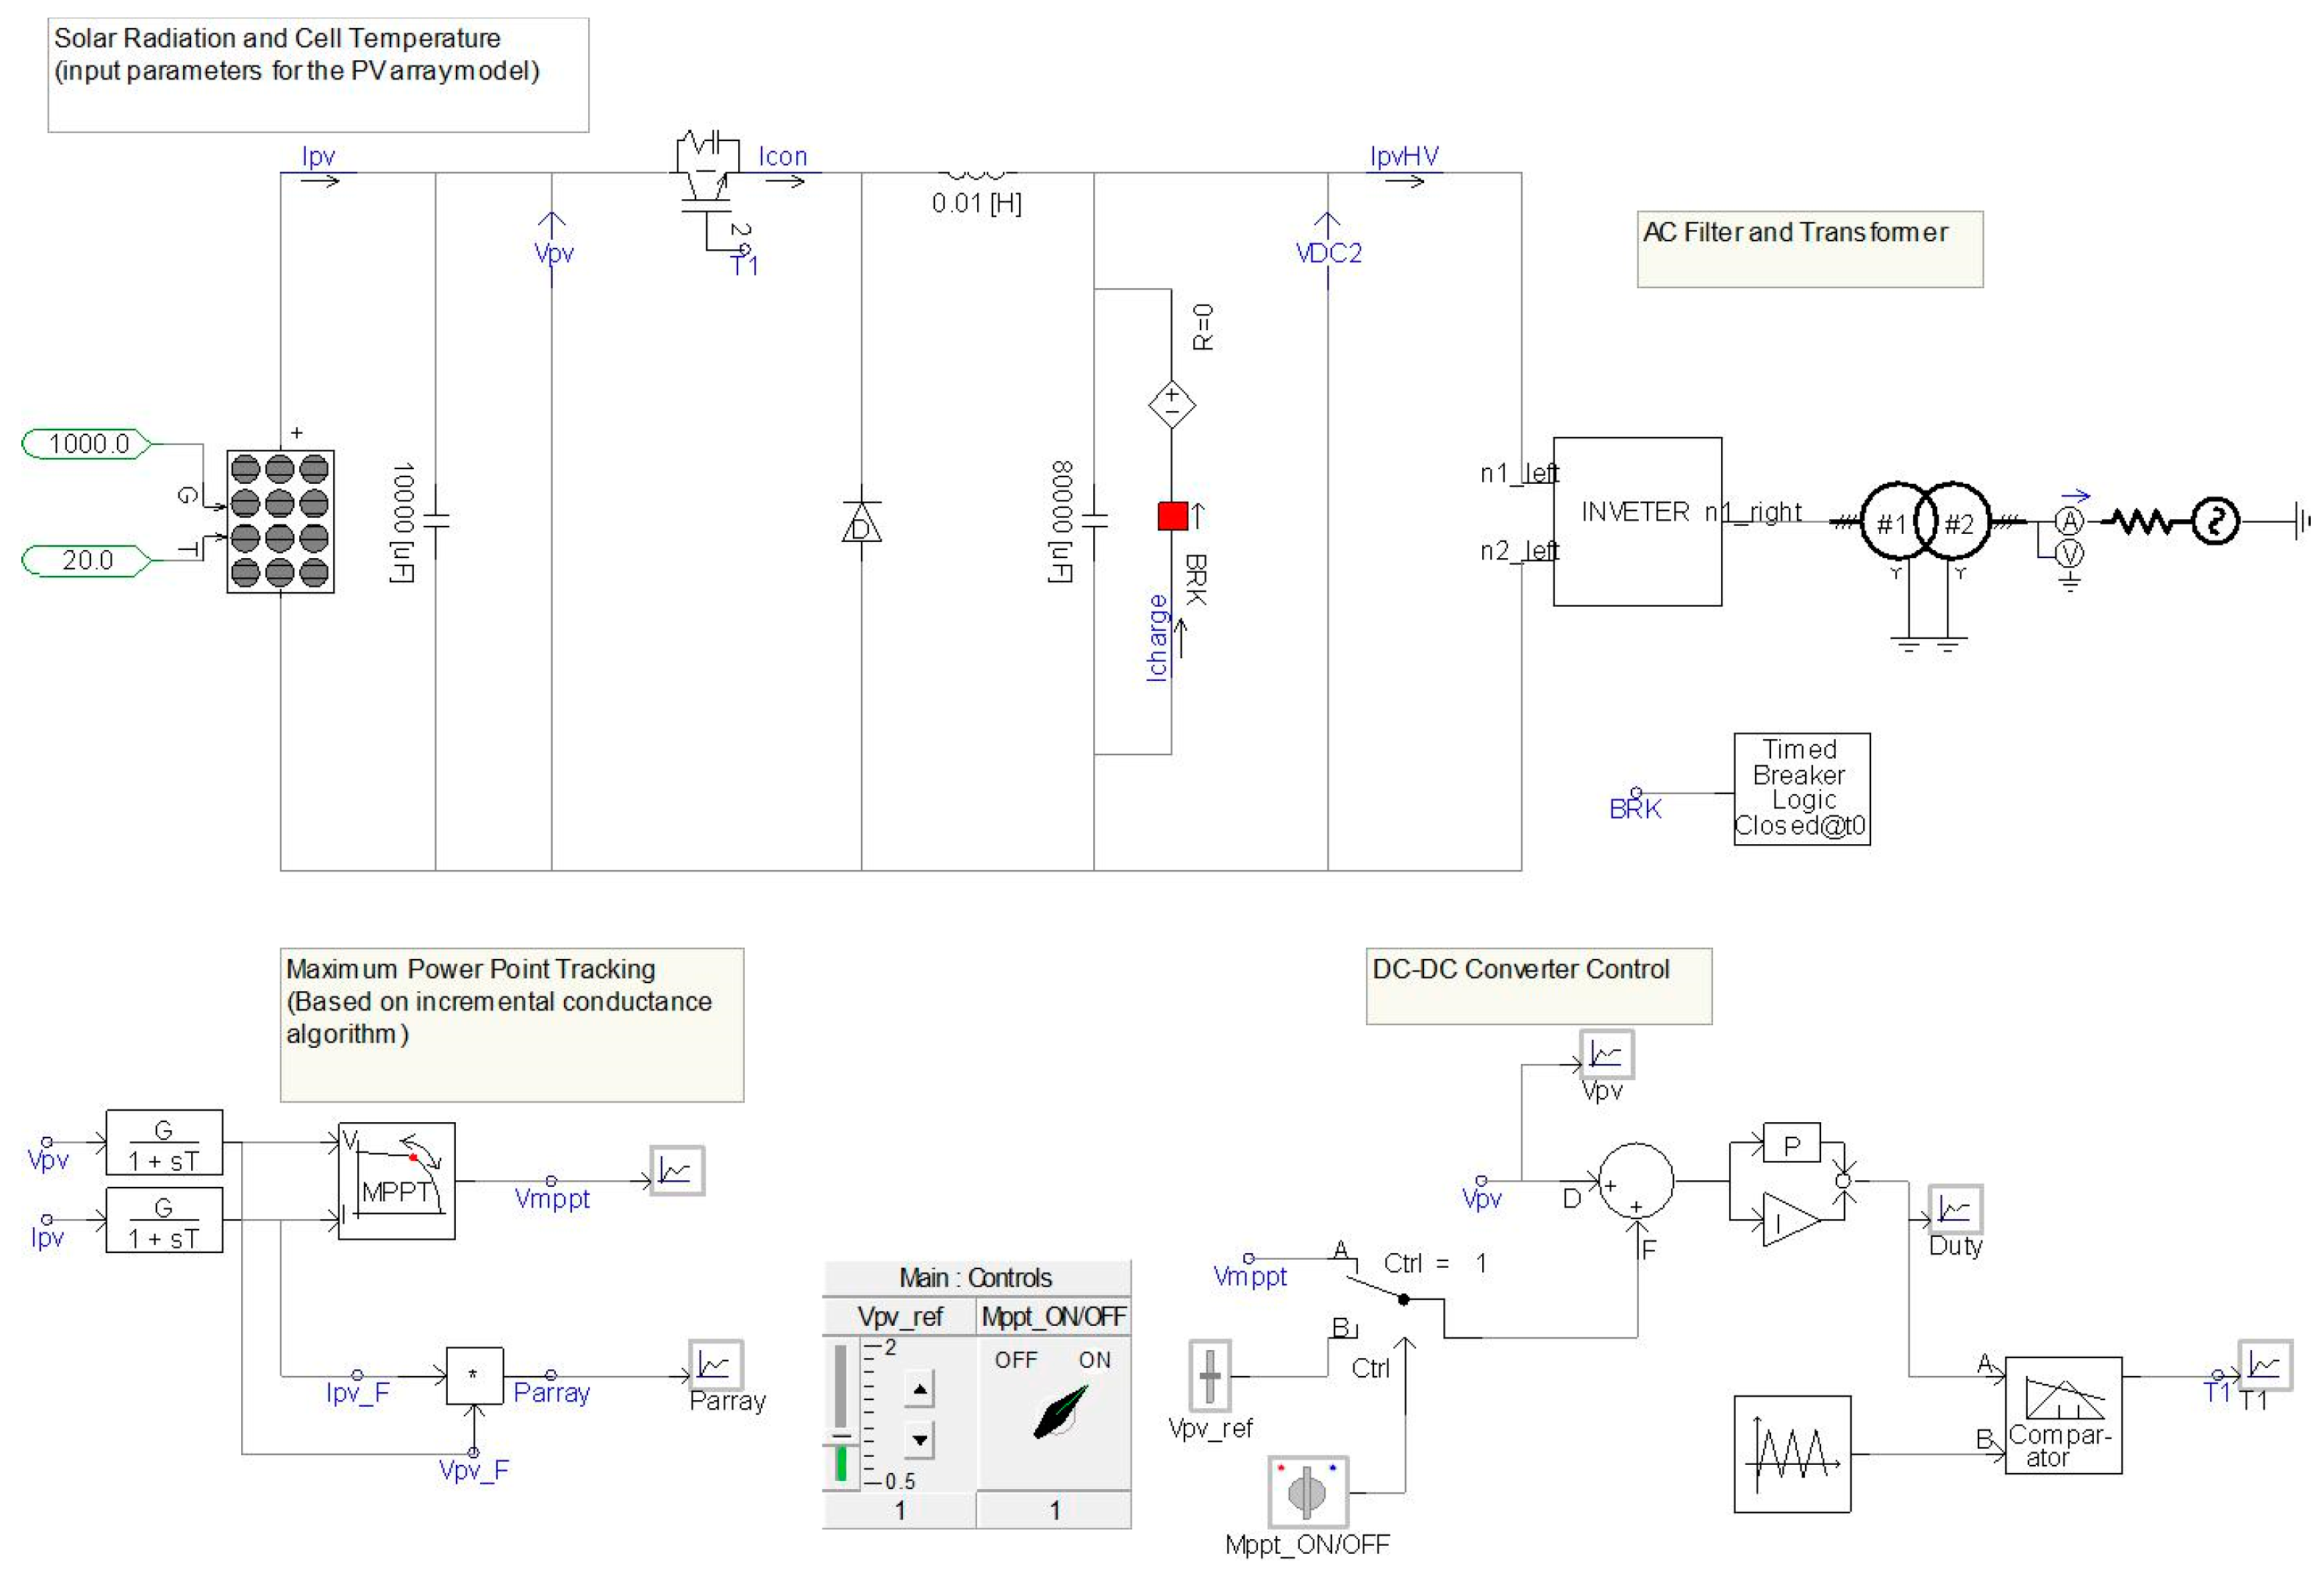
2.2.2. Photovoltaic Power Generation System

In this paper, the photovoltaic system is mainly composed of four parts, including solar cell module, inverter system, AC grid-connected system and control system. Based on the photoelectric effect of semiconductors, photovoltaic panels converting solar energy into electrical energy, photovoltaic panels are similar to constant flow source at this time. The DC output from the solar panel achieves maximum power output through maximum power tracking control, maximizing the utilization of solar energy. The DC power is converted into stable AC after being inverted, which can be incorporated into the ship power system.
In Figure 4, I p h is the photocurrent. It is proportional to the illumination intensity received by photovoltaic panels and the area of photovoltaic modules; I D is the dark current of the photovoltaic cell, which describes the sum of the diffusion currents flowing through the P-N junction inside the photovoltaic panel under a certain temperature condition; it indicates the leakage current flowing through the P-N junction when the voltage is applied to the photovoltaic panel when there is no light irradiation condition; I L is the current flowing through the load; U o c is the open circuit voltage of the photovoltaic panel, which is proportional to the logarithm of the illumination intensity and inversely proportional to the ambient temperature at which the photovoltaic panel is located and has no relationship with the area of the photovoltaic panel; R l is the load resistance value; R s is the equivalent internal resistance inside the battery, which is usually lower than 1 [24,25,26]. It is usually composed of the resistance carried by the material itself, the transverse resistance of the PN junction diffusion layer, the resistance carried by the extraction electrode, and the non-contact resistance of the electrode and the silicon surface; R s h is the equivalent bypass resistance of the photovoltaic panel, and the resistance value is relatively high, generally several thousand ohms. Both R s and R s h are inherent resistance to photovoltaic panels. From the above definitions, the equations for current and voltage in the circuit shown above can be listed:
I L = I p h I D I s h
I D = I 0 ( e x p q U D A k T 1 )
I L = I p h I D I s h = I p h I 0 ( e x p q U D A k T 1 ) U D R s h
I s c = I 0 ( e x p q U o c A k T 1 )
U o c = A k T q ln ( I s h I 0 + 1 )
where I D is the reverse saturation current, flowing through the equivalent diode P-N junction inside the photovoltaic panel, which is related to the material itself, and reflects the strength of the composite ability of the material apply to photogenerated carriers. Generally, it is considered as a fixed constant, which is not affected by the illumination intensity. I S C is the short-circuit current of the photovoltaic panel; U D is the terminal voltage of the equivalent diode, q is the electron charge, q = 1.6 × 10 19 C , k is the Boltzmann constant, k = 0.86 × 10 4 e V / K , T is the absolute temperature of the environment in which the battery is located and A is the curve constant of the P-N junction [27,28].
Under low light conditions, due to I p h I 0 , U o c = A k T q I p h I 0 ; under strong light conditions, due to I p h I 0 , U o c = A k T q ln I p h I 0 .
It can be seen that the open circuit voltage U o c of the silicon-based photovoltaic panel is proportional to the illumination intensity under the condition of relatively weak illumination intensity; and U o c has a logarithmic relationship with the illumination intensity under the condition of strong illumination intensity. Ideally, assume that R s 0 , R s h 0 , the mathematical model of the photovoltaic cells at this time is as follows:
I L = I p h I D U D R s h I p h I D
P = U L I L = U L I p h U L I 0 ( exp q U D A k T 1 )
where U L is the terminal voltage of photovoltaic cells, P is the output power of photovoltaic cells.
According to the detailed analysis of the practical model of photovoltaic system, the corresponding model is established in the PSCAD/EMTDC simulation analysis software. A custom model is built in the PSCAD software, the illumination intensity and temperature are applied to the input of the model, the load current is applied to the output of the model, and the performance parameters under the standard conditions are applied to the parameters of the model: Write the characteristic equations of photovoltaic panels, and complete the establishment of the photovoltaic cell simulation model in the custom model.
In this paper, assume that the working temperature of the photovoltaic panel is 20 °C. The function of the parallel capacitor is to stabilize the DC bus voltage. The circuit breaker in parallel with the capacitor charges the capacitor when the photovoltaic system starts to work, and the charging voltage is usually 0.5 V, and the charging time is 0.5 s. T_1 switch tube is used to complete MPPT function to achieve the maximum power point tracking. Figure 5 shows the simulation model of photovoltaic system.

2.2.3. Battery System

Both photovoltaic power generation system and wind power generation system have intermittency and instability depending on the environment, which is aggravated by the ship roll, so the energy storage system becomes the stabilizer to ensure the grid-connected operation of photovoltaic power generation system and wind power generation system.
Energy storage technology can be roughly divided into physical energy storage, electromagnetic energy storage, phase change energy storage and electrochemical energy storage. Currently, the most popular energy storage methods are battery energy storage system (BESS), superconducting magnetic energy storage (SMES), electric double layer capacitor (EDLC) and flywheel energy storage system (FESS) [29]. Battery energy storage achieves charge and discharge mainly utilizing the chemical reaction between the electrode and electrolyte inside the battery, which is electrochemical energy storage. It can be divided into lead-acid battery, lithium battery and other types according to the different electrode and electrolyte. Compared with other energy storage methods, battery energy storage technology is the most mature, which has the characteristics of low cost, reliable operation and large capacity storage; therefore, battery energy storage is adopted in this paper. At present, there are many methods for battery modeling, the most common model is still the one proposed by Shepherd’s in 1965 in terms of practical application [30]. The equivalent circuit of the Sheffield model is shown in Figure 6.
The equation of battery terminal voltage is:
U = E s t + A e [ B ( 1 s o c ) ] C ( 1 s o c ) K I ( s o c ) I R
where E S T is the initial discharge voltage of the battery, s o c = Q a / Q , Q a is the remaining capacity of the battery, Q is total capacity of the battery. A e [ B ( 1 s o c ) ] is applied to compensate the voltage drop during the initial discharge; C ( 1 s o c ) is the correction introduced by the no-load voltage change with the electrolyte concentration; K I ( s o c ) is the voltage drop caused by electrode passage; I R is the loss of ohm voltage.
Based on Shepherd model, the improved model with s o c as the state variable as follows:
E = E 0 K Q / ( Q i t ) + A e ( B i t )
E 0 = E F u l l + K + R i A
E b a t = E R i
where E is the open circuit voltage, E 0 is the battery voltage, E b a t is the terminal voltage of battery, Q is the battery capacity, R is the internal resistance of battery, E n o m is the nominal voltage, Q n o m is the nominal capacity, η is the battery efficiency, i t = i d t represent the capacity of the battery to actually charge or discharge, A = E F u l l E E x p is exponential amplitude, B = 3 Q E x p is the reciprocal of the time constant of the exponential region, K = E F u l l E n o m + A ( e B Q n o m 1 ) ( Q Q n o m ) Q n o m is the polarization voltage [31].
From the mathematical model, we need to determine the current capacity of battery. Since the remaining power is not easily obtained by direct measurement, estimating the remaining of the battery is the primary task of battery modeling. There are many ways to estimate this; the ampere integral method is employed in this paper:
S O C t = S O C 0 1 Q 0 t η I ( τ ) d τ
where S O C t is the current residual capacity of the battery, S O C 0 is the rated capacity, η is the battery charging and discharging efficiency, I ( τ ) is the battery discharge current.
Using the integral method to estimate the remaining capacity of the battery, the difficulty lies in the determination of the initial capacity of the battery and the accurate measurement of the charge and discharge current. The reason why the integral method is always used is that it is easy to implement, but it has some defects, such as not considering the influence of ambient temperature, battery aging, battery charge-discharge rate, self-discharge loss and so on. If a more accurate model estimate is needed, the above model needs to be modified. The original equation can be corrected by introducing the Peukert equation.
The battery simulation model is customized in the PSCAD simulation software because it is not provided in the PSCAD software library. The terminal voltage of the battery is not constant during the charging and discharging process, it changes slowly with the charging and discharging process. When the remaining capacity of the battery is relatively low, the terminal voltage of the battery will drop rapidly and cannot work normally; when the battery is charged to a certain level, its terminal voltage rises very slowly if it continues to charge. Due to the terminal voltage of battery always changing, the battery usually needs to get a stable output voltage through the DC/DC converter before it is connected to the system. In addition, the battery also has a rate capacity effect, and the effective capacity of the battery is related to the load. The larger the discharge current of the battery, the smaller the effective capacity [32,33]. While the battery keeps on discharging with a large current for a period of time and then continues discharging with a small current, the battery terminal voltage may gradually increase with the discharging; this phenomenon is known as the recovery effect. The recovery effect can increase the battery capacity.
The battery module has two inputs and two outputs. The state of SOC is estimated after the charge, and discharge current is integrated or differentiated. The current charge or discharge state is maintained when Reset is 0, and the battery is initialized when Reset is 1. Ebat outputs the current voltage of the battery to the controlled voltage source to simulate the change of the battery voltage. SOC outputs the current charge state of the battery as the basis for the battery charging mode switching. Figure 7 shows the battery simulation model. Ibatt is the charge/discharge current of the battery, which is limited by the limiting unit. When the capacity of the battery is lower than the set value, the battery will absorb power from the DC power supply, and the charging current is reversed. The internal resistance of the battery is 0.0023 Ω; the terminal voltage of the controlled voltage source is the actual terminal voltage of the battery.

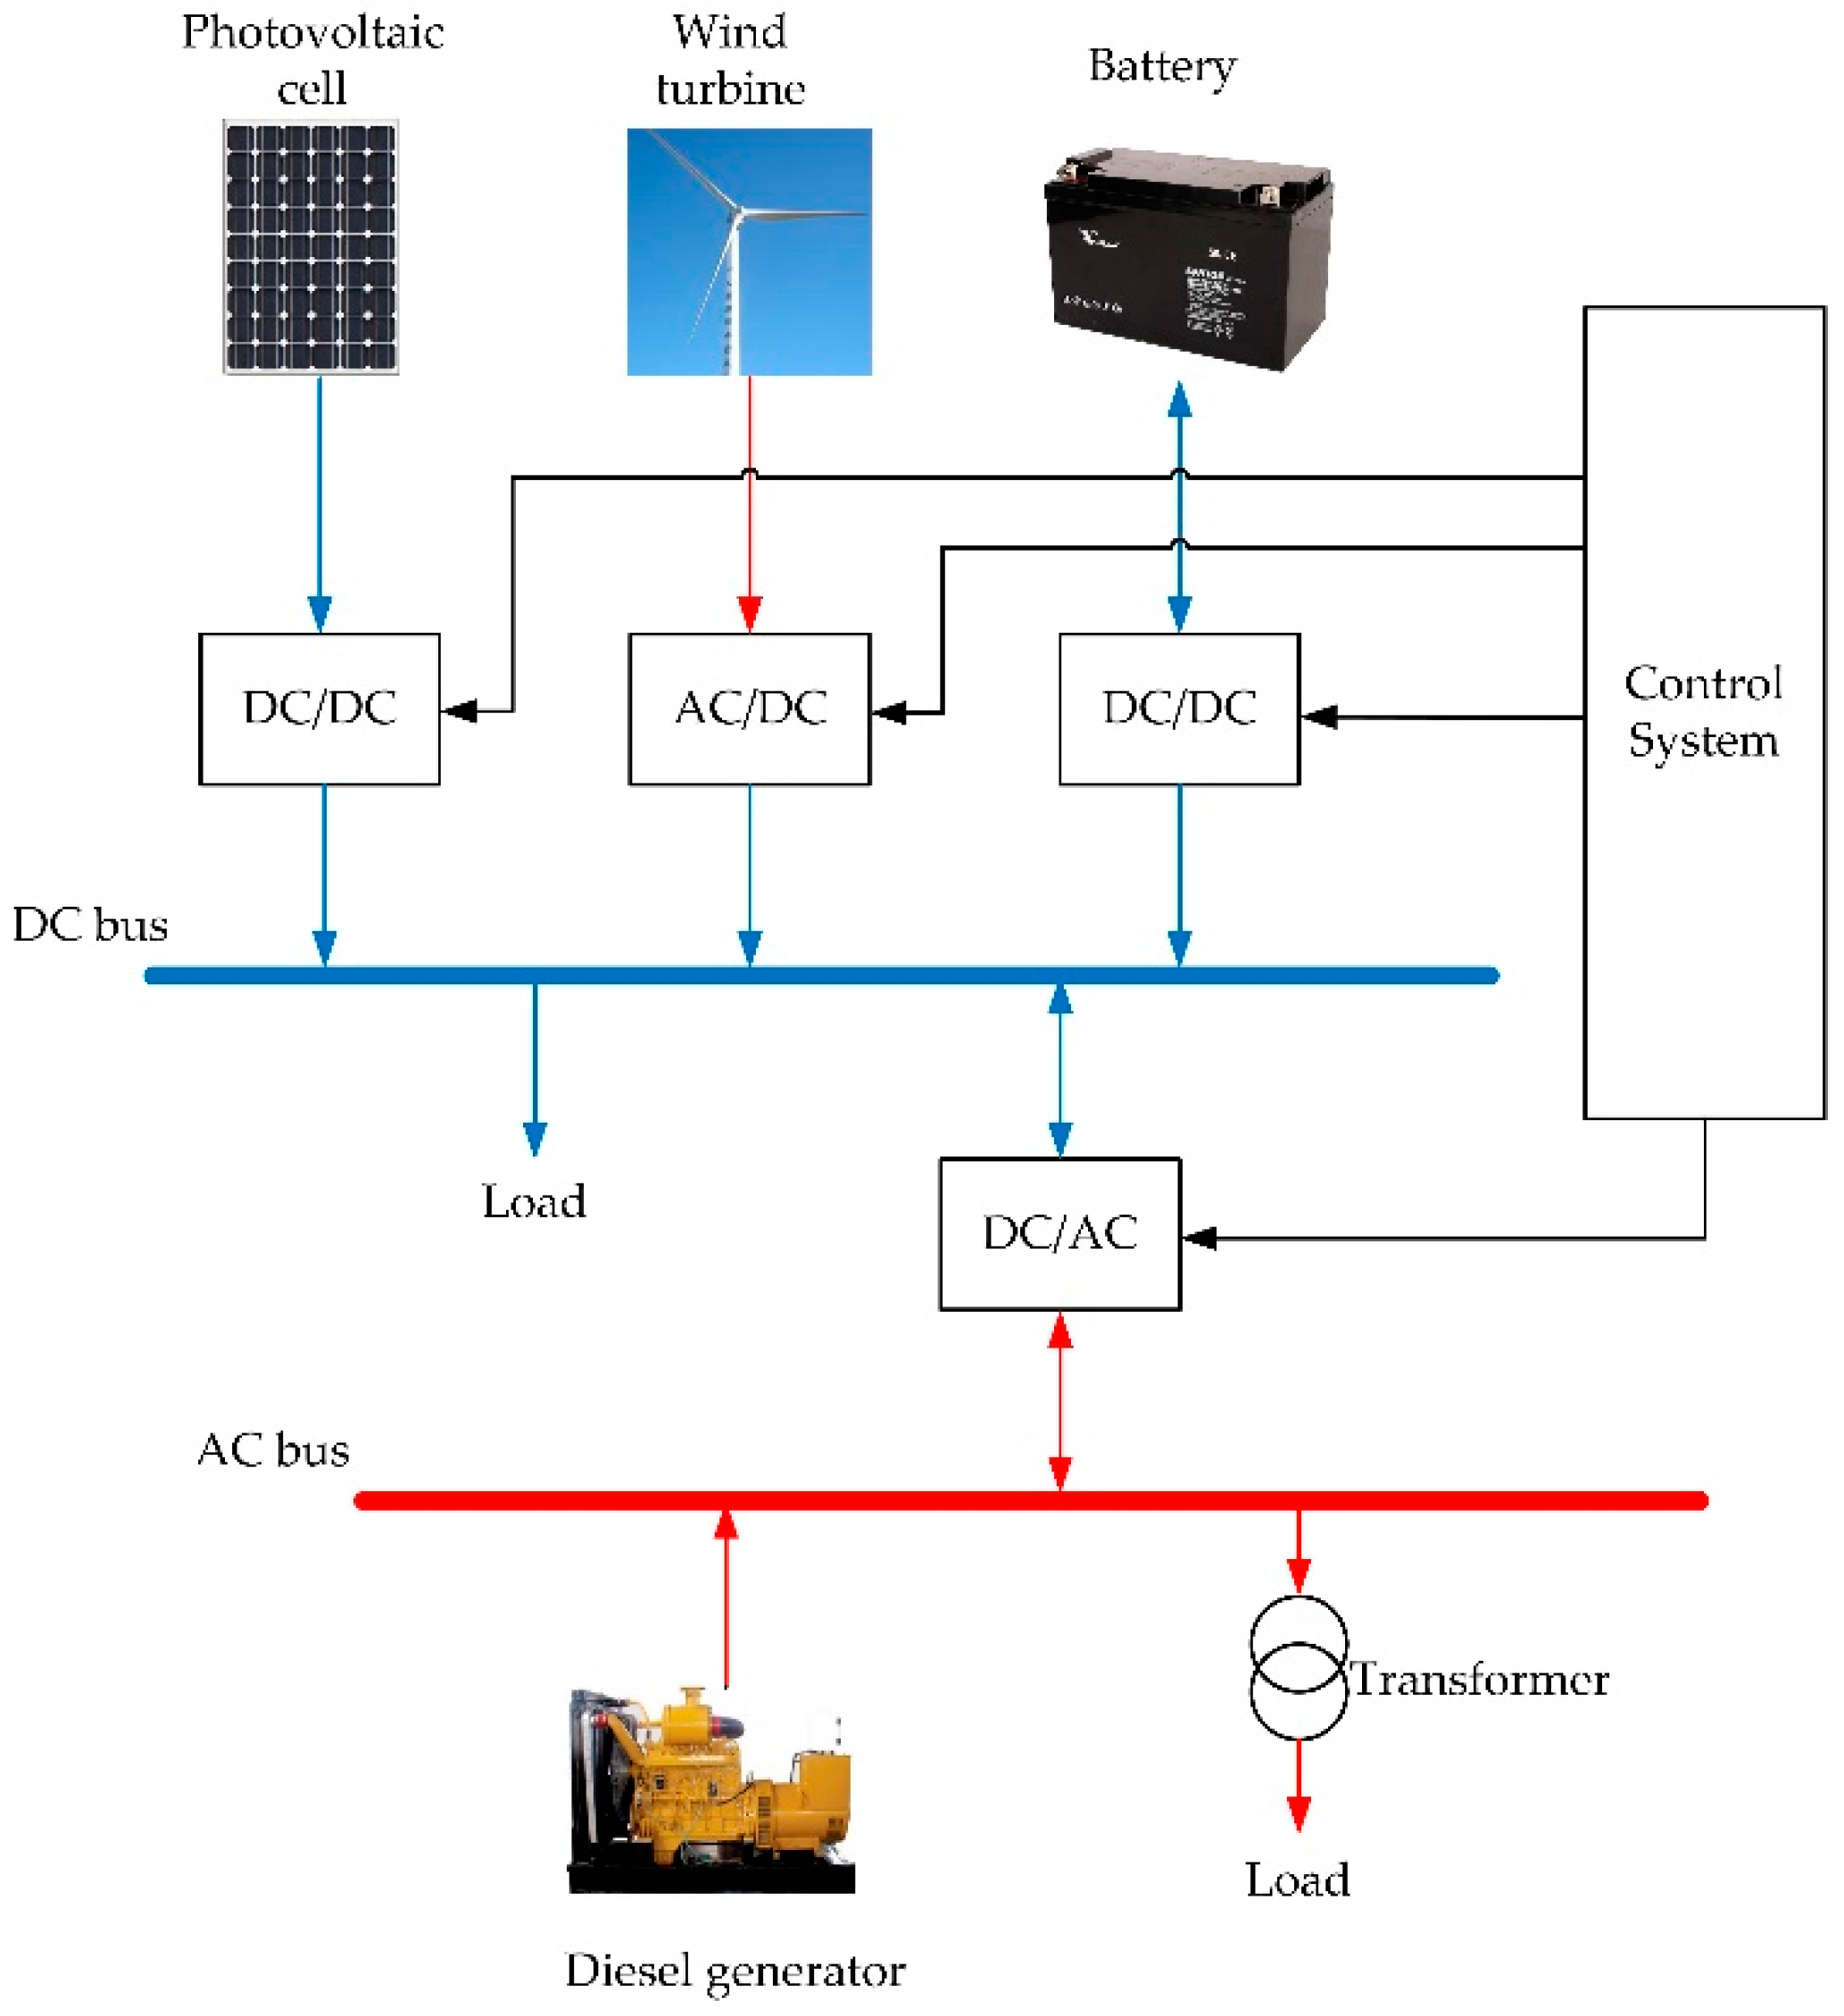
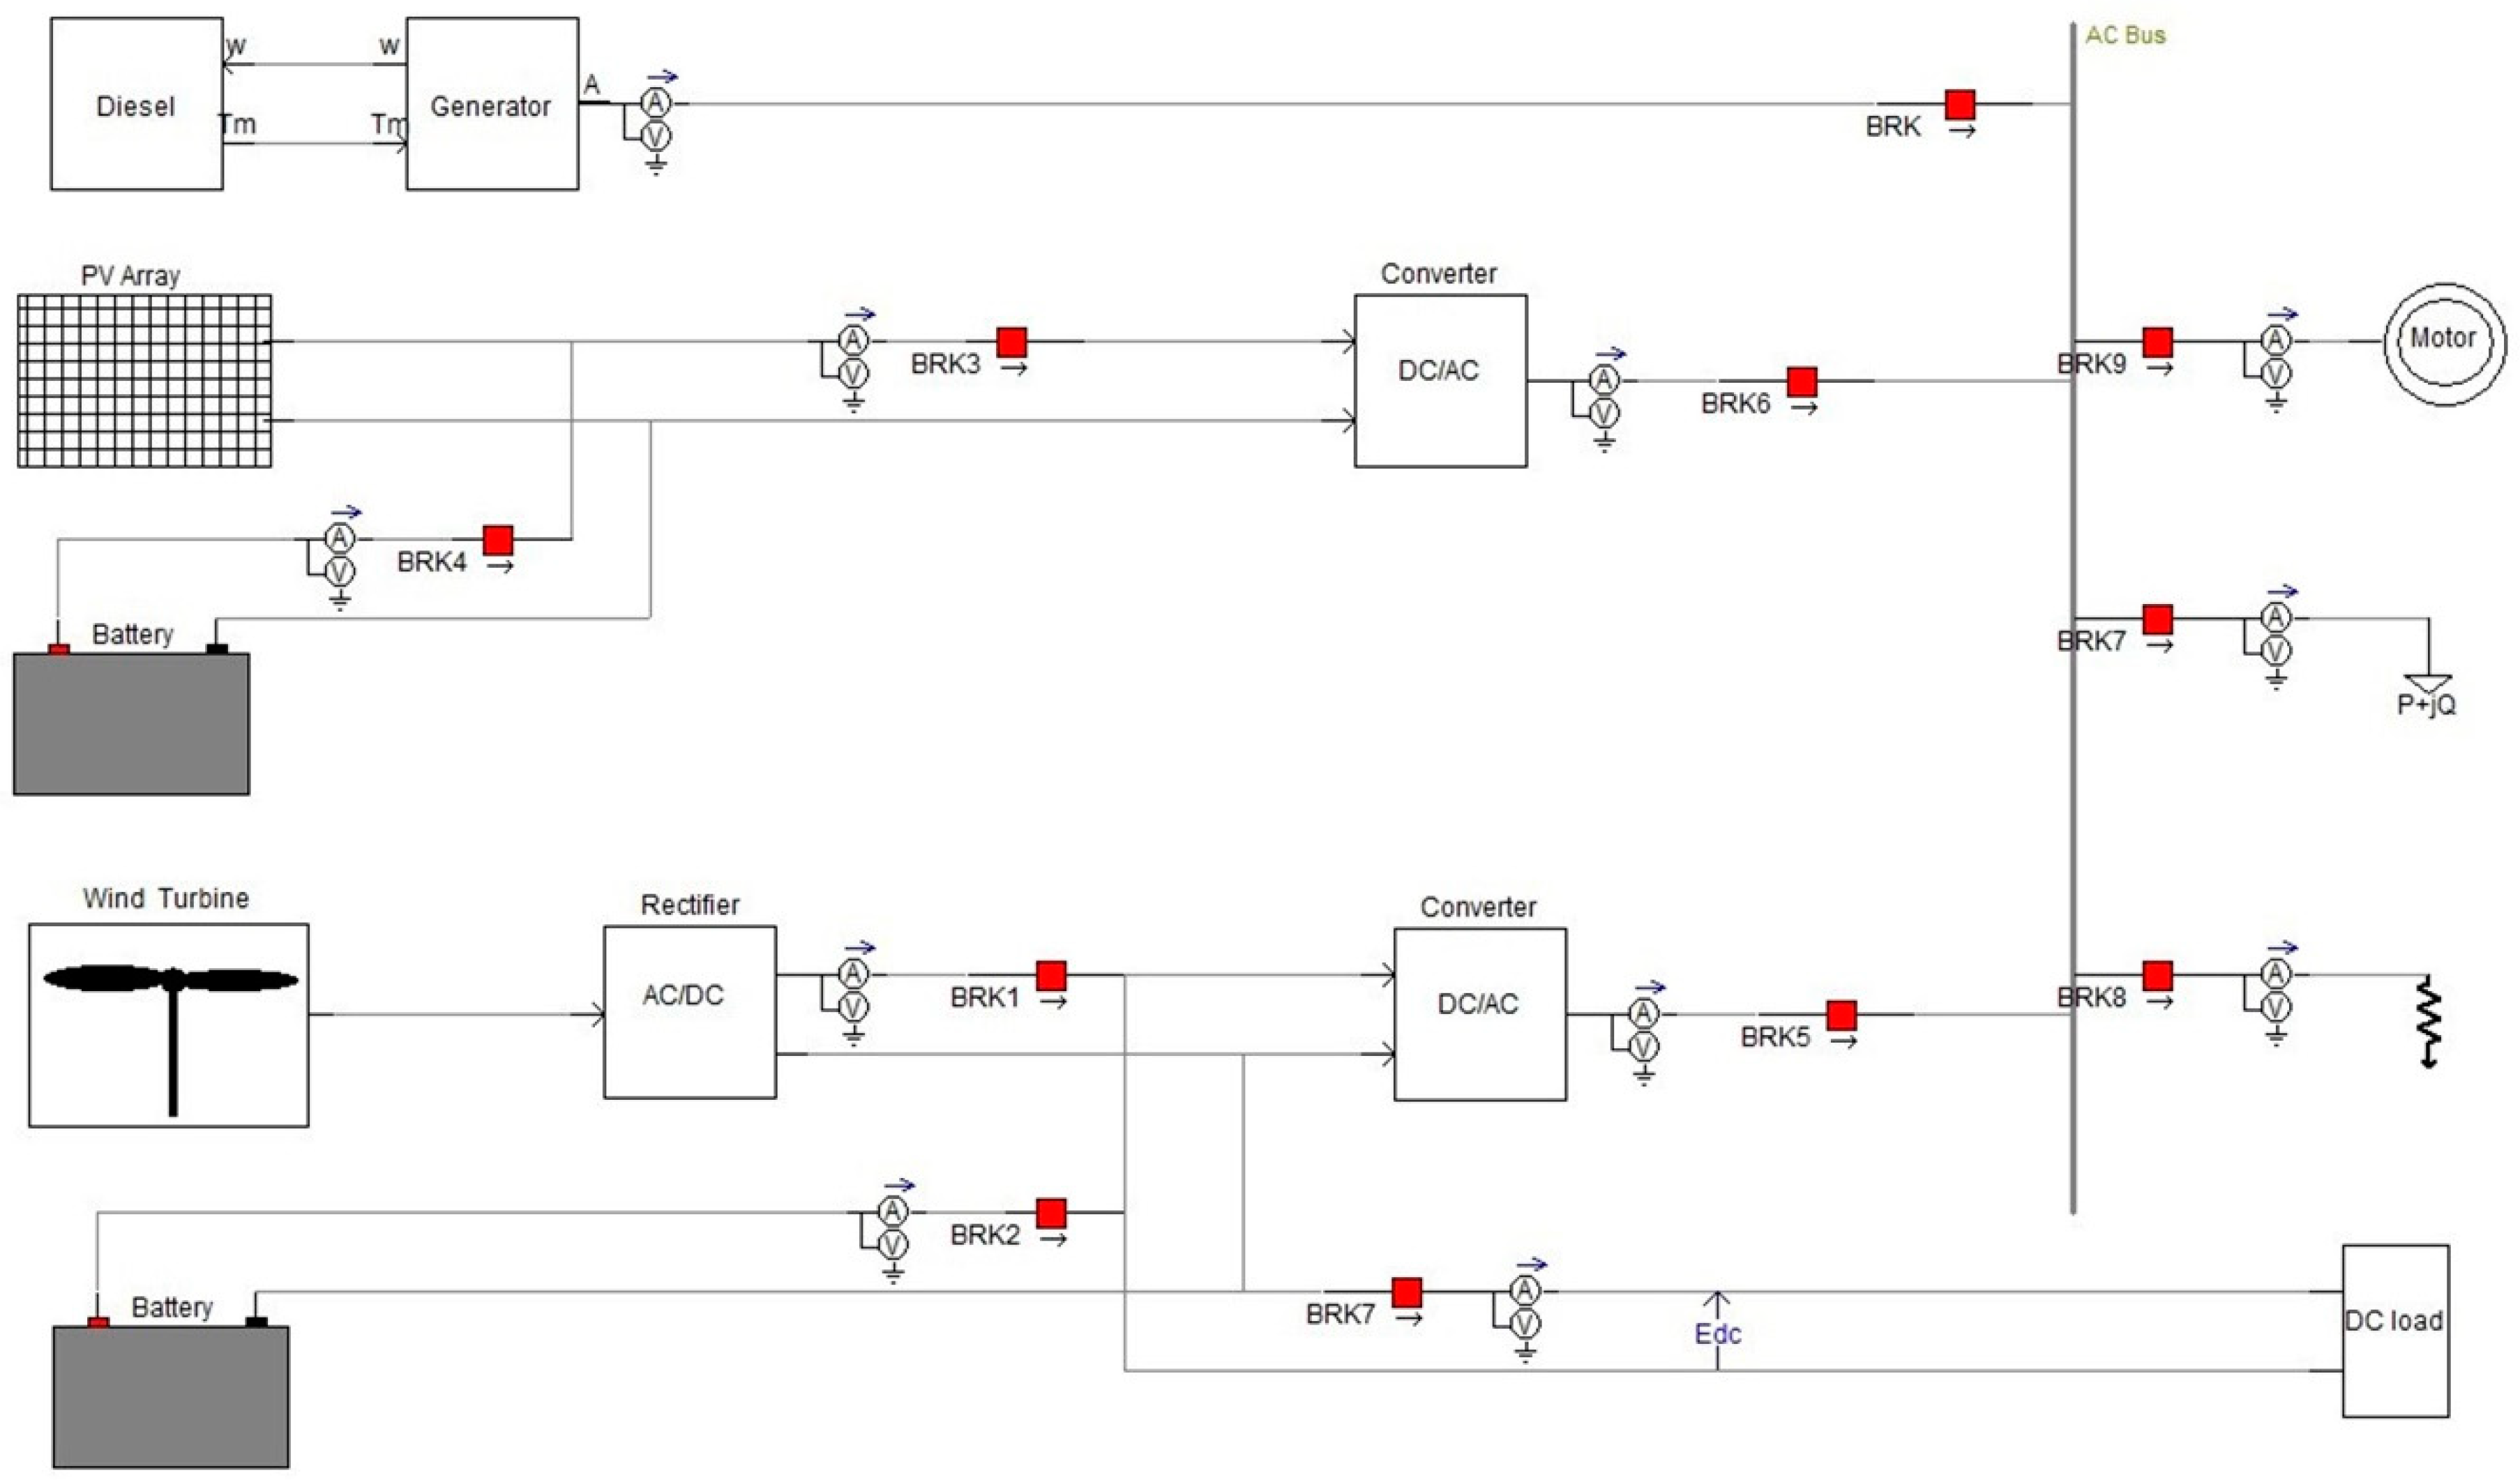
2.2.4. Topological Structure of Ship Power System Integrated with Renewable Energy

All subsystems are packaged into modules that are ultimately connected into the renewable energy ship power system. The prime mover module includes diesel engine and governor; the torque of prime mover is fed into the diesel generator, and the generator speed is fed back to the governor module simultaneously. Both the photovoltaic power generator system and the wind power generator system are integrated into the ship power system through the inverter; the battery module includes the block battery and the DC-DC conversion circuit. The simulation model of ship power system integrated with renewable energy is shown in Figure 8.

3. Hull Roll Control Strategy

When the ship is in a calm sea, it is assumed that the sun is shining on the deck vertically, at which time the deck receives the maximum solar radiation. When the ship is rolling, the equivalent light-receiving area of the deck decreases as the roll angle increases, which can be equivalent to the vertical component of light acting on the photovoltaic panel. At this time, the ship roll can be equivalent to the change of the equivalent light-receiving area of the photovoltaic panel, as well as the change in the illumination intensity according to the cosine curve. The maximum value of illumination intensity is R e , and the minimum value is R e R e cos θ .
R r e = R e + R e cos θ 2 + R e R e cos θ 2 cos ( 2 π f t )
where R r e is the equivalent illumination intensity, R e is the maximum value of illumination intensity, θ is the toll angle of the ship, f is the roll frequency of ship.
As to wind turbines, the most severe fluctuation is that wind blows from the side of the hull to the wind turbine; assuming that the wind direction is horizontal, due to the roll of the ship, the effective area swept by the impeller of the wind turbine periodically fluctuates with the roll of the ship, which is equivalent to the periodic fluctuation of the energy received by the wind turbine. It can be equivalent to a periodic change in wind speed.
V r e = V W + V W cos θ 2 + V W V W cos θ 2 cos ( 2 π f t )
where V r e is the equivalent wind speed, V W is the maximum value of wind speed.
In the simulation, it is assumed that the maximum roll angle of the ship is 40°. Through the equivalent of the ship roll model, the operation state of the ship power system during the ship roll is simulated. The data used in the simulation are all from the PSCAD software. Since the output curves of the same system under different parameters need to be compared, the output curves of different parameters of the same system need to be drawn in the same graph. So the simulation data of the PSCAD software are firstly exported, and then the comparison curve is drawn in MATLAB.

4. Simulation Analysis of Renewable Energy Ship Roll

In order to realize the application of renewable energy power generation on container ship, this chapter considers the impact of ship roll on photovoltaic power generation system and wind power generation system and introduces battery to increase the stability of the system. Throughout, the renewable energy experimental platform for the test and the obtained data curves are analyzed.

4.1. Experimental Conditions

The mathematical models of diesel engine and its governing system model, synchronous generator and its excitation system model, synchronous motor and its load model are respectively established, and the simulation models of each module are established with PSCAD software and then integrated into the entire ship power system. Although the partial simulation model of the ship power system adopts the idea of simplifying the process when building the model, the results of the simulation analysis show that the system can reflect the operational status of the ship power system in reality to some extent. Basic simulation parameters are shown in Table 4:
The operation characteristics of photovoltaic power generation system and wind power generation system in the marine environment were simulated through the renewable energy experimental platform, and the output power of the photovoltaic panels at different inclination angles and the output power of the wind turbines under different winds directions were obtained. Based on the test results, the operation characteristics of the photovoltaic power generation system and wind power generation system in the marine environment are considered in the system simulation. The output voltage, current and power of the photovoltaic panels and wind turbines are saved as CSV table files by the data acquisition system, and the period of data acquisition is 0.5 ms. Then the saved data are filtered; the bad points are discarded, and MATLAB software is used to graph the data. Figure 9 shows the experimental platform of photovoltaic power generation system. Figure 10 shows the experimental platform of wind power generation system.
There are 8 photovoltaic panels tiled on a six-degree-of-freedom swing platform. The swing platform can simulate the pitch and roll of the ship during navigation. Only the roll with a large swing angle is considered here. The maximum swing angle of the swing platform is 18°, and the swing period is set to the ship roll period, assuming a period of 10 s. The light source above the swing platform is turned on. The light source is used to simulate sunlight and illuminate vertically onto the photovoltaic panel. The data acquisition system saves the system output. In the experiment, first, the size of the light is adjusted to make the photovoltaic panel output reach the rated operating conditions. Then the swing platform starts to swing in a period of 5 s and collects the output of photovoltaic panels.
A 1 kW permanent-magnet synchronous wind generator is fixed on another swing platform. Considering the instability of the wind turbine tail when the ship is rolling leads the wind turbine to rotate around the rotating shaft so that the wind turbine cannot operate normally. Therefore, this paper does not use wind turbines that align with the wind direction automatically. The direction of the wind rotor on the experimental platform is fixed. The wind turbine consists of four 1.1 kW wind turbines, the total power is 4.4 kW, which is enough to make a 1kw wind generator meet the rated operating conditions. In the experiment, the wind speed is firstly adjusted to make the wind turbine reach the rated operating conditions, then the swing platform starts swinging in a period of 10 s, and the output of the wind turbine is collected.
Figure 11 and Figure 12 show the output curves of the photovoltaic system and the wind turbine system. The smooth curve is the fitting curve.
In the simulation analysis of stability of the ship power system integrated with renewable energy, it is necessary to consider the impact of the ship’s roll on the system.

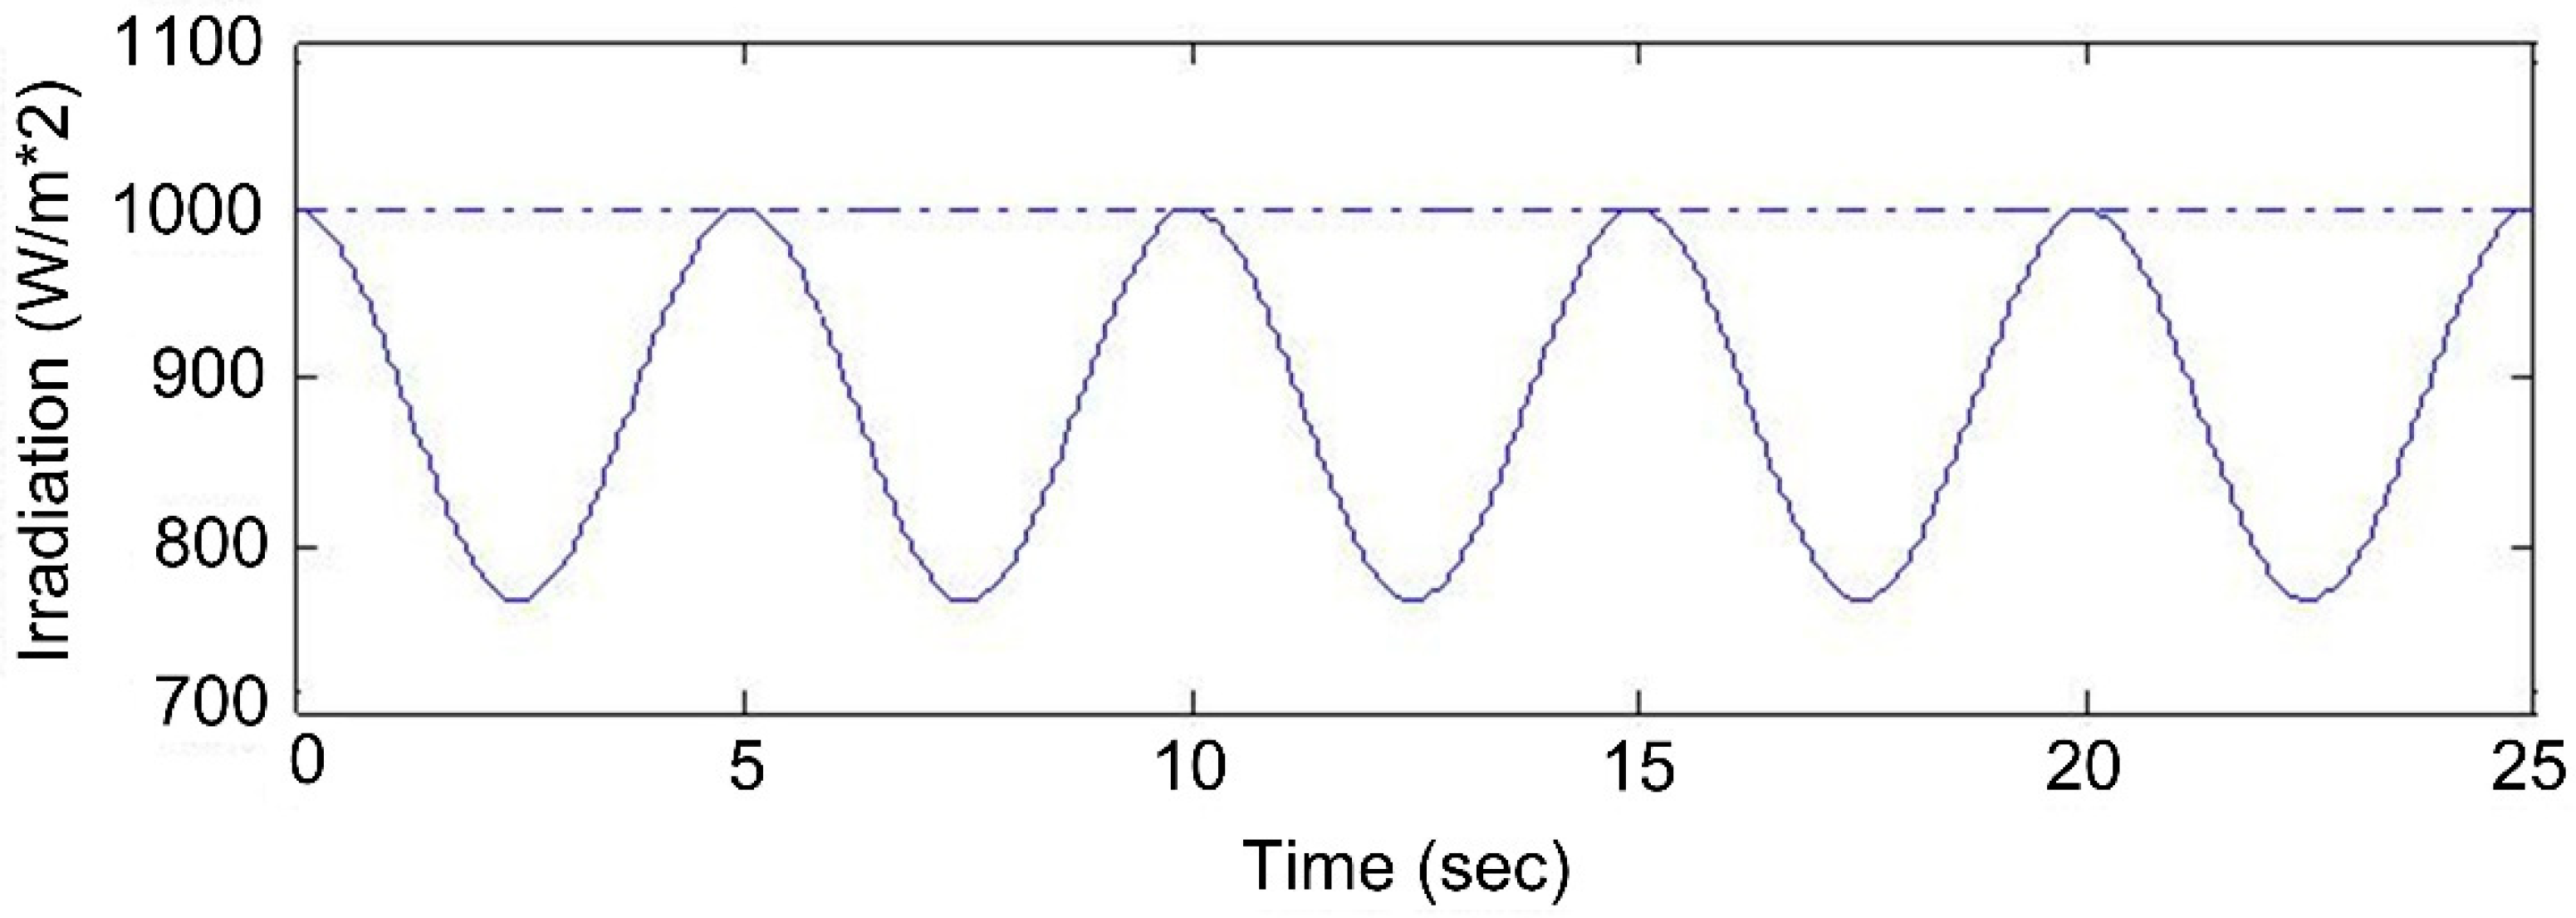
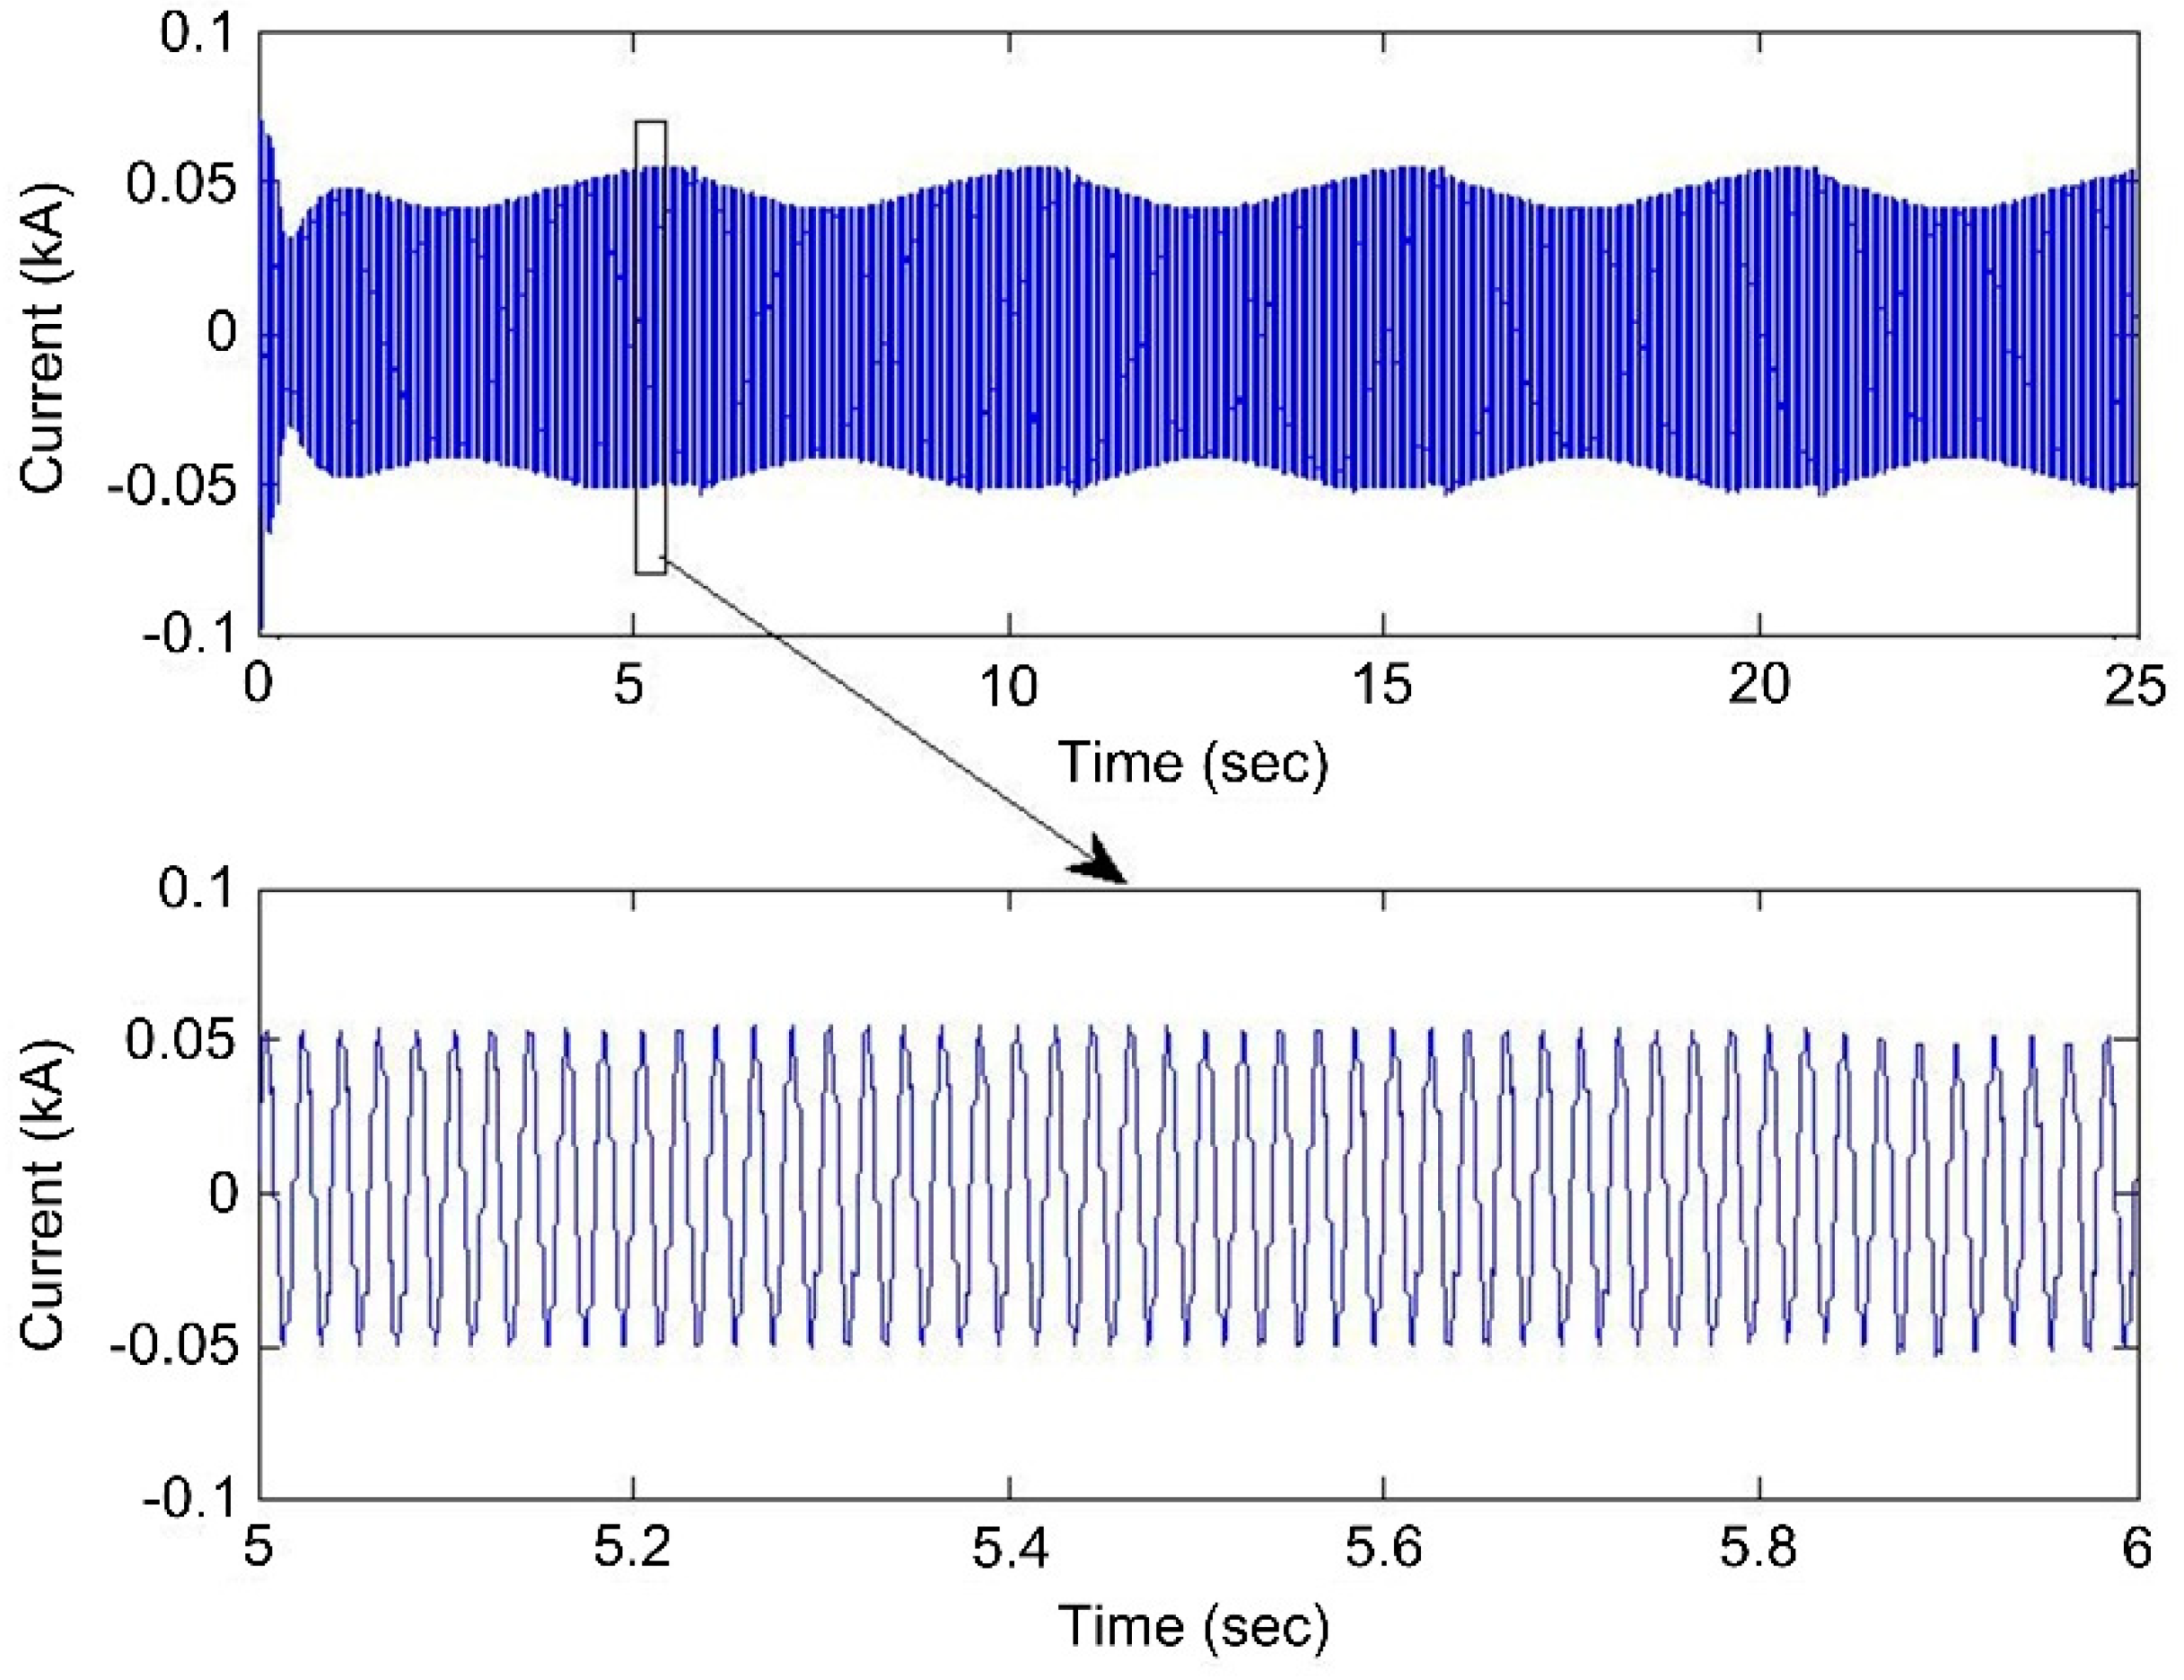
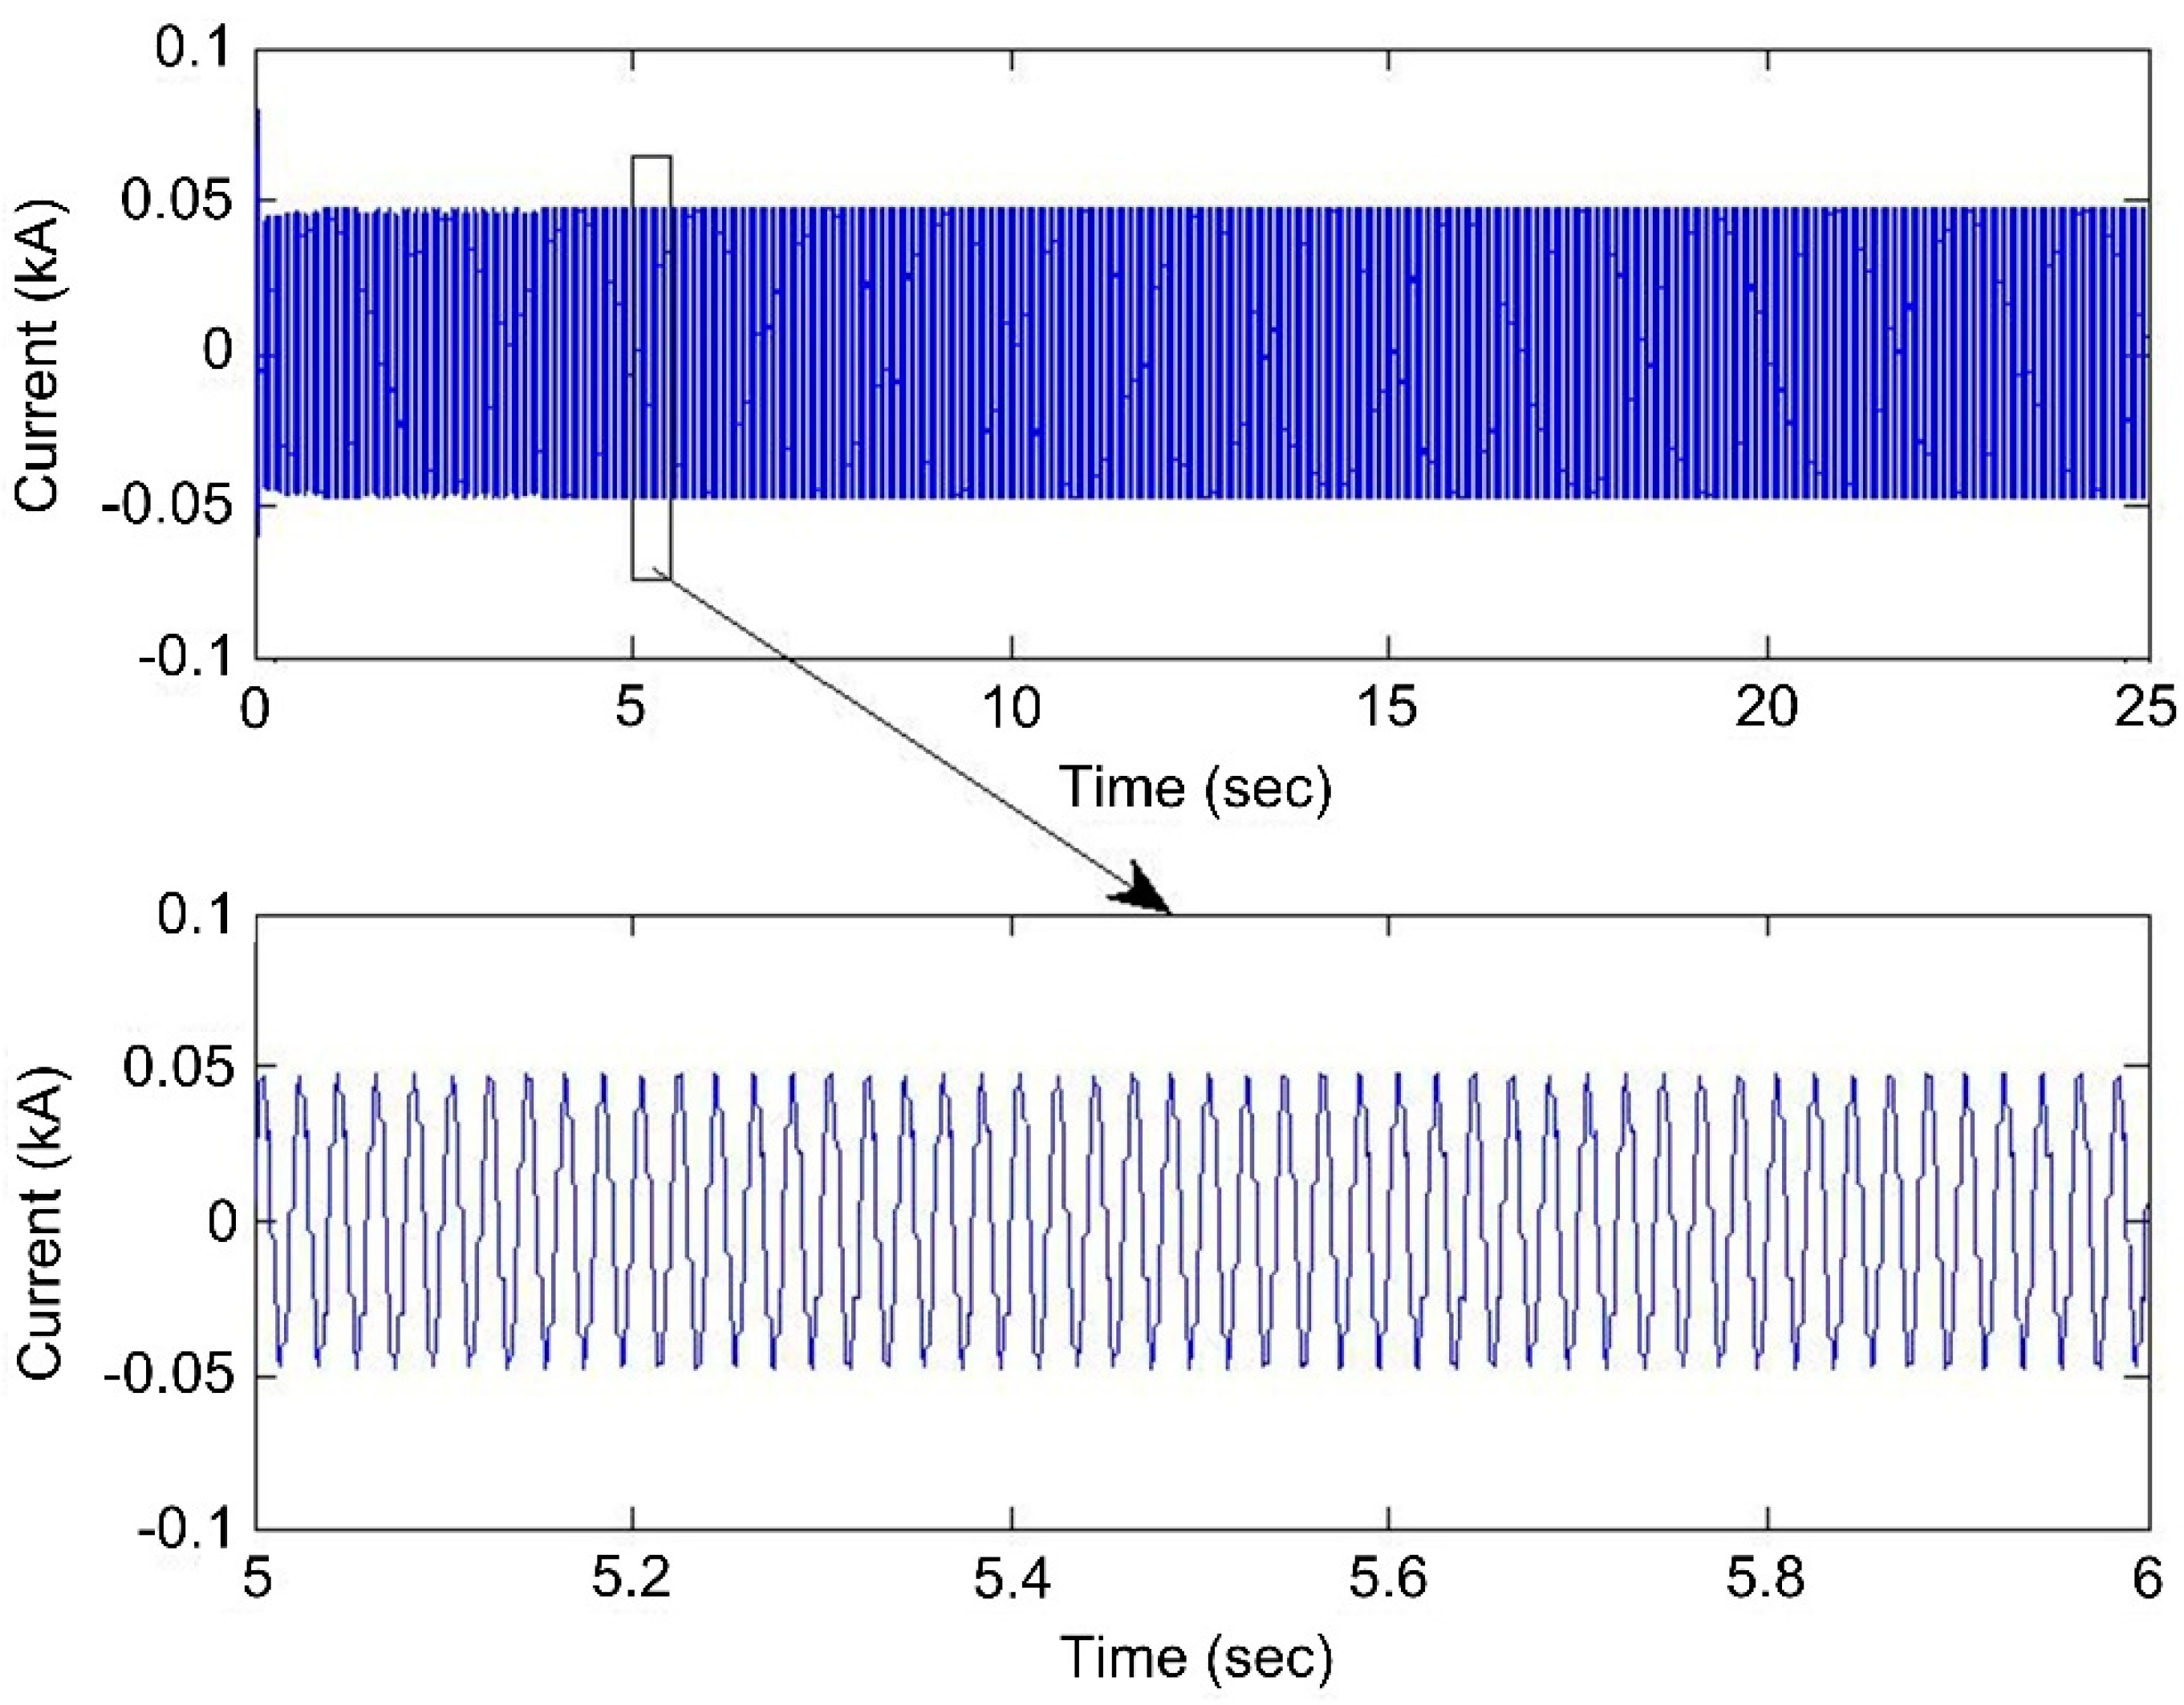
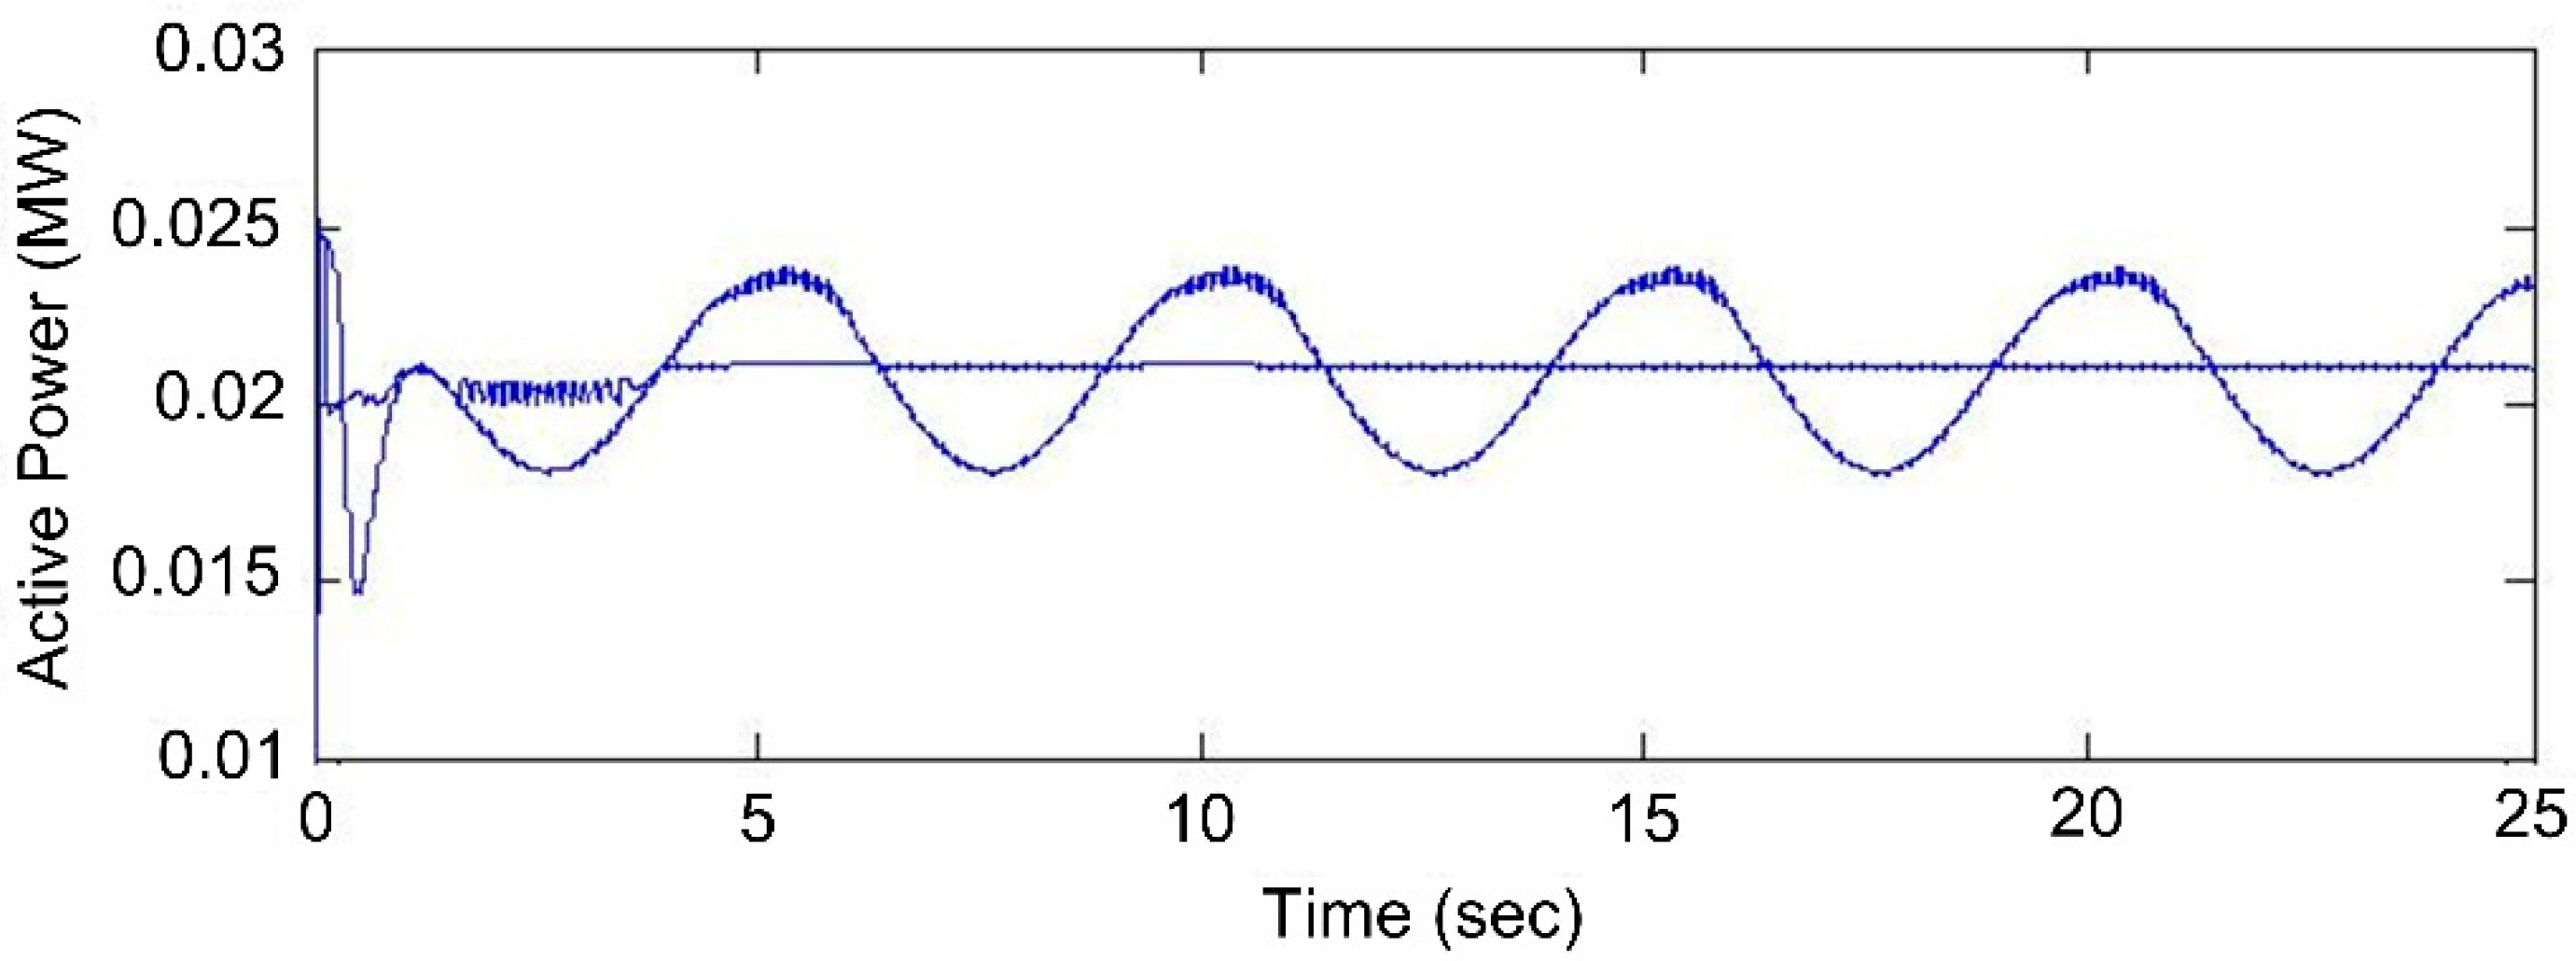
4.2. Simulation Analysis of Photovoltaic System

On the horizontal direction, the rated illumination intensity is 1000 W/m2. When the ship is in the stationary state, the illumination on the photovoltaic cell panel is the rated illumination. When the ship is rolling, it equals to the effective area of the photovoltaic cell panel decreasing, which can be equivalent to the change of the illumination intensity. The equivalent illumination intensity is about 766 W/m2 when the ship’s roll angle is the largest; the light intensity is restored to 1000 W/m2 when the ship’s roll angle is 0 degree. Figure 13 is the comparison of the illumination when the ship is rolling at 0 and 40 degrees.
Figure 14 shows the change curve of grid-connected current when the ship is rolling. It can be seen from the figure that the grid-connected current also fluctuates periodically with the change of illumination intensity. The corresponding grid-connected current is the smallest when the ship’s roll angle is the largest; the corresponding grid-connected current is the largest when the ship’s roll angle is the smallest. The fluctuation of the grid-connected current does not lead the harmonics of the grid-connected current to increase. It can be seen that if there is no energy storage device, the grid-connected power will still fluctuate even if the light does not change.
Figure 15 is the comparative curve of grid-connected active power between the conditions of rolling and without rolling when no energy storage is accessed. The horizontal dotted line represents the change of grid-connected power of the photovoltaic system when the ship is not rolling, and the grid-connected power is stable at this time. The grid-connected power fluctuates when the ship is rolling.
The battery access system not only stabilizes the DC bus voltage but also stabilizes the grid-connected current of the photovoltaic system. Figure 16 shows the grid-connected current curve after the battery is integrated into the photovoltaic system. It can be seen from the figure that the fluctuation of the grid-connected current is greatly reduced and almost as stable as that of the ship in the absence of rolling.
Figure 17 is a comparison curve of active power when the battery is or is not connected. It can be seen from the figure that the grid-connected power curve of the photovoltaic system is fluctuating when the battery is not connected. The grid-connected power becomes relatively stable when the battery is connected.
Figure 18 is the change curve of the battery SOC of the photovoltaic system; the remaining capacity of the battery varying periodically with the rolling of the ship.
It can be seen that the output power of the photovoltaic system fluctuates with the change of the roll angle of the ship, and the frequency of the fluctuation depends on the frequency of the ship rolling. Obviously, the fluctuation of the grid-connected power and the grid-connected current are low-frequency fluctuations, and the fluctuation period is several seconds or even tens of seconds. It can be seen from the above figures that the incorporation of the battery can well suppress the low-frequency grid-connected power fluctuation caused by the roll and improve the stability of the photovoltaic grid-connected system. This also shows that the dynamic charge-discharge performance of the battery can meet the requirements of stabilizing power when the ship is rolling. The battery has enough fast charging and discharging speed to absorb power when the bus voltage is high and to emit power when the bus voltage is low. Therefore, for grid-connected power fluctuations of photovoltaic system caused by ship roll, cheap battery can be used to stabilize such power fluctuations, and it is not necessary to use other energy storage devices with higher prices.

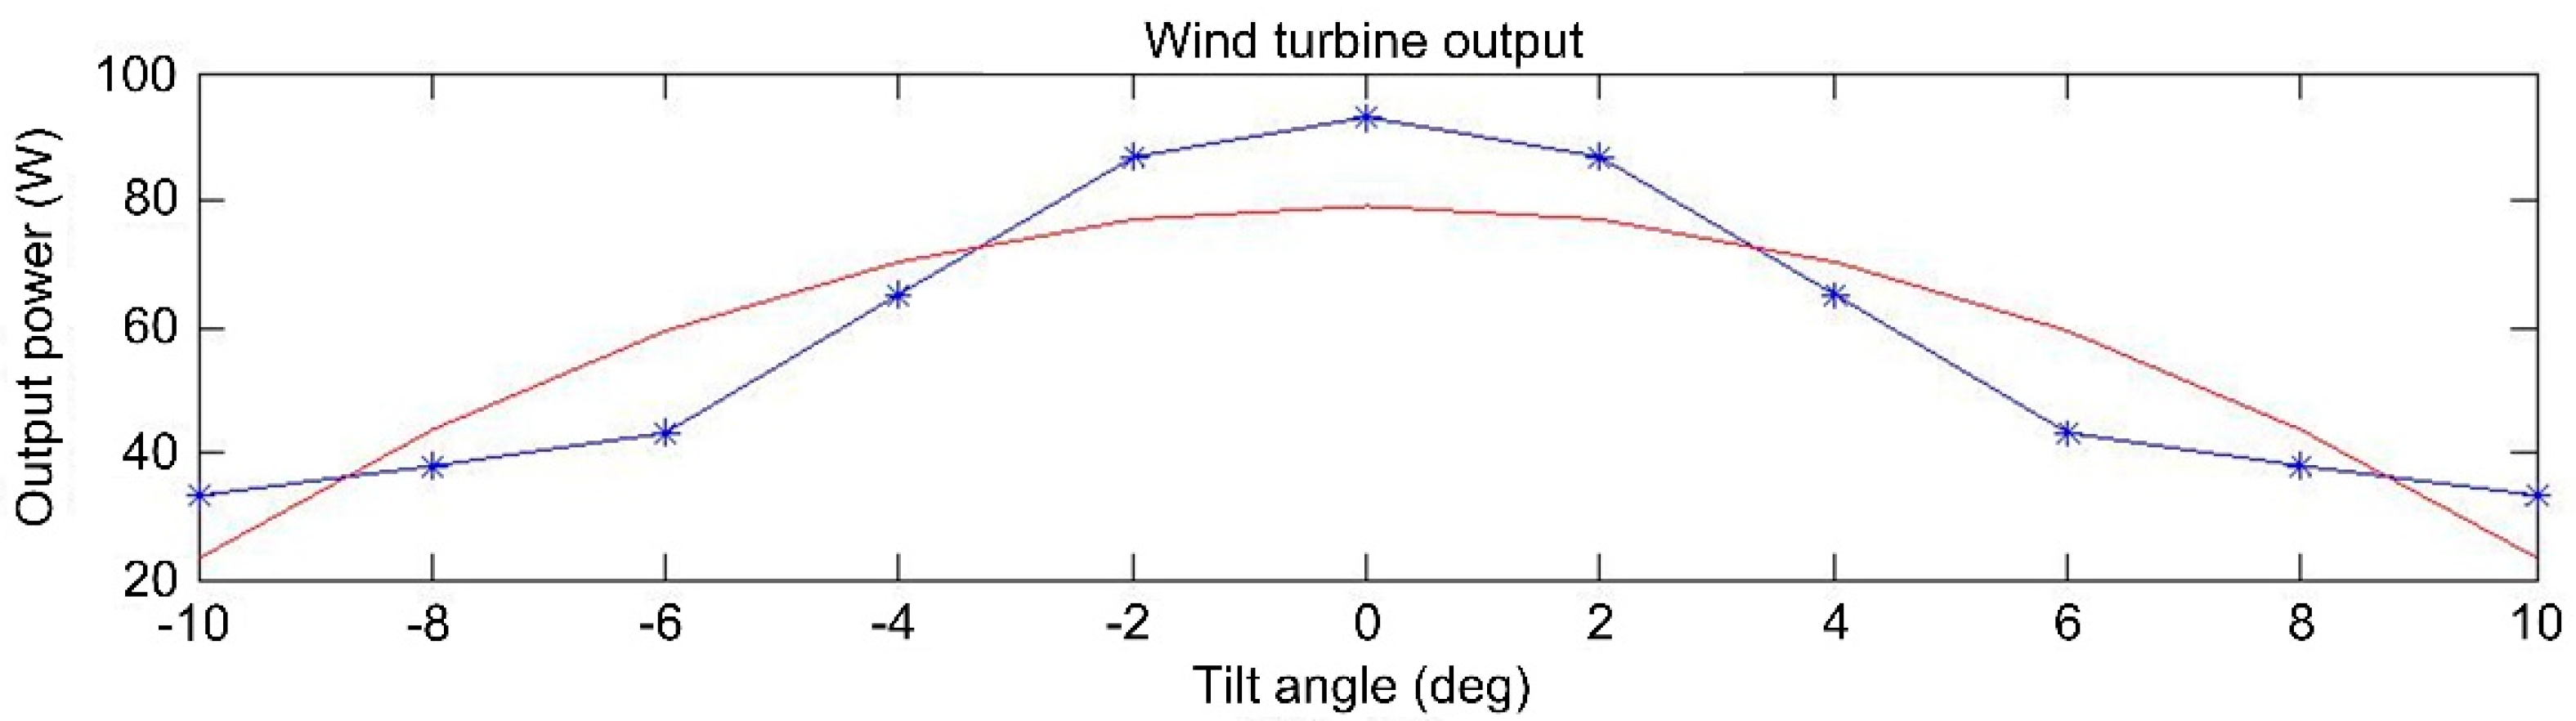
4.3. Simulation Analysis of Wind Turbine

The effect of the rolling of the ship on wind turbine is similar to that of photovoltaic system. The rated wind speed of the wind turbine is 14 m/s. The equivalent wind speed is considered to be the rated wind speed when the ship does not roll; the equivalent wind speed changes according to the cosine curve when the ship is rolling. The wind speed curve is shown in Figure 19. The variation of wind speed causes the fluctuation of the rotation speed of the wind generator, as shown in Figure 19. The rolling of the ship causes the grid-connected power of the wind generator to fluctuate periodically with the change of rolling angle. The grid-connected power of the wind turbine fluctuates with the rolling of the ship when the battery is not connected. The grid-connected power becomes stable when the battery is connected. It can be seen that the incorporation of the battery reduces the fluctuation of power caused by the rolling greatly.
Figure 20 shows the SOC variation curve of battery in wind turbine generator. Due to the long start-up process of the wind turbine, during the start-up process, the bus voltage is low, which means that the battery has been in a state of discharge, and the remaining power SOC has been declining. When the wind turbine reaches the rated operating state, the bus voltage fluctuates with the rolling of the ship. Then the battery charged and discharged through the DC-DC conversion circuit, and the remaining capacity of the battery fluctuates periodically. When the battery charged for the bus, the remaining power decreased; when the DC bus charged for the battery, the remaining power of battery increased.
It can be seen that the output power of the wind turbine fluctuates with the change of the roll angle of the ship. The frequency of the fluctuation still depends on the roll frequency of the ship, which is low frequency fluctuation. It can be seen from the above figures that the incorporation of the battery can well suppress the fluctuation of the low-frequency grid-connected power caused by the rolling and improve the stability of the wind turbine generator set. This also shows that the dynamic charge-discharge performance of the battery can meet the requirements of wind turbine generator set for stabilizing power when the ship is rolling. The charge-discharge speed is fast enough to absorb power when the bus voltage is high and emits power when the bus voltage is low.

5. Conclusions

The application of renewable energy such as solar energy and wind energy to ships can alleviate the problem of energy shortage to a certain extent and reduce environmental pollution. However, the marine environment is different from the terrestrial environment. Based on the application of renewable energy on land, the simulation model of the comprehensive utilization system of ship with renewable energy is established in this paper, and the effect of ship roll on the system is considered in the model. The main research results are as follows:
  • The simulation models of photovoltaic power generation system, wind power generation system, energy storage system and ship power system were established, and the correctness of the models was verified. Then each subsystem was combined together to form a ship power system simulation model integrated with renewable energy.
  • Different from the working environment on land, it is necessary to introduce the influence of ship rolling to the system simulation model when the ship is in the rolling state. For photovoltaic power generation system, the impact of rolling is equivalent to the change of illumination intensity; for wind generation power system, the impact of rolling is equivalent to the change of wind speed.
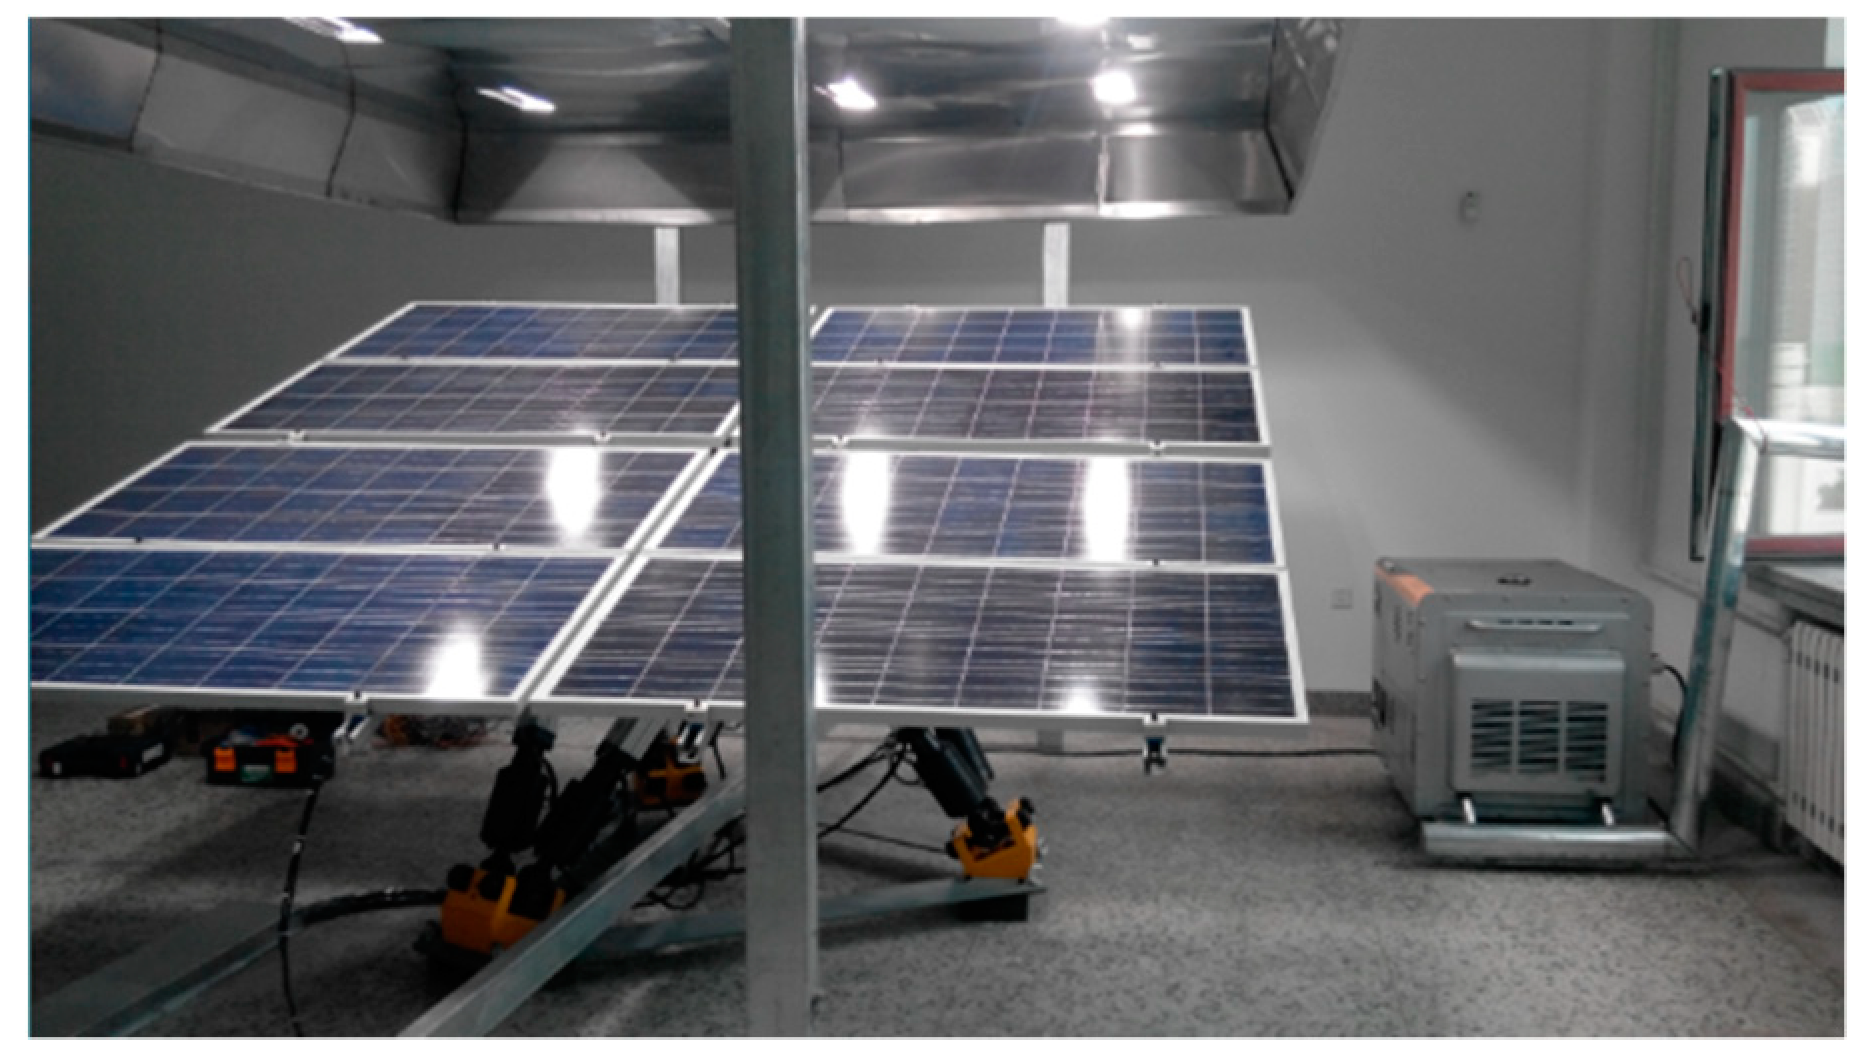
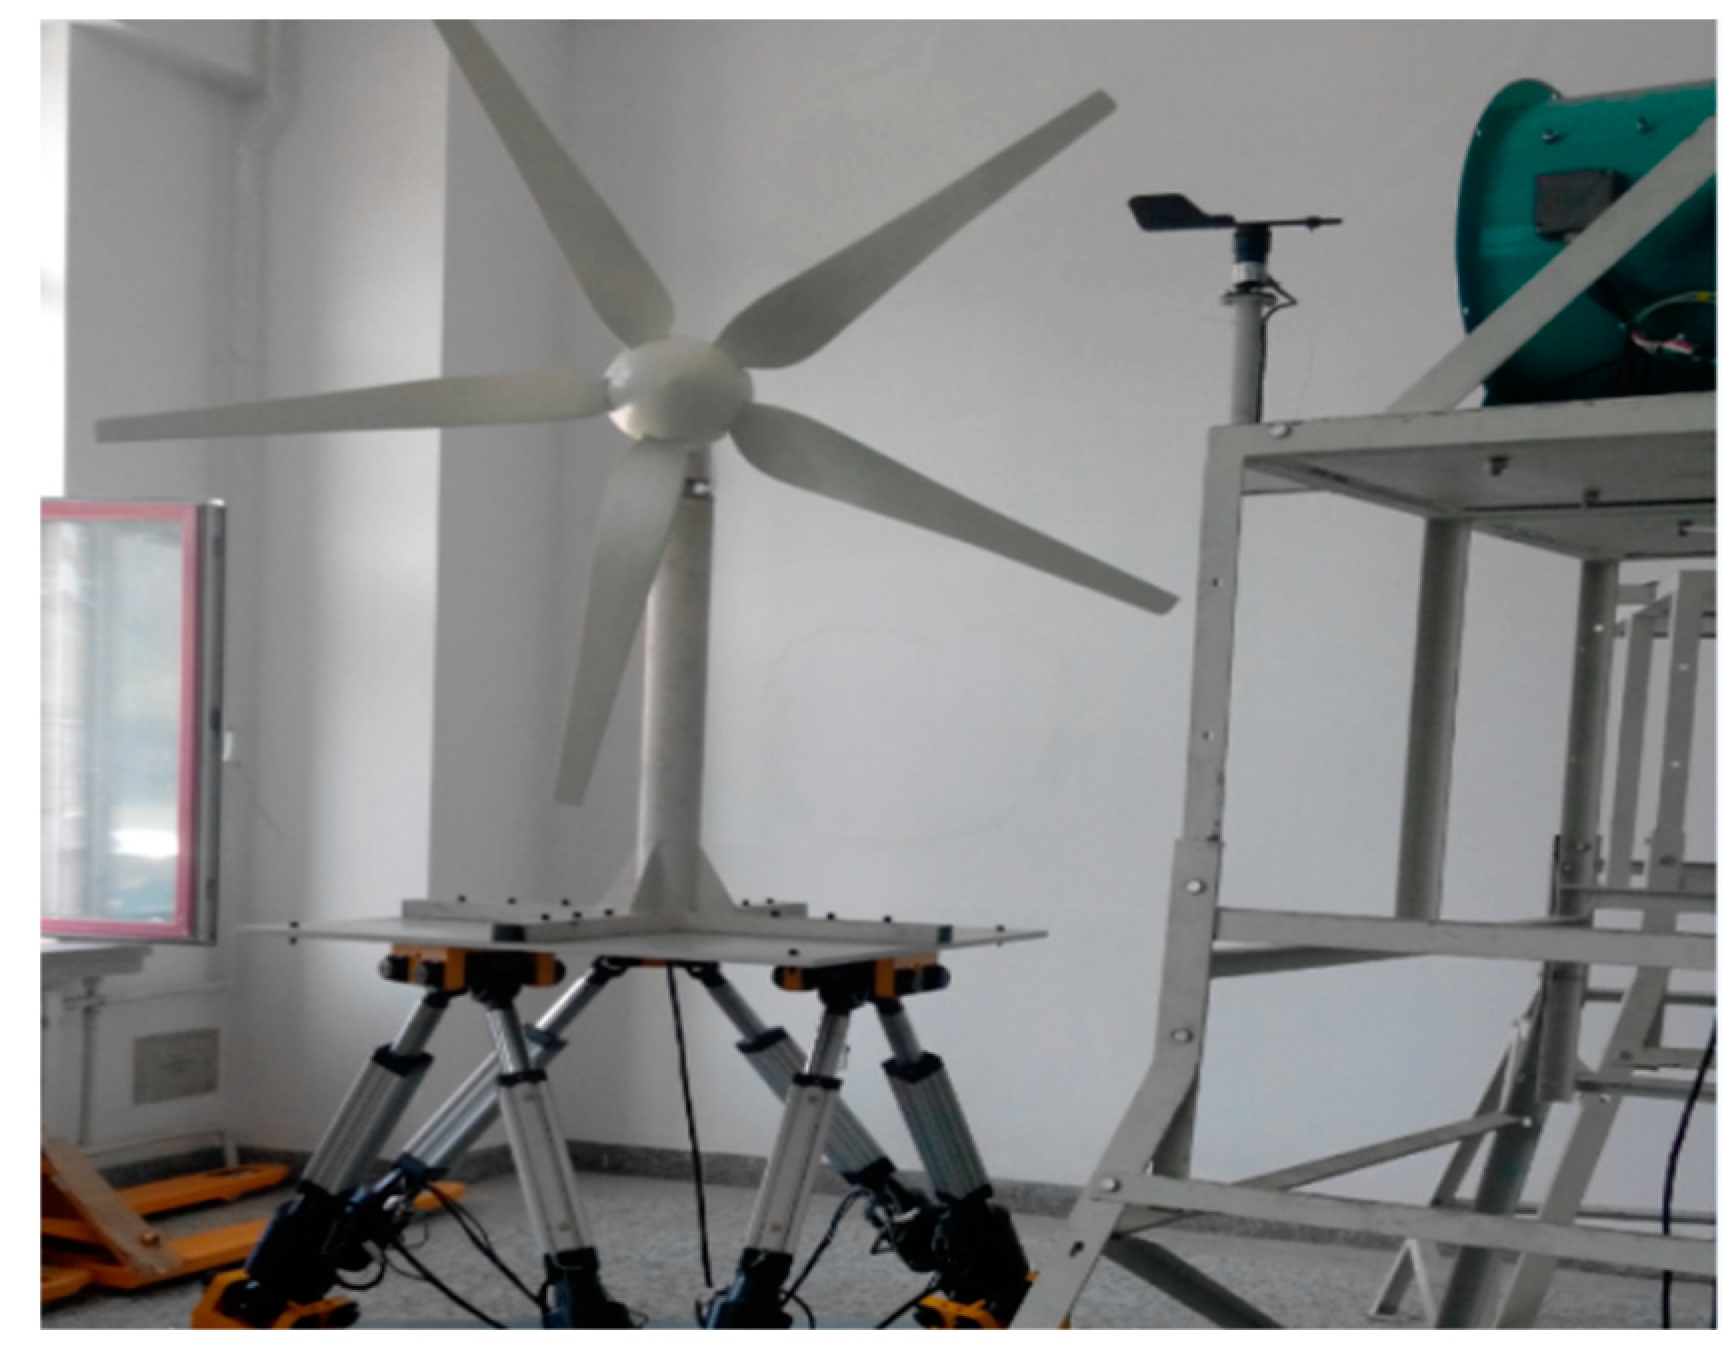
  • Experiments were carried out on the comprehensive experiment platform of renewable energy. The grid-connected power curves of the photovoltaic system and wind turbine generator set were tested on the condition that the ship was rolling. The change of the grid-connected power of the experimental platform during the ship rolling is basically consistent with the simulation results.
  • By comparing the simulation results between the conditions of non-access battery and access battery, it can be seen that the dynamic charge-discharge performance of the battery can completely track the power fluctuations caused by the ship’s rolling so as to stabilize the power fluctuations. It is not necessary to use other expensive energy storage devices or to combine the battery with other energy storage devices, which will reduce the capacity of other expensive energy storage devices; thus, the battery makes the whole system more economical.
Future research work will consider improving and perfecting the following contents, including comprehensively considering various factors to optimize the capacity of the battery to improve the economy, considering whether the hybrid energy storage system can better stabilize the power fluctuations caused by ship rolling.

Author Contributions

Conceptualization, P.C.; methodology, P.C., R.L. and H.L.; software, N.L. and Q.C.; validation, N.L.; formal analysis, N.L. and Q.C.; investigation, P.C. and H.L.; writing—original draft, N.L. and Q.C.; writing—review and editing, P.C., R.L. and N.L. All authors have read and agreed to the published version of the manuscript.

Funding

This research received no external funding.

Conflicts of Interest

The authors declare no conflict of interest.

References

  1. Zhao, M.; Fan, Y.H. The voltage stability research of ship electric power system. In Proceedings of the 2006 CES/IEEE 5th International Power Electronics and Motion Control Conference, Shanghai, China, 14–16 August 2006; pp. 1–5. [Google Scholar]
  2. Muneer, W.; Bhattacharya, K.; Canizares, C.A. Large-scale solar PV investment models, tools, and analysis: The Ontario case. IEEE Trans. Power Syst. 2011, 26, 2547–2555. [Google Scholar] [CrossRef]
  3. Pulipaka, S.; Mani, F.; Kumar, R. Modeling of soiled PV module with neural networks and regression using particle size composition. Sol. Energy 2016, 123, 116–126. [Google Scholar] [CrossRef]
  4. Velasco-Quesada, G.; Guinjoan-Gispert, F.; Pique-Lopez, R.; Roman-Lumbreras, M.; Conesa-Roca, A. Electrical PV array reconfiguration strategy for energy extraction improvement in grid-connected PV systems. IEEE Trans. Ind. Electron. 2009, 56, 4319–4331. [Google Scholar] [CrossRef] [Green Version]
  5. Yilmaz, S.; Ozcalik, H.R.; Kesler, S.; Dincer, F.; Yelmen, B. The analysis of different PV power systems for the determination of optimal PV panels and system installation—A case study in Kahramanmaras, Turkey. Renew. Sustain. Energy Rev. 2015, 52, 1015–1024. [Google Scholar] [CrossRef]
  6. Bianchi, M.; Branchini, L.; Ferrari, C.; Melino, F. Optimal sizing of grid-independent hybrid photovoltaic–battery power systems for household sector. Appl. Energy 2014, 136, 805–816. [Google Scholar] [CrossRef]
  7. Zhao, B.; Zhang, X.; Li, P.; Wang, K.; Xue, M.; Wang, C. Optimal sizing, operating strategy and operational experience of a stand-alone microgrid on Dongfushan Island. Appl. Energy 2014, 113, 1656–1666. [Google Scholar] [CrossRef]
  8. Alam, M.S.; Alouani, A.T.; Azeem, M.F. Efficient prediction of maximum PV module output power through dynamic modeling. Sustain. Energy Technol. Assess. 2015, 11, 27–35. [Google Scholar] [CrossRef]
  9. Notton, G.; Lazarov, V.; Stoyanov, L. Optimal sizing of a grid-connected PV system for various PV module technologies and inclinations, inverter efficiency characteristics and locations. Renew. Energy 2010, 35, 541–554. [Google Scholar] [CrossRef]
  10. González, A.; Riba, J.R.; Rius, A.; Puig, R. Optimal sizing of a hybrid grid-connected photovoltaic and wind power system. Appl. Energy 2015, 154, 752–762. [Google Scholar] [CrossRef] [Green Version]
  11. Messalti, S.; Harrag, A.G.; Loukriz, A.E. A new neural networks MPPT controller for PV systems. In Proceedings of the IREC 2015 The Sixth International Renewable Energy Congress, Sousse, Tunisia, 24–26 March 2015; pp. 1–6. [Google Scholar]
  12. Melício, R.; Mendes, V.; Catalão, J. Transient analysis of variable-speed wind turbines at wind speed disturbances and a pitch control malfunction. Appl. Energy 2011, 88, 1322–1330. [Google Scholar] [CrossRef]
  13. Xu, J.; Qi, W.; Teng, Y. Study of influence on power system voltage stability of wind farm power output fluctuation. In Proceedings of the Advanced Materials Research, Dalian, China, 30–31 March 2013; pp. 846–849. [Google Scholar]
  14. Liao, Z.; Qi, X.; Zheng, S.; Wang, F. Stability analysis of photovoltaic generation system under rapid change of light intensity. Power Syst. Technol. 2011, 35, 60–65. [Google Scholar] [CrossRef] [Green Version]
  15. Shah, R.; Mithulananthan, N.; Bansal, R.C.; Ramachandaramurthy, V.K. A review of key power system stability challenges for large-scale PV integration. Renew. Sustain. Energy Rev. 2015, 41, 1423–1436. [Google Scholar] [CrossRef]
  16. Ivče, R.; Jurdana, I.; Mohović, D. Parametric roll monitoring with an integrated ship’s system. In Proceedings of the Elmar-International Symposium Electronics in Marine, Zadar, Croatia, 15–17 September 2010; pp. 333–336. [Google Scholar]
  17. Cheng, P.; Li, J.; Lan, H. Modeling and PSCAD simulation analysis on a ship power system. In Proceedings of the Applied Mechanics and Materials, Jiaozuo, China, 23–25 December 2011; pp. 58–62. [Google Scholar]
  18. Lan, H.; Bai, Y.; Wen, S.; Yu, D.; Hong, Y.Y.; Dai, J.; Cheng, P. Modeling and stability analysis of hybrid pv/diesel/ess in ship power system. Inventions 2016, 1, 5. [Google Scholar] [CrossRef] [Green Version]
  19. Wen, S.; Lan, H.; Hong, Y.Y.; David, C.Y.; Zhang, L.; Cheng, P. Allocation of ESS by interval optimization method considering impact of ship swinging on hybrid PV/diesel ship power system. Appl. Energy 2016, 175, 158–167. [Google Scholar] [CrossRef]
  20. Chen, J.; Hou, S.; Deng, F.; Chen, Z. A bidirectional multi-port DC-DC converter integrating voltage equalizer. In Proceedings of the 2015 IEEE 6th International Symposium on Power Electronics for Distributed Generation Systems (PEDG), Aachen, Germany, 22–25 June 2015; pp. 1–6. [Google Scholar]
  21. Zhou, M.; Zhai, J.; Li, G.; Ren, J. Distributed dispatch approach for bulk AC/DC hybrid systems with high wind power penetration. IEEE Trans. Power Syst. 2018, 33, 3325–3336. [Google Scholar] [CrossRef]
  22. Hansen, A.D.; Michalke, G. Modelling and control of variable-speed multi-pole permanent magnet synchronous generator wind turbine. Wind Energy 2008, 11, 537–554. [Google Scholar] [CrossRef]
  23. Tan, Z.; Li, H.; Ju, L.; Song, Y. An optimization model for large-Scale wind power grid connection considering demand response and energy storage systems. Energies 2014, 7, 7282–7304. [Google Scholar] [CrossRef] [Green Version]
  24. Tsao, P. Simulation of PV systems with power optimizers and distributed power electronics. In Proceedings of the 2010 35th IEEE Photovoltaic Specialists Conference, Honolulu, HI, USA, 20–25 June 2010; pp. 389–393. [Google Scholar]
  25. Alonso, R.; Roman, E.; Sanz, A.; Santos, V.E.M.; Ibanez, P. Analysis of inverter-voltage influence on distributed MPPT architecture performance. IEEE Trans. Ind. Electron. 2012, 59, 3900–3906. [Google Scholar] [CrossRef]
  26. Kim, Y.S.; Kang, S.M.; Winston, R. Maximizing power harvest in a distributed photovoltaic system. In Proceedings of the 2012 IEEE International Symposium on Circuits and Systems, Seoul, Korea, 20–23 May 2012; pp. 2275–2278. [Google Scholar]
  27. Shenoy, P.S.; Kim, K.A.; Krein, P.T. Comparative analysis of differential power conversion architectures and controls for solar photovoltaics. In Proceedings of the 2012 IEEE 13th Workshop on Control and Modeling for Power Electronics (COMPEL), Kyoto, Japan, 10–13 June 2012; pp. 1–7. [Google Scholar]
  28. Kharb, R.K.; Shimi, S.L.; Chatterji, S.; Ansari, M.F. Modeling of solar PV module and maximum power point tracking using ANFIS. Renew. Sustain. Energy Rev. 2014, 33, 602–612. [Google Scholar] [CrossRef]
  29. Choi, B.-Y.; Noh, Y.-S.; Ji, Y.-H.; Lee, B.-K.; Won, C.-Y. Battery-integrated power optimizer for PV-battery hybrid power generation system. In Proceedings of the 2012 IEEE Vehicle Power and Propulsion Conference, Seoul, Korea, 9–12 October 2012; pp. 1343–1348. [Google Scholar]
  30. Moghaddam, M.S.; Hajizadeh, A. Control of hybrid PV/Fuel Cell/Battery power systems. In Proceedings of the 2010 Joint International Conference on Power Electronics, Drives and Energy Systems & 2010 Power India, New Delhi, India, 20–23 December 2010; pp. 1–7. [Google Scholar]
  31. Sun, K.; Zhang, L.; Xing, Y.; Guerrero, J.M. A distributed control strategy based on DC bus signaling for modular photovoltaic generation systems with battery energy storage. IEEE Trans. Power Electron. 2011, 26, 3032–3045. [Google Scholar] [CrossRef] [Green Version]
  32. Kim, J.-Y.; Jeon, J.-H.; Kim, S.-K.; Cho, C.; Park, J.H.; Kim, H.-M.; Nam, K.-Y. Cooperative control strategy of energy storage system and microsources for stabilizing the microgrid during islanded operation. IEEE Trans. Power Electron. 2010, 25, 3037–3048. [Google Scholar] [CrossRef]
  33. Konstantinos, F.K.; Alexandridis, A.T. Modular control design and stability analysis of isolated PV-source/battery-storage distributed generation systems. IEEE J. Emerg. Sel. Topics Circuits Syst. 2015, 5, 372–381. [Google Scholar] [CrossRef]
Figure 1. Schematic diagram of photovoltaic panel and wind turbine generator set.
Energies 13 00001 g001
Figure 2. Main topology of the hybrid energy system.
Energies 13 00001 g002
Figure 3. Topological structure of permanent magnet synchronous wind generator system.
Energies 13 00001 g003
Figure 4. Equivalent circuit diagram of photovoltaic cell module.
Energies 13 00001 g004
Figure 5. Topological structure of photovoltaic system.
Energies 13 00001 g005
Figure 6. Equivalent circuit of Sheffield model.
Energies 13 00001 g006
Figure 7. Simulation model of battery.
Energies 13 00001 g007
Figure 8. Topological structure of ship power system integrated with renewable energy.
Energies 13 00001 g008
Figure 9. Experimental platform of photovoltaic power generation system.
Energies 13 00001 g009
Figure 10. Experimental platform of wind power generation system.
Energies 13 00001 g010
Figure 11. Output curve of photovoltaic system.
Energies 13 00001 g011
Figure 12. Output curve of wind turbine.
Energies 13 00001 g012
Figure 13. Comparison of equivalent illumination intensity between the conditions of rolling and without rolling.
Energies 13 00001 g013
Figure 14. Comparative curve of grid-connected current when the ship is rolling.
Energies 13 00001 g014
Figure 15. Comparison of grid-connected active power between the conditions of rolling and not rolling.
Energies 13 00001 g015
Figure 16. Grid-connected current curve after the battery is accessed when the ship is rolling.
Energies 13 00001 g016
Figure 17. Comparative curve of active power between the conditions of non-access battery and access battery.
Energies 13 00001 g017
Figure 18. SOC curve of the battery in the photovoltaic system.
Energies 13 00001 g018
Figure 19. Comparative curve of wind turbine without rolling and rolling at 40°.
Energies 13 00001 g019
Figure 20. SOC variation curve of battery in wind turbine generator.
Energies 13 00001 g020
Table 1. Basic parameters of the ship.
Name of VesselThe Total LengthBreadthDepthWater LineRoute SpeedLoadVoltageMCRCSR
SC4268110 m19.7 m8.5 m6.5 m16.5 kn7400 t400 V1420 kW1200 kW
Table 2. Basic parameters of photovoltaic modules.
Component NameComponent SizeWeightPeak PowerPeak Power VoltagePeak Power CurrentOCVSCCModule Efficiency
YGE2351650/990/50 mm19.5 kg235 W29.5 V7.97 A37 V8.54 A14.4%
Table 3. Basic parameters of wind turbine.
Rated PowerRotor DiameterStart-up Wind SpeedRated Wind SpeedRated SpeedRated VoltageNumber of BladesHeight of HolderWay of Yaw
10 kW7.5 m4 m/s14 m/s260 r/min0.38 kV39 mFixed yaw
Table 4. Simulation parameters.
ParametersParameter Values
Power of diesel generator set2 MW
Network voltage0.38 kV
Grid frequency60 Hz
Battery capacity600 Ah
Rated wind speed14 m/s
Rated voltage of DC bus380 V
Rated power of wind turbine10 kW
Rated power of photovoltaic system25 kW

