1. Introduction
Companies distributing energy are confronted with the challenge of supplying energy to their customers in the most efficient way. This requires reducing as much as possible the energy loss that arises from the distribution network malfunctions, the irregularities in the supply points, or the fraudulent behavior of their customers. The latter two factors, known as Non-Technical Losses (NTL), may account in electricity distribution for up to 40% of the total energy distributed in some countries [
1].
Society is negatively impacted by NTL: illegal connections and manipulation of the network, or meter tampering, are dangerous operations that not only can harm the ones that execute them, but also can affect the persons living in the same building, or the technicians that maintain the installation. Moreover, NTL practices represent a prejudice with respect to the rest of consumers, since the energy losses influence the computation of reference tariffs, which in reality implies that non-fraudulent customers are paying for fraudulent customers. In the industrial sector, NTL practices represent an unfair competition: companies committing NTL can reduce costs, in comparison with companies that legally pay their energy consumption.
This paper reports on a running project for the detection of meter NTL due to meter malfunction or manipulation between Naturgy, one of the leading energy providers in Spain, and the group PADS-UPC from Universitat Politecnica de Catalunya. During the last 5 years, a system to continuously learn and detect NTL has been developed in the context of this collaboration. The core of system developed is a supervised machine-learning project: it learns a predictive model from cases of NTL, extracted from historical campaigns (a campaign is a group of operations, i.e., visits to the customer installation done by technicians that aims at detecting frauds, and correct other type of problems in the installation), and assesses a score to all the customers so that the company can select which ones may incur into NTL. This system has achieved very successful campaigns, helping the company to reduce the gap between the energy distributed and the energy consumed by the customers.
In this paper, we explain a global perspective of our project, to provide the reader a vision of the possibilities of implementing machine-learning techniques in the detection of NTL. We report on the technical information about the system, and how we have mitigated the existing issues of implementing a machine-learning method in this industry sector. Among the challenges to overcome, we highlight classical challenges that one can find in similar data science projects, e.g., incomplete and imbalanced training data that produces dataset shift. We also provide the benefits for the company in terms of knowledge, modernization and especially the improvement of detection of NTL cases increasing the amount of energy recovered by the company. We consider that this work is useful for those that want to implement machine-learning techniques in industrial processes, especially for those that want to build a system to detect NTL in utility companies, since the challenges and information used are similar.
The paper is organized as follows: In
Section 3 we summarize other similar work and the algorithms used in our research. In
Section 4 we explain our system: the data used, the supervised structure and the results in terms of accuracy and energy recovered. Then in
Section 5 we describe from a technical point of view how we developed the NTL system: algorithms and technical considerations, problems, and some solutions are explained. Finally,
Section 6 summarizes the benefits of our system, as well as introduces future work that we consider may improve our system.
2. Technical Background
2.1. Algorithms
The classification algorithms used in this work are the state-of-the-art Gradient Boosting Tree Algorithms XGBoost [
2], LightGBM [
3] and CatBoost [
4].
In addition to that, we also refer to two explanatory algorithms: LIME [
5] and SHAP [
6]. Both are similar algorithms that aim to provide an explanation of the classification of an instance (i.e., the apportion of each feature of that instance to the final score). An initial approach that incorporates the use of LIME in our system can be seen in [
7], where we aimed to improve the campaign generated by our classification model, discarding high-scored customers that could be mistrustful according to LIME’s explanation and human knowledge.
Finally, we also refer to two other techniques: Transfer Learning and Active Learning. Transfer learning [
8] is a methodology that encompasses different techniques that aim to transfer the knowledge acquired in a popular well-known domain to a less known domain. Active Learning is a technique that aims to query an oracle(e.g., a human expert) the label of unlabeled instances with the aim of improving the training dataset, as explained in [
9].
2.2. Metrics
The two metrics that are explicitly referred in this paper are the AUROC (Area Under the Receiver Operating Characteristics) Curve and the PR (Precision-Recall) Curve. Both are metrics that prioritize the position of the labeled instances in a list of predictions, instead of strictly prioritizing the score assigned, like a ranking metric. In [
10] the reader can find a work that compares the two metrics.
3. Related Work
Many examples exist in the literature for the implementation of machine-learning solutions in the energy field. For the specific case of detecting NTL in the system, there exist different approaches, depending on the type of algorithm used (e.g., supervised or unsupervised method) and the type of data used (e.g., the approaches depend on the granularity of the consumption records).
3.1. NTL in the Literature
If we focus on the contributions that approach the problem of detecting NTL using a supervised system, there is [
11] that uses Support Vector Machines to detect NTL, and in [
12] we can see an update of the previous work in which the addition of Fuzzy Rules improves the detection system.
In [
13,
14,
15] we can see three examples of using neural networks to detect NTL. An interesting approach that differs slightly the approximation of the classical supervised algorithms is the Optimal-Path Forest Classifier [
16]: this graph approach is seen in several works ([
17] or [
18]). Special attention deserves [
19], whose approach to detect fraud and NTL shares many common features with our work (e.g., it is also implemented in Spain, and uses Gradient Boosting models).
In addition to the supervised examples, there are also many different unsupervised approaches to detect NTL in the literature. The typical technique is the clustering method, seen in [
20] or [
21], but we can see other approaches such as [
22] that uses unsupervised neural networks (Self-Organizing Maps). A different technique is seen in [
23] or [
24], two examples of using statistical process control method in the detection of anomalies from a more industrial process control point of view.
Despite the fact that the more classical machine-learning approaches use supervised and unsupervised methods, we can see other alternatives in the literature. For instance, in [
25] there is an example of an expert system; in [
26] presents an approach for analyzing the load flow, and in [
27] a method based on the sensors of the system is proposed. Due to the increased interest in the implementation of techniques for detecting NTL, in the literature one can find several surveys that overview the field. We highlight two references: In [
1] there is a technical analysis of the challenges seen in different papers such as the dataset shift, the features built and the scalability; in contrast, [
28] describes a collection of different papers about the detection of NTL. Finally, a preliminary version of our system is reported in [
29] in which explain the initial approach of our system.
3.2. Positioning of Our Work in the Literature
The goal of this work is to provide to the reader both a technical and a business point of view of the benefits of implementing a NTL detection system in an energy company, and how this system helps the company to be more sustainable by reducing the gap between Energy Consumption and Energy Distribution. Therefore, there are several considerations to make when we compare our work with many of the related work explained above, especially for the supervised approaches.
To start, this work explains a real case NTL framework in a company, with a long-term vision of the benefits of implementing machine-learning techniques in their operation. Therefore, we do not focus on a specific test scenario to analyze the benefits of the system, but we give a global vision of the framework (e.g., how our system has helped to detect new NTL patterns in new segments). Despite that, it is important to analyze our work not only in the classic terms of accuracy (the campaigns generated have achieved high accuracy in terms of NTL detection), but also it is remarkable how the system has helped the company to understand better the behavior of the fraudulent customers.
It is also worth mentioning that our system is one of the few cases that is implemented in a developed country. There exist other examples such as [
26], which analyzes the NTL typologies and measures to avoid them in the Netherlands, a very developed country, but many of the examples in the literature explains the process of NTL detection in developing countries that, according to the World Bank analysis from 2009 ([
30]), the NTL proportions are much higher (e.g., Brazil, with NTL cases as high as 30% in Rio de Janeiro, or in India, where the state-owned utility companies losses more than 30% of the energy in most cases. Finally, it must be highlighted the fact that the system implemented boost flexibility; It has been used both in small datasets to very large datasets, to detect NTL in different regions or types of NTL. This requirement it is not seen in many of the other work in the literature.
4. Overview of the Framework for NTL Detection
4.1. The Project Starting Point and Requirements
Naturgy is an international utility company that distributes gas and electricity to 6 million and 4 million customers in Spain, respectively (For the sake of simplicity, in this paper we will focus on NTL detection for electricity).
Based on the analysis of the energy billed compared to the energy distributed, and as any other service company, the company could detect energy losses in the distribution, in many cases due to meter malfunction that can arise either from meter tampering but also from failures. The way the company used to deal with this problem was straightforward: generating campaigns based on human analysis and knowledge. These campaigns were simplistic (e.g., by manual application of simple rules), and often not successful. Two examples of these campaigns were:
Visiting customers with several months with no consumption: Having a customer with a large period of no consumption is abnormal, and therefore the company used to generate campaigns to detect fraud in these types of customers. For the company it was not possible to elucidate neither between the fraudulent customer from an empty house (in Spain there are many rural regions that suffer from a gradual depopulation to big cities) nor from a second residence, and therefore the campaigns were unable to detect the real NTL patterns, e.g., discard customers with seasonal consumption (summer apartments) from the rest.
Visiting customers with previous cases of fraud: Since the experience has shown that a percentage of customers that have committed fraud in the past commit it again, the company generated campaigns based on visiting recent cases of fraud to control them closely. The NTL detection for recidivist customers is often successful, but with these campaigns the company cannot detect new NTL patterns (i.e., they are exploiting the current knowledge, but there is no exploration). This can be problematic because the company might not update their knowledge.
For this reason, the company needed a system that would help to detect better the NTL in the company, exploiting the information known but also exploring the possibility of detecting new patterns. We considered that an optimal approach for this problem would be the implementation of a supervised system. Some of reasons are:
Feedback availability: The company already had labeled instances to build the model. In addition to that, the new monthly campaigns will generate new feedback each month, which would help to have a more robust system in the future.
Options: Within the supervised method concept, there are a wide range of well-known algorithms (deep learning, gradient boosting tree models, etc.) and techniques that would fit our requirements.
Autonomous: The supervised method can be easily automatized. It would help to achieve agility in the generation of campaigns and, if necessary, would be useful in case the stakeholder needed to do the campaign on its own.
Flexible: The supervised system learns patterns from labeled instances. Therefore, depending on the data provided to the algorithm, the resulting learned model is different. This fit the characteristics of the company, where it has many different customers (from small apartments to industries, from).
Easy to understand: Even though the stakeholder would not be a data science expert, the nature of representing the customers with features and that we are learning patterns from the past to apply at the present is easy to understand for a layperson. It would help the stakeholder to collaborate into the process, allowing use of all its human knowledge easily.
4.2. The Information Available
With the aim of representing as well as possible the customers and their behaviors, we have used different sources. The resulting features can be partitioned into different group as described below.
Consumption data contains information of the energy consumed by the customer. It includes meter readings and billing extractions, as well as other information such as the consumption during a period of time (Customer consumption is reported monthly, although it could also be provided more fine-grained (e.g., daily or even hourly consumption): clearly the more fine-grained description of a customer’s consumption, the richer is the analysis, but also more complex in terms of data manipulation). The information is extracted from an SQL Server of the company, and therefore it is necessary to preprocess the information to guarantee consistency (for instance, removing erroneous meter readings).One can consider that these features should contain the most important information of the profiles, since a behavior change should be reflected in these features.
Static profile data is referred to the characteristics of the customers that do not usually change over time, and it is also extracted from the same company’s database where the consumption is allocated. This information is used both to categorize the customers (e.g., the tariff indicates if the customer is an apartment or an industry) as well as to build features (e.g., the location of the meter is useful to understand if the meter is more or less accessible, information that can be a priori useful in the NTL detection).
Historical operations describe the results of the campaigns arising from our system, as well as other campaigns done using other methods to detect NTL (e.g., the recidivist campaigns) or other type of operations. As with the previous information, this information is extracted from the company’s database and, therefore, it is necessary to preprocess it before using it in the framework. This information is used to extract labeled instances from the system but also to build very important features (i.e., those related to historical cases of NTL).
Contextual Information includes socio-economic information that complements the previous information. Most of this information is not provided by the company, but extracted from external sources; There are some features that are extracted from the company (e.g., the town where the customer lives), but the economical, sociological and climate information of Spain included in the system (e.g., the per capita income of the inhabitants of a town) is obtained from external sources.
4.3. The Process of Non-Technical Loss Detection
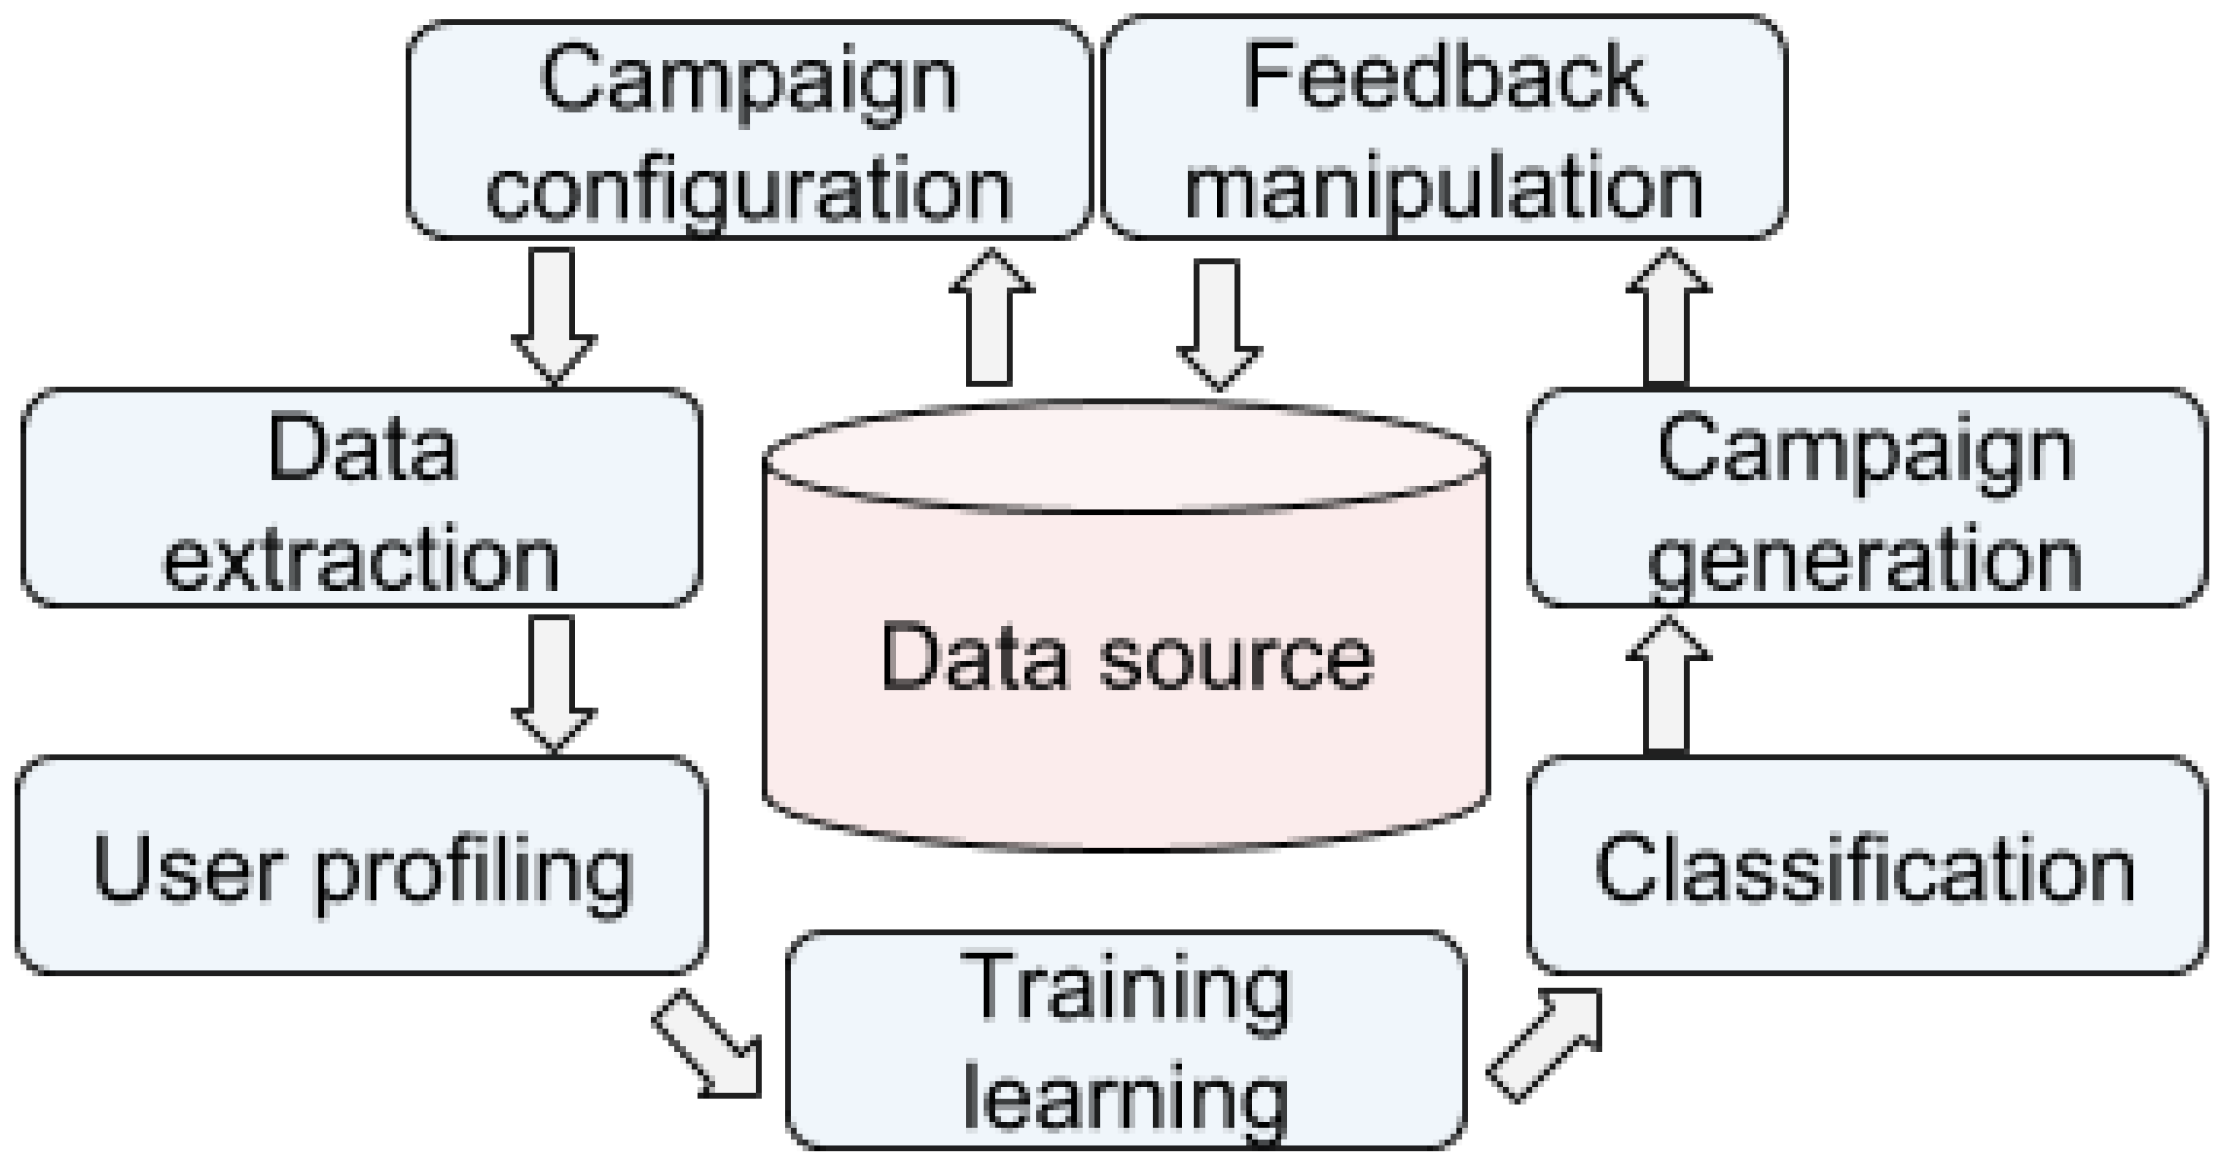
Our method uses the data explained above and a supervised algorithm to create a model that scores the customers (see
Figure 1):
Campaign configuration: We choose the characteristics of the campaign that is going to be generated (e.g., the region, the tariff, among other factors).
Data extraction: We extract all the data to create the profiling variables.
User profiling: A vector of values that defines the customer profile in the present, as well as the feedback profiles (i.e., the historical profiles for each month of those customers that meet the configuration) are computed.
Training learning: We create a supervised model with an optimized configuration. To train the model, only the profiles from customers visited in a specific month are used (i.e., if a customer was visited in July 2018, only the profile of that customer in that month is used). Those unlabeled profiles (i.e., profiles from customers not visited in that month) are not usually used (unless in some cases that we implemented Active Learning in our system).
Classification: A calibrated (In principle, the Gradient Boosting algorithms provides calibrated outputs based on the training instances. As we will see in
Section 6, our system needs to improve specific cases in which the system over-estimates the scores) fraud score for customers in the target population is assigned.
Campaign generation: The company creates an N-sized campaign by selecting the N top customers that satisfy the requirements established. This selection not only considers the score computed in the previous stage, but also other factors, e.g., avoid selecting customers visited recently, or avoid putting the focus only in a particular type of customers, among others.
Feedback manipulation: When the campaign is performed, its results can be used for future campaigns.
The results of a campaign can be summarized as fraud (losses caused by the tampering of the meter installation), incident (NTL that is not considered fraud but a malfunction of the meter), unknown (cases where the installation was not checked, e.g., the customer did not allow the checking), and correct (the meter was checked and there was no problem). Both the fraud and the incident are considered to be positively labeled cases (in both cases the company loses energy), and the correct cases as negatively labeled. Those cases with no result, despite their high probability of being non-technical losses, remain unlabeled.
Our system has achieved very good results in both in terms of accuracy but also in amount of energy recovered, especially considering that the campaigns generated fitted business requirements that did not help to maximize the accuracy in terms of a metric (For instance, the workload of the technicians that checks the meters in a region condition the amount of people visited in that region).
In terms of accuracy, we have achieved up to 36% of precision in campaigns to detect NTL in customers with contract, and we have achieved in several times precision higher than 50% in NTL detection for customers with no contract (Customers without contract are mainly those that had a contract in the past but they resigned it. However, the meter installation is not removed). The accuracy is higher than what we consider the most similar approach in the literature (the system implemented in [
19] for another utility company from Spain whose best model achieves up to 21% of accuracy) and, despite that, there exist other approaches that overtakes our 36% of accuracy, the results (as explained in
Section 3.2) cannot be comparable since in many cases there is a pre-selection of the test dataset, or the region where these systems are implemented has a much higher proportion in NTL in their inhabitants (e.g., [
11] where the NTL system is analyzed in 3 cities with an estimated fraud activity of 35% from Malaysia, an estimation much higher than the estimated fraud in Spain (According to the World Bank, in 2014 Spain had an electric power transmission and distribution losses lower than 10%, a figure that includes all types of NTL, also the transmission and distribution losses that are not meter related)).
In terms of energy recovered, despite that due to legal reasons it is difficult to recover all the energy from the NTL detected, (e.g., the current legal setting restricts the company to bill the customer for the energy recovered for at most one year from the time the NTL was detected), we also achieve good results in our campaigns. For instance, the first four campaigns done to detect NTL in customers with long period of no consumption recovered energy corresponding to two orders of magnitude of the typical consumption of a single customer. Also, in campaigns tailored to customers with no contract but with an historical high tariff, the system was able to rise this proportion to three orders of magnitude (i.e., as much energy as the consumption of several hundred thousand apartments in a year).
5. Technical Description
In this section, we explain key aspects from the process of building the system from the technical point of view, as well as justify the decisions made (e.g., the algorithms used) and the results obtained.
5.1. Step 1: Choosing the Characteristics of a Campaign
Our initial approach consisted on generating a campaign that would encompass all the customers by including different type of features to represent different realities. This initial approach was successful (achieved results as good or better than the equivalent campaigns done in the past by the company) but had an undesired behavior: The system detected NTL only in specific types of customers (e.g., the company has more customers with contract than customers with no contract, but the proportion of NTL instances in the customers with no contract was higher and, therefore, our system focused on detecting NTL in customers with no contract). These results suggested us that it was necessary to segment the customers according to their characteristics:
Customers with no active contract: Since this type of customer absorbed all the learned patterns from the model (i.e., the characteristics of the dataset and the existing biases made that the algorithm only focused on detecting NTL in customers with no contract), we generated a specific campaign for this type of customers (i.e., we trained a model using only customers with no contract, and scored with this model also the current customers with no contract).
Customers with active contract: From the rest of the majority of the customers (around 90% of the customers in the company have an active contract), we sub-segmented the campaign into sub-campaigns depending on the region and the tariff of the customers:
- -
Region where they live: Spain is climatically rich. Therefore, there are colder and less sunny regions that would have different consumption behavior than the rest.
- -
Tariff: The customer has a tariff aligned to her characteristics and behavior. Analyzing aside each tariff is the best way to single out customers by their consumption patterns (e.g., small apartments, big houses, or industries).
Despite that previous segmentation, we needed some extra segmentation due to the existing dataset-Shift (Formally, if
and
denote the real population and labeled (train) fraud distributions, it often happens that
, since
, where
s is the binary condition of visit (i.e., if the customer was visited)) in some segments: the company’s labeled instances (i.e., the results of the campaigns from the last two years) do not reflect faithfully the distribution from the company’s customers, since this strongly depends on the historical success of the campaigns done before in that particular segment. This imbalanced training dataset generates biased models (see for instance
Figure 2). For this specific case of imbalance, we created specific campaigns, insulating these customers that are over/under-represented. That is:
Over-representation campaigns: The over-representation of a type of customer can absorb all the classification capabilities (i.e., that the system only learns to classify that type of customers). A consequence of this is that only the over-represented type of customers receives a high score. To avoid this, isolating these customers and generating a tailored campaign for them avoids the imbalance.
Under-representation campaigns: There are cases where the information from a type of customers is not good enough to detect fraud (e.g., there are no positively labeled cases) and therefore that type remains unconsidered. Generating specific campaigns for this type of customers, even though the labeled information is not extensive, forces the system to detect NTL patterns for this under-representation.
5.2. Step 2 and 3: Generating the Customers’ Profile
With the different information extracted from the different sources, we build the features that profiles the customers. To maximize their quality, it is necessary to consider several aspects: for instance, the features needed to fit the characteristics of each segment. Therefore, we adapted the profiles in different ways:
Contract Status: To represent the customer behavior in accordance with the contract status (active contract or not), we included more consumption-related features for the customers with contract. For the customers without an active contract, as they do not have a recent consumption record, we only included a reduced number of consumption features that focused on their consumption behavior just before they cancelled the contract (with the aim of detecting abnormal behaviors).
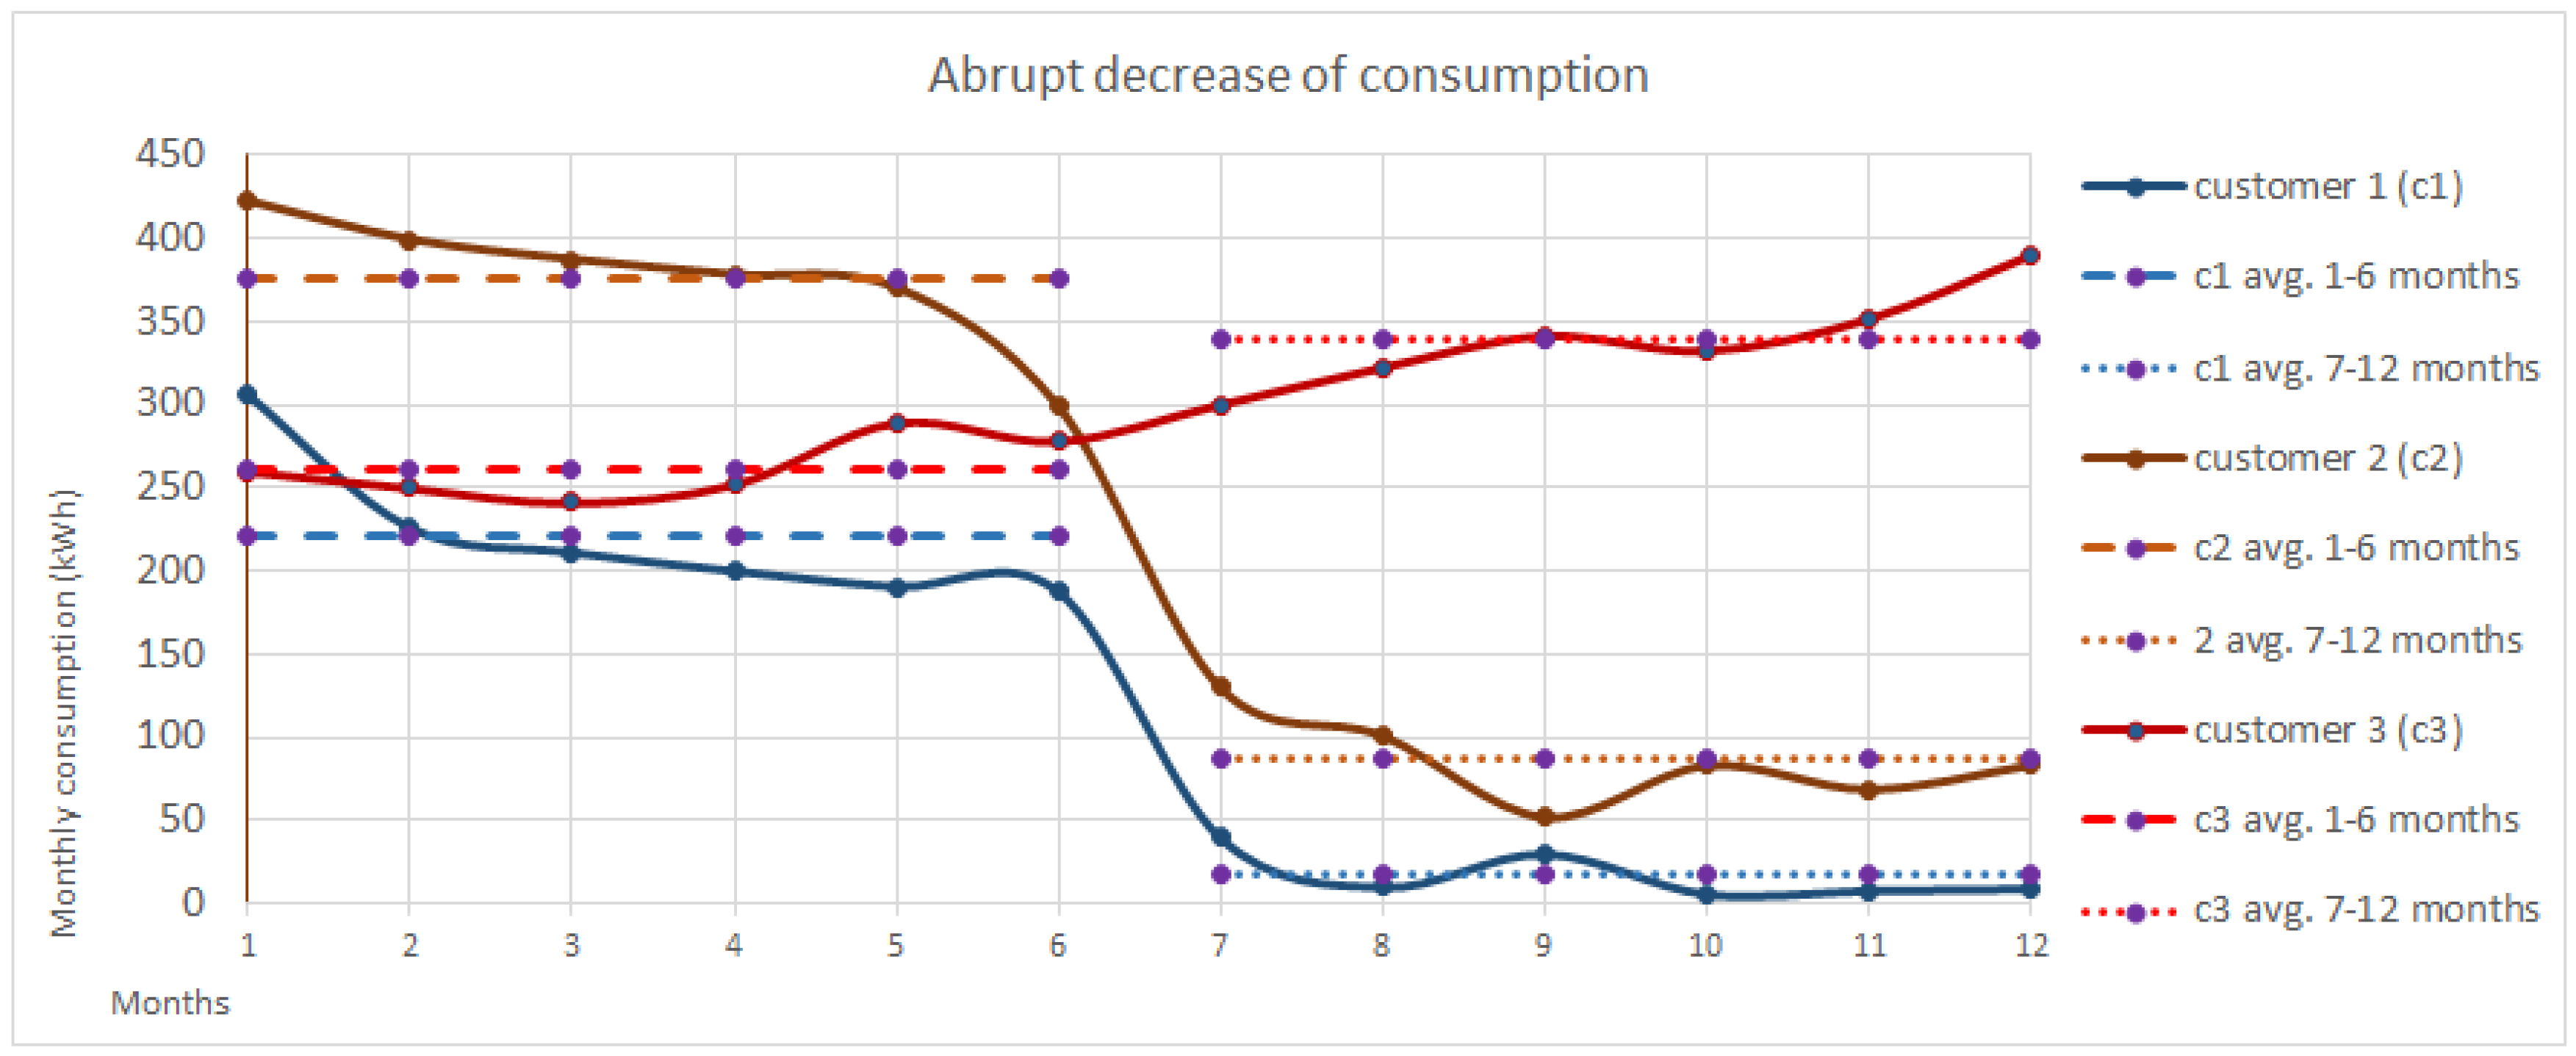
Flexible Features: Instead of delimiting the features to a closed meaning (e.g., considering that the abrupt decrease of consumption (The abrupt decrease of consumption are a family of features that aims at detecting consumption drops in consecutive months.) feature consist on a binary value indicating a reduction of X%), we opted for including the information as raw as possible, e.g., in the previous example, including the raw value of the ratio between the consumption of the last two consecutive months (i.e., representing this behavior with a continuous value). This would give the algorithm more flexibility than using static binary features, guaranteeing that:
- -
The continuous value provides a richer representation of the ratio of consumptions in comparison to a binary feature and, therefore, the partition process from the Decision Tree would be better.
- -
A richer representation of the reality also provides to the system other information that simple binary features cannot. For instance, it could be true that in certain segmentations, a high increase of consumption in two consecutive periods of time would be an abnormal behavior too. The continuous feature can provide this information to the system.
- -
The flexibility would help the system to be successful over time, even though the consumption patterns from the customer change. This can be exemplified with what we consider as low consumption; In the future, the apartments will be more energy efficient, thus what we consider now a low consumption in the future could be the average consumption and, for this reason, including raw information of the consumption instead of binary information (e.g., the customer has consumed less than 2000 KhW in the last 12 months) will make the system more future-proof.
In
Figure 3 there is a visual example that explains the flexibility desired in our system.
Different versions: To boost the information given to the algorithm, different versions of the same concept are provided to the algorithm. This will let more flexibility for deciding which feature can give the maximum information during the training (e.g., there are several abrupt decrease of consumption features, with different nuances; depending on when that consumption drop happened, how many months are considered in the consumption decrease, etc.).
The features need to the represent understandable notions for stakeholders to facilitate the collaboration between the stakeholders and the data scientists. For this reason, we have simplified as much as possible the representation of the reality into the features. For instance, we include temporal information in the definition of a feature to avoid splitting temporally related concepts (e.g., use the feature higher abrupt decrease of consumption during the last X months, instead of using the features higher abrupt decrease of consumption and when was the abrupt decrease of consumption).
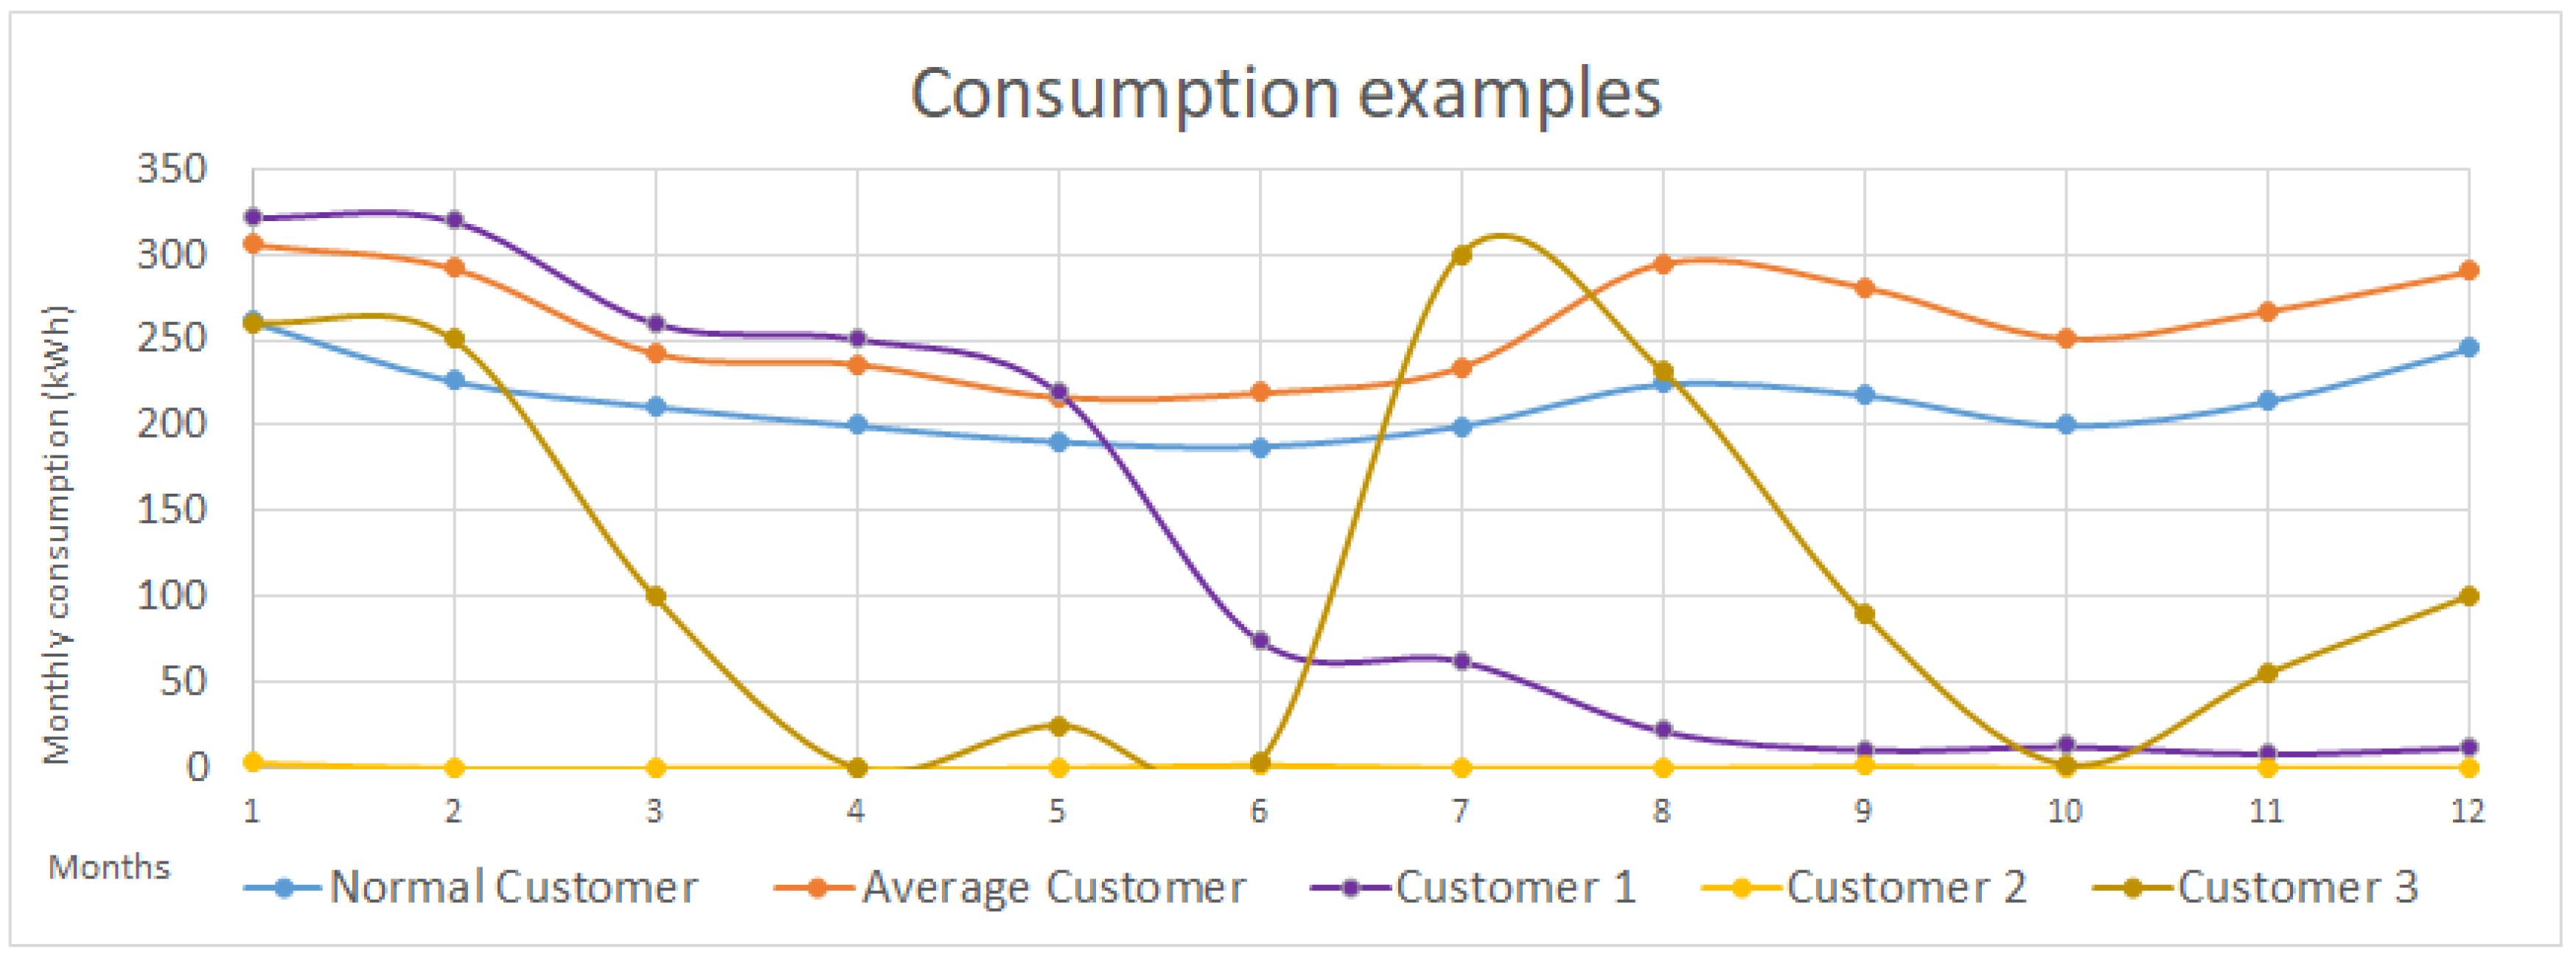
From the consumption data available, we build the features that should define the consumption behavior of the customers. These features are numeric. Some of these behaviors are represented in
Figure 4, and the features are the following:
Raw Consumption: These features refer to the kWh consumed by the customer during a period of time. We include consumption-related information extracted from the difference of meter readings (e.g., the minimum, the maximum and the average monthly consumption of the customer in the last year, or during its last contract), average consumption of the customer computed by the company (the consumption of the customer during the last year, or the previous year), or billing information (e.g., the amount of energy billed by the company during the last 12 months, or the maximum or minimum monthly bill). All this information provides a global vision of the customer (e.g., if the customer tends to consume more than the average).
Consumption changes (the customer against itself): We include several features that compares, through a ratio, the customer consumption in two distinct periods of time, with the aim of detecting a modification in its consumption behavior. More specifically, we include different features that compare two consecutive periods of time (e.g., the ratio between the consumption in the last 6 months and the previous 6 months) or features that compare equivalent periods of time in two consecutive years (e.g., the ratio between the consumption during the last three months and the consumption 12 months ago in the same period of time). This type of features would be useful to reflect the behavior of Customer 1 in the profile, where we can see an abrupt decrease of consumption since the 6th month.
Consumption anomalies (the customer against other customers): As with the previous type of features, this group of features consists on the ratio between the consumption of the customer against other similar customers in the same period of time (e.g., the ratio between the consumption of the customer during the last three months in comparison to the average of similar customers). These features can be useful in customers with very low consumption such as Customer 2 from the graphic: These features would inform the system that Customer 2 is not consuming as one would expect.
Consumption curve: These features aim to represent if the customer’s consumption curve and the average consumption curve in the same period of time are similar. See for instance the comparison between the Normal and the Average Customer; Is it true that, on average, the Normal customer consumes slightly less than the average Customer, but the consumption curve is very similar (winter and summer months are those where there are more consumption), and therefore one would not consider the Normal Customer as suspicious of fraudulent. The opposite is seen in with Customer 3; The customer has an average consumption lower than expected, but not too low (especially if it is compared with Customer 2), but its consumption seems abnormal and erroneous, and therefore a similarity feature (e.g., a feature that compares the normalized consumption curves) would be useful to represent this misbehavior.
The static information is used both to segment the customers (e.g., the tariff) and to generate features. Some of these features are categorical (LightGBM and Catboost support this type of feature, but for XGBoost it would be necessary to one-hot encode them). Some of the features introduced in the system are:
The tariff of the customers: The amount of energy required as well as if there is hour discrimination determines the tariff of the customer. This feature is important to segment the customers according to their characteristics, but are usually irrelevant in the model building process; Despite the fact that each segment has different tariffs, the difference between them in the same segment are minimum.
Where the customer lives: Both non-processed information (e.g., the town where the customer lives) and processed information (e.g., the number of meters in same street where the customer lives) are included in the system.
Equipment characteristics: For instance, the property of the meters (i.e., if the meters are rented or property of the customer).
Most of the features that can be extracted from the visits done by the technicians to the customers are very important for deriving a supervised problem. These features can be summarized as follows:
The aim of including sociological and geographical information is to nuance the final score of the customer; for instance, if we accept the premise that in poorer regions the people may commit more fraud, the system should prioritize the abnormal behaviors from lower incomes. Some examples of the features build with this information are:
Wealth of the town: Several information related to the wealth of the town such as the general income or the unemployment.
The climatology of the region: Each province has assigned a Koppen climate classification.
5.3. Step 4 and 5: Generating an Optimized Model
5.3.1. Choosing the Supervised Algorithm
Between the wide options available in machine learning, we decided to generate binary classification supervised models, and more specifically to use the modern implementations of the Gradient Boosting on Decision Trees (GBM) libraries (i.e., XGBoost, LightGBM, and CatBoost). In addition to the benefits of using a supervised system explained in
Section 4.1), the GBM had other benefits:
Accuracy: These algorithms outperform most of the other options available and are widely used presently.
Fast: These algorithms (specially Catboost and LightGBM, but also XGBoost with the histogram implementation), are faster than the other algorithms, in many cases more scalable and easier to use. Other algorithms were considered but discarded; For instance the Support Vector Machines, used in [
11], when the kernel is not linear, it usually requires significantly more time and resources to build a model), or the Neural Network solutions (seen for instance in [
15]) that demands more processing (e.g., data pre-processing, optimal tuning, etc.), hindering the agility demanded in the requirements.
Feature Selection: The optimal method to generate each campaign would require a feature selection pre-analysis. In our case, to save time, an analysis is done every several months to evaluate current feature importance. For this reason, the fact that GBM algorithm already analyzes the contribution of each feature, a well-tuned model (e.g., by configuring the gamma parameter to achieve a more conservative model, or using a validation set to control the number of trees and the overfitting) would avoid using irrelevant features.
Preprocess: These algorithms fit better with the type of information available in an industrial setting: it is not necessary to normalize the input data and can work with missing values.
Explanation and Campaign Comparison: According to our tests, the binary objective function from boosting algorithms usually assigns better calibrated scores than alternative algorithms. This enables stakeholders to interpret better results, and to compare scores across campaigns. This can be lifted to model evaluation across campaigns, also at the level of feature importance: for instance, second-order effects can be detected, e.g., drifts in the set of top most important features of a campaign.
5.3.2. Tuning and Validating the Model
Our approach to tune the system is by using any type of parameter-tuning search (i.e., a grid search or the randomized search from sklearn library) that automatically tunes the system efficiently using an N-Fold Cross-Validation method. Despite that, it is interesting to complement the automatic search with domain knowledge, to improve the system. For instance, forcing the system to be conservative through the regularization parameters (e.g., forcing the system to be more conservative tuning the L1/L2 regularization), did not improve the accuracy of our model but it made more heterogeneous the characteristics of the top-ranked customers. This has a positive impact in the quality of the learned model.
To validate the model learned, we initially opted for using the AUCROCcurve, a metric that is ranking-dependent. Despite that, the ROC-AUC curve, as explained in detail in [
10], is not the best metric in case of class imbalance, since ROC-AUC rewards both labels in the binary classification (i.e., the score is improved if the positively labeled instances are in the top of the list, and if the negatively labeled instances are in the bottom). Therefore, we changed our validation metric to the Precision-Recall Curve, a metric that only evaluates if the positive instances in our score are on the top of the list.
5.3.3. Bias Considerations
It is necessary to remark that using a Cross-Validation Training-Validation partition test is not enough to achieve good models. As already explained in
Section 5.1, exist many biases that require attention. Any randomized sample from the training dataset would have the same biases that do not exist in the reality (i.e., the dataset shift), thus it is necessary to analyze the model beyond a simple validation-score. Three methodologies that have been useful for our work are:
Human knowledge analysis: Analyzing with the stakeholder both the top-ranked customers and the results of the campaigns can be useful to detect biases (see for instance the examples included in
Section 5.1).
Feature importance: The GBM libraries include the possibility of analyzing the importance of each feature in the model. This help to see a global vision of our model. For instance, our model used to consider important the smart-meter feature, an important information in the past when there were customers with smart meters and customers with old meter, but unnecessary today.
SHAP values: SHAP provides a similar but more complete analysis of the importance of the features in the model, since it analyze, for each scored instance, the apportion of each feature, and therefore we can see if that feature is an indicator of NTL or otherwise.
5.4. Step 6 and 7: Generating the Campaign
When the model is checked and the scores assigned, customers with high score are selected to be visited in a campaign as explained in
Section 4.3. The selection of the customers is based on the score assigned by the model, but other information can also be considered to maximize the success and to fit the company’s needs, e.g., when was the last time it was visited to avoid over-control, or geographical information to visit customers from all the regions are also considered. Our system is fully integrated to the campaign generation method by the company, and therefore the results of our campaigns are automatically included in the data source and can be used in future campaigns as new labeled instances.
6. Recap, Conclusions and Future Work
In this paper, we explain the autonomous supervised system from the utility company Naturgy and the Universitat Politecnica de Catalunya have developed to detect fraud and other types of NTL using machine-learning techniques. This system has helped the company to detect better than before the Non-Technical Losses from their customers, reducing the gap between the energy distributed and the energy billed.
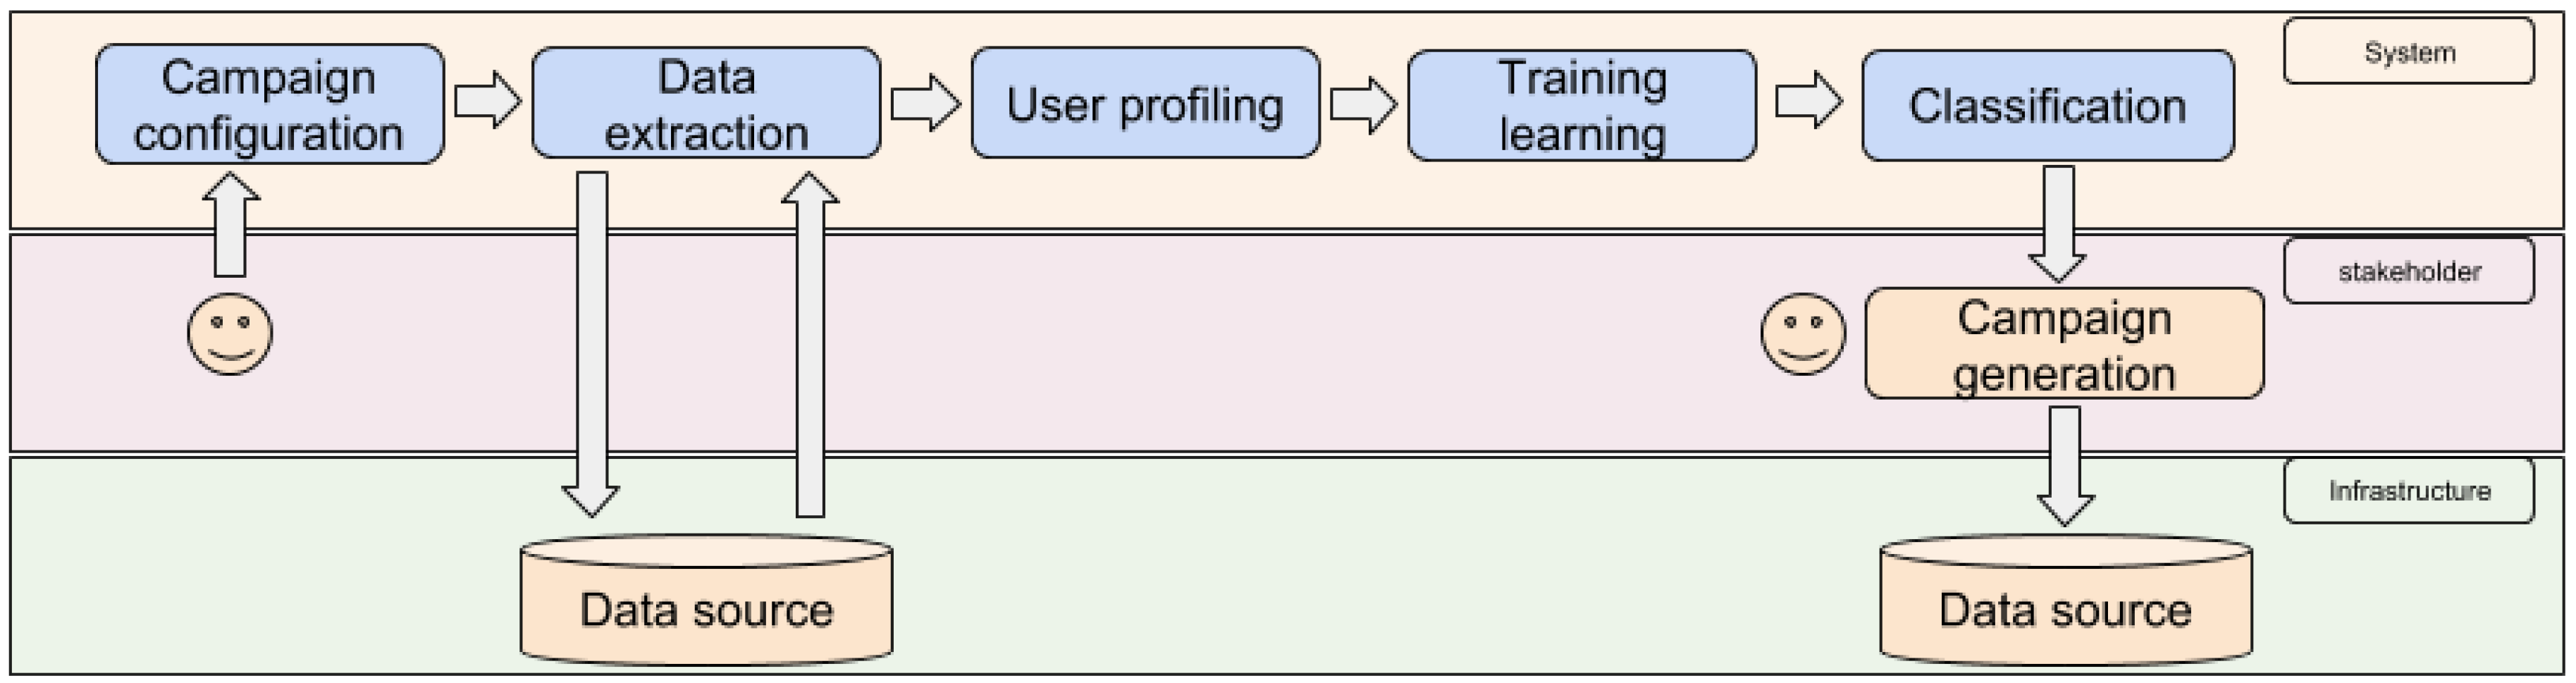
This system helps the stakeholder in different ways. To begin, our system is autonomous, and only demands from the stakeholder the initial configuration of the campaign to be done (i.e., which customers are included in the campaign) and the final selection of the customer from the scores of the system (see
Figure 5). However, our system is also helpful for the stakeholder since it can provide valuable knowledge (e.g., the SHAP information) that can help it to understand better the NTL patterns.
This system is configurable, and therefore it allows the operator to set the region, tariff and contract status to generate different specific model that can be more successful than one global model. This, altogether with the fact that the system is autonomous, allows the company to generate easily multiple campaigns (see
Figure 6). In our case we have been able to generate more than 10 different campaigns each month.
All this makes possible to reach as many areas and customer’s typologies as possible, with the aim of detecting NTL but also to explore new patterns; The company may consider acceptable campaigns that do not bring important business rewards, but at least identifies new NTL cases from zones where there are not historical cases. Likewise, the company considers important to visit periodically all the geographical areas, so that customers are aware of the company’s presence.
In terms of accuracy, the system succeeds in the detection of NTL. In customers without contract, we have achieved very good results, with campaigns higher than 50% of accuracy. In campaigns to detect NTL in customers with contract, the system has reached up to 36% of accuracy. This success is especially valuable in campaigns where the company could not detect NTL, such as the campaigns to detect NTL in customers with long period of 0 consumption (explained in
Section 4.1).
Many of the problems that we have in our system is that our dataset is imbalanced. Despite that, we have mitigated the problems related to the biases through segmenting the campaigns or by feature engineering. It is also true that the biases are still present in our system. Related to this, we are focusing on:
Achieve a more general approach to unbias the model: We are currently analyzing the system manually, e.g., by looking at the important features according to SHAP or the Gradient Boosting Model, and decide with the stakeholder if the correlation correspond to a causal pattern or it is derived from biased labeled instances. With the aim of guaranteeing the autonomy of the system, we should mitigate this problem through a more automatic approach that would unbias current known but also future undetected biases.
Guiding the system to increase the value of consumption features: As we can see in the example (Real output from a validation set of the labeled instances from customer with contract with the most common tariff in the region of Galicia.) from
Figure 7, the system are using interesting features according to our knowledge (e.g., all the features related to the historical visits are important) but we can see that there is no consumption feature (e.g., abrupt decrease of consumption or consumption during the last year), features that one would consider as important. Moreover, the town feature (that should only nuance the final score in most of the instances) is considered the most important feature. Therefore, we are not fulfilling our wish explained in
Section 5.2 to build models where the most important features would be the consumption features.
Most of the information available is not used in our campaigns, but with a proper preprocess they could be included in our system, with the aim of achieving a more robust system. That is:
Use information from other segments: The segmentation is used focus the model to learn patterns on a specific type of customer, and has been useful to generate good models, but some information is discarded that could be useful. For instance, some features are not segmentation-dependent (e.g., the information from the visits in Madrid could be used in the training stage in Galicia). This is known in the literature as transfer learning.
Use the non-visited customers as non-NTL labeled instances: Using Active Learning, we would be able to select non-visited cases as non-NTL labeled instances with the aim of representing better those customers not visited yet non-suspicious (In each month the company visits several hundreds of customer that consider suspicious of committing fraud or had a problem that demand a visit and, therefore, there are a large amount of customers not visited that would be good representatives of the normal customer).
In addition to the over-estimation of success in our validation set in comparison to the real-world scenarios, we consider that the other main consequence of having bias is that SHAP and LIME provides us explanations that may be trustful, but not useful. This, together with the fact that our initial approach did not consider a priority to avoid features with correlations, makes difficult the utility of the explainer methods. For this reason, it is necessary to implement feature engineering to achieve better explanations.
Finally, we want to improve how we introduce the human knowledge in the system, with the aim of achieving a more robust model. The current involvement of the stakeholders in the system is passive; the knowledge from the stakeholder is introduced as features, and based on the model trained, the SHAP explanations and the results we can analyze if the system has learned what the stakeholder knows. Therefore, we want to involve the human knowledge from a more active point of view (for instance, combining our system with a rule system set by the stakeholder), but guaranteeing the flexibility and the versatility that the system currently has.
Author Contributions
Conceptualization, B.C.-P. and J.C.; Methodology, B.C.-P.; Software, B.C.-P.; Validation, B.C.-P.; Formal Analysis, B.C.-P.; Investigation, B.C.-P.; Resources, J.C.; Data Curation, B.C.-P.; Writing—Original Draft Preparation, B.C.-P., Writing—Review & Editing, B.C.-P. and J.C., Visualization, B.C.-P. and J.C., Supervision, J.C., Project Administration, J.C.; Funding Acquisition, J.C.
Funding
This work has been supported by MINECO and FEDER funds under grant TIN2017-86727-C2-1-R.
Conflicts of Interest
The authors declare no conflict of interest.
References
- Glauner, P.; Meira, J.A.; Valtchev, P.; State, R.; Bettinger, F. The Challenge of Non-Technical Loss Detection Using Artificial Intelligence: A Survey. Int. J. Comput. Intell. Syst. 2017, 10, 760–775. [Google Scholar] [CrossRef]
- Chen, T.; Guestrin, C. XGBoost: A Scalable Tree Boosting System. In Proceedings of the 22nd ACM SIGKDD International Conference on Knowledge Discovery and Data Mining—KDD’16, San Francisco, CA, USA, 13–17 August 2016; ACM: New York, NY, USA, 2016; pp. 785–794. [Google Scholar] [CrossRef]
- Ke, G.; Meng, Q.; Finley, T.; Wang, T.; Chen, W.; Ma, W.; Ye, Q.; Liu, T.Y. LightGBM: A Highly Efficient Gradient Boosting Decision Tree. In Proceedings of the Neural Information Processing Systems 2017, Long Beach, CA, USA, 4–9 December 2017. [Google Scholar]
- Prokhorenkova, L.; Gusev, G.; Vorobev, A.; Dorogush, A.V.; Gulin, A. CatBoost: unbiased boosting with categorical features. arXiv 2017, arXiv:1706.09516. [Google Scholar]
- Ribeiro, M.T.; Singh, S.; Guestrin, C. “Why Should I Trust You?”: Explaining the Predictions of Any Classifier. In Proceedings of the 22nd ACM SIGKDD International Conference on Knowledge Discovery and Data Mining, San Francisco, CA, USA, 13–17 August 2016; pp. 1135–1144. [Google Scholar]
- Lundberg, S.; Lee, S.I. A Unified Approach to Interpreting Model Predictions. arXiv 2017, arXiv:1705.07874. [Google Scholar]
- Coma-Puig, B.; Carmona, J. A Quality Control Method for Fraud Detection on Utility Customers without an Active Contract. In Proceedings of the 33rd Annual ACM Symposium on Applied Computing—SAC’18, Pau, France, 9–13 April 2018; ACM: New York, NY, USA, 2018; pp. 495–498. [Google Scholar] [CrossRef]
- Pan, S.J.; Yang, Q. A Survey on Transfer Learning. IEEE Trans. Knowl. Data Eng. 2010, 22, 1345–1359. [Google Scholar] [CrossRef]
- Settles, B. Active Learning Literature Survey; Technical Report; University of Wisconsin-Madison Department of Computer Sciences: Madison, WI, USA, 2009. [Google Scholar]
- Davis, J.; Goadrich, M. The Relationship Between Precision-Recall and ROC Curves. In Proceedings of the 23rd International Conference on Machine Learning—ICML’06, Pennsylvania, PA, USA, 25–29 June 2006; ACM: New York, NY, USA, 2006; pp. 233–240. [Google Scholar] [CrossRef]
- Nagi, J.; Yap, K.S.; Tiong, S.K.; Ahmed, S.K.; Mohamad, M. Nontechnical Loss Detection for Metered Customers in Power Utility Using Support Vector Machines. IEEE Trans. Power Deliv. 2010, 25, 1162–1171. [Google Scholar] [CrossRef]
- Nagi, J.; Yap, K.S.; Tiong, S.K.; Ahmed, S.K.; Nagi, F. Improving SVM-Based Nontechnical Loss Detection in Power Utility Using the Fuzzy Inference System. IEEE Trans. Power Deliv. 2011, 26, 1284–1285. [Google Scholar] [CrossRef]
- Costa, B.C.; Alberto, B.L.; Portela, A.M.; Maduro, W.; Eler, E.O. Fraud Detection in Electric Power Distribution Networks using an Ann-Based Knowledge-Discovery Process. Int. J. Artif. Intell. Appl. 2013, 4, 17–23. [Google Scholar] [CrossRef]
- Pereira, L.A.M.; Afonso, L.C.S.; Papa, J.P.; Vale, Z.A.; Ramos, C.C.O.; Gastaldello, D.S.; Souza, A.N. Multilayer perceptron neural networks training through charged system search and its Application for non-technical losses detection. In Proceedings of the 2013 IEEE PES Conference on Innovative Smart Grid Technologies (ISGT Latin America), Sao Paulo, Brazil, 15–17 April 2013; pp. 1–6. [Google Scholar] [CrossRef]
- Ford, V.; Siraj, A.; Eberle, W. Smart grid energy fraud detection using artificial neural networks. In Proceedings of the 2014 IEEE Symposium on Computational Intelligence Applications in Smart Grid (CIASG), Orlando, FL, USA, 9–12 December 2014; pp. 1–6. [Google Scholar] [CrossRef]
- Papa, J.P.; Falcao, A.X.; Suzuki, C.T. Supervised pattern classification based on optimum-path forest. Int. J. Imaging Syst. Technol. 2009, 19, 120–131. [Google Scholar] [CrossRef]
- Ramos, C.C.O.; de Sousa, A.N.; Papa, J.P.; Falcao, A.X. A New Approach for Nontechnical Losses Detection Based on Optimum-Path Forest. IEEE Trans. Power Syst. 2011, 26, 181–189. [Google Scholar] [CrossRef]
- Ramos, C.C.O.; Rodrigues, D.; de Souza, A.N.; Papa, J.P. On the Study of Commercial Losses in Brazil: A Binary Black Hole Algorithm for Theft Characterization. IEEE Trans. Smart Grid 2018, 9, 676–683. [Google Scholar] [CrossRef]
- Buzau, M.M.; Tejedor-Aguilera, J.; Cruz-Romero, P.; Gómez-Expósito, A. Detection of Non-Technical Losses Using Smart Meter Data and Supervised Learning. IEEE Trans. Smart Grid 2018, 10, 2661–2670. [Google Scholar] [CrossRef]
- Badrinath Krishna, V.; Weaver, G.A.; Sanders, W.H. PCA-Based Method for Detecting Integrity Attacks on Advanced Metering Infrastructure. In Quantitative Evaluation of Systems; Campos, J., Haverkort, B.R., Eds.; Springer International Publishing: Cham, Switzerland, 2015; pp. 70–85. [Google Scholar]
- Angelos, E.W.S.; Saavedra, O.R.; Cortés, O.A.C.; de Souza, A.N. Detection and Identification of Abnormalities in Customer Consumptions in Power Distribution Systems. IEEE Trans. Power Deliv. 2011, 26, 2436–2442. [Google Scholar] [CrossRef]
- Cabral, J.E.; Pinto, J.O.; Martins, E.M.; Pinto, A.M. Fraud detection in high voltage electricity consumers using data mining. In Proceedings of the 2008 IEEE/PES Transmission and Distribution Conference and Exposition, Chicago, IL, USA, 21–24 April 2008; pp. 1–5. [Google Scholar]
- Spirić, J.V.; Dočić, M.B.; Stanković, S.S. Fraud detection in registered electricity time series. Int. J. Electr. Power Energy Syst. 2015, 71, 42–50. [Google Scholar] [CrossRef]
- Liu, Y.; Hu, S. Cyberthreat analysis and detection for energy theft in social networking of smart homes. IEEE Trans. Comput. Soc. Syst. 2015, 2, 148–158. [Google Scholar] [CrossRef]
- Chen, S.J.; Zhan, T.S.; Huang, C.H.; Chen, J.L.; Lin, C.H. Nontechnical loss and outage detection using fractional-order self-synchronization error-based fuzzy petri nets in micro-distribution systems. IEEE Trans. Smart Grid 2015, 6, 411–420. [Google Scholar] [CrossRef]
- Kadurek, P.; Blom, J.; Cobben, J.F.G.; Kling, W.L. Theft detection and smart metering practices and expectations in the Netherlands. In Proceedings of the 2010 IEEE PES Innovative Smart Grid Technologies Conference Europe (ISGT Europe), Gothenberg, Sweden, 11–13 October 2010; pp. 1–6. [Google Scholar] [CrossRef]
- Xiao, Z.; Xiao, Y.; Du, D.H.C. Exploring malicious meter inspection in neighborhood area smart grids. IEEE Trans. Smart Grid 2013, 4, 214–226. [Google Scholar] [CrossRef]
- Messinis, G.M.; Hatziargyriou, N.D. Review of non-technical loss detection methods. Electr. Power Syst. Res. 2018, 158, 250–266. [Google Scholar] [CrossRef]
- Coma-Puig, B.; Carmona, J.; Gavaldà, R.; Alcoverro, S.; Martin, V. Fraud Detection in Energy Consumption: A Supervised Approach. In Proceedings of the 2016 IEEE International Conference on Data Science and Advanced Analytics, DSAA 2016, Montreal, QC, Canada, 17–19 October 2016; pp. 120–129. [Google Scholar] [CrossRef]
- Antmann, P. Reducing Technical and Non-Technical Losses in the Power Sector. 2009. Available online: https://siteresources.worldbank.org/EXTESC/Resources/Background_paper_Reducing_losses_in_the_power_sector.pdf (accessed on 30 April 2009).
Figure 1.
System structure. Campaigns are generated iteratively. All the process is automatized; The stakeholder configures the campaign, generates the model and assign the scores, and the results are included in the database for future campaigns.
Figure 1.
System structure. Campaigns are generated iteratively. All the process is automatized; The stakeholder configures the campaign, generates the model and assign the scores, and the results are included in the database for future campaigns.
Figure 2.
Real example of the dataset-shift problem between the proportions of the real domain. (customers from Spain with no contract in November 2018) and the labeled instances of the customers with no contract (feedback available from the same type of customer since October 2016); In the region of Madrid the company has more cases of NTL than in any other region, and this made that our system over-estimated the score assigned to the customers in that region. This was solved through a segmentation, generating two different campaigns (Madrid and the rest of Spain).
Figure 3.
Providing to the system the ratio between the consumption of two consecutive periods of time (i.e., 0.07 for the customer 1, 0.023 for the customer 2 and 1.3 for customer 3) instead of a binary feature such as “during the second period the customer consumes lower than 10% of the consumption in the previous period” gives more information and flexibility to the system. The system can determine the proper split in the training stage, and moreover we provide extra information (e.g., that the customer 3 is consuming more in the second period, something that would require an extra feature if we used the binary feature).
Figure 4.
Some examples of different consumption behaviors. The features need to provide enough information to extract as much information as possible from these profiles: Long periods of low consumption (customer 2), abrupt decrease of consumption (customer 1), similar consumption behavior to the expected consumption curve (Normal customer) or an abnormal consumption curve (Customer 3).
Figure 5.
System architecture. Most of the campaign generation process is fully autonomous. The stakeholder only must configure the campaign (i.e., the type of customers) and to select the top N customers desired to be included in the campaign. Our system (in blue) autonomously extracts the information needed, generates the customer profiles, builds a tuned model and assigns the final score to each customer.
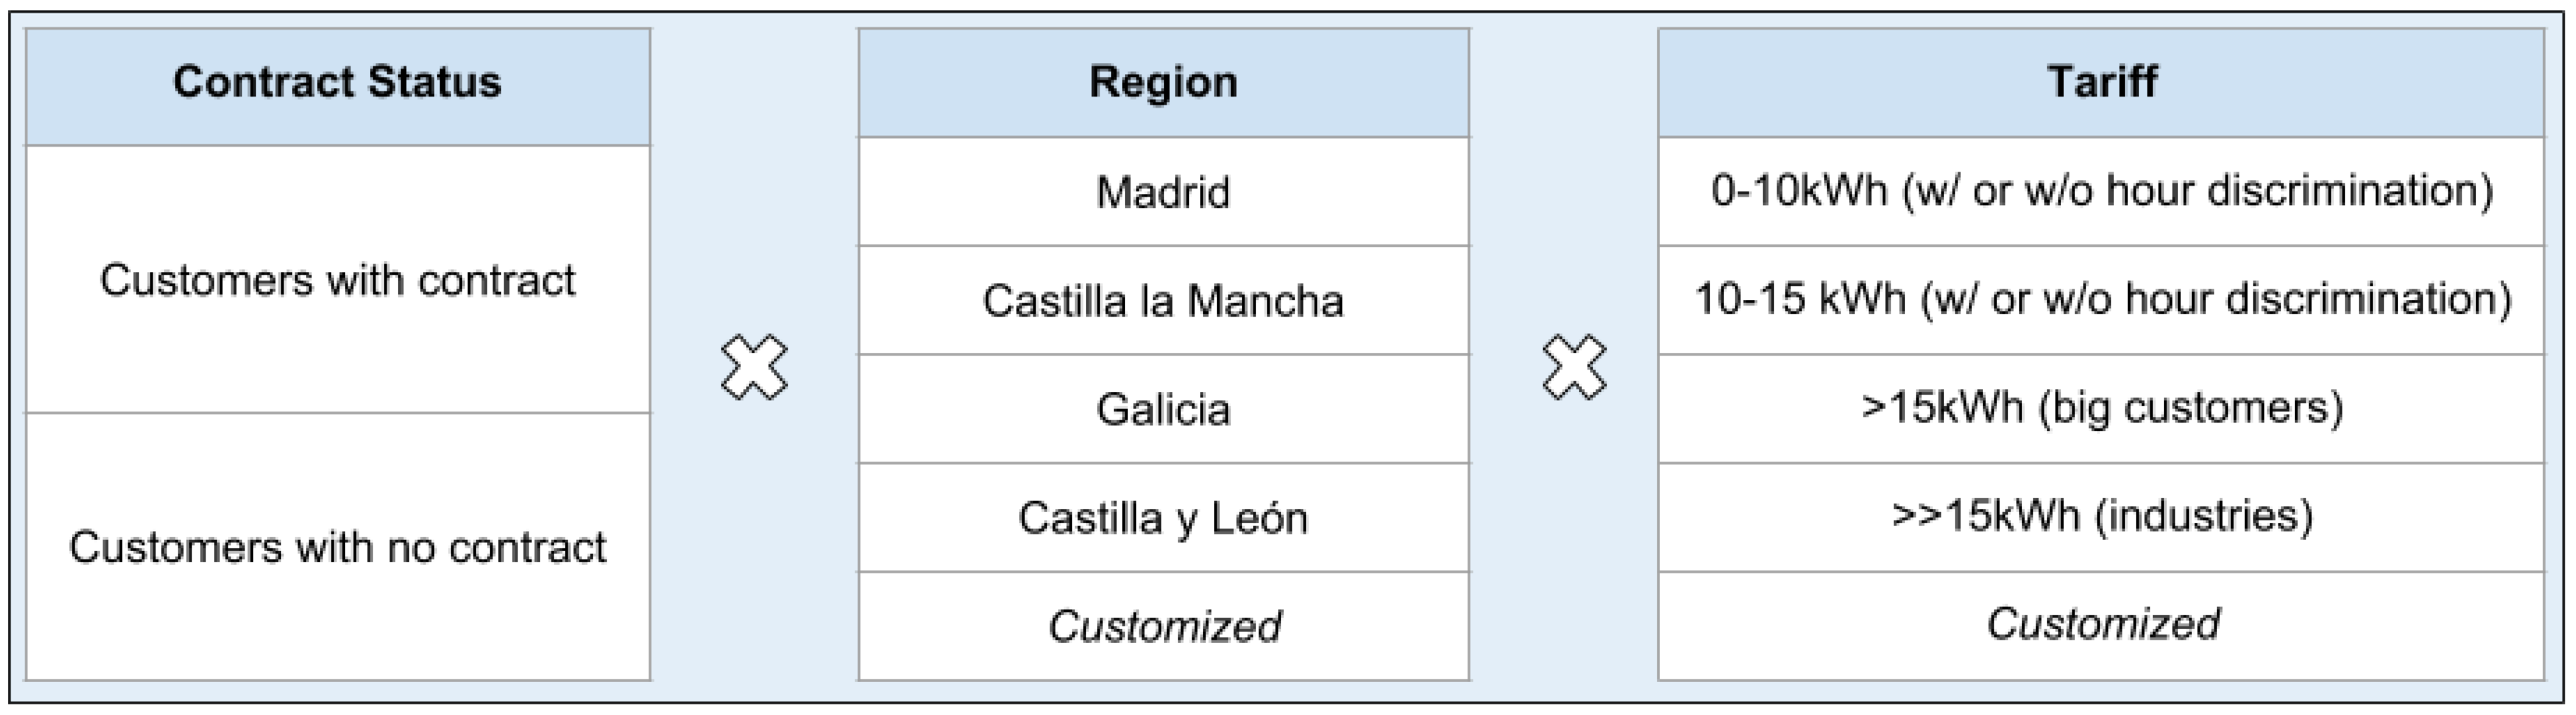
Figure 6.
Our system can be fully configured. The contract status, the region and the tariff of the customer can be set before starting the process, allowing dozens of different configurations, generating successful tailored campaigns.
Figure 6.
Our system can be fully configured. The contract status, the region and the tariff of the customer can be set before starting the process, allowing dozens of different configurations, generating successful tailored campaigns.
Figure 7.
Real example of the 10 most important features according to SHAP despite the fact that we can see features that can be considered to be essential to detect fraud (e.g., those related to the visits); it is true that we are missing consumption-related features. A goal in our system is to reevaluate those features that we think that should be more important than what SHAP shows.
© 2019 by the authors. Licensee MDPI, Basel, Switzerland. This article is an open access article distributed under the terms and conditions of the Creative Commons Attribution (CC BY) license (http://creativecommons.org/licenses/by/4.0/).


