1. Introduction
About 40% of energy-related greenhouse gas emissions in the United States (U.S.) can be attributed to the built environment [
1]. The U.S. Census Bureau estimates that by 2030, 14.5 million new homes will need to be built to accommodate the expanding U.S. population [
2]. The increase in emissions from the building sector worldwide is estimated to rise from 8.6 gigatons of carbon dioxide (GtCO
2) in 2004 to 14.3 GtCO
2 by 2030 [
3]. While during their operational stage highly energy-efficient buildings can have significantly lower greenhouse gas emissions compared to their conventional counterparts, their construction typically involves higher greenhouse gas emissions due to the extra materials and processes needed to build the highly energy-efficient buildings. The main purpose of the research described in this paper was to evaluate how the initial greenhouse gas emissions associated with highly energy-efficient features compare to the greenhouse gas emissions saved in the operational stage of the building thanks to these highly energy-efficient features. The term highly energy-efficient house in the context of this paper denotes buildings that are close to having zero fossil fuel requirements for heating achieved through massive insulation, passive solar design, tight building envelope, and other energy-efficiency measures. Carbon payback was used as the main metric to quantify this relationship.
A case study approach was utilized in our research and a highly energy-efficient home in rural Alaska was selected for the analysis. Alaska is uniquely positioned for this research. Alaska not only sees pronounced impacts of climate change [
4], but it also belongs to leaders in energy-efficient construction due to the cold climate and associated heating requirements [
5]. Alaska, rural Alaska in particular, also faces challenges with respect to energy security due to high costs of energy, low income, reliance on imported fuels, and other factors [
6] which led to several pilot projects involving highly energy-efficient residential construction in this region. One of these homes was selected for the case study in our research.
This research not only adds to the dialogue on the role highly energy-efficient homes could play in reducing greenhouse gas emissions, but it also helps address the topic of reliance on imported fossil fuels in rural Alaska.
Case Study Overview
The case study house used for this analysis is located in in Dillingham, the hub community for Bristol Bay in Southwest Alaska. Dillingham is a rural off-the-road community accessible only by air or sea. In 2015, the population estimate for the city was 2404 [
7]. The average temperature is 1 degree Celsius (C) [
8]. The homeowners built the case study home themselves. The home was built as a prototype to explore the possibilities of a highly energy-efficient home in rural Alaska with little to no need for an external heating source. The home was built to last at a minimum 100 years into the future. The case study home opens up a discussion for how many square feet per occupant is needed to achieve the balance between comfort and high energy efficiency. The net living area of the house is about 54.8 square meters built for a family of two adults and one child, with two bedrooms, one full bathroom, and one and half stories tall. The second floor is an open loft to allow for the open concept feeling. The outside dimensions are 7.3 m by 7.3 m with 71 cm thick walls.
The house falls into the category of a net-zero energy ready building, consuming roughly 3000 kilowatt hours (kWh) annually for all energy needs. This amount is sufficiently small, due to the energy-efficient nature of the construction, the appliances and the homeowner’s lifestyle, that the energy demand could easily be produced through renewable energy. If the annual 3000 kWh energy demand is sourced from renewable sources the house would be considered net zero energy.
Figure 1 shows a photograph of the case study house.
2. Materials and Methods
2.1. Case Study Home
The case study home was built based largely on the Passive House standard, which relates to homes where the internal heat gain supplies sufficient heat so that there is no need for a conventional heating system [
9]. The case study house meets the air tightness requirement of the standard, but exceeds the heat load because the standard penalizes small houses with small footprints. Air tightness was measured at 0.05 air changes per hour (ACH) at 50 pascals and went on record with the World Record Academy as the world’s tightest house [
5].
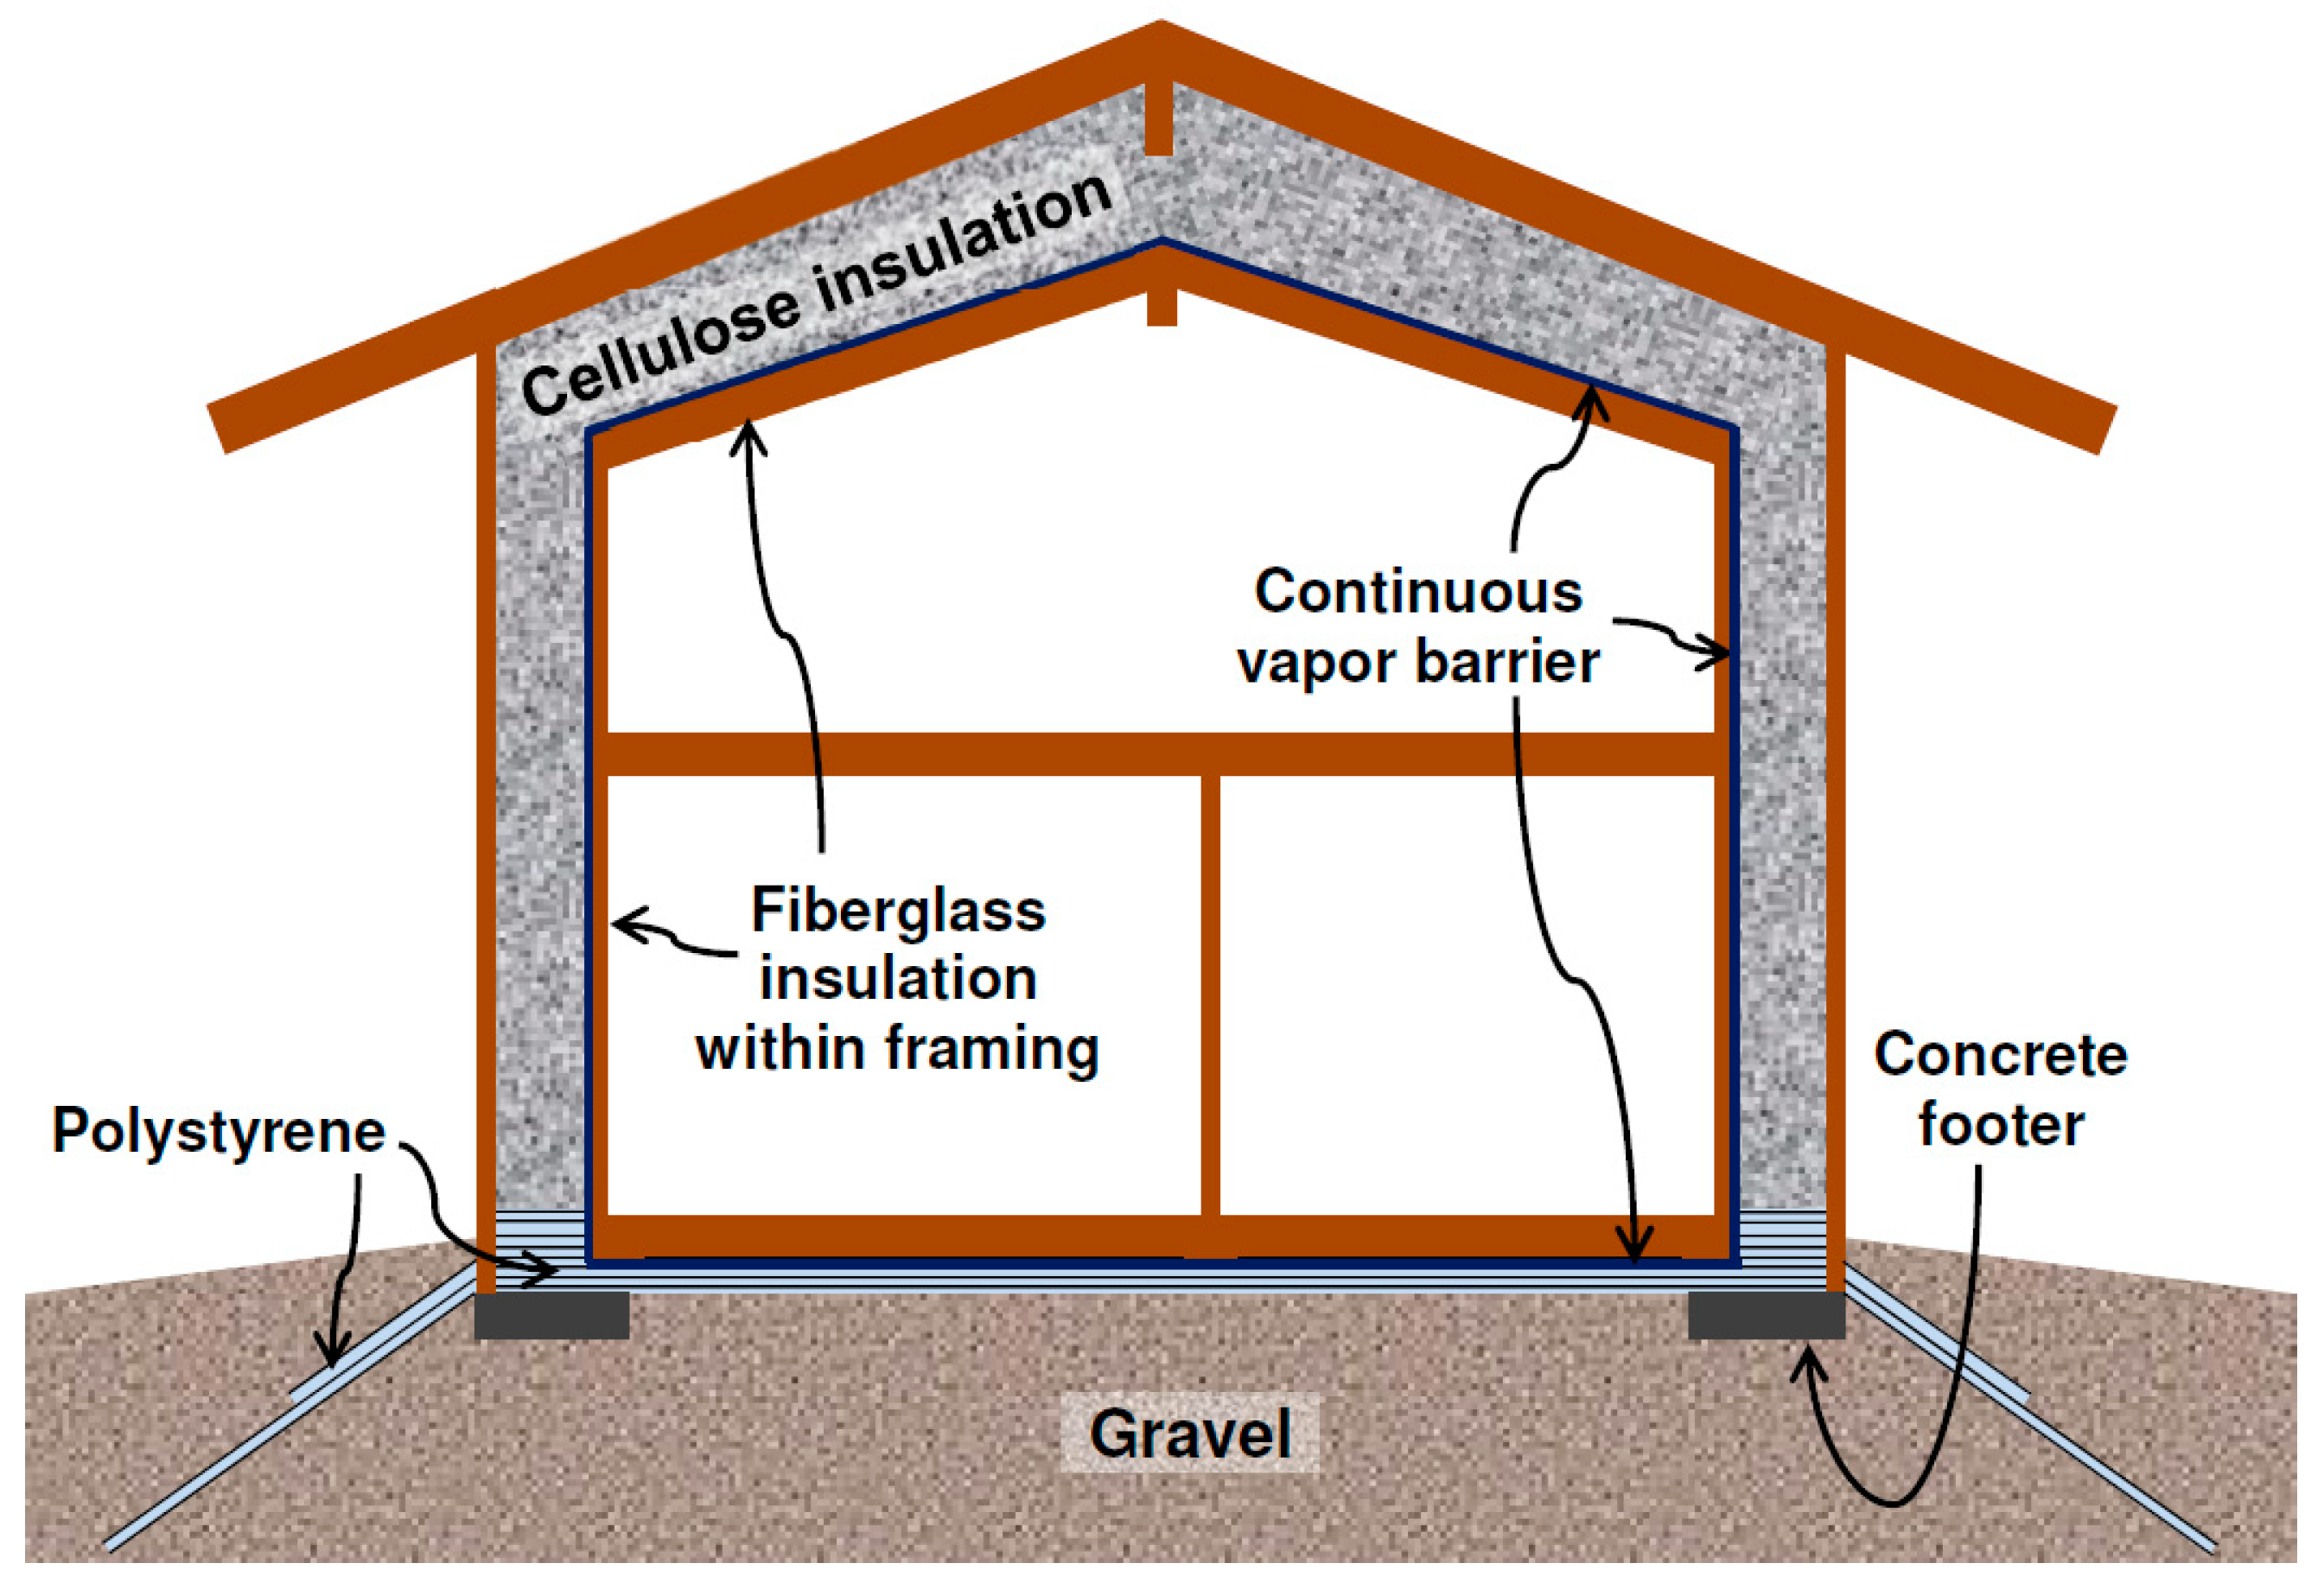
The case study home was built utilizing a “box-in-a-box” technique with a continuous polyethylene vapor barrier surrounding the interior “box”. This construction method allowed for a continuous vapor barrier with minimal thermal bridging (see
Figure 2).
The vapor barrier is on the outside of the interior framing so that the wiring for the interior of the house does not puncture the vapor barrier. The 60 cm cavity between the interior and exterior wall was filled with blow-in cellulose insulation. There is fiberglass insulation within the interior framing. The walls have an R-value Systeme International (RSI) value of about 16 square-meter Kelvin per watt (m
2 K/W). The ceiling of the house has an RSI of about 25 m
2 K/W. See
Table 1 for stratigraphies of the wall and ceiling assemblies.
Other energy efficiency features of the house are triple-pane high-performance windows, a heat recovery ventilator (HRV), low-flow plumbing fixtures, ENERGY STAR appliances and an indoor heat pump water heater. The house is currently heated with an air source heat pump that uses about 600 kWh electrical energy and supplies about 1114 kWh heating energy in a typical year, as determined by simulations [
10]. The simulation results are in reasonable agreement with the actual performance.
It should be noted that the heat pump in this house is used for research purposes and it is not a proven technology for heating in this climate. Instead, an oil-fired heating system is used in most homes in Dillingham. Therefore, an oil-fired heating system will also be assumed for the analysis in this paper. The assumed efficiency of the heating system will be 85% as it is a representative number for residential oil-fired heating systems available and serviced in Dillingham.
2.2. Life Cycle Assessment for Buildings
For this analysis, we chose to use a Life Cycle Assessment (LCA) approach, since this quantitative assessment tool can provide valuable information on environmental impact trade-offs that assists in decision-making [
11,
12,
13,
14,
15,
16]. This method provides users with a summary of environmental impacts from the input and operation of the entire lifespan of a building, starting at resource extraction, manufacturing, construction, operational phase to decommissioning and possibly even quantifying the impacts of material reuse and recycling [
13,
17,
18,
19,
20]. For highly energy-efficient buildings, conducting this analysis can aid in determining the carbon payback and the overall impact over the lifetime of the building. It is only in the last decade that the application of LCA has included buildings and construction materials [
13]. As such the application to the built environment is not seasoned yet, and we came across several gaps in the analysis method, which are further elaborated on in
Section 4. There are a variety of impact categories and units that can be equated when conducting an LCA.
It is difficult to compare LCA building case studies to each other as buildings are site-specific and region-dependent. Local conditions such as microclimate, ecosystem resilience, local infrastructure, and ecological carrying capacity will vary greatly and all play a role in estimating the environmental impacts [
15], as does occupant behavior. For this reason, comparison of case studies often uses theoretical models of the same building in different conditions or the same conditions with different buildings rather than using existing buildings.
The defining characteristics of the case study home, with respect to its energy efficiency, are the super-insulated walls and ceiling. We modeled a conventional house counterpart to the case study home, built to the same specifications, in the same location, but with the walls and ceiling R-values close to the code minimum [
21]. It is impossible to create a less efficient model house as a counterpart to the case study house that would have exactly the same interior due to the energy-efficiency features. For example, the case study home has large window boxes to encompass the 71 cm thick walls (the windows are flush with the exterior side of the wall). The less efficient model house cannot have such window boxes due to its relatively thin walls. Therefore, the goal was to create a less efficient house that has an interior very similar to the case study house and has about the same amount of useful space. The conventional counterpart home model has the same interior dimensions of 5.9 m by 5.9 m. The wall structure is a frame with 38 mm × 140 mm studs (referred to as 2 × 6 frame in the U.S.) with RSI of 3.7·m
2 K /W fiberglass insulation and 25 mm polystyrene foam board on the inside, giving the walls an RSI 4 m
2 K/W value. The ceiling is a frame with 38 mm × 286 mm ceiling joists (referred to as 2 × 12 frame in the U.S.) with RSI 6.7 m
2 K/W fiberglass insulation and 25 mm foam on the inside giving it an RSI 7.2 m
2 K/W value. The air tightness of the house was modeled at 1.0 ACH at 50 Pascals. The conventional model has a 45.7 cm crawl space to create room for the plumbing structures. The case study home has no crawlspace because none is needed; the plumbing is located in the inside framing of the exterior wall without a risk of freezing due to the 60.1 cm thick insulation on the outside of the plumbing.
Analyzing data from both houses allowed the exploration of how CO2 emissions compare between a highly energy-efficient house and its conventional counterpart house specific to rural Alaska. The software used for the LCA was SimaPro (8.05). For this case study, we calculated the climate-change impacts using the Intergovernmental Panel on Climate Change (IPCC) global warming potential (GWP) 100-year time horizon (100a) impact assessment method. The global warming potential is measured as kg equivalents of CO2 (also referred to as CO2 emissions in this paper), meaning the relative impact potential of greenhouse gases compared to CO2. Sequestration of CO2 and the release of biogenic carbon is not included in this method. Because this study looked at one impact category, the climate-change impacts, it is classified as a single attribute LCA. The libraries used are the European Ecoinvent 3 and the Industry data 2.0.
2.3. Details of LCA
For the LCA only those components of the case study house and its theoretical counterpart house that are different were included in the SimaPro model. Walls and ceiling materials are different and thus were includes in the analysis. Since the theoretical house does not have a double wall system, the overall footprint is smaller and thus the roof and foundation areas differ from the case study house. Therefore, roof and foundation materials were also included in the analysis. However, items that were assumed to be identical in both houses, such as the windows, heat recovery ventilator, heating system, non-envelope framing and so forth were not included in this analysis. Furthermore, when calculating the operational greenhouse gas emissions, only the heating energy was considered, as the heating energy use is the only difference when comparing the case study house to its conventional counterpart. Electricity required for appliances and lighting would be the same in both houses and was thus not included. Heating requirements for the theoretical counterpart house were determined using the same simulation as for the case study home (see
Section 2.1.), except the parameters were changed to the ones of the theoretical counterpart house.
2.4. Parameters and System Boundaries
The LCA includes the impact of the building materials, from cradle to warehouse, and the disposal of the materials at the end of the life cycle of the houses. It does not include transportation of the building materials from the warehouse to the building site in Dillingham, nor from the building site to the town landfill or incinerator. We chose to exclude transportation of both the construction materials as well as the heating oil, with the assumption that in calculating the carbon payback their impacts approximately cancel out. The analysis additionally does not include maintenance of the house or the heating system. Differences in on-site energy use during the construction of homes were also not included.
2.5. Materials
We used secondary data from the life cycle inventory libraries for all of the processes in the analysis. It means, as an example, that instead of a sheet of plywood from a given manufacturer used in the house, a sheet of plywood from a different manufacturer available in the library was used for the analysis. In the material list for both houses, items of very small quantities such as sill sealer were not included, assuming the difference in the amount of sill sealer between the houses to be negligible. In the manufacturing phase for the metal roof and the flashing for siding paint was added on as a separate material in the LCA, which excludes the materials and energy required for the application. The treated lumber and plywood was composed of the lumber and plywood and the treatment chemicals as separate items, the application process was not included. In the same line, the impregnation of the glass fiber of the roofing felt with asphalt was not included in the analysis. Lastly, the glued laminated timber for the gluelam beam as well as the concrete for the foundation are not included in the waste disposal scenario as SimaPro only includes materials that are input as kg in the disposal analysis, and those two materials are only able to be input in cubic meters.
2.6. Disposal Scenario
The waste scenario used for this analysis was based on present day disposal options, rather than making a prediction as to what waste disposal might look like 100 years into the future. In 2014, the city of Dillingham had a permit to incinerate all lumber and buried all other construction materials in the landfill [
22]. There was no official system in place for recycling or reusing construction materials.
3. Results
3.1. LCA Results
The building materials, not counting the disposal of them, in the highly energy-efficient home are responsible for 14,728 kg CO2 equivalent (eq). The conventional house is responsible for just over 60% of that with 8844 kg CO2 eq.
This finding relates to a research study Sartori and Hestnes [
23] conducted to compare the embodied and operational energy requirements for 60 houses from low-energy green buildings to conventional buildings. The study did not include recycling or decommissioning of the buildings and focused on energy consumption. The authors divided up the cases by low-energy houses—defined as requiring less than 70 kWh/m
2 annually for heating—and conventional houses. The findings show a trend of low-energy houses having higher embodied energy than conventional ones in each case, and lower operational energy needs. The houses built according to the Passive House Standard also required only 1/3 the total energy needs of a conventional house with only slightly more embodied energy. In our case study the highly energy-efficient home would use the equivalent of 132.5 L of heating fuel per year, while the conventional counterpart home would use 609.5 L per year, so just under 5 times more heating fuel usage in the conventional home. The building materials for the energy-efficient home are responsible for just over 1.6 times more kg CO
2 eq than the conventional home. Our research findings are roughly in line with the Sartori and Hestnes research study findings.
After calculating the Life Cycle Assessment results of all of the building materials together, we separated out the carbon emissions that each home sub-assembly is responsible for. In the highly energy-efficient house, the majority of kg CO2 eq is attributed to the insulation at 46%, followed by exterior walls at 25%, the roof at 20%, and the interior walls and the foundation both at 3%. In contrast, in the conventional counterpart home, the largest carbon emissions share is a close tie between the exterior walls at 40% and the roof at 39%. The insulation is responsible for 15% and foundation 5%. Since the highly energy-efficient building incorporates a double frame system, this distribution of kg CO2 eq is in line with the large amounts of extra insulation that this house encompasses.
3.2. Carbon Payback
Carbon payback calculations can be used to assess how much a building’s envelope influences the heating or cooling of a building [
24]. We apply this method to evaluate how many years it will take to save the extra CO
2 eq emissions associated with the building materials- from cradle to warehouse- of a more efficient home when matched against the CO
2 eq savings from burning less heating oil. When calculating the carbon payback point we had two thoughts about including the disposal phase. As shown later in the results, carbon parity is reached during the lifetime of the house and not after it has been decommissioned. For this reason, we chose to calculate the carbon payback without including the disposal of the materials.
3.3. Calculation and Results
We utilized a simple payback calculation for the CO
2 payback point. The same method, IPCC GWP 2013 (100a), as for the building materials was applied to the heating fuel usage per year for both the case study house and the theoretical house. The difference between CO
2 eq of the materials and the heating oil usage of the highly energy-efficient house and the theoretical house was obtained. To arrive at the carbon payback point, the CO
2 eq. emissions associated with the extra material for the more efficient house were divided by the annual savings in CO
2 eq. emissions thanks to decreased use of heating fuel. The results are detailed in
Table 2 (the lifecycle inventory data used for the LCA is publicly available online via Mendeley [
25]).
The difference in materials used between the highly energy-efficient house and the conventional counterpart is responsible for 5885 kg CO2 eq. The heating fuel that is saved by adding these extra materials to the house is responsible for 1806 kg CO2 eq per year. The carbon payback for the additional building materials required to build a highly energy-efficient house is reached in only 3.3 years after the house is operational.
The carbon payback for the highly energy-efficient house of 3.3 years is a very short time, roughly 1/30th of the lifespan of the building of a minimum of 100 years.
Ramesh et al. [
26] conducted an analysis of LCA case studies of conventional and energy-efficient homes. The survey results indicated that the operating energy use of a building typically falls into 80–90% of total life cycle energy use and the energy related to materials accounts for 10–20%. Thus, the life cycle energy of a building can be significantly reduced by cutting back on operating energy needs through passive and active energy efficiency features, despite increases in building materials that these features may hold. In our case study example, the building materials and the disposal of them are responsible for 18,687 kg CO
2 eq. The heating fuel usage over the house’s projected lifespan of 100 years is responsible for 50,200 kg CO
2 eq. The materials and their disposal then make up only 37% of the total CO
2 eq of both the materials and the heating fuel over the lifetime of the house, and the heating fuel alone makes up 63%. Comparatively, the breakdown in the conventional counterpart house is as follows. The materials and their disposal make up 9083 kg CO
2 eq and the fuel over the theoretical lifespan of 100 years is responsible for 230,800 kg CO
2 eq, therefore the materials make up only 4% of the total CO
2 eq, and the fuel usage over the lifespan of the house is responsible for 96% of the total CO
2 eq. This is a purely theoretical comparison, as it does not consider climate change scenarios, or any maintenance to the house. However, based on this calculation, the conventional home occupies a significantly larger percentage of CO2 eq emissions on heating fuel than the highly energy-efficient house, and as such improving upon energy efficiency of the house is well worth it in the carbon balance equation.
3.4. Disposal of Building Materials
The disposal scenario for the building materials is a theoretical construct, since we are calculating the lifetime of the house to be a minimum of 100 years, and it is hard to gauge what type of disposal, reuse or recycling system will be applied in Dillingham that far into the future. As noted above, at present all lumber is incinerated and all other waste is buried in a landfill. However, in the future the landfill might be converted to a co-generation plant, which would alter the Life Cycle Assessment of this case study significantly. We chose to model the disposal scenario based on the current waste system that the city utilizes. In our disposal scenario if the cellulose insulation is diverted into the landfill, the disposal of the highly energy-efficient house’s materials is responsible for 3959 kg CO
2 eq, almost 17 times what the materials for the conventional house are responsible for, 239 kg CO
2 eq. One of the main differences between the highly energy-efficient house and the conventional counterpart is the addition of 6364 kg of cellulose insulation. In the disposal scenario, the cellulose alone is responsible for 3645 kg CO
2 eq. Landfills in the U.S. are the third largest anthropocentric producer of methane, a large part of it is a byproduct of the anaerobic breakdown of organic materials, such as paper [
27]. Methane gas, or CH
4, has 28 times the Global Warming Potential (GWP) when compared to CO
2 [
28].
4. Discussion
Common concerns with the interpretation of LCA results is the inherent uncertainty and variability [
29]. The uncertainty stems from the difficulty in converting real life situations to LCA data and parameters. Especially for buildings, which are typically made up of over 2000 products and over 60 basic materials [
15], it is difficult to maintain a high level of accuracy in analyzing each single component, utilizing available data. In most instances, we assumed global heterogeneity using generic available data for the materials that present limitations to the local application of the study to rural Alaska. Since our analysis only took into consideration the difference between the case study and its theoretical counterpart, as opposed to looking for absolute results for each individual house, detailed sensitivity analysis was beyond the scope of our research. However, due to a significant difference in the life cycle impact if the cellulose insulation is incinerated versus buried in a landfill, we did complete a sensitivity analysis to determine to what degree the disposal method of the building materials changes the carbon payback period (see
Section 3.4).
This analysis only considered the face value of carbon savings. When considering the viability of a highly energy-efficient house there are a number of other factors to be taken into account, such as economics, occupancy rate, design and layout, indoor thermal comfort of residents, the ease of obtaining the building materials – which in rural Alaska is not straightforward, and other factors that are hard or impossible to quantify in an LCA.
Another challenge we considered was how to treat the potential for carbon sequestration that the cellulose insulation coming from recycled newspaper could be responsible for. A case could be made for a carbon credit, as it locks in carbon for 100 plus years—the lifespan of the house, instead of disposing of the waste newspaper, potentially in a landfill creating a large contribution to GWP gases. Due to the limitations of this analysis we chose to shelve the idea of including carbon sequestration for a future research study.
The building industry, as well as the associated stakeholders, is increasingly paying attention to the negative environmental consequences of buildings [
13]. The immense impact a building can have on the environment, from regionally to globally, is an important consideration during all building stages. In the artic and sub-arctic, concerns over winter heating, air quality and overreliance on oil brings into focus the role energy efficiency in homes can play in reducing these perils and in some instances threats to survival.
This analysis expresses the building materials required and responsible for the energy efficiency of a residence in carbon savings, instead of monetary cost, to highlight the possibilities of reducing the overall carbon contribution of buildings in sub-arctic climates.
In recent studies, the benefit of Distributed Generation (DG) and energy storage capacity of smart homes or buildings has been investigated [
30,
31,
32]. The case study house does not currently include any renewable energy generation. However, the analysis approach utilized in this research could also be applied to compare a home with DG renewable energy that includes storage options with a theoretical counter-part home that does not have the same features. As a way to expand upon the research detailed in this paper, the LCA approach could be used to determine the carbon payback point of producing and storing energy as demand side management. By analyzing a variety of different scenarios, the type and size of the storage method, be it battery, water, sand, could be contrasted against the CO
2 eq of manufacturing and installing the DG and storage systems.
In our analysis of the case study house, the carbon required for the additional building materials of the highly energy-efficient house is paid back in just over three years, after which the home owners essentially reduce their operational carbon footprint by 1806 kg CO2 eq per year when compared to living in a conventional house. While there is an additional upfront cost when viewed through the lens of carbon savings, the decision to build a highly energy-efficient house versus a conventional house seems to be a direct route to improved energy and climate resilience. Determining the carbon payback point as well as comparing the carbon emissions in all building phases of the house to a conventional counterpart house provides researchers, homeowners and building professionals alike information on building homes to meet modern sub-arctic and arctic conditions and concerns. While highly energy-efficient homes are on the extreme end of the spectrum, this case study sets an example of what is possible in Alaska, even in a rural setting.


