Article

Performance Analysis of Air and Oxy-Fuel Laminar Combustion in a Porous Plate Reactor

1
Division of Sustainable Development (DSD), College of Science & Engineering (CSE), Hamad Bin Khalifa University (HBKU), Education City, Doha 34110, Qatar
2
Department of Mechanical Engineering, DHA Suffa University, Karachi 75500, Pakistan
3
Department of Mechanical Engineering, King Fahd University of Petroleum & Minerals (KFUPM), Dhahran 31261, Saudi Arabia
*
Author to whom correspondence should be addressed.
Energies 2019, 12(9), 1706; https://doi.org/10.3390/en12091706
Submission received: 12 March 2019 / Revised: 28 April 2019 / Accepted: 30 April 2019 / Published: 6 May 2019
(This article belongs to the Special Issue Cleaner Combustion)

Abstract

:
Greenhouse gas emissions from the combustion of fossil fuels pose a serious threat to global warming. Mitigation measures to counter the exponential growth and harmful impact of these gases on the environment require techniques for the reduction and capturing of carbon. Oxy-fuel combustion is one such effective method, which is used for the carbon capture. In the present work, a numerical study was carried out to analyze characteristics of oxy-fuel combustion inside a porous plate reactor. The advantage of incorporating porous plates is to control local oxy-fuel ratio and to avoid hot spots inside the reactor. A modified two-steps reaction kinetics model was incorporated in the simulation for modeling of methane air-combustion and oxy-fuel combustion. Simulations were performed for different oxidizer ratios, mass flow rates, and reactor heights. Results showed that that oxy-combustion with an oxidizer ratio (OR) of 0.243 could have the same adiabatic flame temperature as that of air-combustion. It was found that not only does OR need to be changed, but also flow field or reactor dimensions should be changed to achieve similar combustion characteristics as that of air-combustion. Fifty percent higher mass flow rates or 40% reduction in reactor height may achieve comparable outlet temperature to air-combustion. It was concluded that not only does the oxidizer ratio of oxy-combustion need to be changed, but the velocity field is also required to be matched with air-combustion to attain similar outlet temperature.

1. Introduction

Fossil fuels such as furnace oil, coal, and natural gas provide 80% of the world’s increasing energy demand and will continue to provide 60% of the world’s energy needs by 2040 [1]. Although fossil fuel based power plants are well developed and deliver smooth operations relative to the alternative technologies such as renewables, nuclear, and carbon free systems, they have devastating drawbacks in terms of global warming, ozone depletion, and air quality [2]. Among the greenhouse gases from fossil fuel power plants, carbon dioxide (CO2) affects the environment the most. Considering the present situation of the increasing global warming, it is very critical to limit the amount of carbon dioxide to the environment. In order to restrict CO2 emissions, three technologies have been proposed for carbon capture and storage (CCS), namely pre-combustion, oxy-combustion, and post-combustion [3]. In pre-combustion, fuel is converted into carbon dioxide and hydrogen mixture (CO2+H2) and the carbon dioxide is removed from hydrogen and is sent to compression unit. Hydrogen is combusted in the presence of air for power production [4,5]. In post-combustion, flue gases from power plants are passed through selective adsorbents and absorbents to remove carbon dioxide, which is then stored or sequestrated [6,7]. The CO2 emissions can be avoided in pre- and post-combustion technologies; however, NOx would still produce due to nitrogen presence in the air. In oxy-combustion, fuel is burnt in the presence of oxygen, the products include only water vapors, and carbon dioxide, considering one-step reaction, can then easily be separated by condensing the water vapors. By implementing oxy-fuel combustion technology, removal of 98% carbon dioxide from the exhaust is possible [8,9].
Oxy-combustion is an emerging technology, which can be implemented in existing plants with some modifications and new plants [10,11]. The combustion between pure oxygen and fuel results in very high temperature that the current equipment cannot withstand. Consequently, recirculation of carrier gas is required in order to reduce the maximum temperature in the equipment, and use of carbon dioxide as the carrier gas is the economic solution [12,13]. Though oxy-fuel combustion is a very promising technique for CCS, lower adiabatic flame temperature, delayed ignition, flame stability, changes in reaction kinetics, radiative heat transfer and transport properties, and lower burning rate in O2/CO2 environment are some of the major unresolved challenges [14,15,16].
Comprehensive studies have been carried out in order to evaluate potential of oxy-fuel combustion application in the existing systems [10,17,18]. Andersen et al. [19] studied chemical kinetics of methane combustion under oxy-fuel conditions. They concluded that oxy-fuel combustion characteristics are different than those of air-combustion. In their study, Westbrook and Dryer (WD) two-step, and Jones and Lindstedt (JL) four-step reaction kinetics models under O2/CO2 conditions were modified. Their modified mechanisms were validated against experimental data, and they found that CO prediction was improved as compared to the original models. Zhen et al. [15] performed experiments for methane combustion in N2 and CO2 environments, and it was observed that lift-off co-axial velocity was reduced significantly under a CO2 environment, which indicated weaker flame stability. Zhao et al. [20] simulated laminar combustion in porous media, and their results showed better flame propagation velocities and stability as compared to an open space chamber. Kirchen et al. [10] studied ion transport membranes (ITM) for oxygen separation and oxy-fuel combustion. The ITM reactors are also termed as high temperature membrane reactors (HTMR). They concluded that oxygen permeation could be increased by using reactive gas such as methane instead of an inert gas; this would reduce oxygen separation penalties. Habib et al. [21] used ITM for oxygen separation and porous plates for CO2 induction, in a combined ITM-porous plate reactor. It was analyzed that uniform temperature profiles could be achieved by the use of porous membranes that can enhance oxygen permeation and reactor performance. Habib et al. [22] studied oxy-fuel combustion characteristics in a porous plate reactor using methane as the fuel. They varied different parameters like oxidizer ratio (OR) and equivalence ratio (Φ) to study the impact on flame length, flow field, reaction rates, methane depletion, oxygen permeation, and maximum outlet temperature. The advantages of porous plate reactor are as follows:
  • Porous plate permeation is uniform, which helps in controlling oxidizer permeation and local oxy-fuel ratio;
  • Controlled permeation rates can avoid hotspots inside the reactor, which would allow less expensive material for reactor;
  • Permeation rate can be controlled through porosity, material, and geometrical characteristics, which would help in designing for various industrial applications;
  • Currently, permeation rates of HTMR are insufficient and porous plates can mimic HTMR conditions with higher permeation rates for future development [16].
However, for retrofitting purposes comparison with an N2 environment in which radiative heat transfer effects, hydrodynamics, reactor geometry and transport properties are accounted for is insufficient. In the present work, performance analysis for methane combustion in a porous plate reactor under O2/CO2 and O2/N2 environments has been made. For an O2/N2 environment, nitrogen is used as a carrier gas with the same fraction as that of air and is termed as air-combustion. The air-combustion characteristics inside the reactor have been evaluated. For the O2/CO2 environment, CO2 is used as carrier gas, and for the same adiabatic flame temperature as that of air-combustion, the oxidizer ratio has been evaluated by zero dimension analysis. For oxy-fuel combustion, the effects of oxidizer ratios, mass flow rates, and reactor height have been analyzed and compared with air-combustion (base case). In the end, parameters were highlighted that need to be modified to get the same performance as that O2/N2 conditions.

2. Mathematical Modeling

2.1. Adiabatic Flame Temperature

Adiabatic temperature is the maximum temperature of the flame that can be achieved theoretically under adiabatic conditions. It is important to calculate adiabatic temperature when comparing the air-combustion with oxy-combustion. In air-combustion, nitrogen is used and in oxy-combustion, CO2 is used as a carrier gas. For this purpose, single-step stoichiometric reaction was considered for both air- and oxy-combustion that are as follows:
Air-combustion:
CH 4 + 2 O 2 + 7.52 N 2 CO 2 + 2 H 2 O + 7.52 N 2
Oxy-combustion:
CH 4 + 2 O 2 + x CO 2 ( 1 + x ) CO 2 + 2 H 2 O
The adiabatic flame temperature was evaluated using in-house developed code in engineering equation solver (EES) by equating enthalpies of reactants and products, then x (where x is the mole fraction of CO2) will be calculated such that oxy-fuel reaction will have the same adiabatic flame temperature as that of air-combustion. Using the value of x, the oxidizer ratio (OR) was calculated, which represents the percentage of oxidizer in the mixture of oxidizer and carrier gas. The oxidizer ratio can be calculated by the following expression:
OR = mass   flow   rate   of   oxidizer   mass   flow   rate   of   oxidizer   +   mass   flow   rate   of   carrier   gas

2.2. Reactor Specifications

Figure 1 represents the configuration of the porous plate reactor. Reactor has three chambers, and the middle section is the reaction zone where fuel and carrier gas enter and mixes with oxygen. Pure oxygen enters the reaction zone from the top and bottom chambers. The top and bottom chambers are closed at the end, leading all the oxygen to the reaction zone. The reaction begins when the mixture temperature is above the ignition temperature and when the mixing ratio lies within the flammability range. The height of each section is 30 mm, the width is 55 mm, and the reactor length of 500 mm. Two ceramic porous plates are used for oxygen permeation, having length of 150 mm and thicknesses of 1 mm.

2.3. Computational Fluid Dynamics (CFD) Model

The geometry of the reactor was constructed as a 2-D domain using commercial software, gambit 2.4. The dimensions of the porous plate were taken as 150 mm × 1mm. The x-axis is parallel to the length and the y-axis is along the height of the reactor, as shown in Figure 1. The mass, momentum, energy, and species conservation equations were used to calculate pressure (P), velocity (U), temperature (T), and species concentrations (Y). These general conservation equations are as follows:
Continuity:
( ρ U ) = 0
Momentum Conservation:
∇(ρU) = −∇P + μ2U
Energy Conservation:
( ρ C p ) U T = ( k T )
Species Transport:
( ρ U T i ) ( ρ D i , m Y i ) = 0
where k is thermal conductivity and Di,m is the diffusion coefficient for the ith species.
Radiative heat transfer plays a vital role in all combustion processes due to elevated temperatures, i.e., around 2000 K, inside chambers or reactors. In order to incorporate the effect of radiative heat transfer, it requires the knowledge of the temperature distribution, concentration of species, and emissive properties of the medium. The radiative heat transfer lowers the limiting temperature in the reactor and stabilizes the flame. The discrete ordinates (DO) radiation model was implemented in the present study; this model can be expressed as:
d I ( r , s ) d s = K I b ( K + σ s ) I ( r , s )
where I is the total radiation intensity, σ s is the scattering coefficient, and K is the absorption coefficient.
For radiation modeling, the absorption coefficient of the species was evaluated using the domain-based weighted sum of the grey gas model. The internal emissivity value of all walls was taken as 0.8. The Reynolds number was kept low so that the flow was laminar inside the reactor; the laminar finite rate two-step reaction was used for the methane combustion. The reactions can be presented as follows:
CH 4 + 1.5 O 2 CO + 2 H 2 O
CO + 0.5 O 2 CO 2
CO 2 CO + 0.5 O 2
The rate of these reactions can be determined using the modified Arrhenius equation:
k r = A T β exp ( E a R T )
where A is the pre-exponential coefficient, β is the temperature exponent, R is the molar gas constant, and Ea is the activation energy; the values of these parameters are different for air- and oxy-combustion. For air-combustion, a simple two-step reaction kinetics model was used. For the oxy-combustion study, a modified WD two-step reaction kinetics model was used. For validation, both a modified WD two-step and JL four-step kinetics models were implemented as recommended by Andersen et al. [19]. The necessary inputs for the abovementioned kinetics models are listed in Table 1.
The numerical solution is based on the CFD approach, in which a finite volume method was implemented to discretize the governing equations using commercial software fluent 18.0. In the simulation, a staggered grid was used [24]. The steady 2-D flow was simulated while using the double-precision solver. In the pressure–velocity, coupling the semi-implicit method was used. The second order upwind schemes were incorporated for the discretization of momentum and energy equation. The detailed setting regarding the simulation setup can be found in Reference [22]. Oxygen concentration and outlet temperatures were monitored to ensure the convergence. The domain was meshed with quadrilateral elements using gambit 2.4 software, a fine grid was made near walls, porous plates, and at the beginning and end of the porous plates where high gradients were expected. The grid independence study was carried out using the 16,000, 24,000, and 30,000 rectangular elements for meshing. Insignificant variations were observed for 24,000, and 30,000 rectangular elements. Therefore, for reducing computational efforts, 24,000 elements were used for the meshing of the geometry.

2.4. Operating and Boundary Conditions

The walls of the reactor are well insulated; therefore, adiabatic conditions were adopted. Mass flow inlet boundary condition and pressure outlet boundary condition were used for the inlets and outlet, respectively. Porous plates are wear-resistant and alumina-based ceramics with thermal conductivity and fluid porosity of 3.85 W/m·K and 0.55, respectively. The porous plates are considered as a 2D porous zone with viscous resistance and inertial resistance of 2.44 × 10¹³ m−2 and 100 m−1, respectively. All species enter at 1173 K, i.e., higher than the self-ignition temperature of methane. Buoyancy effects have been incorporated by implementing acceleration due to gravity in negative y direction. The methane flow rate is 5 × 10⁻⁴ kg/s for the air-combustion case keeping the stoichiometric ratio. For oxy-combustion, carbon dioxide mass flow rate is varied to achieve oxidizer ratios of OR = 0.2, 0.25, 0.30, 0.35, and 0.40, while methane and oxygen flow rates were kept constant. In order to investigate the effects of mass flow rates, all flow rate values were multiplied by the factor of 1.5, 2, and 3 keeping OR = 0.25. The influence of reactor height was also examined by reducing height to h = 24 and 18 mm, respectively, with the flow rate conditions the same as for case 3. The details of species mass flow rates for all cases are listed in Table 2.

2.5. Experimental Setup

The experimental setup as shown in Figure 2 was used to measure species concentration at different locations inside the porous plate reactor under non-reacting conditions. Gaseous flow rates were varied using mass flow controllers. Three types of gases were used, i.e., N2 as fuel, O2 as oxidizer, and CO2 as carrier gas. Nitrogen (N2) was selected because of non-reactive conditions, and the molecular weight of N2 was comparable to CH4. N2 and CO2 are fed from cylinders into an 800 mm long mixing chamber to ensure homogeneous mixing. The N2/CO2 mixture then enters the reactor as shown in Figure 1. The reactor is equipped with two porous plates of 150 mm length that start from x = 125 mm and end at x = 275 mm. O2 enters from the top and bottom chambers and then passes through porous membranes and mixes with the N2/CO2 mixture. The samples were collected using a 5 mm diameter probe, which can be adjusted at a specific location inside the reactor by axial and transverse movement. The collected sample was then analyzed in a gas chromatograph. Further details of the experimental setup are available in [22]. The gathered data were compared with numerical results for CFD model verification.

3. Results and Discussion

The CFD model for the porous plate reactor was validated in two steps, i.e., with non-reactive measurements from the porous plate reactor [22] and with reactive measurements from the gas turbine oxy-fuel combustor [25]. The local O/N ratio from the experimental data was compared with the CFD results as shown in Figure 3 and was found in good agreement. For the reactive case validation, separate geometry was made and operating conditions were set similar to Nemitallah and Habib [
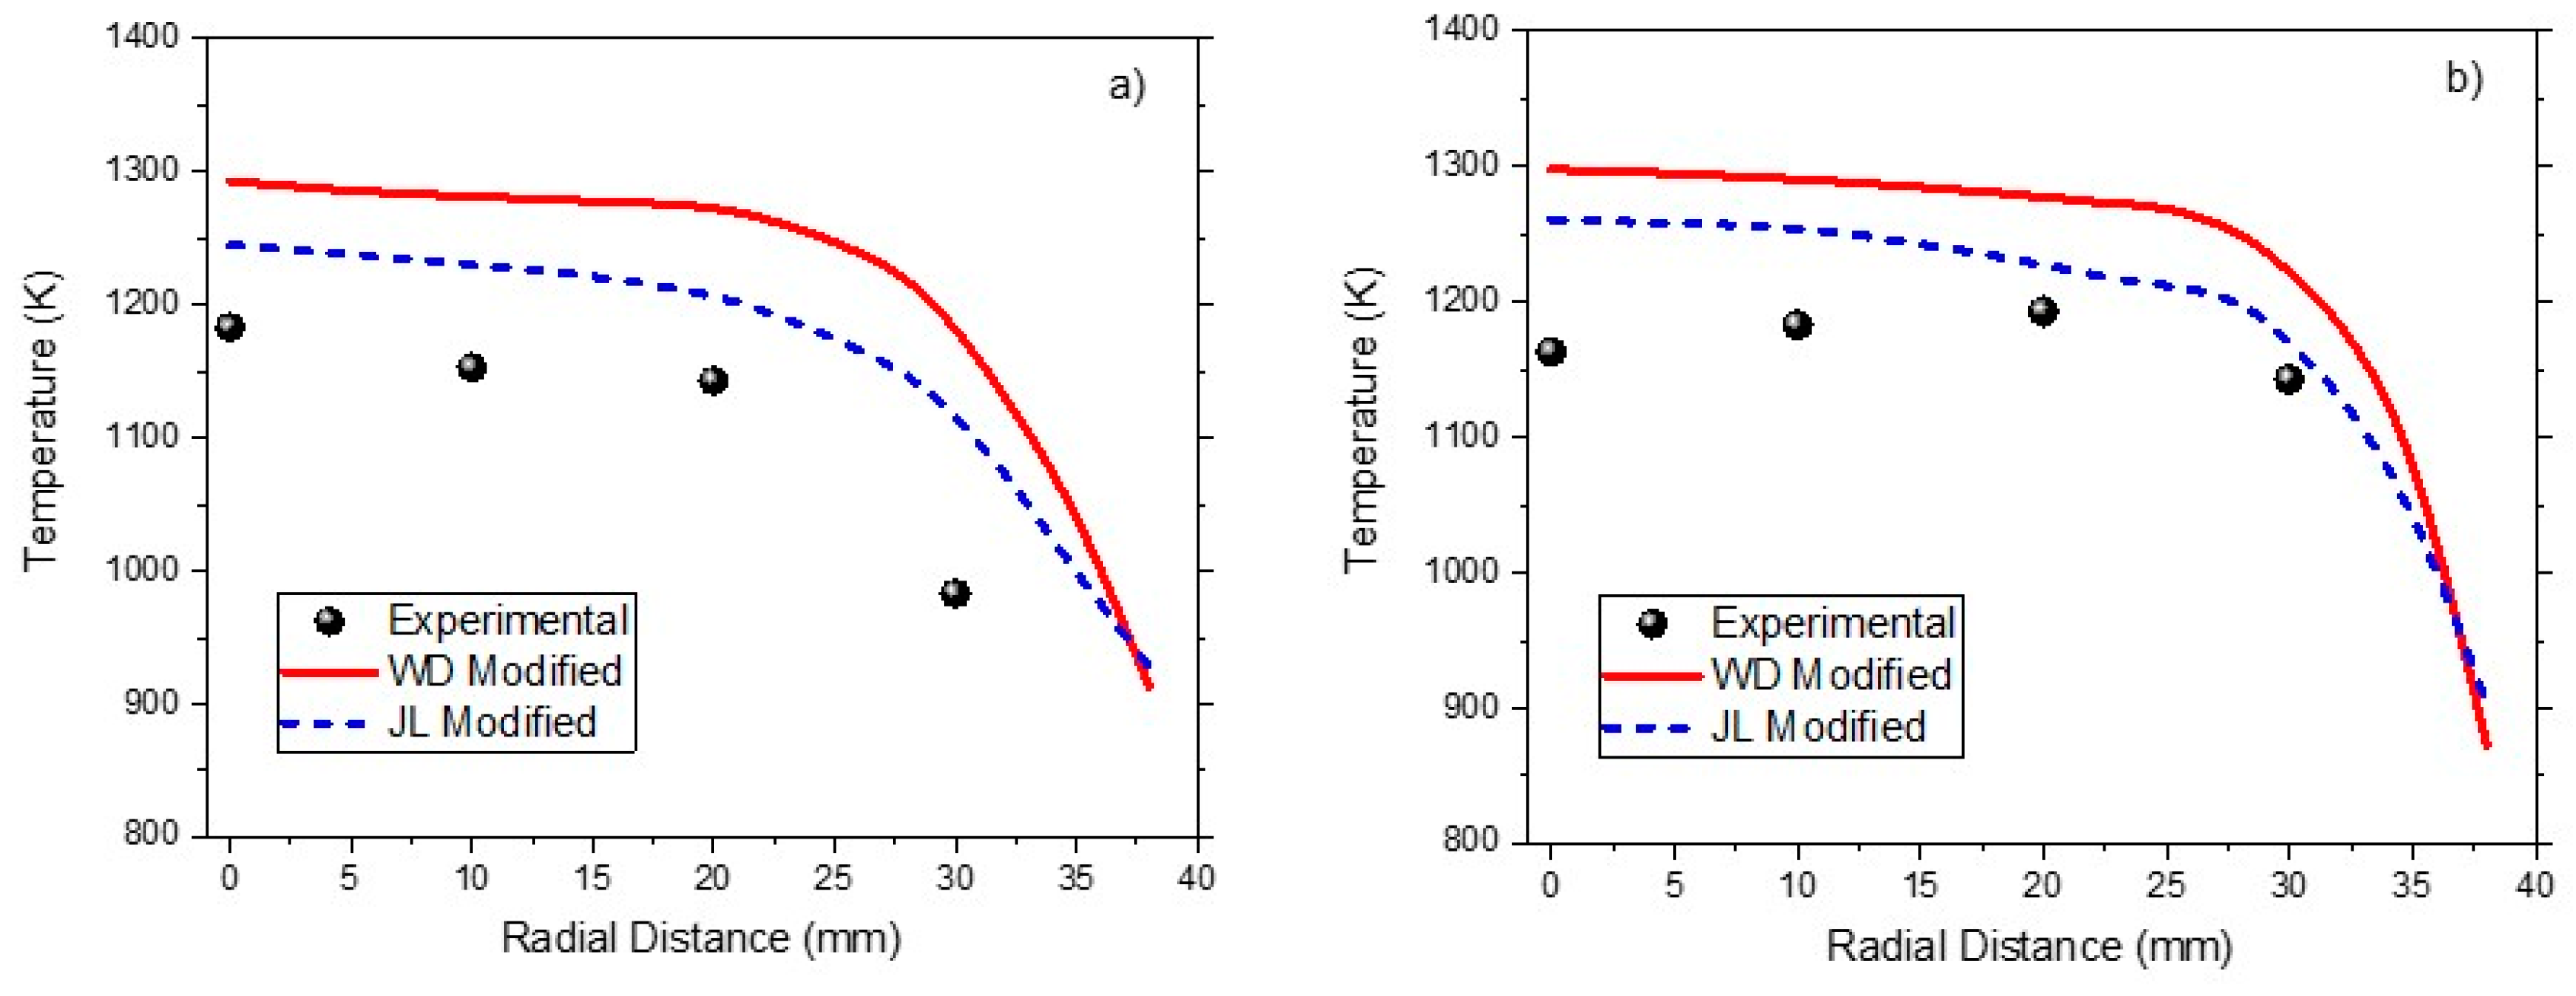
25]. Numerical results with a modified WD two-step and JL four-step reaction kinetics model were compared with oxy-fuel combustor data as shown in Figure 4a,b. It is evident that the four-step model better predicts the temperature profile as compared to the two-step model. The error with the two-step model is less than 12% except for one point, for which it is 20.3%. The error with the four-step model is less than 9%, except for one point, for which it is 13.5%. The deviations could be due to the accuracy of the kinetics model, turbulence model, and radiation model, 2D approximation, discretization, and uncertainties in experimental data. The deviations with the two-step mechanism are in acceptable range and thus used for numerical experiments to save computational efforts.

3.1. Adiabatic Flame Temperature

The adiabatic flame temperature was found to be 2826 K for the air-combustion case that would be the maximum outlet temperature, which can be achieved in the reactor. For oxy-combustion, the oxidizer ratio OR was varied to achieve same adiabatic flame temperature as that of air-combustion and was found to be 0.243.

3.2. Air-Combustion

The average mass fraction variation of species in the reaction chamber is presented in Figure 5. The total reactor length is 500 mm, and porous plates start from x =125 mm and end at x = 275 mm. The methane mass fraction at the inlet is around 0.07, but after x =125 mm, methane starts to deplete as the reaction starts and diminishes at the end of porous plates. Complete methane is converted into carbon dioxide and carbon monoxide, while oxygen concentration begins to rise from zero at the start of the porous plate from where it enters the reaction chamber; the oxygen concentration rises initially and then reduces as the reaction is going on and all the oxygen is consumed. At start, water vapors mass fraction is zero and begins to increase as the reaction takes place and continues to rise until completion of reaction and water vapors mass fraction reaches a constant value. The mass fraction of carbon dioxide starts to rise as the reaction begins; it reaches a maximum value of around 0.02 and then starts to drop as some of the carbon monoxide converts to carbon dioxide. Finally, the nitrogen mass fraction has the constant value at the start but when the porous plate region starts, the oxygen induction from the porous plate into the reaction chamber reduces the overall nitrogen mass fraction.
The maximum temperature in the reactor reaches 2900 K, and the outlet temperature at the exit of the reactor is 2235 K. The temperature variation inside the reactor is shown in Figure 6. The species enters the reactor at 1173 K, and the temperature of the upstream flow rises before the reaction starts, as shown by temperature level 2, i.e., 1400K; this is due to the radiative heat transfer. The region near the top and bottom porous walls has the highest temperature; this is where the combustion begins and the maximum temperature is reached. The centerline temperature is lower than the temperature near the top and bottom walls, so mass weighted average temperature variation is more accurate for study instead of centerline temperature variation.

3.3. Effect of Oxidizer Ratio for Oxy-Combustion

The mass weighted average temperature variation along the ‘x’ axis has been plotted for oxy-combustion with OR ranging from 0.20 to 0.40, and temperature profiles are compared with the air-combustion case, as shown in Figure 7. For oxy-combustion, temperature rises sharply as the combustion occurs at the start of porous plates, i.e., x = 125 mm, where oxygen enters the reactor. The high temperature from the combustion causes upstream temperature to rise due to radiative heat transfer. As the flow temperature reaches the maximum value, it begins to decrease with an outlet temperature in the range of 2000–2050 K due to radiative cooling. The OR = 0.40 has the maximum temperature as compared to OR = 0.20, as it contains less carrier gas, i.e., carbon dioxide. Like in oxy-combustion, in the air-combustion case, temperature rises very slowly; this is because of the different transport properties of CO2 and N2 for convective and radiative heat transfer. Since OR = 0.243 is comparable in terms of adiabatic temperature with air-combustion and is close to OR = 0.25, the reactor outlet temperatures have a significant difference of around 200 K with air-combustion. This is due to fact that air-combustion and oxy-combustion with OR = 0.25 have comparable mass flow rates, but the density of carbon dioxide is higher than nitrogen by 1.57 times that keeps a low-velocity field in oxy-combustion and high-velocity field in air-combustion as shown in Figure 8. Inlet velocity for oxy-combustion varies from 0.32 to 0.68 m/s and inlet velocity for air-combustion is around 0.86 m/s. As the oxygen permeates through porous plates, velocity rises due to added mass flow rates and outlet velocity reaches to 2.45 m/s for air-combustion and 0.9 to 1.9 m/s for oxy-combustion. Higher velocity enhances convection heat transfer and reduces radiation effects on upstream flow, which is quite evident in Figure 7; hence, it raises the outlet temperature in the air-combustion case.
Figure 9a shows species mass fraction variation of methane for OR = 0.20–0.40 along the axial direction. As the OR is varied from 0.20 to 0.40, methane depletion rate increases due to a reduced velocity field in the reaction zone; which causes the residence time and temperature of species at certain point to increase, and combustion occurs faster. Due to this, complete methane depletion occurs at x = 225 mm for OR = 0.40 and at x = 325 mm for OR = 0.20. A higher methane depletion rate and less carrier gas result in higher maximum temperature in the reactor. For air-combustion, the methane depletion rate is lower due to the increased velocity field, and the reduced residence time in the reaction zone, methane diminishes completely at x = 375 mm, i.e., after porous plates x > 275 mm. Figure 9b shows species mass fraction variation of carbon monoxide along the axial direction. In air-combustion, carbon monoxide is produced only as the result of methane combustion; while in oxy-combustion, carbon monoxide is produced by methane combustion and from the disintegration of carbon dioxide at higher temperatures, which is present as a carrier gas. The carbon monoxide mass fraction at the outlet for air-combustion is lower. For oxy-combustion, higher oxidizer ratios lead to higher temperature at which carbon dioxide disintegrates into carbon monoxide and oxygen before the combustion starts, i.e., x < 125 mm. These factors result in peak shift for maximum carbon monoxide from x = 250 mm for OR = 0.20 to x = 200 mm for OR = 0.40. As the carbon monoxide reaches the maximum value, carbon monoxide starts to convert into carbon dioxide. Since for oxy-combustion cases with different ORs, the velocity field is low as compared to air-combustion, all of the carbon monoxide converts into carbo dioxide before the reactor outlet. The CO conversion rate is faster in higher oxidizer ratios. From these results, it is evident that convective effects need to be enhanced by raising the velocity field in the reactor for oxy-combustion cases to meet outlet temperature for the air-combustion case. This can be accomplished by either increasing flow rates or reducing the reactor height h.

3.4. Effect of Mass Flow Rate for Oxy-Combustion

The temperature contours at inlet flow rates (1×, 2×, 3×) are shown in Figure 10. It is noticeable from these contours that mass flow rate increment causes convective heat transfer to dominate over radiative heat transfer and upstream flow becomes cooler for higher inlet flow rates as shown by blue region. The flame length also increases as the flow rates are doubled and tripled. In addition, with higher flow rates, the flame shifts towards the reactor center due to a higher oxygen influx from porous plates.
The mass weighted average temperature variations for different inlet flow rates with fixed OR = 0.25 are shown in Figure 11a. The maximum temperature in the reactor and outlet temperature for different inlet flow conditions are shown in Figure 11b. As the mass flow rate increases, the sweep flow rate increases, enhancing the velocity field and convection heat transfer, which result in higher temperatures at the reactor outlet. The outlet temperature increases from 2034 K to around 2628 K, and the maximum temperature rises from 2855 K to 3056 K when the inlet flow rates are multiplied by a factor of 3. For 1.5× flow rates, the temperature increases to a maximum value and then slightly decreases to 2301 K, which is comparable to air-combustion with 2250 K at the outlet. However, the maximum temperature for 1.5× flow rates is lower than air-combustion due to radiative cooling, which is beneficial for reactor design. For 2× flow rates, the temperature continues to rise and maintains a constant value of around 2480 K and for 3× flow rates and the temperature continues to rise until the end and does not maintain a constant value or decrease, which reflects that the reaction is not complete by the end of the reactor.
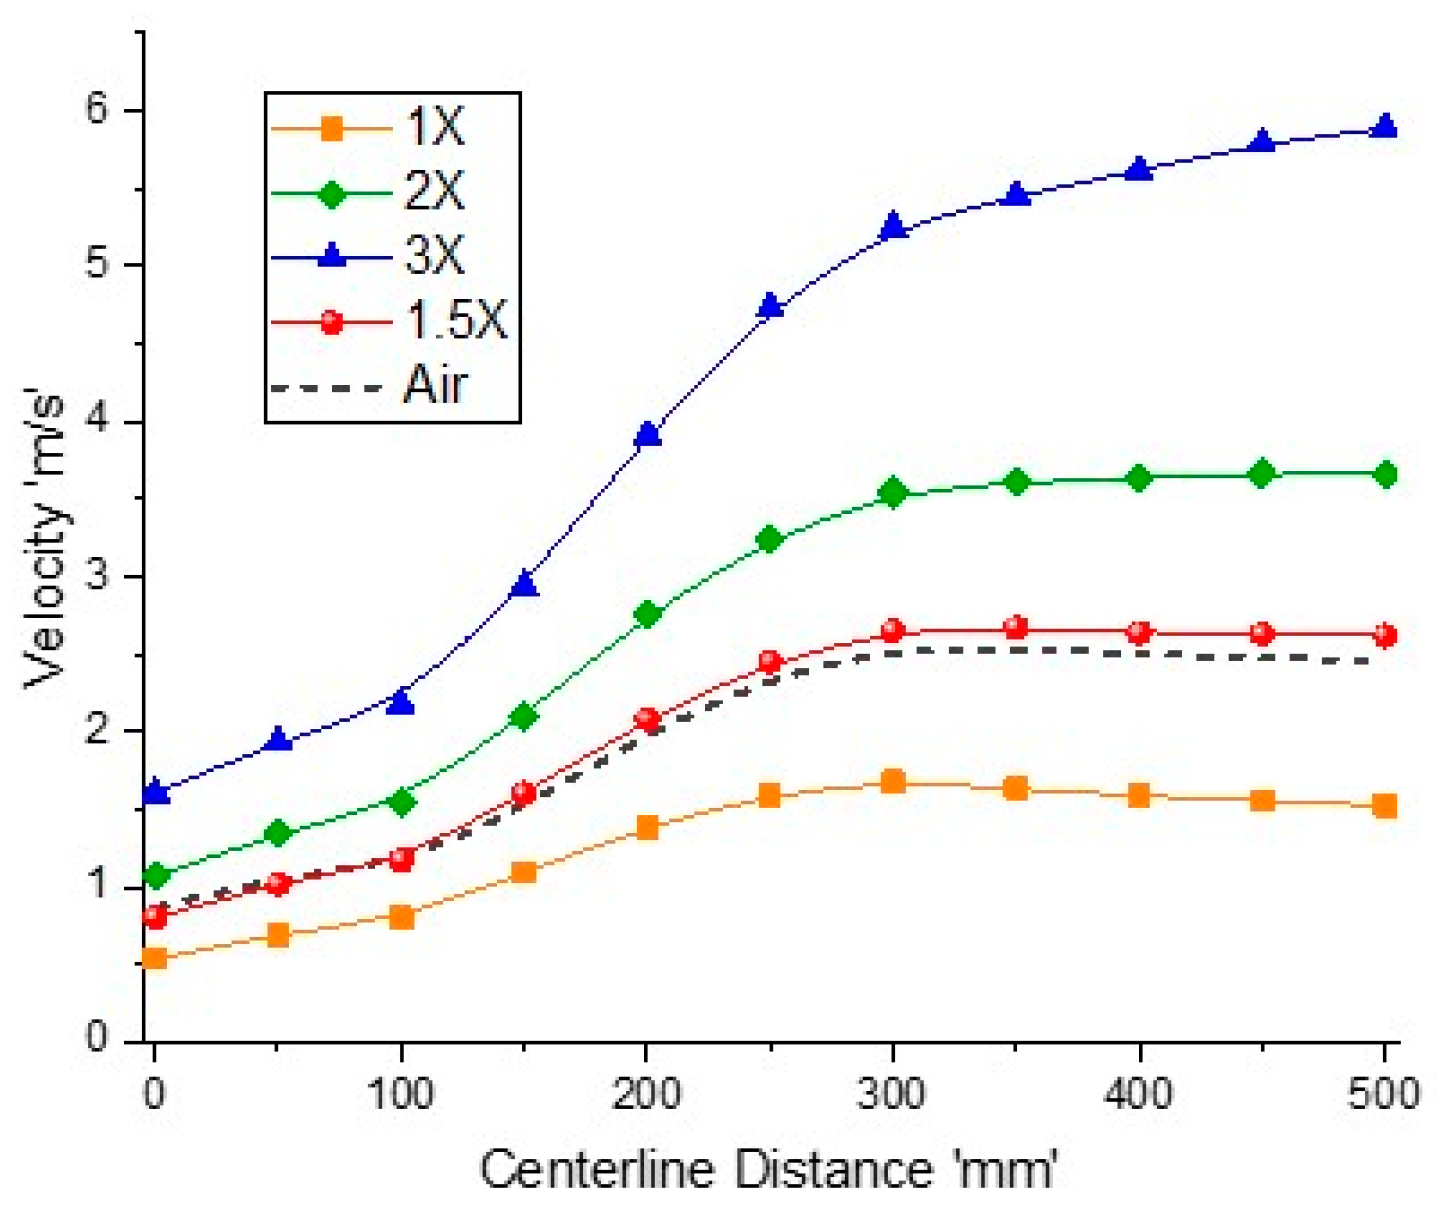
Figure 12 shows velocity variation along the reactor for different exit Reynolds numbers and air-combustion. As the mass flow rate is multiplied by a factor of 1.5, 2, and 3, the velocity rise is more than these factors. This is because at a higher mass flow rate, the outlet temperature increases, which lowers the average density, hence increasing the velocity field. This velocity variation behavior is similar to that of outlet temperature profiles. It is clear that the velocity fields for the air-combustion case and 1.5× inlet flow rates are similar to the temperature profiles. Therefore, for a comparable reactor performance to that of air-combustion, the mass flow rate should be increased by 50%; however, energy contents at the outlet will also be increased.
Figure 13a shows the methane depletion rate for different inlet flow rates and air-combustion. Increment in flow rates causes the velocity field inside the reactor to rise, which reduces the residence time and reaction rate. For a 1× flow rates, the reaction occurs faster, and methane diminishes at around x = 300 mm, while for the 1.5× flow rates, the reaction rate is slower and methane fully converts into combustible products at around x = 320 mm, which is comparable to that of the air-combustion case. For the 2× and 3× flow rates, the reaction is further slower, and methane converts completely at x = 350 mm and x = 410 mm, respectively. Figure 13b shows carbon monoxide fraction variation along the reaction zone for different sweep flow rates. For higher sweep flow rates, maximum CO peak shifts towards the end of the porous plate and not all of the carbon monoxide is converted and the reaction is incomplete, while for lower sweep flow rates, CO peak occurs at the start of porous plate and all of the carbon monoxide is converted before the reactor’s exit. For the 3× flow rates, CO concentration is high as the reaction is incomplete. Since the 1.5× flow rates for oxy-combustion is comparable to that for air-combustion, they also result in similar CO mass fraction at outlet, i.e., 1% and 0.9%, respectively.

3.5. Effect of Reactor Height

Figure 14 shows the temperature variation profiles for different reactor heights ranging from h = 30 mm to 16 mm. It can be seen that as the reactor height reduces to h = 18 mm, the outlet temperature changes from 2034 K to 2221K, which is a bit lower than that of the air-combustion case. However, the maximum temperature for h = 18 mm is much higher than that for the air-combustion. A higher temperature at a lower reactor height causes upstream temperature to rise significantly due to increased radiative heat transfer. Higher temperatures are not desirable as it limits material selection and reactor design. 
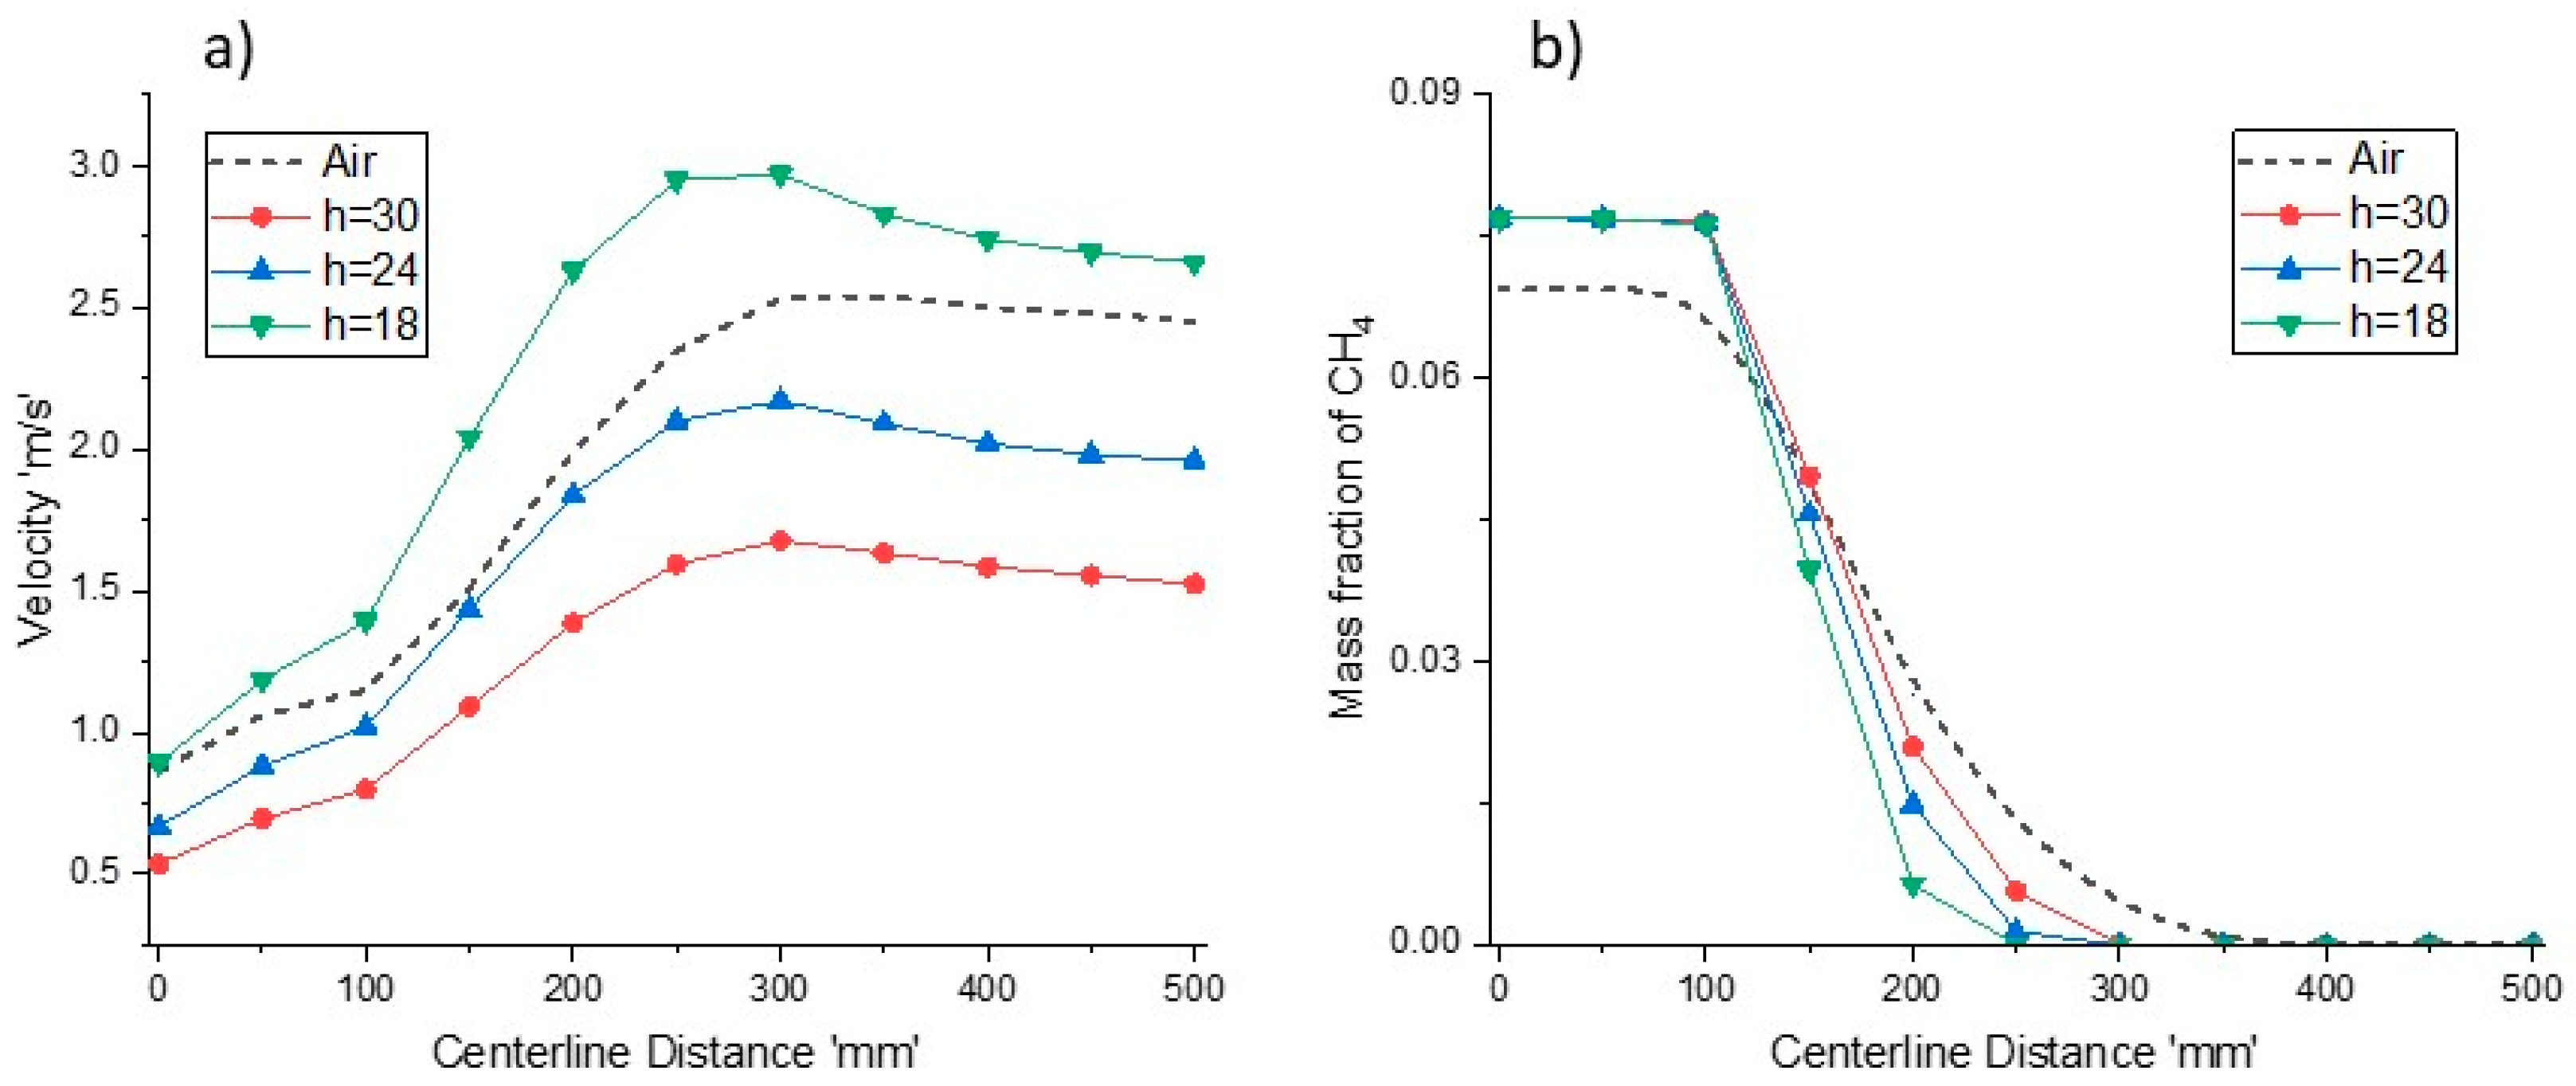
Figure 15a,b shows velocity and CH4 mass fraction profile for different reactor heights respectively. Decrement in reactor heights lead to increased velocities, and a further increment in the velocity profile is observed as the combustion starts. The velocity of combustion products decreases as the mixture cools near the exit of the reactor. The higher temperature profile at h = 18 mm is due to the rapid combustion, as shown by the methane conversion profile in Figure 15b. The methane depletion rates for all cases are higher than methane combustion in an O2/N2 environment. Therefore, for a comparable reactor performance to that of air-combustion, the reactor height should be reduced by 40%; however, the peak temperature is much higher than in the air case, which is not desirable.

4. Conclusions

In this study, the combustion characteristics of air-combustion were studied using a commercial CFD software fluent 18.0. It was found that the maximum temperature would be near porous plates where the reaction begins, and radiation heat transfer plays an important role in temperature distribution inside the reactor. The adiabatic flame temperature was evaluated using energy balance in engineering equation solver (EES) for air-combustion and oxy-combustion. Results showed that oxy-combustion with OR = 0.243 would have the same adiabatic flame temperature as that of air-combustion. Air-combustion was compared with oxy-combustion with different oxidizer ratios. It was concluded that the outlet temperature for different oxidizer ratios was similar and much lower as that of air-combustion because of the reduced velocity field and increased radiation effects. Oxy-combustion with OR = 0.25 was selected to study the effects of mass flow rates and reactor heights and matched with air-combustion. Higher flow rates and reduced reactor height were found to have an incremental effect on outlet temperature due to increased convective heat transfer. Furthermore, for a similar performance to that of air-combustion, the flow rate should be increased by 50%; however, total heat transfer will also be increased at the outlet. Reactor height could also be reduced by 40% to achieve similar conditions as those of air-combustion; however, the resulting higher peak temperature may not be desirable.

Author Contributions

Conceptualization, F.T. and Y.J.; methodology, F.T. and A.A.B.B.; validation, H.A.; formal analysis, A.A.B.B.; investigation, F.T. and Y.J.; writing—original draft preparation, F.T.; writing—review and editing, A.A.B.B. and Y.J.; visualization, A.A.B.B.; supervision, H.A. and Y.J.; funding acquisition, F.T.

Funding

The publication of this article was funded by the Qatar National Library (QNL).

Acknowledgments

The authors acknowledge the support provided by the Hamad Bin Khalifa University (HBKU), Qatar Foundation (QF) and King Fahd University of Petroleum and Minerals (KFUPM) to accomplish this work.

Conflicts of Interest

The authors declare no conflict of interest.

Nomenclature

Apre-exponential factor
Cpspecific heat at constant pressure (kJ/kg·K)
CFDcomputational fluid dynamics
Di,mdiffusion coefficient of specie
DOdiscrete ordinates
Eaactivation Energy (kJ/kg)
hreactor height (mm)
HTMRhigh temperature membrane reactor
Itotal radiation intensity
ITMion transport membranes
JLJones and Lindstedt
m ˙ mass flow rate (kg/s)
Kabsorption coefficient
kthermal conductivity (W/m·K)
krrate of reaction
ORoxidizer ratio
Ppressure (Pa)
Rgas constant
ReReynolds number
Ttemperature (K)
Uvelocity (m/s)
WDWestbrook and Dryer
Yspecie concentration
Φequivalence ratio
gradient operator
β temperature exponent
ρ density (kg/m3)
σ s scattering coefficient
μ viscosity (Pa·s)

References

  1. IEA International Energy Agency (IEA). Key World Energy Statistics; IEA: Paris, France, 2017. [Google Scholar]
  2. Lecomte, F.; Broutin, P.; Lebas, E. CO2 Capture Technologies to Reduce Greenhouse Gas Emissions; IFP Publications: Paris, France, 2010. [Google Scholar]
  3. Kanniche, M.; Gros-Bonnivard, R.; Jaud, P.; Valle-Marcos, J.; Amann, J.-M.; Bouallou, C. Pre-combustion, post-combustion and oxy-combustion in thermal power plant for CO2 capture. Appl. Eng. 2010, 30, 53–62. [Google Scholar] [CrossRef]
  4. Scholes, C.A.; Smith, K.H.; Kentish, S.E.; Stevens, G.W. CO2 capture from pre-combustion processes—Strategies for membrane gas separation. Int. J. Greenh. Gas Control 2010, 4, 739–755. [Google Scholar] [CrossRef]
  5. Ali, H.; Tahir, F.; Atif, M.; AB Baloch, A. Analysis of Steam Reforming of Methane Integrated with Solar Central Receiver System. In Proceedings of the Qatar Foundation Annual Research Conference, Doha, Qatar, 19–20 March 2018; Volume 2018, p. EEPD969. [Google Scholar]
  6. Merkel, T.C.; Lin, H.; Wei, X.; Baker, R. Power plant post-combustion carbon dioxide capture: An opportunity for membranes. J. Memb. Sci. 2010, 359, 126–139. [Google Scholar] [CrossRef]
  7. Jamil, Y.; Habib, M.A.; Nemitallah, M.A. CFD analysis of CO2 adsorption in different adsorbents including activated carbon, zeolite and Mg-MOF-74. Int. J. Glob. Warm. 2017, 13, 57. [Google Scholar] [CrossRef]
  8. Imteyaz, B.; Habib, M.A.; Ben-Mansour, R. The characteristics of oxycombustion of liquid fuel in a typical water-tube boiler. Energy Fuels 2017, 31, 6305–6313. [Google Scholar] [CrossRef]
  9. Li, M.; Tong, Y.; Thern, M.; Klingmann, J. Investigation of methane oxy-fuel combustion in a swirl-stabilised gas turbine model combustor. Energies 2017, 10, 648. [Google Scholar]
  10. Kirchen, P.; Apo, D.J.; Hunt, A.; Ghoniem, A.F. A novel ion transport membrane reactor for fundamental investigations of oxygen permeation and oxy-combustion under reactive flow conditions. Proc. Combust. Inst. 2013, 34, 3463–3470. [Google Scholar] [CrossRef]
  11. Chen, L.; Ghoniem, A.F. Simulation of oxy-coal combustion in a 100 kW th test facility using RANS and LES: A validation study. Energy Fuels 2012, 26, 4783–4798. [Google Scholar] [CrossRef]
  12. Zdeb, J.; Howaniec, N.; Smoliński, A. Utilization of carbon dioxide in coal gasification—An experimental study. Energies 2019, 12, 140. [Google Scholar] [CrossRef]
  13. Lei, K.; Ye, B.; Cao, J.; Zhang, R.; Liu, D. Combustion characteristics of single particles from bituminous coal and pine sawdust in O2/N2, O2/CO2, and O2/H2O atmospheres. Energies 2017, 10, 1695. [Google Scholar] [CrossRef]
  14. Suda, T.; Masuko, K.; Sato, J.; Yamamoto, A.; Okazaki, K. Effect of carbon dioxide on flame propagation of pulverized coal clouds in CO2/O2 combustion. Fuel 2007, 86, 2008–2015. [Google Scholar] [CrossRef]
  15. Zhen, H.; Wei, Z.; Chen, Z. Effect of N2 replacement by CO2 in coaxial-flow on the combustion and emission of a diffusion flame. Energies 2018, 11, 1032. [Google Scholar] [CrossRef]
  16. Mansir, I.B.; Nemitallah, M.A.; Habib, M.A.; Khalifa, A.E. Experimental and numerical investigation of flow field and oxy-methane combustion characteristics in a low-power porous-plate reactor. Energy 2018, 160, 783–795. [Google Scholar] [CrossRef]
  17. Chen, L.; Yong, S.Z.; Ghoniem, A.F. Oxy-fuel combustion of pulverized coal: Characterization, fundamentals, stabilization and CFD modeling. Prog. Energy Combust. Sci. 2012, 38, 156–214. [Google Scholar] [CrossRef]
  18. Hong, J.; Chaudhry, G.; Brisson, J.G.; Field, R.; Gazzino, M.; Ghoniem, A.F. Analysis of oxy-fuel combustion power cycle utilizing a pressurized coal combustor. Energy 2009, 34, 1332–1340. [Google Scholar] [CrossRef] [Green Version]
  19. Andersen, J.; Rasmussen, C.L.; Giselsson, T.; Glarborg, P. Global combustion mechanisms for use in CFD modeling under oxy-fuel conditions. Energy Fuels 2009, 23, 1379–1389. [Google Scholar] [CrossRef]
  20. Zhao, P.; Chen, Y.; Liu, M.; Ding, M.; Zhang, G. Numerical simulation of laminar premixed combustion in a porous burner. Front. Energy Power Eng. China 2007, 1, 233–238. [Google Scholar] [CrossRef]
  21. Habib, M.A.; Ahmed, P.; Ben-Mansour, R.; Badr, H.M.; Kirchen, P.; Ghoniem, A.F. Modeling of a combined ion transport and porous membrane reactor for oxy-combustion. J. Memb. Sci. 2013, 446, 230–243. [Google Scholar] [CrossRef]
  22. Habib, M.A.M.A.; Tahir, F.; Nemitallah, M.A.M.A.; Ahmed, W.H.W.H.; Badr, H.M.H.M. Experimental and numerical analysis of oxy-fuel combustion in a porous plate reactor. Int. J. Energy Res. 2015, 39, 1229–1240. [Google Scholar] [CrossRef]
  23. Ansys Fluent Theory Guide 12.0. Available online: http://www.afs.enea.it/project/neptunius/docs/fluent/html/th/main_pre.htm (accessed on 5 May 2019).
  24. Versteeg, H.K.; Malalasekera, W. An Introduction to Computational Fluid Dynamics: The Finite Volume Method; Pearson Education Ltd.: London, UK, 2007; ISBN 0131274988. [Google Scholar]
  25. Nemitallah, M.A.; Habib, M.A. Experimental and numerical investigations of an atmospheric diffusion oxy-combustion flame in a gas turbine model combustor. Appl. Energy 2013, 111, 401–415. [Google Scholar] [CrossRef]
Figure 1. Schematic of porous plate reactor employed for combustion analysis.
Energies 12 01706 g001
Figure 2. Schematic of the experimental setup for determining species-mixing ratios in porous plate reactor [22].
Energies 12 01706 g002
Figure 3. Comparison between experimental and numerical results for non-reacting flow inside porous reactor, at different oxygen to nitrogen ratios.
Energies 12 01706 g003
Figure 4. Comparison between the modified Westbrook and Dryer (WD) two-step, and Jones and Lindstedt (JL) numerical results with the experimental data by Nemitallah and Habib [25] under different oxy-combustion conditions in terms of exhaust temperature: (a) Vf = 6 L/min, O2/CO2 = 30/70, Φ = 0.65 and (b) Vf = 6 L/min, O2/CO2 = 50/50, Φ = 0.55.
Energies 12 01706 g004
Figure 5. Variation of species mass fraction for air-combustion along the ‘x’ direction.
Energies 12 01706 g005
Figure 6. Temperature contours for air-combustion.
Energies 12 01706 g006
Figure 7. Mass weighted temperature variation along the ‘x’ direction with different oxidizer ratios for the oxy-combustion and air-combustion case.
Energies 12 01706 g007
Figure 8. Mass weighted average velocity variation along the ‘x’ direction with different oxidizer ratios for the oxy-combustion and air-combustion case.
Energies 12 01706 g008
Figure 9. Variation of species mass fraction of (a) CH4 and (b) CO, with a different oxidizer ratio for the oxy-combustion and air-combustion case along the ‘x’ direction.
Energies 12 01706 g009
Figure 10. Temperature contours for different inlet flow rates (a). 1×; (b) 2× and (c) 3×.
Energies 12 01706 g010
Figure 11. (a) Mass weighted temperature variation along the ‘x’ direction for different inlet flow rates with fixed OR = 0.25 (b) maximum and outlet temperature in the reactor for different inlet flow rates.
Energies 12 01706 g011
Figure 12. Mass weighted average velocity variation along the ‘x’ direction for different inlet flow rates with fixed OR = 0.25.
Energies 12 01706 g012
Figure 13. Variation of species mass fraction (a) CH4 and (b) CO, different inlet flow rates with fixed OR = 0.25, along the ‘x’ direction.
Energies 12 01706 g013
Figure 14. Mass weighted average temperature profiles for different reactor height with fixed inlet flow rates and OR = 0.25.
Energies 12 01706 g014
Figure 15. (a) Mass weighted average velocity profiles for different reactor height with fixed inlet flow rates and OR = 0.25 (b) CH4 mass fraction profiles for different reactor height with fixed inlet flow rates and OR = 0.25 along the x direction.
Energies 12 01706 g015
Table 1. Values of A, β , Ea, and reaction orders for different reactions kinetics models.
ReactionAEaβReaction Orders
Methane-air 2 step reaction model [23]
CH4 + 1.5O2 → CO + 2H2O5.01 × 10111.998 × 1080[CH4]0.7[O2]0.8
CO + 0.5O2 → CO22.239 × 10121.7 × 1080[CO][O2]0.25[H2O]0.5
CO2 → CO + 0.5O25 × 1081.7 × 1080[CO2]
Westbrook and Dryer—2 step mechanism (WD) modified for O2/CO2 environment
CH4 + 1.5O2 → CO + 2H2O1.59 × 10131.998 × 1080[CH4]0.7[O2]0.8
CO + 0.5O2 → CO23.98 × 1084.18 × 1070[CO][O2]0.25[H2O]0.5
CO2 → CO + 0.5O26.16 × 10133.277 × 108−0.97[CO2] [H2O]0.5[O2]−0.25
Jones and Lindstedt—4 step mechanism (JL) modified for O2/CO2 environment
CH4 + 0.5O2 → CO + 2H27.82 × 10131.25 × 1080[CH4]0.5[O2]1.25
CH4 + H2O → CO + 3H23 × 10111.25 × 1080[CH4] [H2O]
H2 + 0.5O2 → H2O5 × 10201.25 × 108−1[H2]0.25[O2]1.5
H2O → H2 + 0.5O22.93 × 10204.09 × 108−0.877[H2]−0.75[O2][H2O]
CO + H2O ←→ CO2 + H22.75 × 10128.36 × 1070[CO][H2O]
Table 2. Inlet conditions for the porous plate reactor (species mass flow rates).
Case #Species Mass Flow Rate (10−3 kg/s)Remarks
CH4O2/2CO2N2
10.51-6.7OR = 0.23, Air
Effect of Oxidizer Ratio
20.518-OR = 0.20
30.516-OR = 0.25, 1×, h = 30 mm,
base case for oxy-combustion
40.514.67-OR = 0.30
50.513.71-OR = 0.35
60.513-OR=0.40
Effect of Mass Flow Rate
70.751.59-OR = 0.25, 1.5×
81212-OR = 0.25, 2×
91.5318-OR = 0.25, 3×
Effect of Reactor Height
100.516-OR = 0.25, h = 24 mm
110.516-OR = 0.25, h = 18 mm

