Article

Reducing the Superheating of Extraction Stream on Advanced-Ultra Super Critical Power Plants with Regenerative Turbines in South Korea: An Economic Analysis

1
Dae-Woo Engineering and Construction, Division of Plant Engineering, 75 Saemunan-Ro, Jongro-Ku, Seoul 03182, Korea
2
Graduate Institute of Ferrous Technology (GIFT), Pohang University of Science and Technology (POSTECH), 77 Cheongam-Ro, Nam-Ku, Pohang 37673, Korea
3
Department of Industrial and Management Engineering, Pohang University of Science and Technology (POSTECH), 77 Cheongam-Ro, Nam-Ku, Pohang 37673, Korea
4
Construction Engineering and Management, Department of Civil, Environmental and Architectural Engineering, University of Colorado, Boulder, CO 80309, USA
*
Author to whom correspondence should be addressed.
Energies 2019, 12(9), 1681; https://doi.org/10.3390/en12091681
Submission received: 3 April 2019 / Revised: 25 April 2019 / Accepted: 30 April 2019 / Published: 3 May 2019
(This article belongs to the Special Issue Energy Policy in South Korea)

Abstract

:
In this study, an advanced-ultra super critical (A-USC) simulation model was developed using the Performance Evaluation of power system efficiencies (PEPSE) software and data collected from a 500 MW ultra-supercritical (USC) coal-fired power plant in South Korea. Using the operational USC and a typical A-USC power plant steam conditions, the model analyzed the impacts of adding an additional feedwater heater (FWH) and reheater to the baseline single reheater (SR) and 8 FWH case. Through the process of introducing reheat and/or regenerative cycles, the authors found: (1) A-USC steam conditions offers an approximate 4% power plant efficiency increase in comparison to the baseline USC steam conditions and; (2) power plant efficiencies increase approximately 1.5% when a 9th FWH and double reheater are added, however; (3) this also results in an approximate 64 °C increase in the superheating of extraction stream. This excessive rise in the superheating of extraction steam was found to cause overall energy loss, reducing the overall efficiency of the power plant. Therefore, it was surmised that if the increase in the superheat degree of extraction steam from the improved steam cycle, which can effectively reduce, the efficiency of the power plant could be further improved. To determine the efficiency variations based on the reduction of the superheat degree of extraction steam, the authors applied a regenerative turbine (RT) to the model. Introducing the RT to the A-USC DR and 9 FWH was found to decrease from the average extraction steam temperature from 221 °C to 108 °C and result in an increase in power plant efficiency of approximately 0.3% to 49.5%. An economic analysis was also performed to assess the fiscal feasibility of adding an RT. Assuming the initial investment to be USD 1409 million, implementing an RT equated to a net present value increase of approximately USD 33 million as compared to that of similar life (30 years of durability) expectancy of A-USC without using an RT. The findings of this study have the potential to improve South Korea’s energy policy, reducing the superheat degree of extraction steam that rises excessively during A-USC steam condition optimization. While this study is focused on South Korea, said findings are also generalizable to worldwide energy policies, serving as an effective method to not only increase system efficiencies, but enhance the economic feasibility as well.

1. Introduction

Coal-fired power plants are a reliable source of energy due to the worldwide abundance of coal reserves and efficiencies in converting said sources into electric power. However, they produce significantly more environmental pollution in comparison to other power sources. The National Greenhouse Gas Inventory Report of South Korea for 2015 found that the total greenhouse gas emissions amounted to 694.5 million tons (CO2eq) with 606.2 million tons (CO2eq) coming from the energy sector—coal-fired power generation being the most significant contributor [1]. Lower emitting power generation sources, often alternative or sustainable energy sources, are currently unable to meet the global energy requirements. Nuclear power generation is a viable source but has been viewed negatively as of late due to Japan’s Fukushima nuclear plant. In order to reduce the risk of disasters and meet the increasing demand for electric power, it is necessary to construct and invest in a coal-fired power plant that uses technologies that can solve environmental problems. One method to reduce carbon emissions is to increase the operational efficiencies of these coal-fired power plants, and the most effective way to achieve this is to optimize the temperature and pressure of the main and reheat steam. Figure 1 shows the improvement of heat rate according to the condition of the main steam and reheat steam under single reheat (SR) condition. As the steam conditions increase from 10 bar to 10 bar based on 161 bar (main steam pressure)/538 °C (main steam temperature)/538 °C (reheat steam temperature), the heat consumption rates are improved by 0.5% and 0.2%. The temperature and pressure conditions of the steam are proportional to the efficiency. Improvement of the steam condition is essential for efficiency improvement [2].
In an attempt to achieve optimal efficiency, investors are developing coal-fired power plants with ever-increasing steam conditions. To date, the coal-fired power plant types are currently divided into subcritical, supercritical, ultra-supercritical (USC) and advanced-ultra supercritical (A-USC) depending on the temperature and pressure conditions of the main steam. One of the determining reference points is the critical point which is the state where the saturated liquid line of the steam and the saturated steam line meet with each other. The working fluid of a coal-fired power plant is water vapor which has a critical point of 225.6 kg/cm2, 374 °C. The subcritical power plant is operated with water vapor below the critical point. The supercritical power plant is operated with steam exceeding the critical point. There is no unified definition of conditions above supercritical pressure. This is because it is defined by the manufacturer of power generation facilities and by the country. Table 1 shows the power plant designations per the International Energy Agency (IEA), Electric Power Research Institute (EPRI), General Electric (GE), Hitachi, and Korea. As can be seen, South Korean electrical companies have accepted the threshold pressure conditions of Japan. Since 2000, Japan has started to develop A-USC technology at 700 °C. From 2021 to 2026, Japan will be constructing and operating pilot A-USC plants with two-stage reheat type (specification: 600 MW, 357 kg/cm2/720 °C/720 °C). Considering the progress of advanced countries including Japan, the efficiency improvement of coal-fired power plants in South Korea will be based on the advanced ultra-critical pressure (A-USC) of 500 to 700 MW. Steam conditions are expected to be the same as in the US at 357kg/cm2/700 °C/730 °C.
Optimization of the plant cycle is necessary to improve the steam condition. This requires improvements in regeneration and reheat cycles. However, when the temperature of the main steam and the reheat steam increases due to the introduction of these cycles, the temperature of the extraction steam supplied by the turbine increases for the heating of the water in the feedwater heater. The increase in the temperature of extraction steam induces the superheat degree to rise. The superheat degree is the difference between the superheat temperature of extraction steam and the saturated steam temperature inside the water heater. As the degree of superheat increases, the exergy loss in the water heat exchanger increases. This causes a reduction in plant efficiencies and may cause equipment damage. One mitigation method is to add a regenerative turbine. Thus, the authors developed a simulation model based on data collected from an operational 500 MW USC Korean power plant to fully understand the impacts of the reheat and regenerative cycles and an additional regenerative turbine (RT) on plant power output, the heat consumption rate, and plant efficiency. Through this process, the authors found the A-USC with an introduced reheat and regenerative cycle to be the most efficient, achieving 49.5% efficiency. Furthermore, the authors found that the introduction of the RT equates to a net present value (NPV) increase of approximately USD 35 million.

2. Existing Literature

Within existing literature, researchers have studied general thermodynamic principles as they pertain to the energy sector, often in an attempt to maximize power plant efficiency. Ibrahim and Husain [8], Habib and Zubair [9], Ibrahim and Yunus [10], and Mehmet et al. [11] all present thermodynamic analyses tools to be used to assess energy, entropy, and exergy within the Rankine cycles providing seminal processes for assessing the impact of reheat and regenerative cycles. Mohamed et al. [12] present a mathematical model to analyze the exergy of steam power plants, referencing the steam conditions which are necessary to improve power plant efficiency. Luo et al. [13] also present mathematical models to characterize thermodynamic behavior under varying conditions, focusing on the impact of steam extraction. Wang et al. [14] present the application of a conventional and innovative approach to analyzing the exergy of supercritical coal-fired power plants. They found that conventional analyses lack considerations of cross-component interactions and propose an advance procedure which improves plant synergy [14]. Sankaran et al. [15] and Erbay et al. [16] present the optimal design of regenerative gas turbine engines, their findings used to support this paper’s assessment of regenerative turbines and their current effectiveness.
There have also been several publications dedicated to assessing the economic analyses of power plant optimization solutions. From a broad perspective, existing publications have discussed capital budgeting, cost of capital, and capital structures within megaprojects and corporate finance [17]. Other studies have performed analyses on new net present value (NPV) methodologies which incorporate the weighted average cost of capital and dual risk-return opportunities, thereby including risk and uncertainty [18]. While not applicable to any one sector, they provide an excellent foundation to build off of, applying NPV assessments to large capital projects funded through corporate finance. Concerning economic assessments within the energy sector, Kumar et al. [19] performed an NPV assessment of a 210 MW subcritical coal-fired power plant. Their assessment was unique as it was more comprehensive than many studies, including all equipment, construction, and installation cost considerations. They found the fuel cost to be highly sensitive and payback period to be 10 years [19]. Lee et al. [20] and Zhong et al. [21] build off of these findings, presenting systematic algorithms which provide thermodynamic analysis, economic evaluations, and sensitivity analyses pertaining to the design, installation, and operation of coal-fired power plant steam conditions.
More closely related to the topic of this paper, many researchers have published economic analyses of power plant operational processes with the potential to increase efficiencies. Hong and Lee [22] presented a tool which aids decision makers in making efficient life-cycle cost-effective design decisions pertaining to the steam-cycle conditions in the preliminary design phases. Finally, this study builds most significantly off of the findings of Lee et al. [23], Kim and Lee [24], and Wang et al. [25]. Lee et al. [23] present areas of risk and specific risk events that are common on USC power plants. Kim and Lee [24] used the Performance Evaluation of Power System Efficiencies (PEPSE) thermodynamic simulation tool to assess the fiscal efficiency of off-power plants. This study builds off of their findings, also using the PEPSE tool to simulate power plant efficiencies. Ligang et al. [25] performed an economic analysis of modern USC power plants, assessing the economic performance of typical equipment in an attempt to present more cost-effective designs.
Advanced-Ultra-Supercritical power plants are a relatively new concept within the energy sector and have thus received very little attention in academia. Through an extensive literature review, the authors found only five publications dedicated to the subject. Fukuda [26] presents findings concerning the state of technology within Japan concerning development of equipment and materials to support the construction and operation of A-USC power plants. Liu and Xie [27] discuss the importance and urgency of China to enter into the A-USC market to maintain global competitiveness in the energy sector, summarizing their current progress in said arena. Nomoto [28] discusses the potential value adding of A-USC power plants, specifically their positive impact on mitigating global warming through CO2 emissions reductions. Finally, Gianfancesco [29] and Gianfrancesco and Blum [30] give an overview of the research and developments in Europe to support the advancement to A-USC power generation.

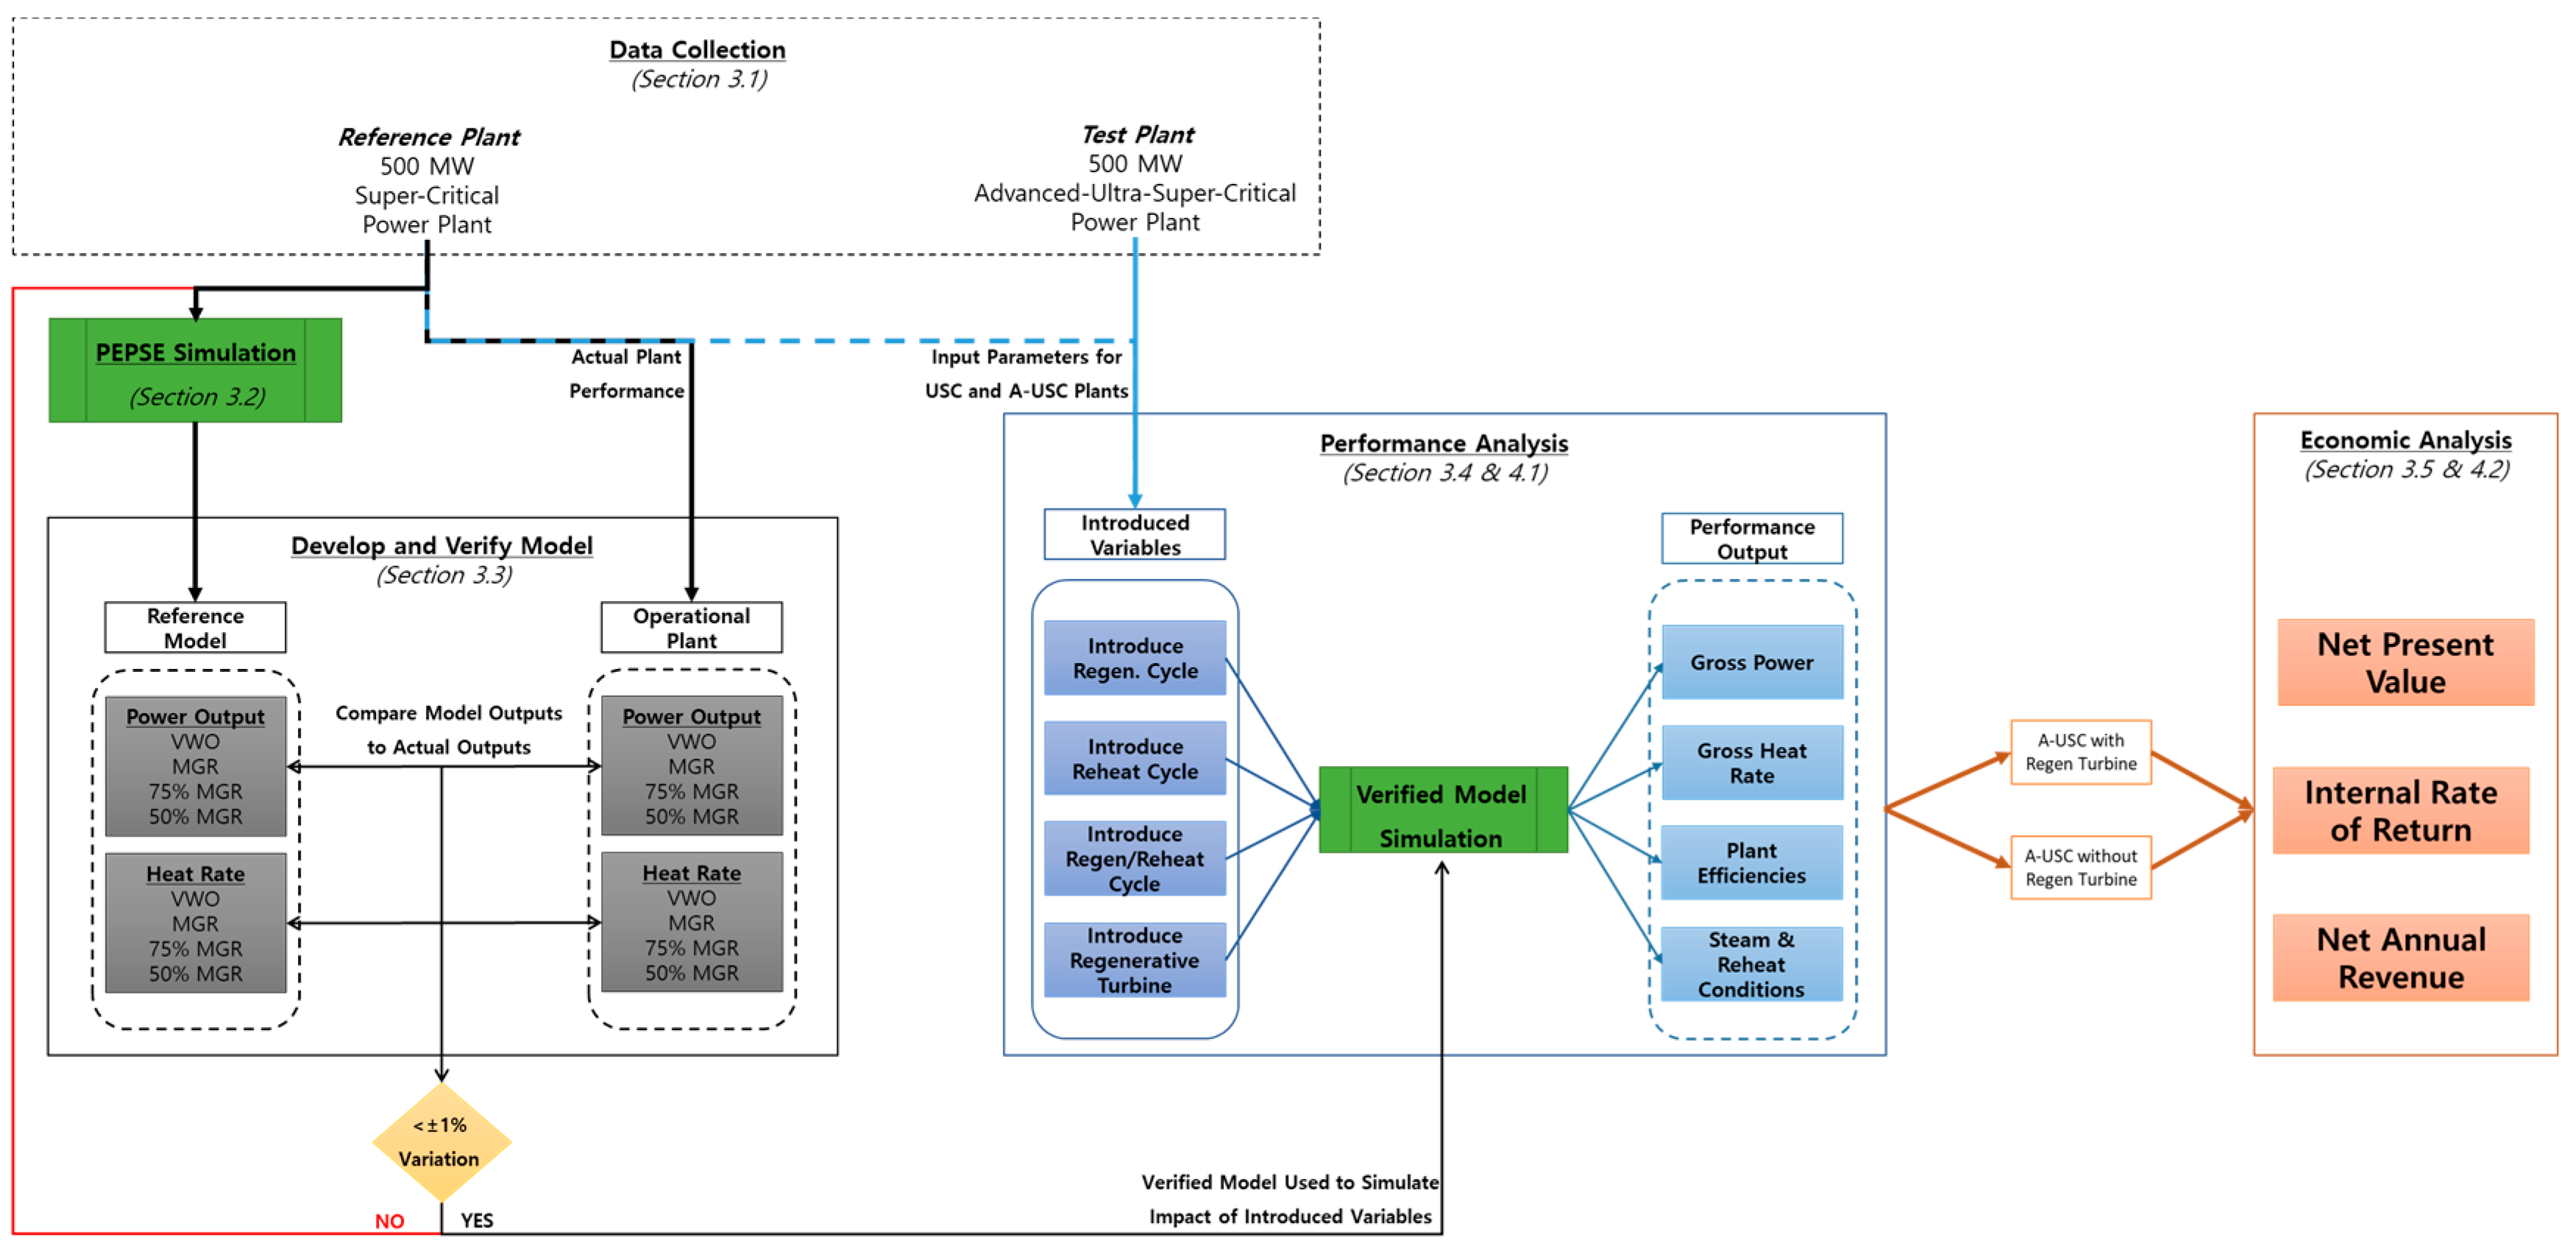
3. Data Collection and Research Methodology

The authors calculated the optimal steam conditions to maximum USC and A-USC plant efficiencies by assessing the impact the introducing the following variables had on the gross power, gross heat rate, and overall plant efficiencies: regeneration cycle, reheat cycle, and regeneration and reheat cycle. Furthermore, the authors calculated the financial viability of using a regenerative turbine to reduce system overheating. The research methodology used to assess these impacts can be seen in Figure 2. Data collected from a 500 MW Korean-constructed domestic USC power plant was used to develop a baseline simulation model. The model was developed through the PEPSE software which simulates gross power and heat rate based on variable steam conditions. The accuracy of the model was then ensured by comparing the simulated results to the actual operational results. The power output and heat rate were compared at the valve wide open (VWO) and 100%, 75%, and 50% maximum guaranteed rating (MGR) operational settings. The authors iterated on the simulation model until at least 99% accuracy was achieved. Once the simulation model’s accuracy was verified, it was used to assess the impacts of introducing optimized regeneration, reheat, and regeneration and reheat cycles on both USC and A-USC plants. The A-USC power plant was developed based on expectant parameters per the IEA [3]. Finally, the authors assessed the impact of introducing a regenerative turbine to reduce any overheating of the system and performed an economic analysis to determine the fiscal feasibility of said turbine. This process is presented in greater detail in the following subsections.

3.1. Data Collection
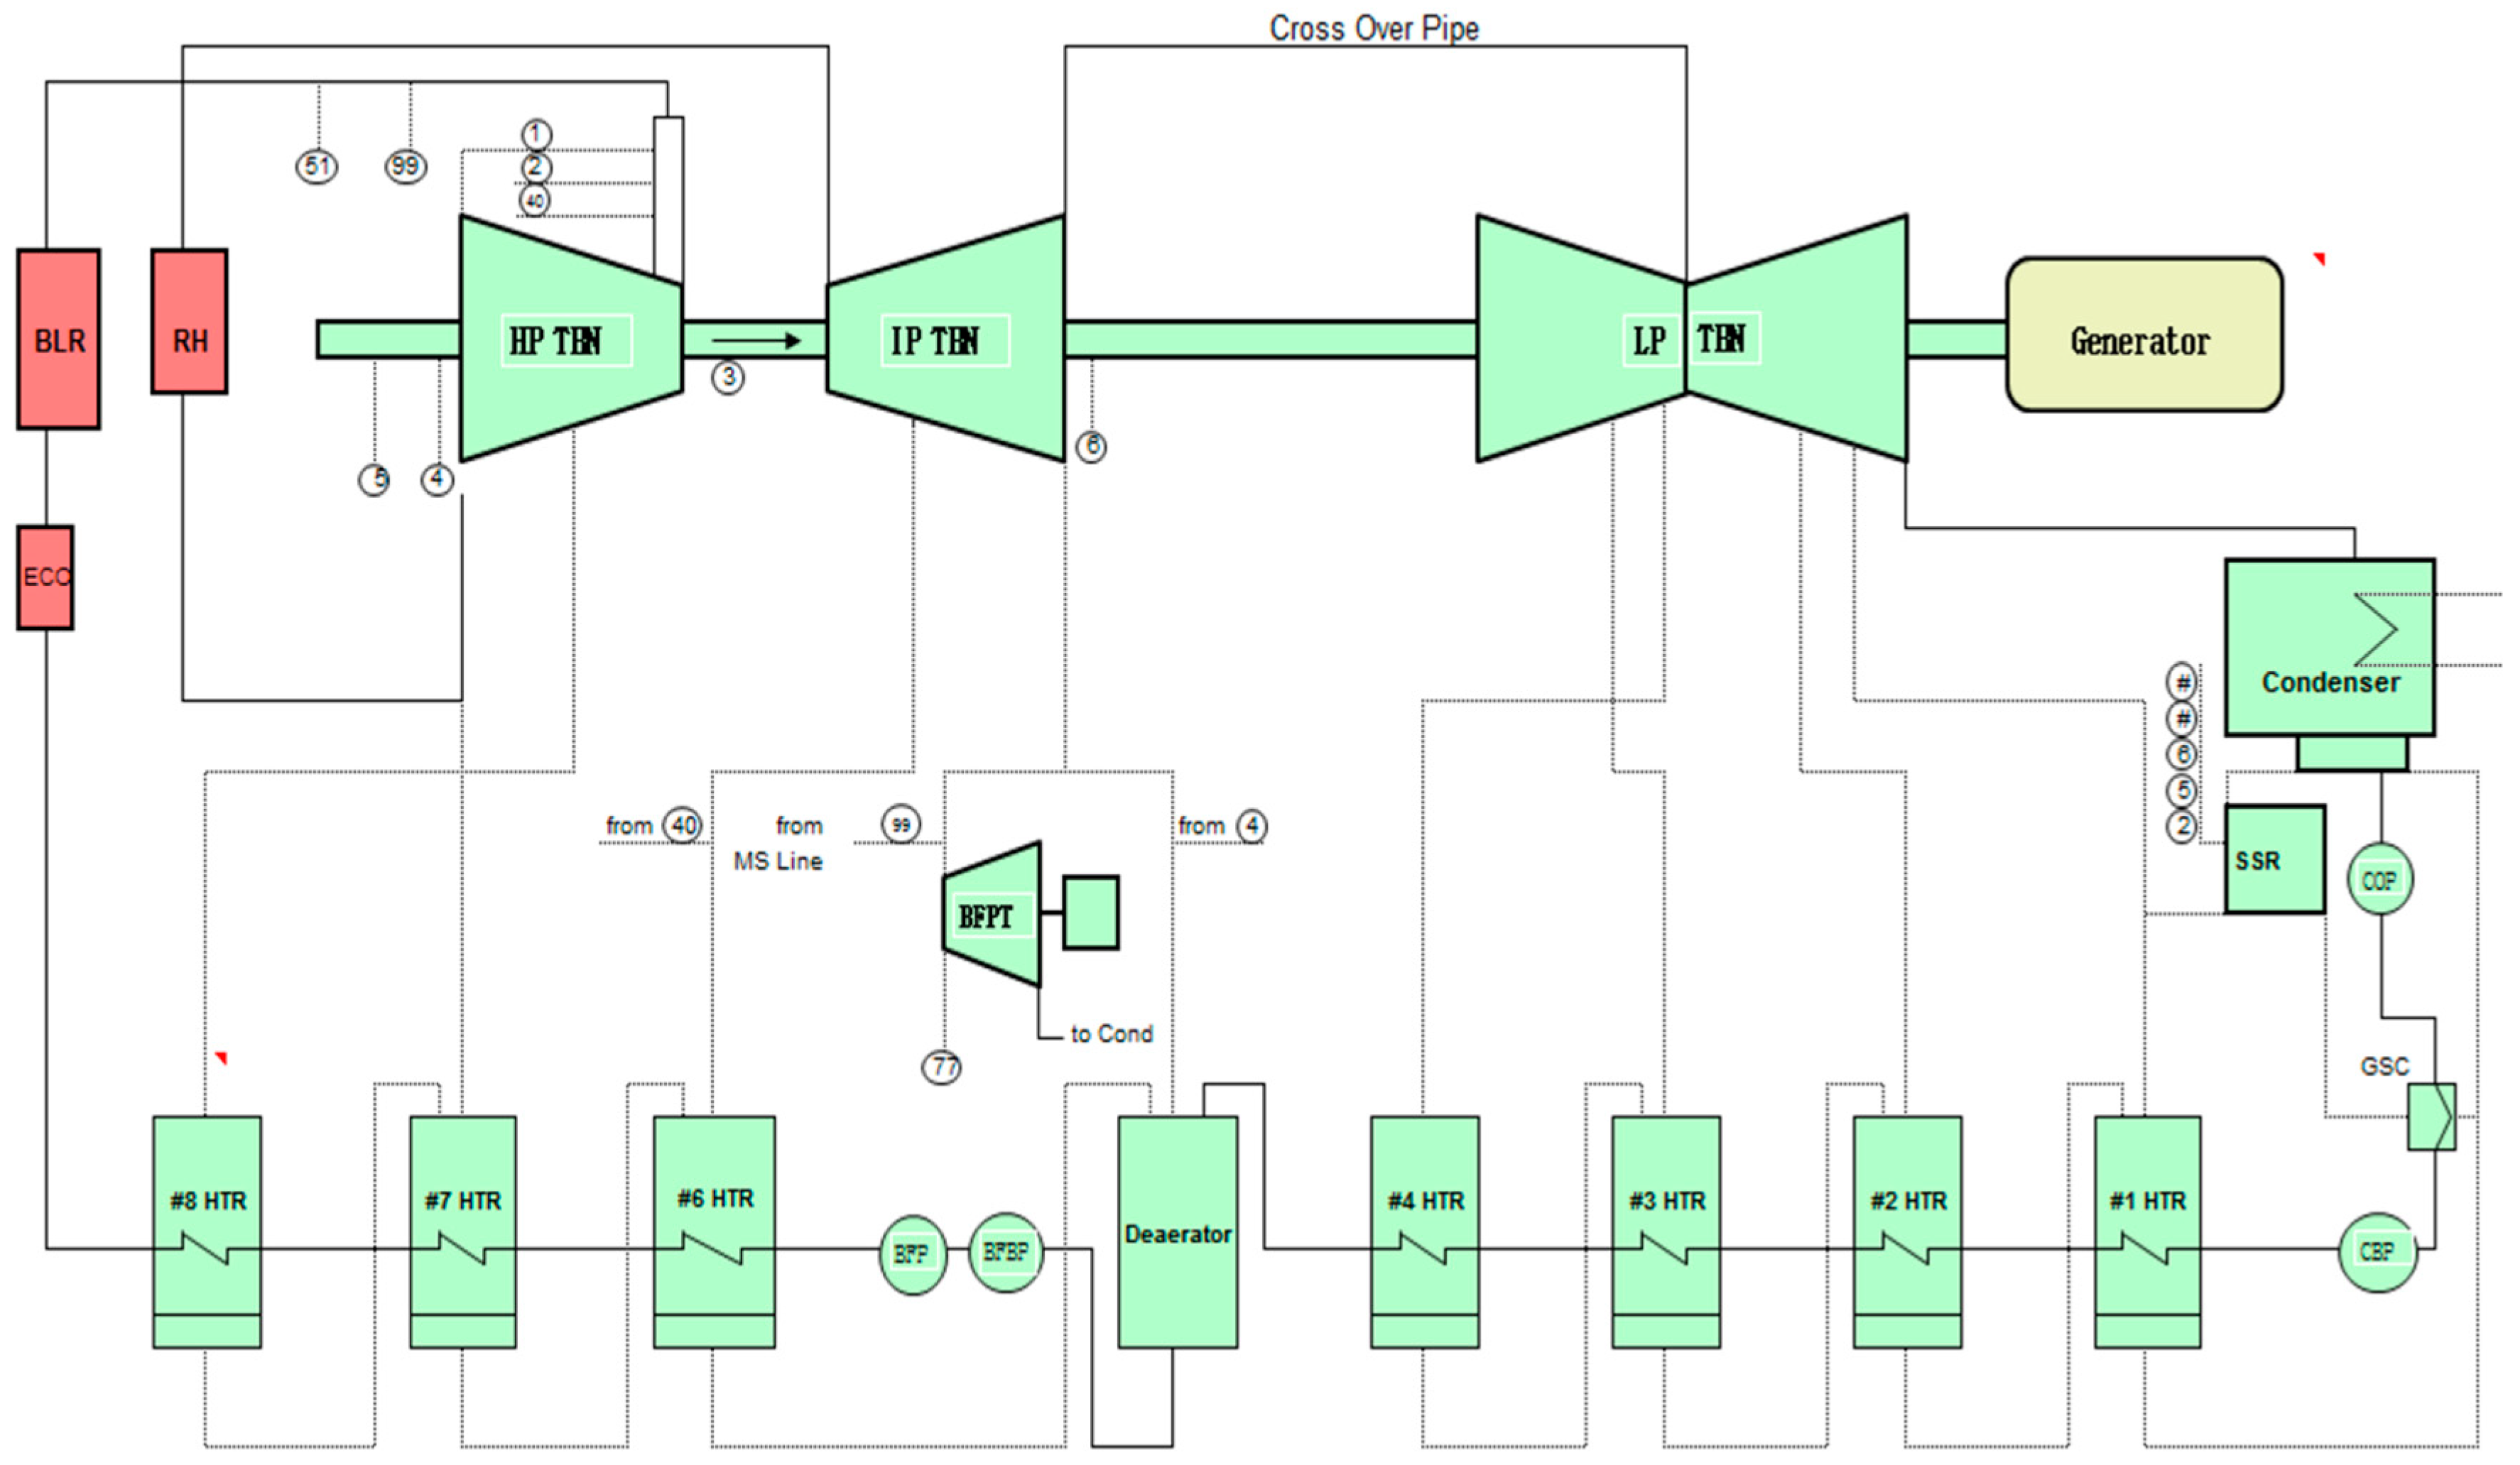
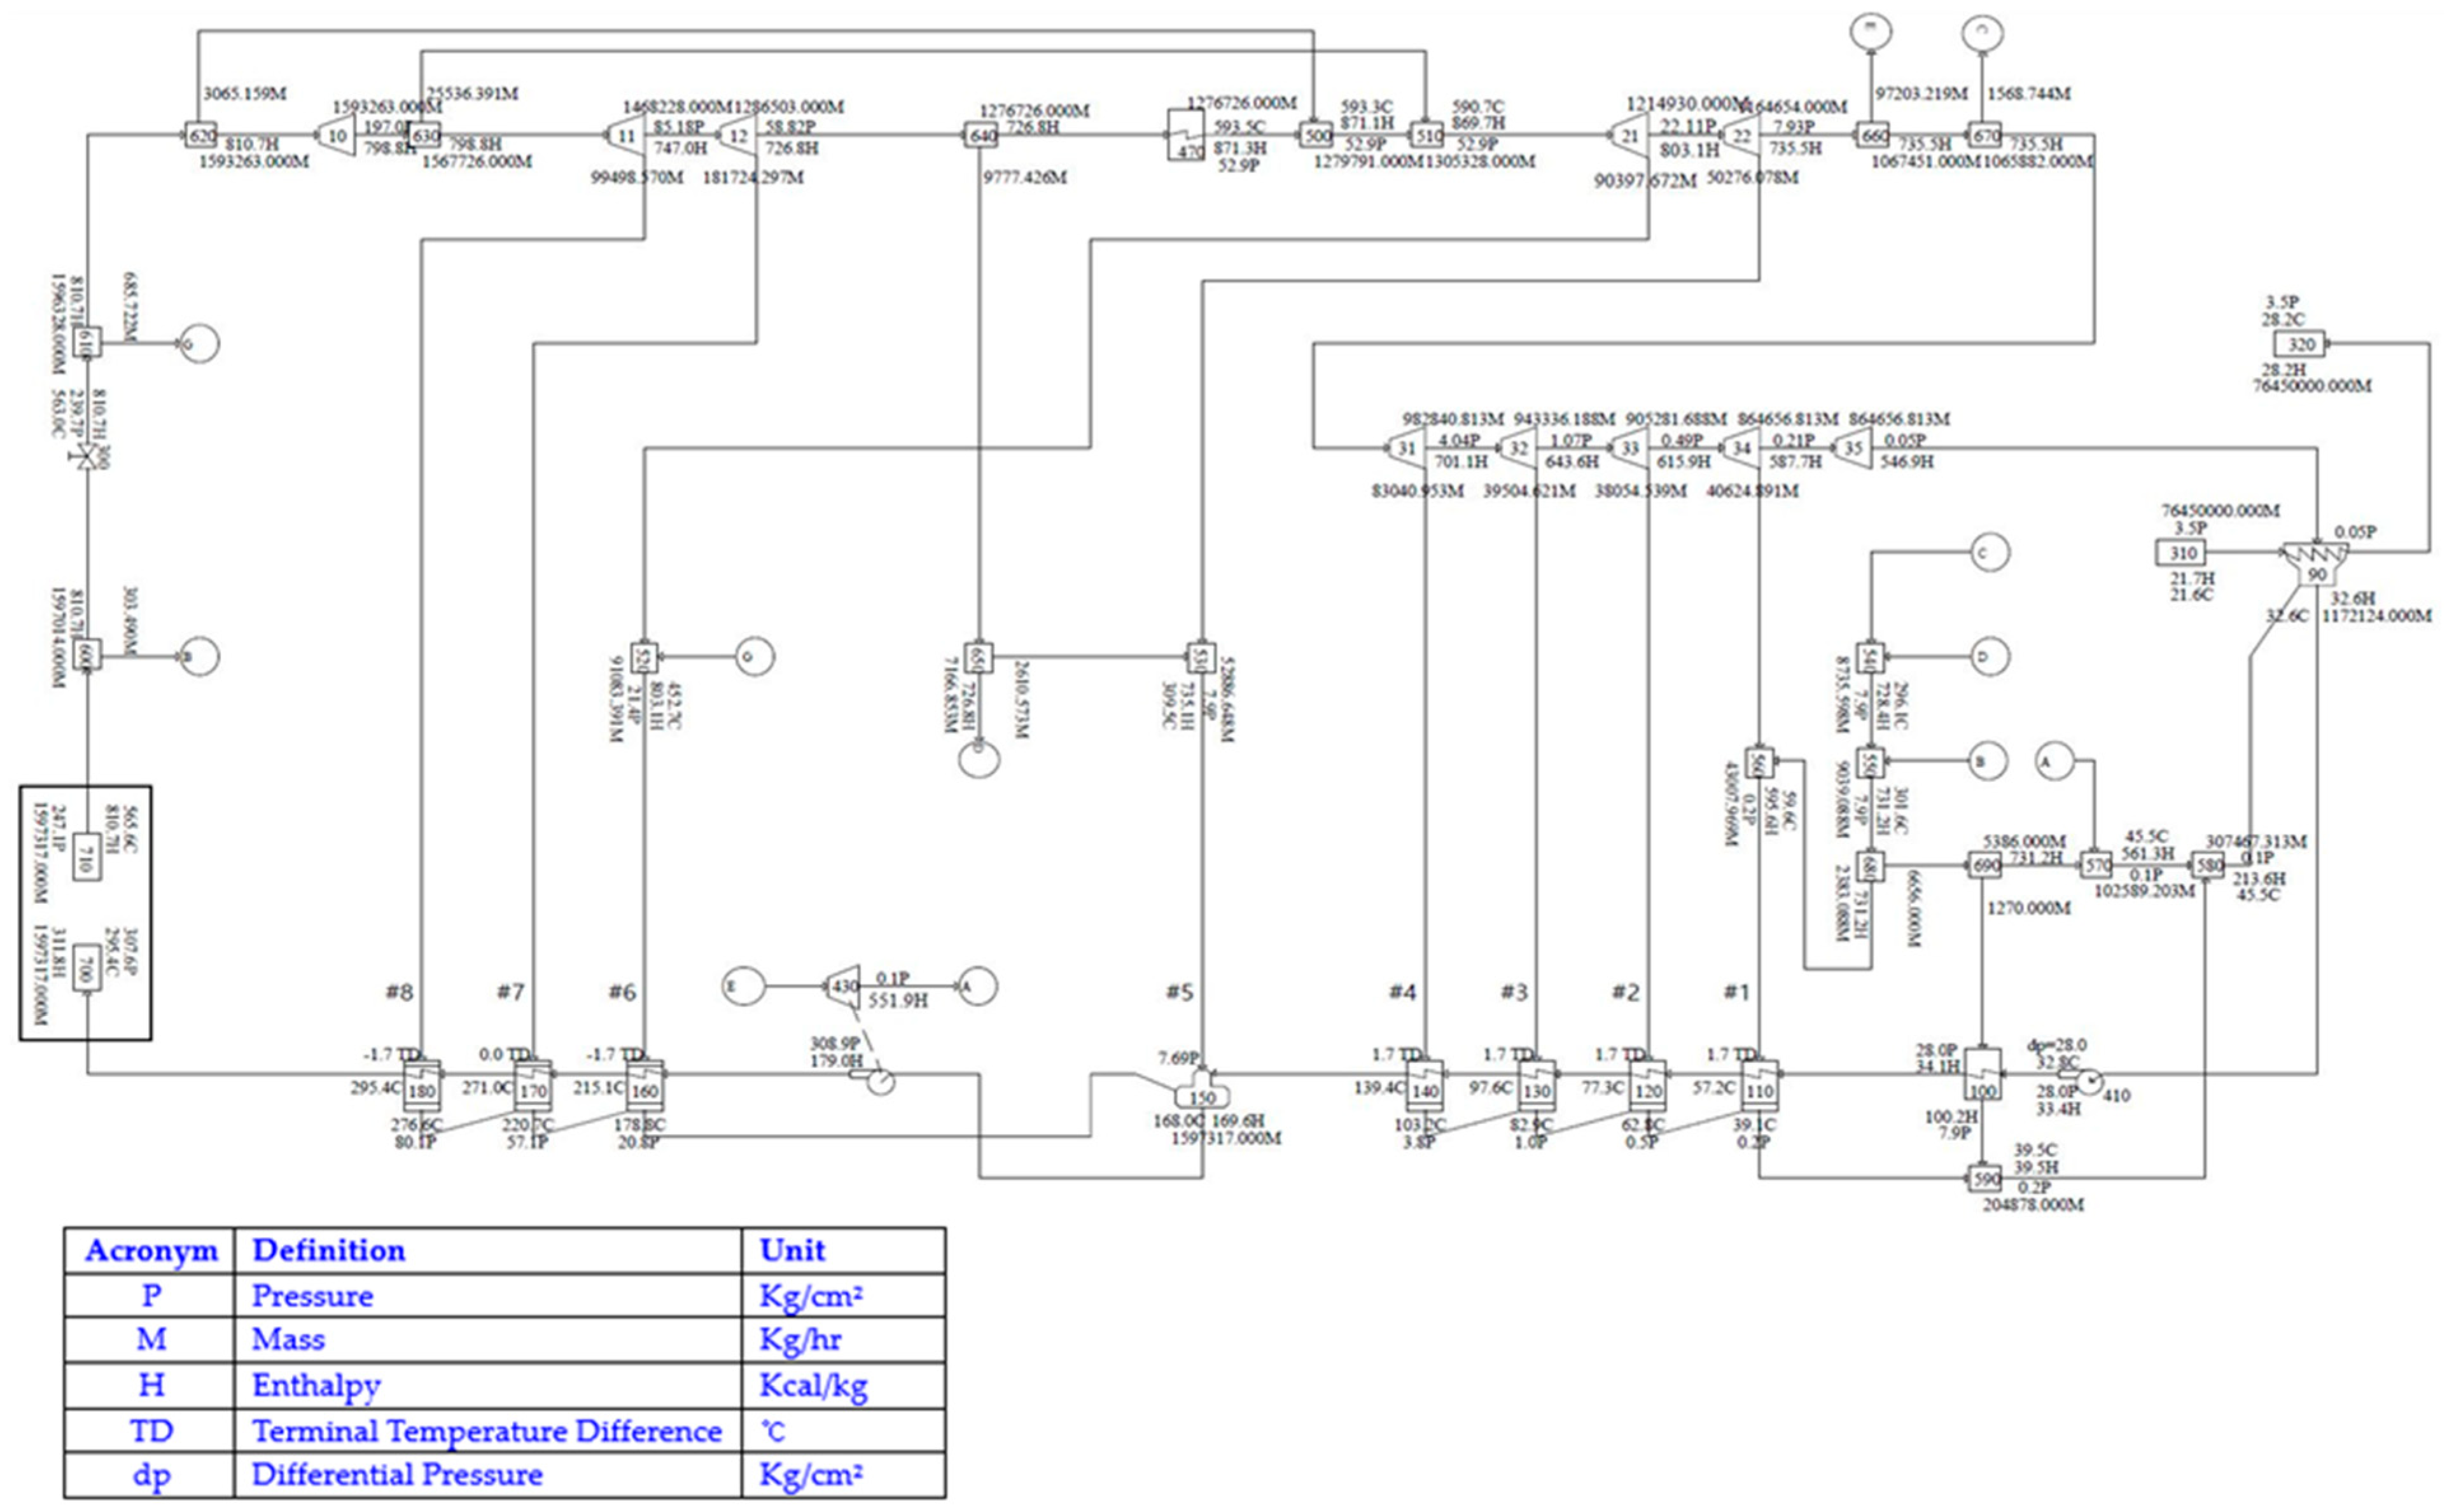
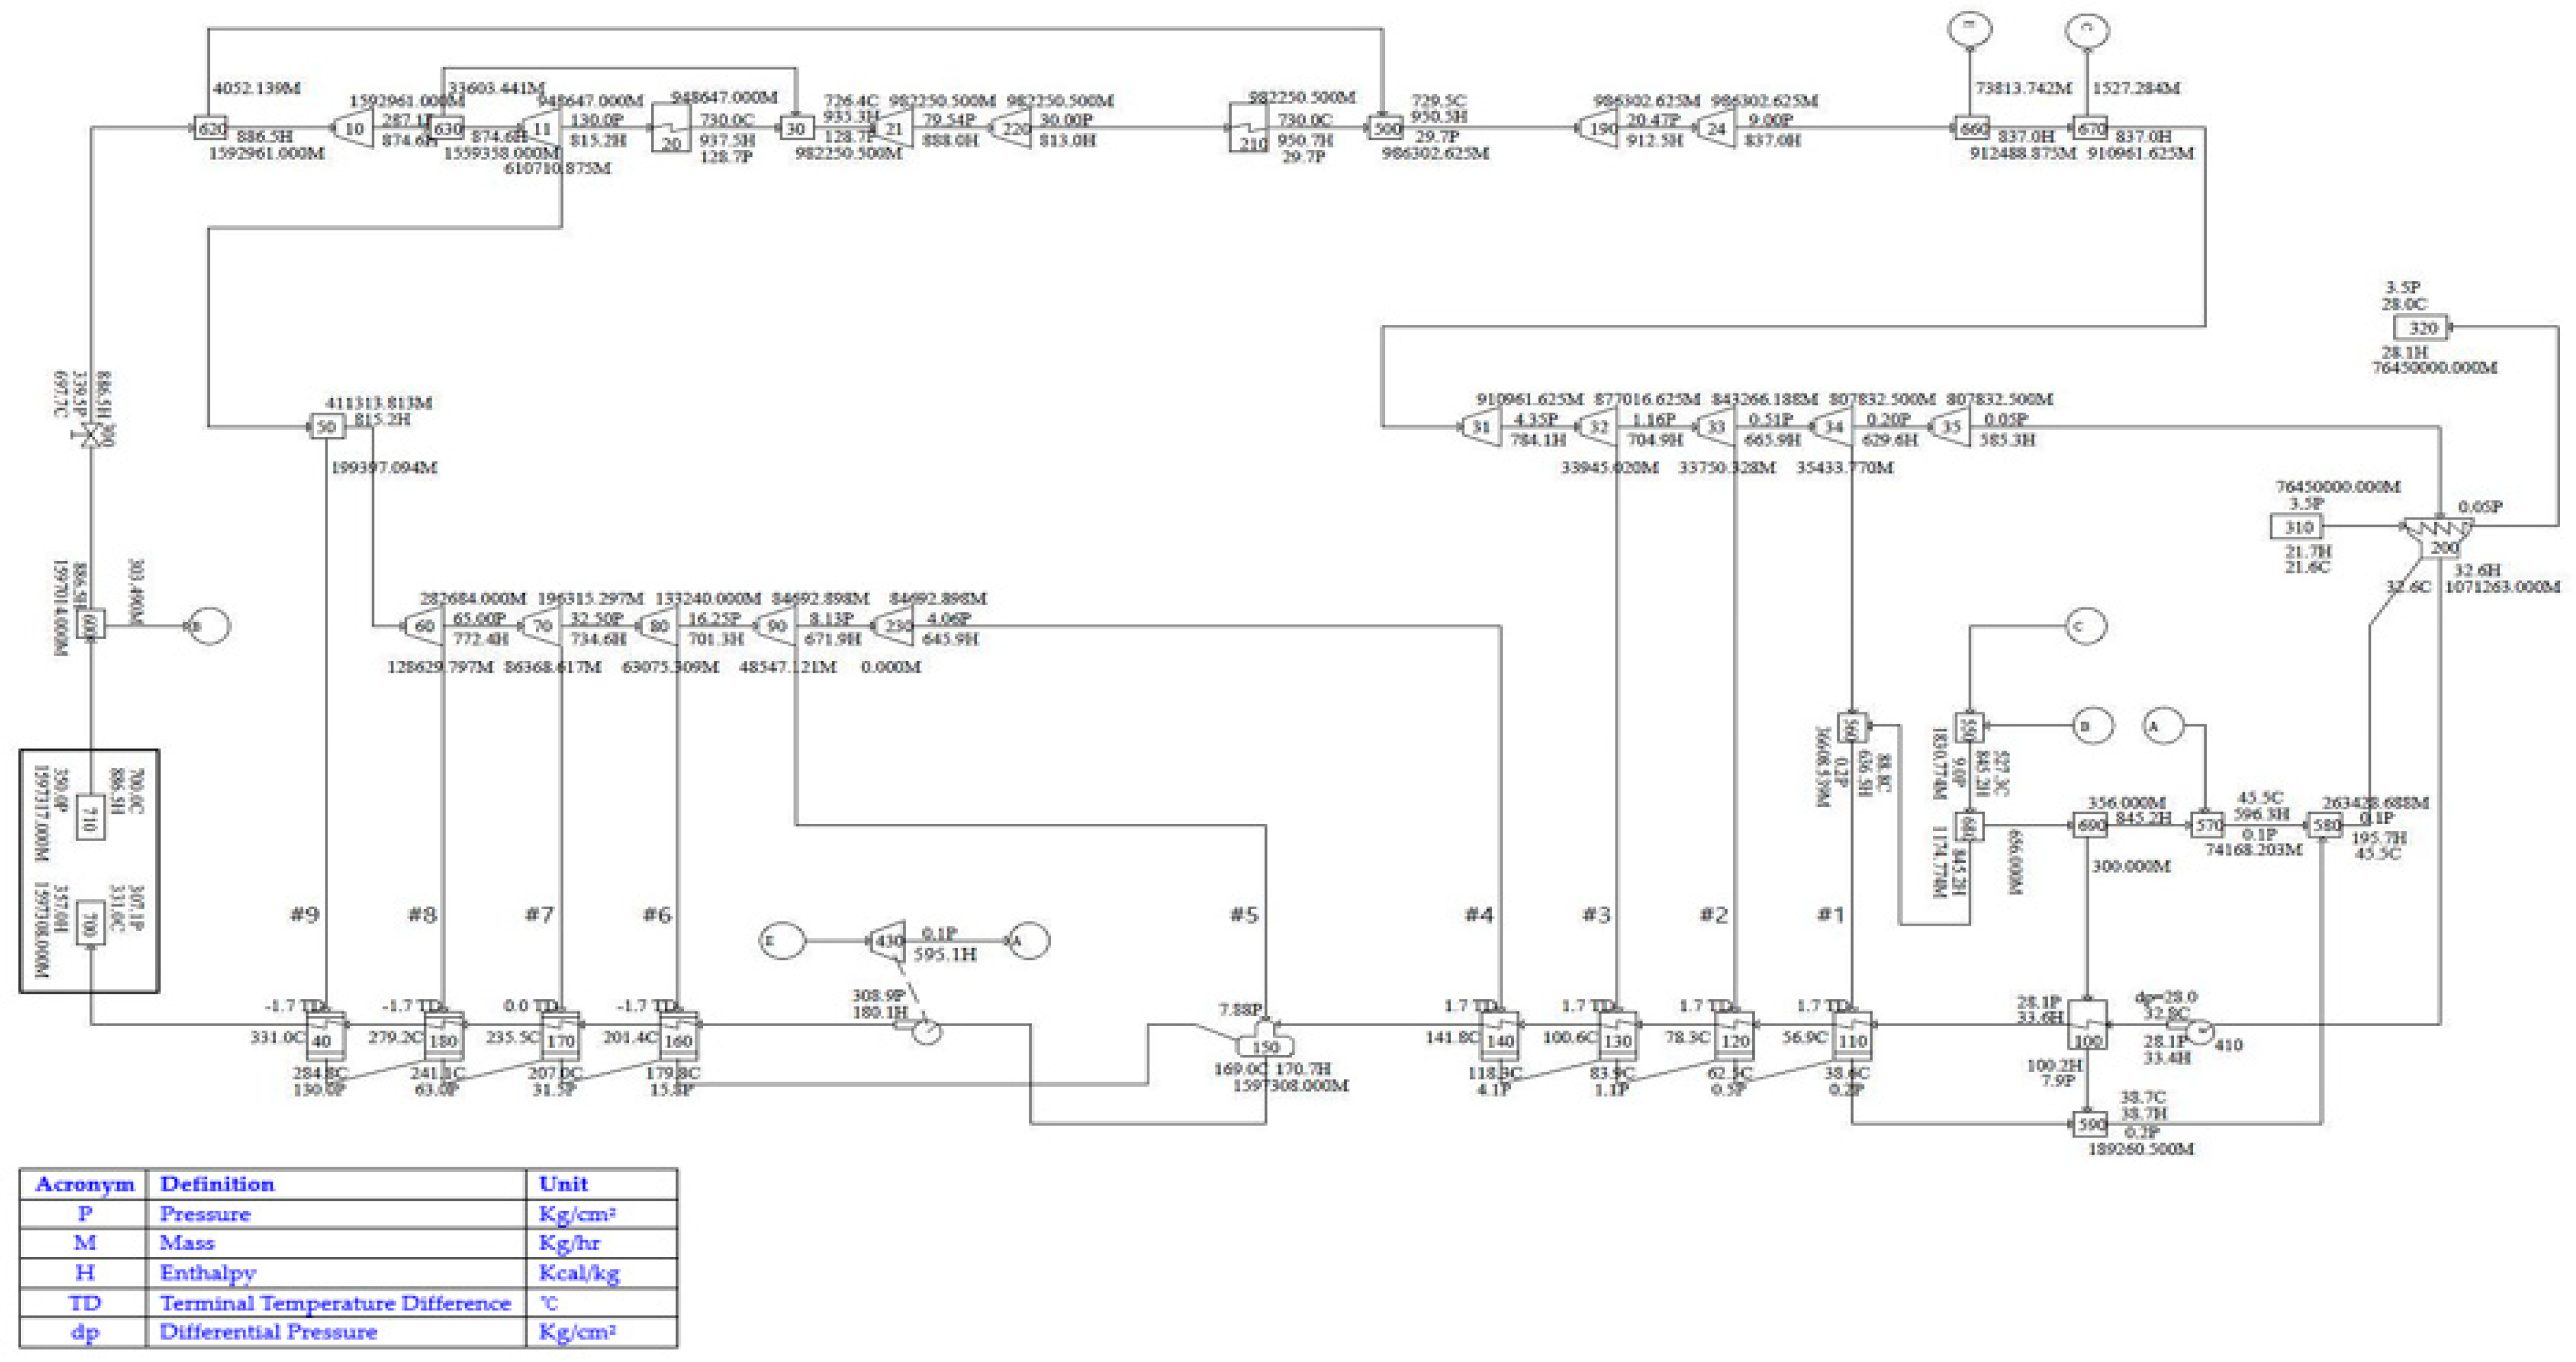
The 500 MW USC pressure coal-fired power plant used to develop the reference model is currently in operation in South Korea. The power plant consists of a single reheater (SR) and eight feedwater heaters (FWH) and includes a reheat and regeneration cycle. The plant consists of a high-pressure steam turbine, a medium pressure single flow turbine and a low-pressure double flow turbine in tandem. The turbine back pressure is 38.1 mmHg. The output, heat consumption rate and steam conditions for each load are shown in Table 2 and a simplified model can be seen in Figure 3.
The study of the steam cycle is bound by the turbine and boiler, first stage reheater, condenser, multiple and feed pump, deaerator and water heater as shown in Figure 3. The authors made the assumption that efficiency is estimated separately from the system. The boiler was not included in the analysis as the design work of the manufacturer.
The 500 MW A-USC pressure coal-fired test power plant was developed based on the IEA steam conditions of an A-USC plant. The main steam temperature and the reheated steam temperature were selected as 700 °C/730 °C, which is the next generation ultrasonic threshold pressure development target of IEA [3]. Based on the steams condition of the USC steam cycle described above, the main steam pressure was selected to be 350 kg/cm2, in which the fluctuation of the output and the heat consumption rate were almost eliminated. The main input variables required for the PEPSE software are the same as the 500 MW USC plant design specifications.

3.2. PEPSE Model

The PEPSE (version 77) software was used to simulate plant operation optimizations. The reason this tool was used, is that it allows an analysis of both the plant and the individual components. It was specifically developed to perform quick ‘what if’ studies to test potential efficiency improvements, which is the goal of this study. The system has also a history of success, being used within industry for more than 30 years. It remains current to the existing computing requirements and industry practices through frequent version improvements (currently on version 77). The program allows modeling of the turbine steam cycle, coal fueled boiler process, the combined cycle, and heat recovery equipment functionality. PEPSE allows discussions on the performance of individual components of the equipment; the effects of changing equipment, operating conditions, and design; and calculating efficiency, optimization, and sensitivity (more information on the software can be found on the software website [31].

3.3. Model Development and Verification

The performance prediction models used for this paper are as presented by the seminal works of Spencer and Cotton [32]. Based on these prediction theories as simulated in the PEPSE software, the authors estimated the performance change based on initial steam conditions of the 500 MW USC power plant. The first variable to be determined is the internal efficiencies of the turbines which refers to the ratio of used energy to available energy. While there are methods to estimate this, the authors used the 500 MW USC operational turbine driven feed pump efficiency of 84% for the turbine, 83% for the pump and 80% efficiency for multiple pumps.
The outlet pressure of the first stage of the high-pressure turbine is determined by the available energy (AE), which is an adiabatic heat fall. In addition, the steam outflow rate is determined by the pitch diameter (PD) of the first stage of the high-pressure turbine as shown in Equation (1) and the optimal speed ratio condition as defined by the speed ratio (W/V0) curves [33]. In this paper, per the speed ratio curves, the turbine achieves the highest efficiency at 0.5. The remaining stages of the high-pressure turbine have a constant pressure ratio as determined by the load variation [34].
W V 0 = 0.5 = π P D V 0 60 ,
where W is the outflow rate, V0 is the inlet diameter, and PD is the pitch diameter which is 949.96 mm for this paper.
If the pressure ratio of each stage is constant, general flow rate can be simply expressed as follows, where C is the bowl flow coefficient [34].
w = C P i ν = C P i 1 T i ,
where w is the outflow rate, C is the bowl flow coefficient, Pi is the inlet pressure, v is the mean flow velocity, and Ti is the inlet temperature.
In the final stage of the low-pressure turbine and the condenser, the exhaust loss that is not converted to work occurs as exhaust speed loss, the exhaust chamber pressure drops, the final stage windage, and the annular area limit loss. The final stage windage and cyclic area limitation losses occur at the bottom and in special operating conditions and are not taken into account here. The exhaust loss of the operational 500 MW USC power plant is represented as a function of the annulus velocity as shown in Figure 4, below.
The loss of pressure drop in the exhaust chamber can be neglected compared to the loss of the outlet velocity. In most steam turbines, the exit velocity of the final steam of the low-pressure turbine can be obtained from Equation (3) and the total exhaust loss (TEL) is determined from the exhaust loss curve as a function of the outflow velocity of the final stage steam [34].
V a n = w a ν ( 1 0.01 Y ) 3600 A a n ,
where Van is the exit velocity, wa is the exit flow rate, v is the mean flow velocity, Aan is the exit area or exhaust annulus area which is 8.11 m2 per end for the low-pressure turbine for this paper, and Y is the percent weighted average moisture at the expansion line end point (ELEP).
The low-pressure turbine end-end entropy (TEP) is also referred to as the used energy end point (UEEP) which, for this paper, is obtained by adding the ELEP and the total exhaust loss, corrected for the effect of wetting [34].
H U E E P = E L E P + T E L ( 1 0.01 Y ) E D M L ,
where HUEEP is the used energy end point entropy, HELEP is the expansion line end point entropy, TEL is the total exhaust loss, Y is the percent weighted average moisture at the ELEP, ED is the dry efficiency of the fictitious turbine stage defined as 0.87 for this paper, and ML is the moisture loss coefficient defined by 1 − 0.00065Y.
The outlet conditions for water heating in the steam cycle are determined by the drain cooler approach (DCA) and terminal temperature difference (TTD). DCA means the difference between the outlet temperature of the heated steam and the inlet temperature of the feed water. TTD means the difference between the saturation temperature of the heated steam and the outlet temperature of the feed water. The smaller the DCA and TTD, the higher the temperature efficiency. However, the larger the heat transfer area of the water heat exchanger, the larger the volume becomes. For this paper’s model, the TTD/DCA are as follows: 1.7/5.6 °C for feedwater heaters 1 to 5, −1.7/5.6 °C for feedwater heaters 6 and 8, and 0/5.6 °C for feedwater heater 7. Furthermore, for this paper, the steam cycle is analyzed in a performance prediction mode in which the TTD and DCA of the feedwater heat exchanger are kept constant, even when the load variation or the steam flow rate is changed. Therefore, if the heating vapor enthalpy of the water inlet is not changed, the supply flow of the heating steam changes to maintain DCA and TTD.
Overall, the PEPSE software developed a model based on the variables presented in Table 2 and equations and assumptions as presented above (for a full description of the PEPSE process, review the PEPSE manual engineering model description [33]). Using the process and variables presented above, the model was developed based on the VWO and 100% MGR, 75% MGR and 50% MGR steam conditions. The internal efficiency of the initial steam reflected the VWO condition. Changes to the distribution efficiency per changes in initial steam conditions were performed according to the procedure of Spencer and Cotton [32]. The flow coefficient of the bowl at each stage of the turbine excluding the first stage of the high pressure (HP) turbine was constant regardless of the load variation. The water heater was set to performance mode. TTD (terminal temperature difference) and DCA (drain cooler approach) should be kept constant. From the above equations and assumptions, the turbine constants used for the model can be seen below in Table 3.
The baseline USC simulation model (a single reheater and eight feedwater heaters) schematic is constructed as shown below in Figure 5.
The simulation model’s accuracy was then verified by comparing the simulation and actual operational power output and heat consumption rate (performance calculations shown below in Section 3.4). Table 4 shows the comparison between the developed simulation model and actual plant performance. It is confirmed that the error of the result value is within ± 1% at all loads. In this paper, it is confirmed that the VWO condition which was used as the basis of the simulation analysis has an error range within ± 0.5%.
The simulation model, verified to be accurate in calculating USC power output and heat rate, was then slightly modified to A-USC simulation model. The changes to the system included a main steam temperature and reheated steam temperature of 700 °C/730 °C and main steam pressure of 350 kg/cm2. The remaining variables were the same as the 500 MW USC plant design specifications. An example A-USC simulation model (double reheater or DR), nine feedwater heaters, and a regenerative turbine) schematic is constructed as shown below in Figure 6.

3.4. Performance Analysis

The main performance indicators for evaluating the steam cycle of a power plant are the power output, thermal efficiency, and heat rate of the turbine generator. The power generation efficiency can be calculated by the input/output method (Equation (5)) or the heat loss method. The input/output method is used to calculate the turbine generator efficiency
η p = K W G 860 W F E H H V Q B 100 [ % ] ,
where ηp is the power generation efficiency, KWG is the power output of the generator, WFE is the fuel consumption, HHV is the high heating value of the fuel, QB is the additional heat input, and ML is the moisture loss coefficient defined by 1 − 0.00065Y.
Alternatively, the heat loss power generation efficiency method is expressed by multiplying the boiler thermal efficiency (ηB) by the turbine thermal efficiency (ηT) minus the plant loss (PL). Note that the plant losses are estimated because it is virtually impossible to directly measure losses in boilers or turbines. This is the method used for this paper and shown below in Equation (6)
η p = η B η T 100 Δ P L [ % ] ,
where ηp is the power generation efficiency, ηB is the power generation efficiency assumed to be 90.8% based on historical operational data of the existing 500 MW USC plant, ΔPL is the plant loss assumed to be 0.1% also based on historical operational data of the existing 500 MW USC plant, and ηT is the power output of the generator defined by the following equation:
η T = 860 H e a t R a t e 100 [ % ] ,
Having established the baseline USC and A-USC models, a single reheater (SR) and eight feedwater heaters, the authors introduce and test the impact of three variables, as follows: introduce a regenerative cycle or addition of one feedwater heater (9 FHW), introduce a reheat cycle or addition of one reheater (double reheater or DR), and introduce a regenerative turbine. For all applications, the VWO condition was used for the steam flow rate. The authors performed simulation analysis in the order as follows: the addition of a feedwater heater, the addition of reheater, and the addition of feedwater heater and reheater. For each step, the authors observed changes in the heat consumption rate of the steam cycle, total power output, turbine efficiency, and wet steam at the final stage of the low-pressure turbine. For all analyses, the pressure drop ratio of various piping and tubes and the bowl flow rate of each stage of the turbine were maintained at the set values, the TTD and DCA of all feedwater heaters remained the same in simulation at all times, and the TTD and DCA of the No. 9 high-pressure feedwater heater was set to the same value as the existing No. 8 high-pressure water heater.
From the observed results, it was witnessed that often the extraction steam was overheated and caused efficiency problems (and can even cause steam tube failure). Thus, the authors also introduced a regenerative turbine (RT) which reduces the extraction steam heat. The authors examined the impact of the RT on the most extreme scenario (A-USC DR & 9 FHW), observing the heat consumption rate of the steam cycle, total power output, turbine efficiency, and superheat degree of extraction steam. The A-USC DR and 9 FHW with and without an RT performance were then used to perform an economic analysis to see the fiscal feasibility of using an RT.

3.5. Economic Analysis

The authors performed an economic analysis on the use of the RT by calculating the net present value (NPV), internal rate of return (IRR), and net annual revenue (NAR). NPV calculates the present value of future cash flows using a discount rate. For this paper, if the NPV is greater than $0, the investment is considered economically viable. NPV is calculated in Equation (8):
NPV = t = 0 n C F I C F O ( 1 + r ) t ,
where CFI is the cash flow input, CFO is the cash flow output, r is the discount rate assumed to be 8% for this project, and t is time.
The IRR is the discount rate at which the present value of the future cash inflows from the investment is equal to the present value of the cash outflow. In other words, this means the discount rate that makes the NPV mentioned above zero. If the IRR is greater than the identified target discount rate, the investment is considered to be economical. The IRR is calculated in Equation (9):
IRR = r W h e n N P V = t = 0 n C F I C F O ( 1 + r ) t = 0 ,
where CFI is the cash flow input, CFO is the cash flow output, r is the desired discount rate assumed to be 8% for this project, t is time, and n is the duration under assessment or expected lifespan of the project which is 30 years for this paper.
The data required for the economic analysis of the model using advanced supercritical pressure model and the reduction method of degree of extraction steam are shown in Table 5. Electricity unit price and bituminous coal fuel cost refer to Electric Power Statistics Information System (EPSIS) of South Korea [35]. The remaining data are collected from the operational 500 MW USC power plant. The discount rate of the reference information is assumed to be 8% of the weighted average cost of capital, which means the minimum required return on future investment in the present market conditions. Depreciation expense is calculated using the straight-line method assuming a 20 years design-life in accordance with the accounting policies of South Korean power generation companies. Income tax is estimated at 25% including resident tax. In addition, maintenance cost is calculated by adding the average unit cost of labor costs, repair and maintenance costs and expenses among total costs of Korea Electric Power Corporation (KEPCO) in 2013. The RT cost was found to be USD 4.32 million, the piping USD 1.39 million and the installation cost USD 0.29 million. Thus, the total RT investment cost is USD 6.0 million [36]. Tax rates and energy efficiency are also shown in Table 5.

4. Findings

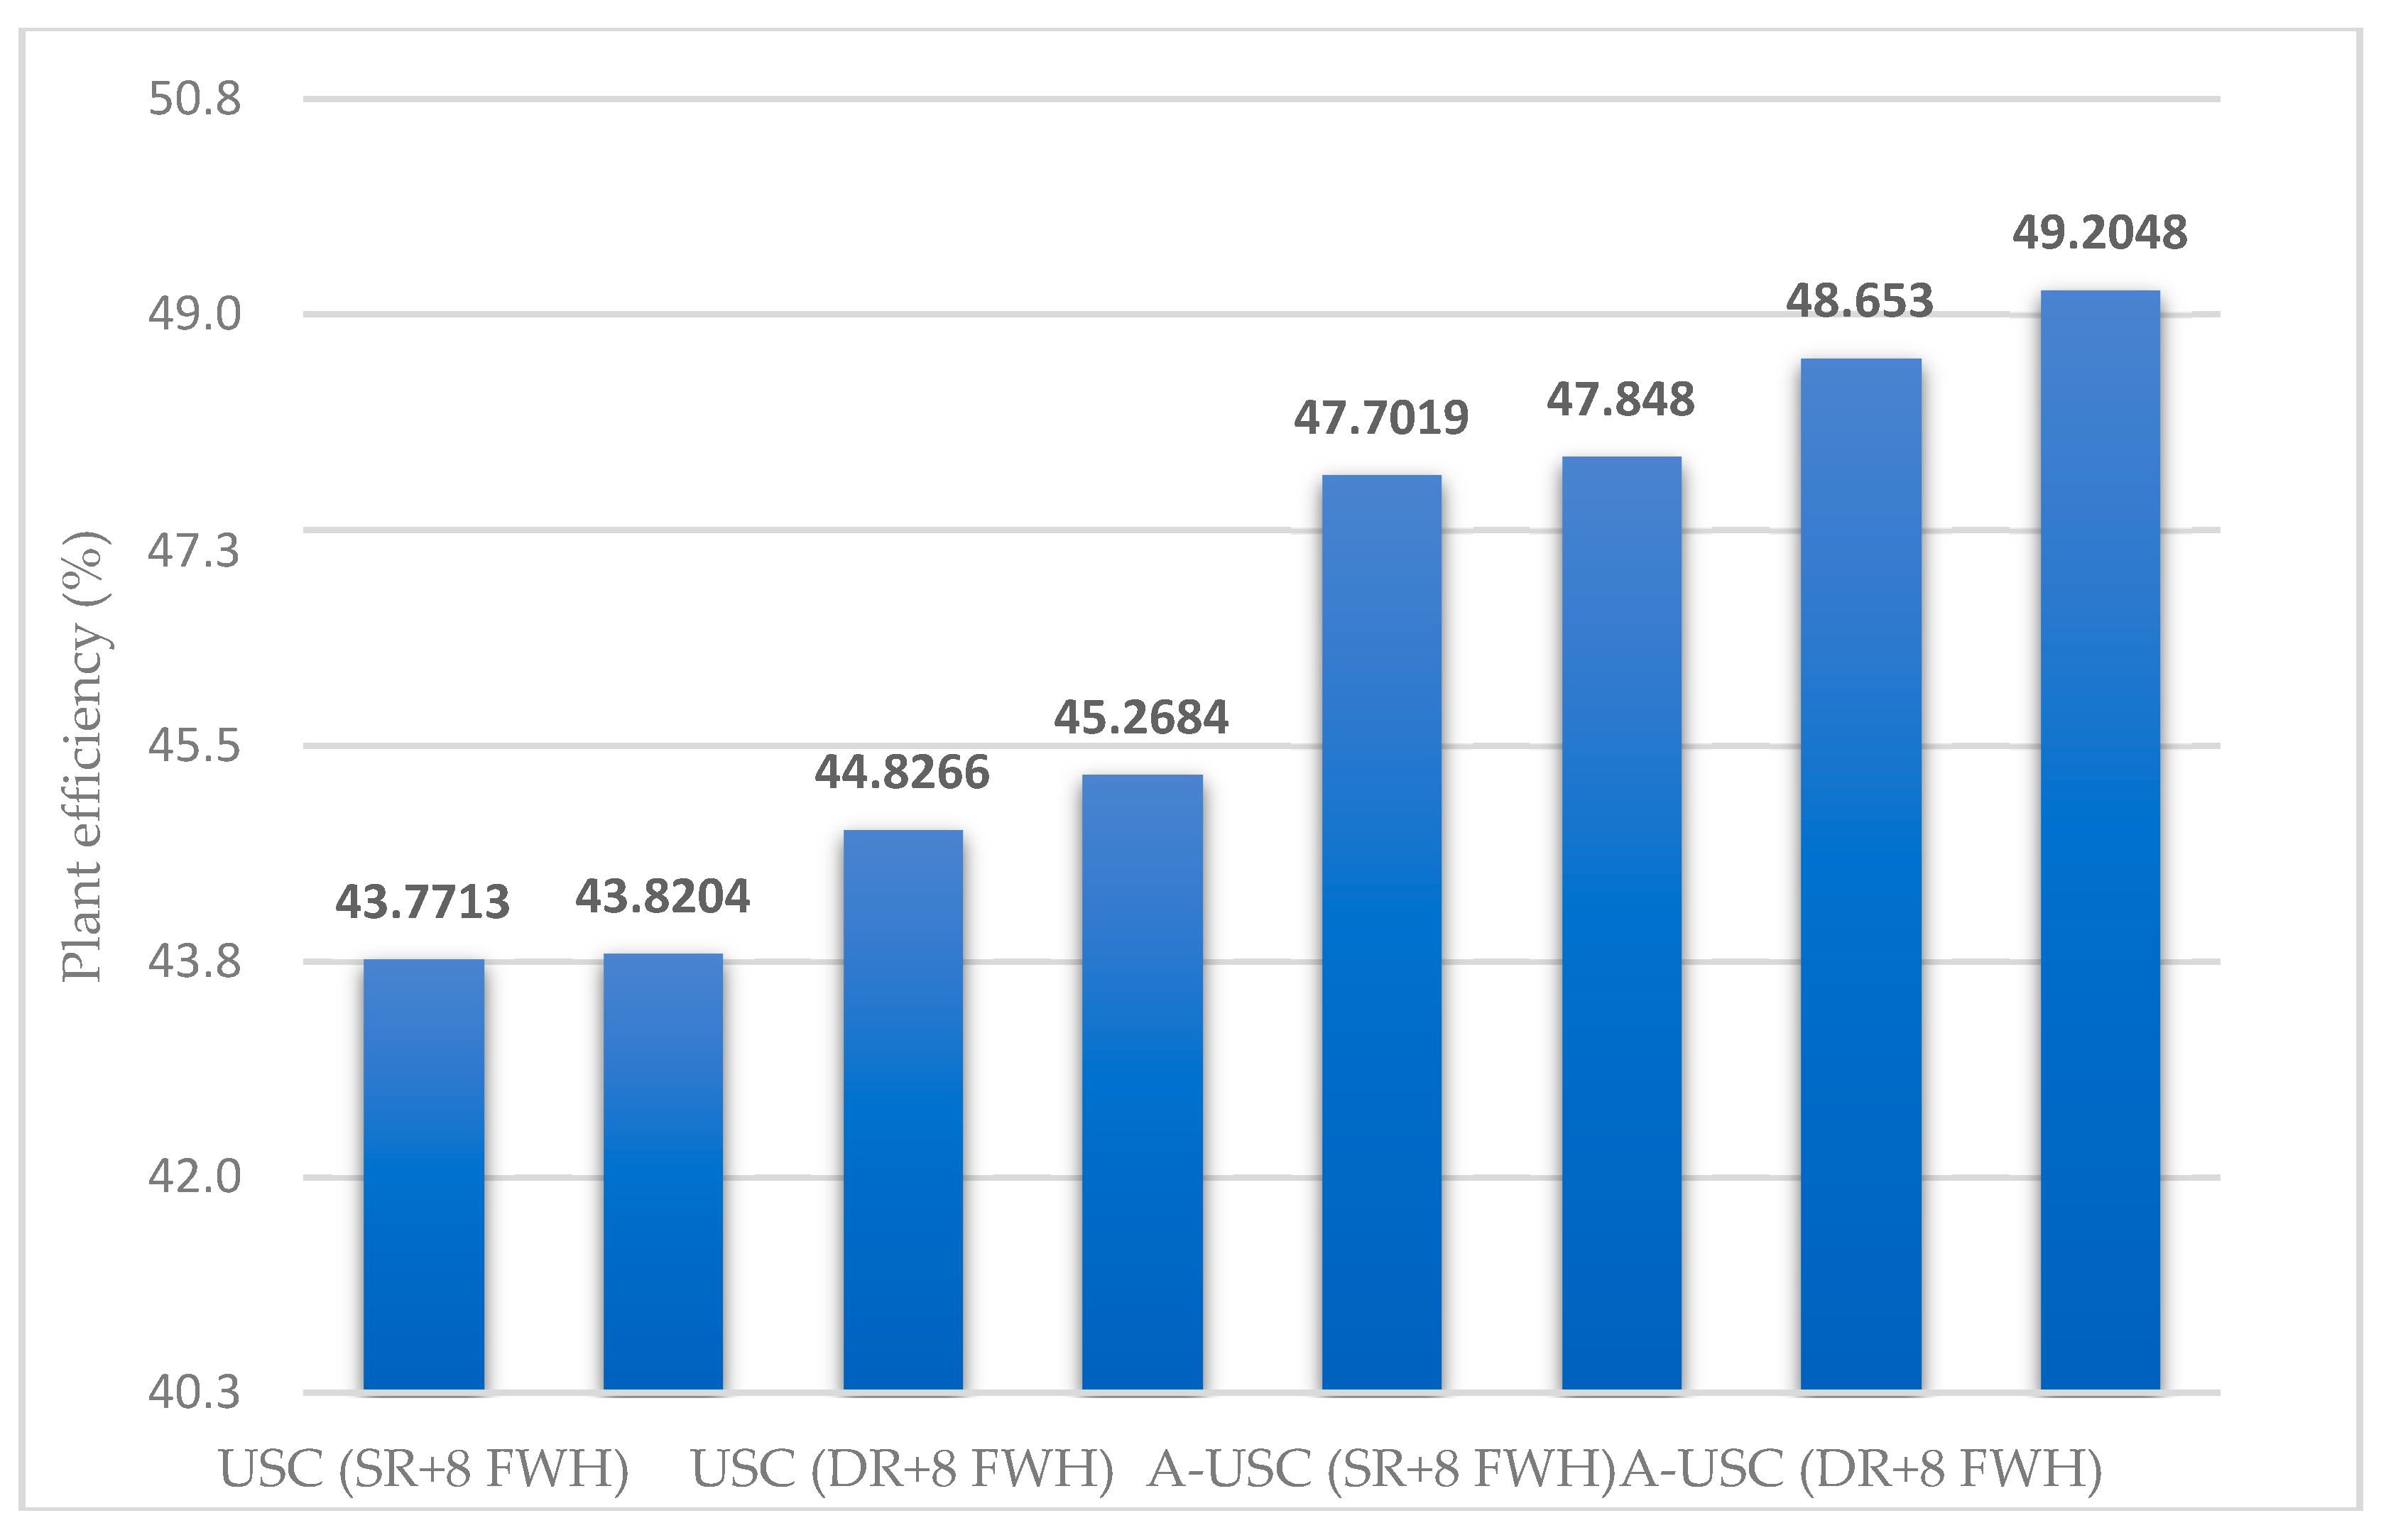
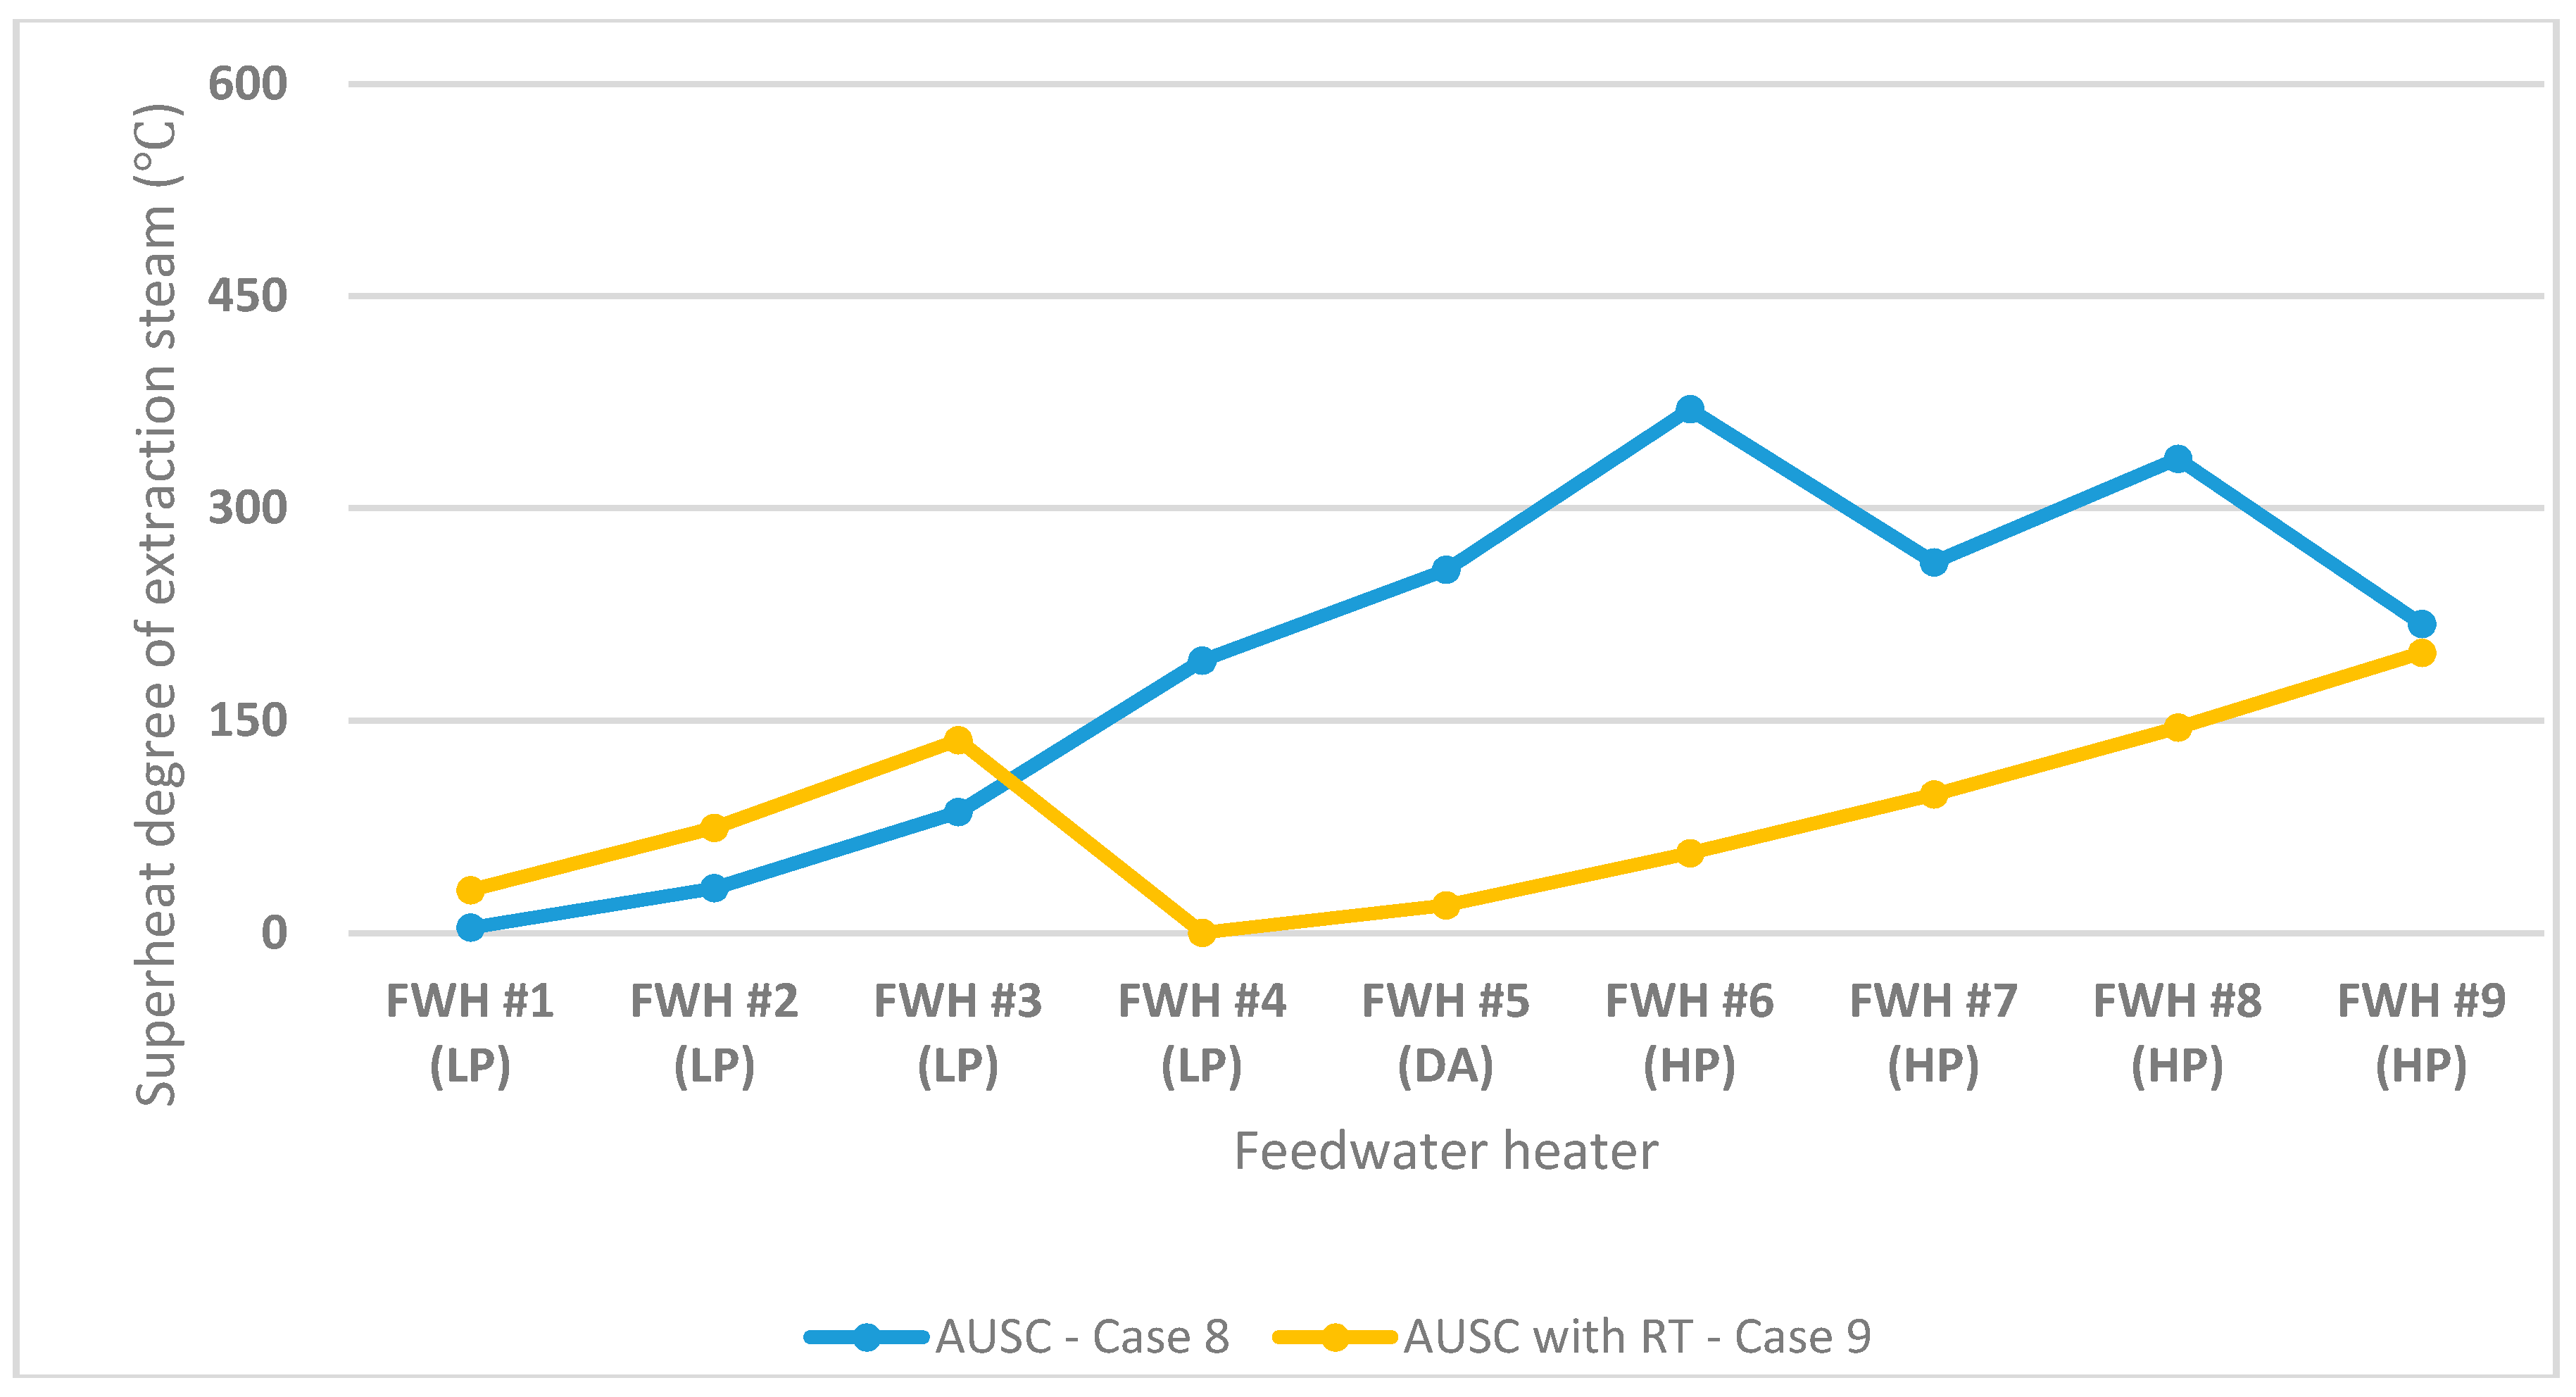
4.1. Performance Analysis

The impact to the power output and heat rate in introducing a regeneration cycle (9 FHW) and reheat cycle (DR) are shown in Table 6. The FWH addition to the USC and A-USC models increased the final feedwater temperature. However, the total power output decreased with no significant impact to the overall heat consumption rate because the final feedwater was added to the extraction steam. We see similar results when the FWH is added to the reheat cycle. Alternatively, both the power output and the heat consumption rate were improved when only the reheat cycle was introduced (DR). The ultimate turbine efficiency is achieved when both the reheat and regenerative cycles are introduced.
The optimal scenario therefore appears to be introducing the reheat cycle (DR) without introducing the regenerative cycle (8 FHW). When comparing DR + 8 FWH and DR + 9 FWH for A-USC, the power output is higher at 8 FWH. This may seem good when considering only the revenues, but 9 FWH is most suitable from the viewpoint of power plant efficiency when the purpose of this study is considered. The reason why the power output is lowered by the addition of the feedwater heater (i.e., 8 FWH→9 FWH), is that the steam flow value of each simulation model is set equal in the simulation analysis. If the power output is set to the same value, the mass flow rate of the steam generated in the boiler must be set differently. However, this change in setting does not affect the value of the heat consumption rate. This study aims at improving efficiency and optimizing as mentioned above. Therefore, the authors focused on heat consumption rate and power plant efficiency. The power plant efficiency was obtained by the following Equation (6). From the turbine efficiency, the authors were able to calculate the total plant efficiency, assuming a boiler efficiency of 90.8%. As shown in Figure 7, the model with the greatest plant efficiency was still found to be the A-USC (DR + 9 FWH), at 49.2%.
Based on existing findings in literature [36], the authors are aware that these conditions can cause extreme superheating of the extraction steam, which reduces plant efficiency and may cause equipment damage. The superheating degree of extraction steam is the value obtained by subtracting the saturation temperature corresponding to the operating pressure of the condensing zone of the water supply at the feedwater heater temperature. If the degree of superheat becomes excessively high, heat energy cannot be utilized for heat exchange with the water supply, and the lost heat energy is increased. In addition, if the superheat degree becomes higher than the proper level, it is necessary to apply the high specification material to the additional piping and the feedwater heater, otherwise, thermodynamic problems may occur. As such, the authors assessed the impact each model has on the superheating of the extraction steam (S.H. Degree). As can be seen in Table 7, the DR has significant impacts on the superheating, nearly 100 °C in comparing the A-USC SR + 8 FWH to A-USC DR + 8 FWH.
While the most efficient plant model is the A-USC DR and 9 FHW from Figure 7, it is seen in Table 7 that this configuration creates a superheat degree dangerously high. One option to mitigate these issues is to add a regenerative turbine, which effectively lowers the elevated superheat temperature. This mitigation measure modifies the plant by replacing part of the exhaust steam of the reheat shear with the RT, sending it to each feedwater heater without additional reheating of extraction steam. As a result, it was confirmed that the superheat degree of each extraction steam is reduced as shown in Table 8 and Figure 8.
Table 9 shows the performance comparison of the A-USC with and without the superheat reduction method. It was found that both the output and the efficiency were improved by reducing the superheat degree of extraction steam through RT. The advantage of this configuration is that it not only improves performance, but also eliminates thermodynamic problems that may be caused by high temperatures, while at the same time eliminating the need to apply high-quality materials. It is also one of the advantages that the configuration of the IP turbine can be made more concise. For more practical results, various design data such as boilers, steam turbines and generators, machines and controls should be considered. However, if performance conditions such as the same feedwater flow rate, the back pressure of the condenser, and the water supply heat are the same under the VWO condition, a highly efficient eco-friendly power plant with a total output of 695.5MW and a plant efficiency of 49.5% respectively is expected.

4.2. Economic Analysis

Using the above data, the authors then performed an NPV and IRR analysis on the A-USC power plant with and without an RT installed. For the A-USC power plant without a RT, when the investment cost is USD 1778.52 million, the net present value is zero. Alternatively, for the A-USC power plant with a RT, when the investment cost is USD 1795.75 million, the net present value is zero. These assessments are based off of a power plant lifespan of 30 years and an IRR of 8% based on the operational plant’s company preferences and Korean market conditions. This finding means that the A-USC with an RT can be economically feasible at a higher investment requirement, approximately USD 17 million higher. The authors performed this analysis as, in the early planning stages, initial investments can often have significant uncertainty. These results provide the reader and industry with a maximum allowable investment for an A-USC with and without an RT. Figure 9 shows the relationship between the initial investment and IRR for (a) A-USC without an RT and (b) A-USC with an RT.
The required investment for the 500 MW USC referenced power plant was approximately USD 1409 million. While the 500 MW A-USC would likely cost slightly more, the authors used this initial investment to perform the NPV and IRR analysis. While these values may be slightly inaccurate, they are still of value to allow a comparison between the A-USC not installing and installing an RT. As can be seen in Table 10, with the assumptions of a 30-year lifespan, 8% discount rate, and USD 1409 million initial investment, the A-USC has an increased NPV of 33 million and a 0.2% higher IRR. In conclusion, if the RT is installed in advanced supercritical pressure power plant, the initial investment cost will increase, and the net profit will increase by about USD 3 million each year, while the initial investment cost of RT will be recovered within about 4–5 years was predicted.
In the above analysis, the cost of bituminous coal fueled encompasses approximately 70% of the annual cash outflow. In particular, the authors analyzed how the minimum investment cost of fuel cost changes as fuel cost fluctuates with time. For reference, the minimum investment cost means the cost of bringing the net present value to zero during the lifetime of the plant. Fuel costs in South Korea soared from the year 2008. This is because fuel consumption has increased sharply due to the accelerated industrialization of countries with global economies such as China and BRIC. Although fuel cost has dropped since 2012, fuel costs are expected to change drastically once again as the global energy industry changes. Since 2001, fuel cost’s lowest unit price was as 1 cent/kWh in August 2003 and the highest unit price as 5 cent/kWh in February 2009. The authors performed an NPV and IRR analysis on these scenarios, along with the most likely 3 cent/kWh scenario. The results are shown in Table 11.
As can be seen, there is an approximate USD 1850 million difference across the pessimistic, most likely, and optimistic scenarios. From these findings, it is confirmed that the optimal investment cost is linearly inversely proportional to the fuel unit price when the A-USC with RT model is applied. This means that if the unit price of fuel is increased by 0.1 cent/kWh, the NPV is reduced by about USD 925 million. Fuel cost has a great influence on the investment cost.

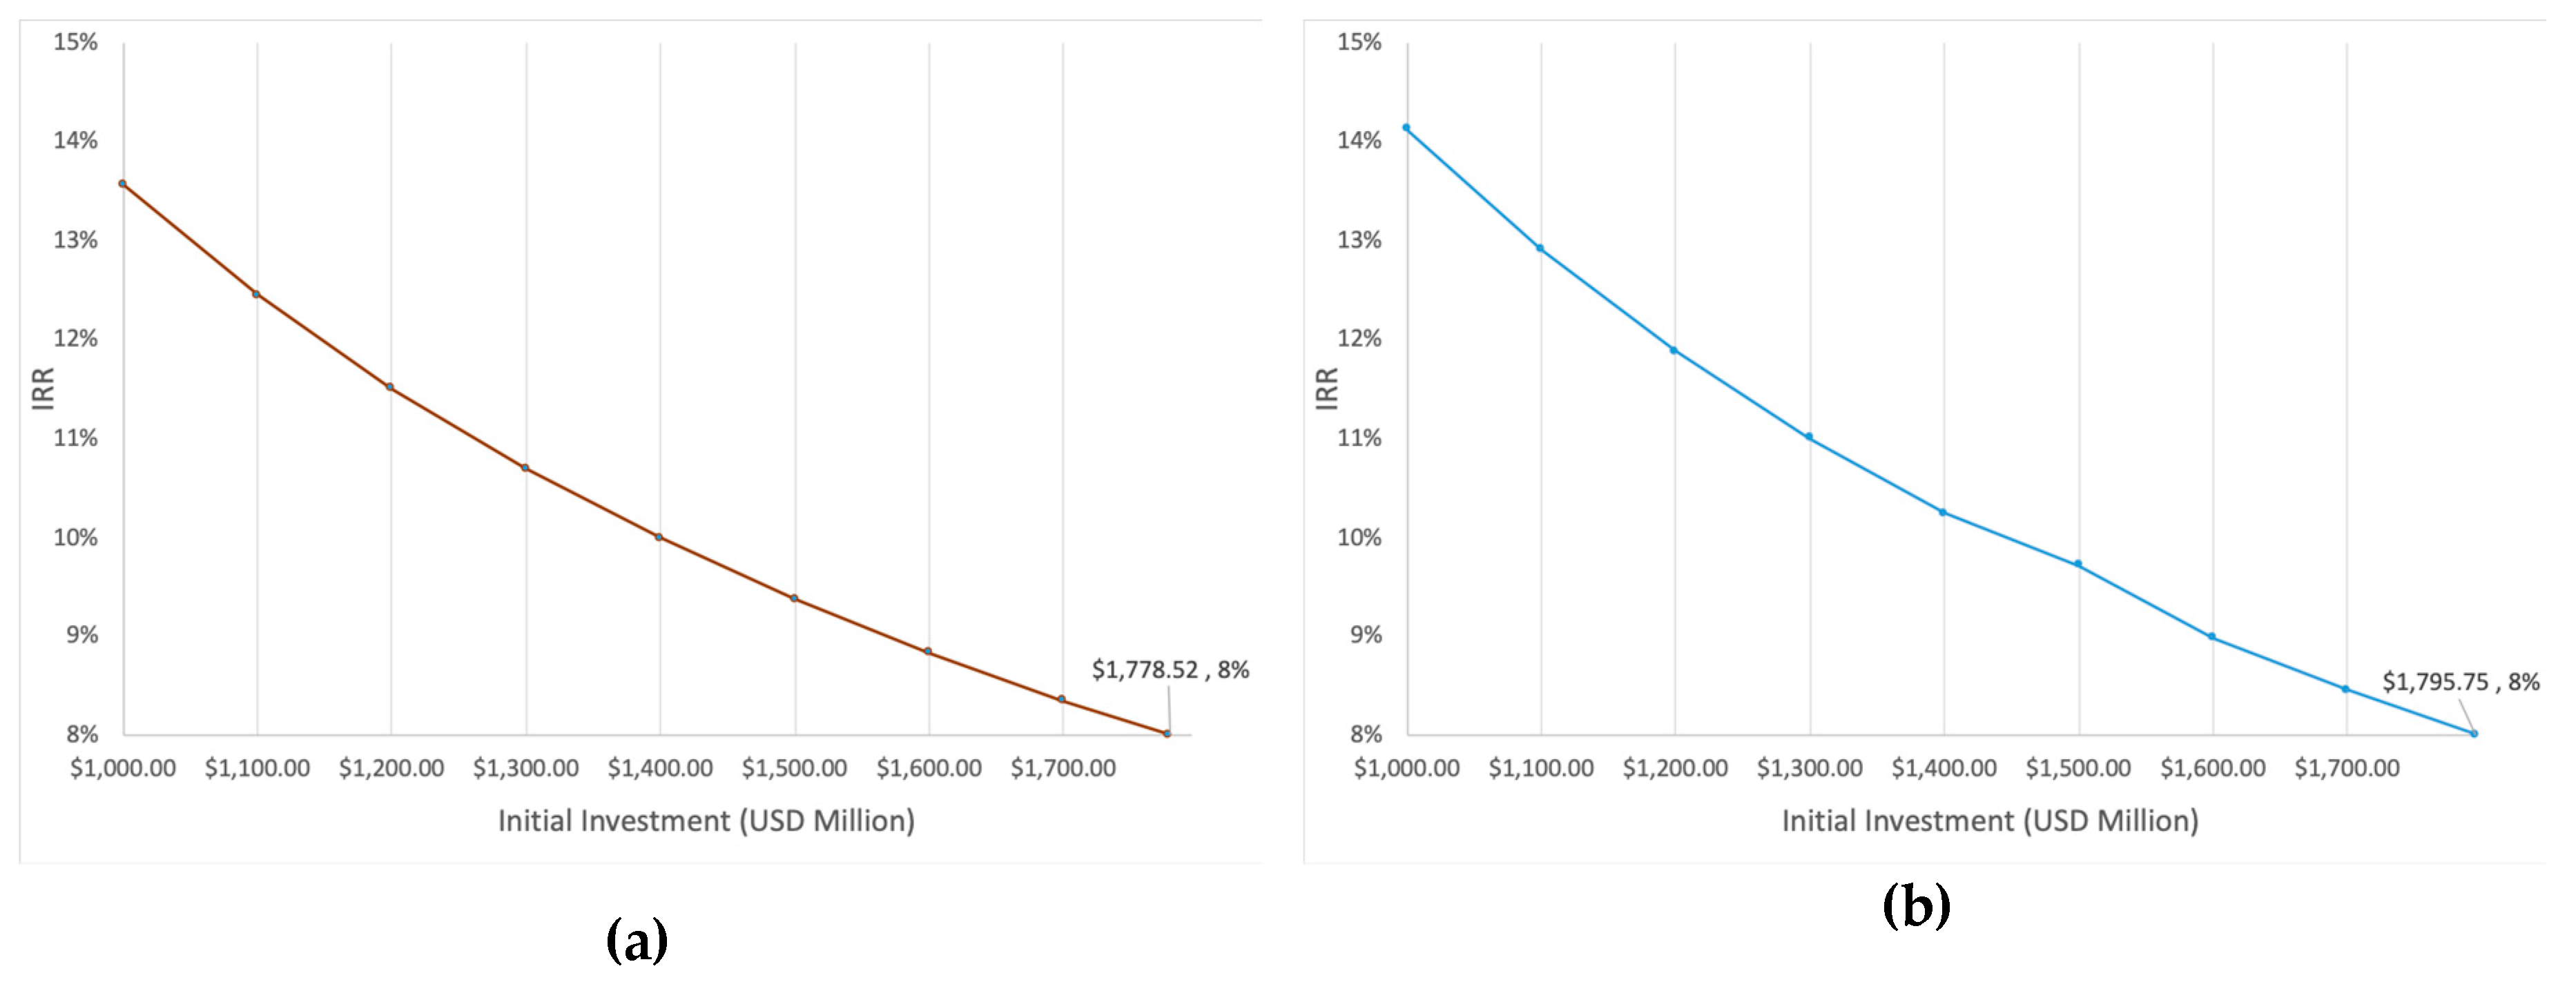
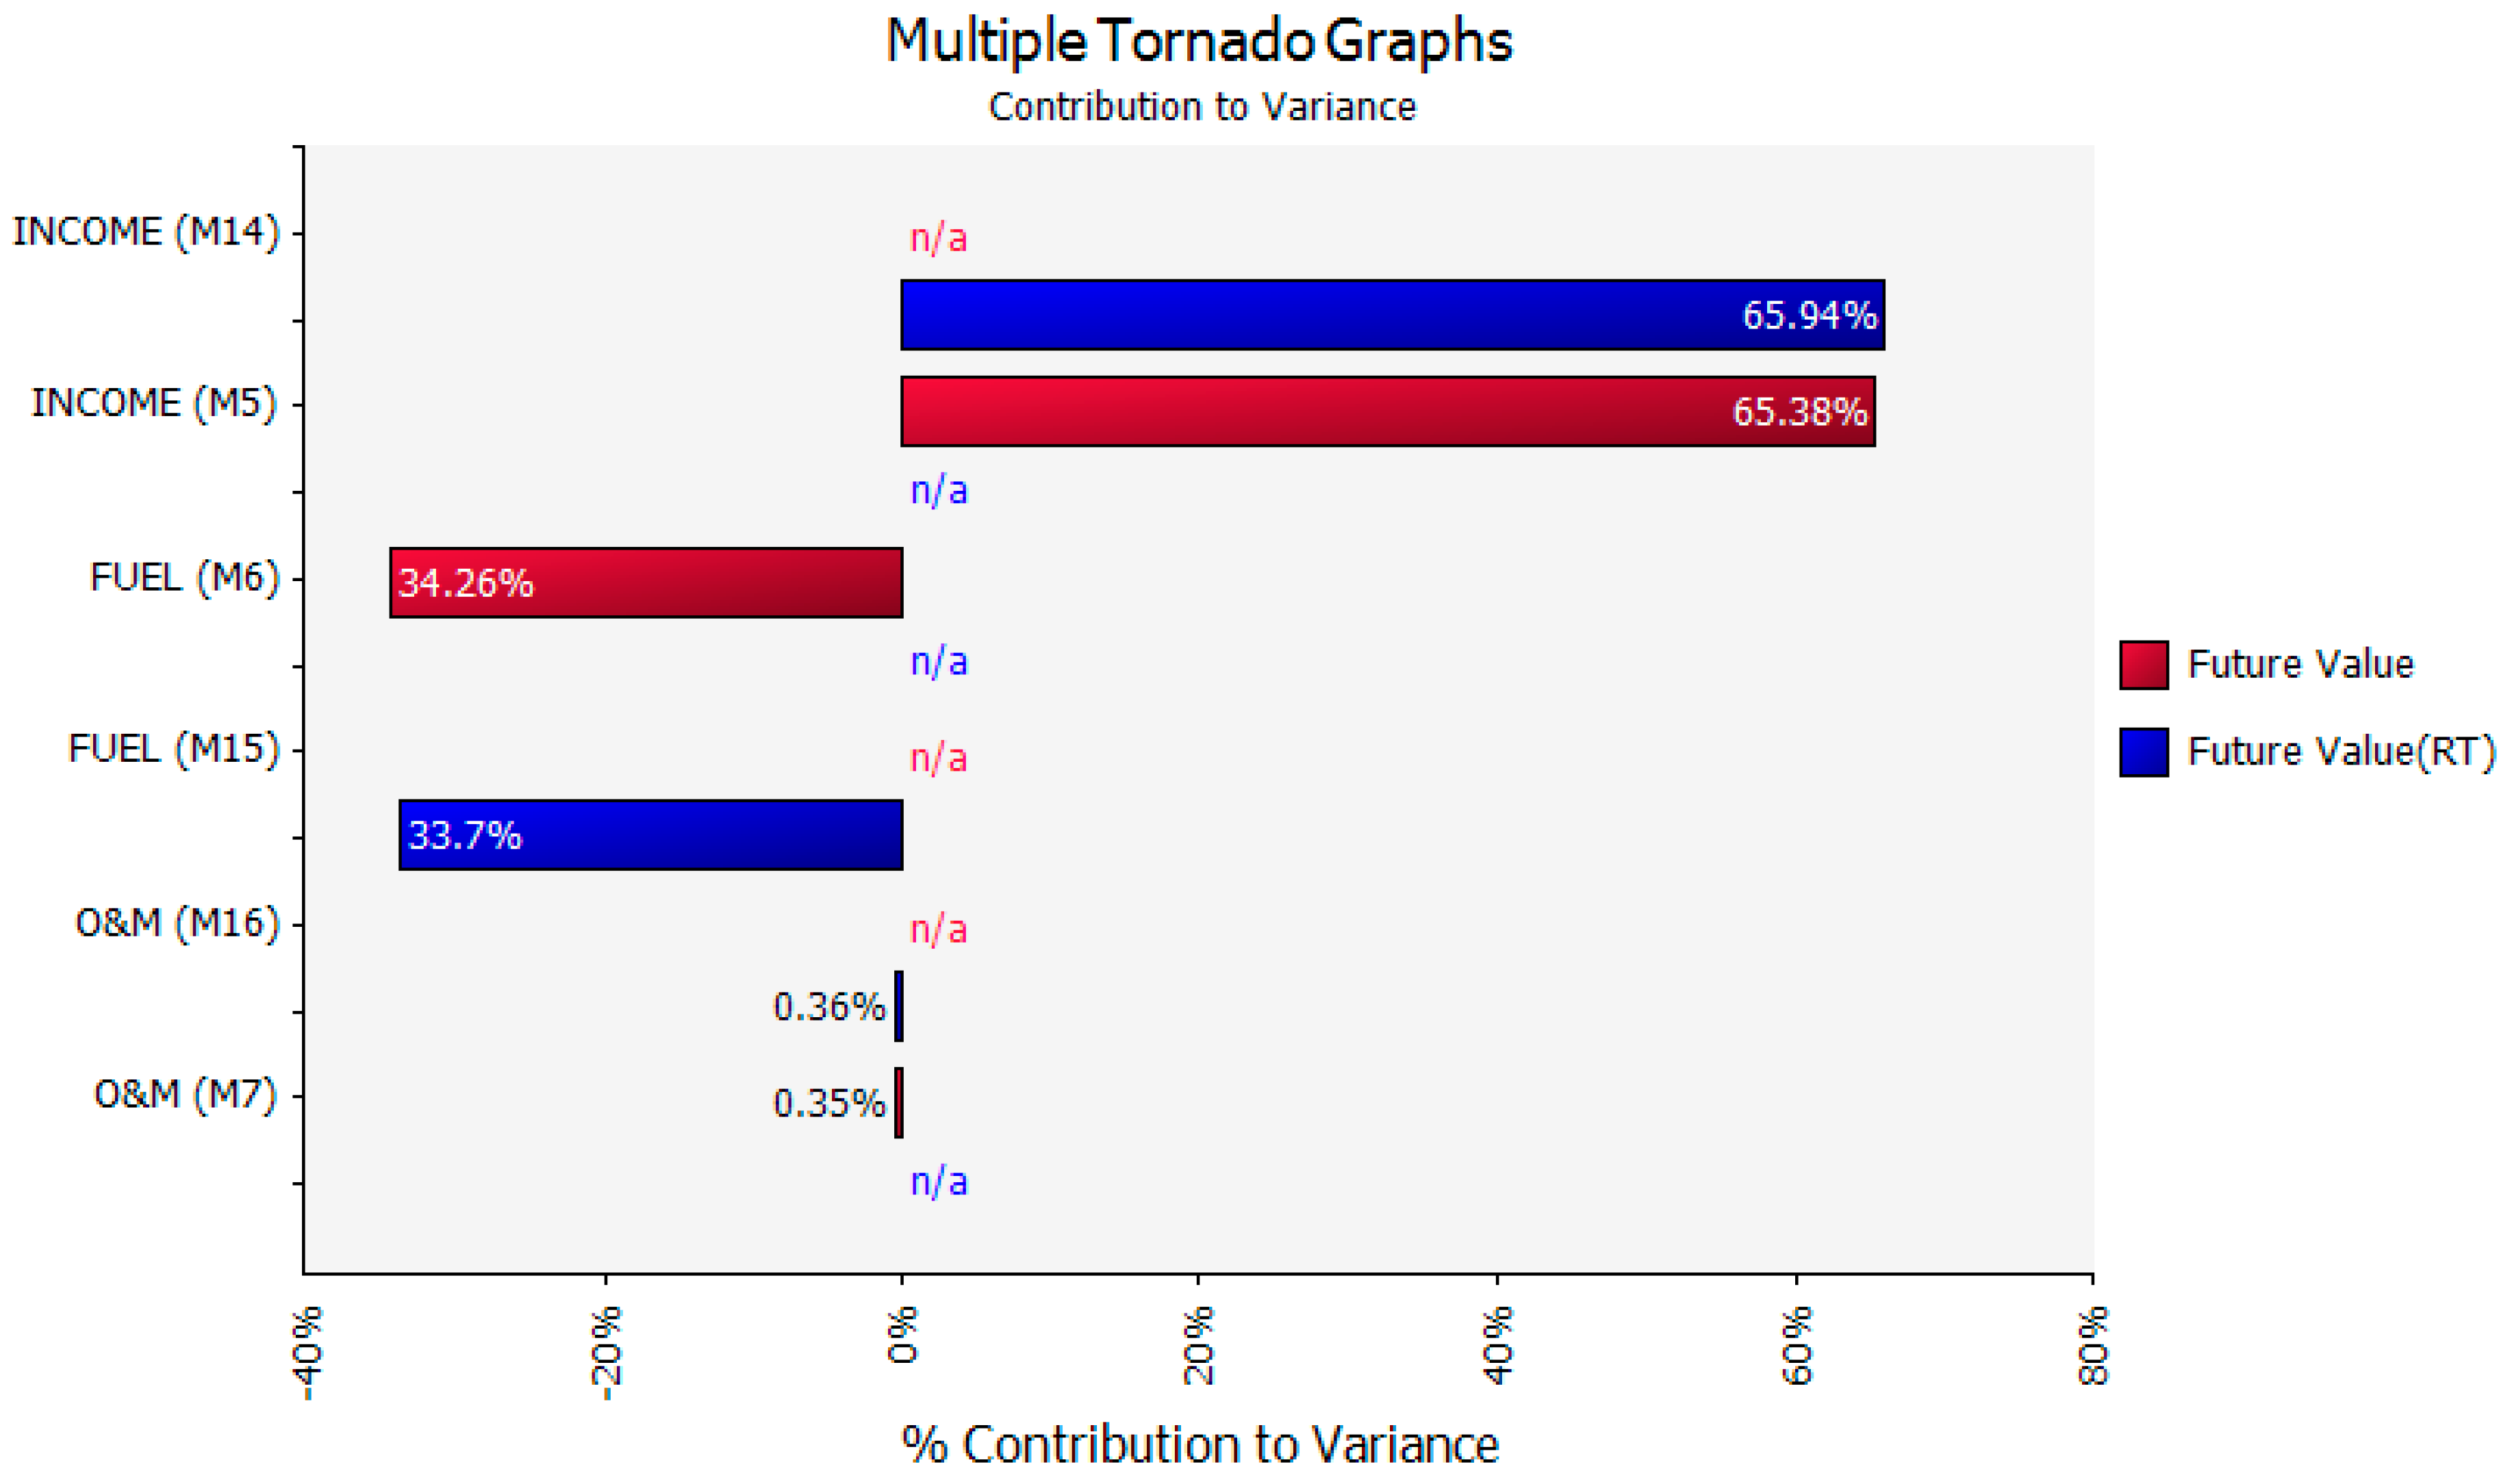
4.3. Sensitivity Analysis

The authors performed a sensitivity analysis based on the above results. The authors used the Electric Power Statistics Information System (EPSIS [35]) to investigate impact the volatility of the bituminous coal fuel cost has on the NPV. Based on KEPCO’s electricity sales unit price and operation & maintenance (O&M) cost, the bituminous coal fuel cost was found to vary from~−30 to 30% the average or base cost. Electricity sales were found to range between −10~20% and O&M cost −10~10%. In addition, the authors selected operationality as a volatility factor because it affects operation performance of power generation facilities thus impacting the futures value. The operationality was 60% (min), 90% (mean) and 95% (max). The total volatility factors are coal-fired fuel cost, electricity sales unit cost, maintenance cost, and operationality. Fixed factors are total generation capacity of A-USC & A-USC with RT calculated above, corporate tax (25%), depreciation (20 years), and the life span of the power plant (30 years). Based on this, the authors performed a sensitivity analysis of income, fuel cost, and O&M cost with Monte Carlo simulation, using @RISK ver.7.6 [37]. @Risk software is a tool that can perform a Monte Carlo simulation using probability distribution to measure the effect of uncertainty, and the sensitivity analysis can also be performed through the result. The mean future value which was calculated through simulation is obtained by subtracting Fuel Cost and O & M Cost from income. Since depreciation differs from plant life cycle, it is calculated separately from the future value along with the tax. Sensitivity analysis results show that income has a greater impact than fuel or the O&M cost fluctuations. This is shown in Figure 10 below. In the negative direction, fuel cost has a big influence on the economy as mentioned in the economic analysis. In addition, it can be seen that A-USC had a more negative effect on the fuel side than A-USC with RT by 0.64%. Also, under the following conditions, the NPV value of A-USC was 2627 M USD and that of A-USC with RT was 2660 M USD. A-USC with RT was 33 M USD big.

5. Conclusions and Future Research

The authors present a simulation model developed through the PEPSE thermodynamic software, based on the steam conditions of an operational 500 MW USC pressure coal-fired power plant. The authors verified the model’s accuracy by comparing the outputs to operational outputs, and slightly modified it to assess A-USC steam conditions. Through the process of introducing reheat and/or regenerative cycles, the authors found that the A-USC steam conditions offers an approximate 4% efficiency increase in comparison to USC steam conditions. Furthermore, introducing a reheat and regenerative cycle to the A-USC model resulted in an approximate 1.5% increase in overall power plant efficiency (within the parameters of the steam cycle). While these were positive results, introducing said cycles into the process also resulted in a significant increase to superheating of extraction stream. The authors introduced a regenerative turbine (RT) to the model in an attempt to minimize this superheating and increase plant efficiencies even further. Introducing the RT to the A-USC DR and 9 FWH was found to decrease from the average extraction steam temperature from 221 °C to 108 °C and result in an increase in power plant efficiency of approximately 0.3% to 49.5%. This increased efficiency equated to an increased NPV of approximately USD 33 million and an IRR increase of 0.2%, assuming the initial investment to be USD 1409 million, 30-year lifespan, and 8% discount rate. The price of fuel was found to have a significant impact on all of the simulation models’ NPV. For the USD 1409 500 MW A-USC with an RT, a change in 1 cent/kWh was found to have a USD 925 million impact on the NPV.
While this increase in efficiency and profitability is important, the configuration also allows for intermediate pressure turbines to be fabricated in a simple structure and prevents various problems due to the increase in the superheat. These factors have a greater positive affect the investment cost of the whole power plant, from the operational management point of view. As a result, advanced supercritical steam pressure of 350 kg/cm2 at the main steam pressure of 700 °C and the reheat steam temperature of 730 °C at both of the first and second stages was optimized in the case of the addition of the FWH. Finally, the increased efficiency will equate to an eco-friendlier power plant.

Limitations and Future Research

In this paper the authors excluded the boiler, which is one of the main equipment components. Rather than simulate performance, the boiler efficiencies were assumed based on historical data. Future studies will improve the reliability of the results if simulations of the boiler are done together. The data analysis is also reliant upon the steam conditions of a 500 MW USC rather than a 500 MW A-USC, which is the focus of the study. While there is not yet enough data on A-USC projects, this does limit the accuracy of the findings. Future studies will include actual A-USC data in their assessments. The analysis also ignored the complexities of proper RT arrangement within the schematic. The paper did not optimize the RT arrangement, and there are efficiency opportunities related to proper RT placement. In order for the RT installation to be implemented, it is inevitable that a certain area of the conventional power plant general arrangements will be required to change. Therefore, it is expected that the reliability of the economic analysis results will be further improved if the influence of general arrangement change should be considered in all fields of power plants such as machinery, piping and electricity.

Author Contributions

The contribution of the authors for this publication article are as follows: conceptualization, D.-J.C. and E.-B.L.; methodology, D.-J.C.; software, D.-J.C.; validation, J.-M.C. and D.A.; formal analysis, D.-J.C.; writing—original draft preparation, D.-J.C.; writing—review and editing, J.-M.C., E.-B.L. and D.A.; visualization, D.-J.C. and J.-M.C.; supervision, E.-B.L.; project administration, E.-B.L.; and funding acquisition, E.-B.L.

Funding

The authors acknowledge that this research was sponsored by the Ministry of Trade Industry and Energy (MOTIE/KEIT) Korea through the Technology Innovation Program funding for: (1) Artificial Intelligence Big-data (AI-BD) Platform for Engineering Decision-support Systems (grant number = 20002806); and (2) Intelligent Project Management Information Systems (i-PMIS) for Engineering Projects (grant number = 10077606).

Acknowledgments

The authors would like to thank C. S. Hong (a researcher in POSTECH University) for his academic feedback on this paper. The views expressed in this paper are solely those of the authors and do not represent those of any official organization.

Conflicts of Interest

The authors declare no conflict of interest. The funders had no role in the design of the study; in the collection, analyses, or interpretation of data; in the writing of the manuscript, or in the decision to publish the results.

Abbreviations

FWHFeed-Water Heater
TTDTerminal Temperature Difference
DCADrain Cooler Approach
PEPSEPerformance Evaluation of Power System Efficiencies
A-USCAdvanced-Ultra Super Critical
USCUltra-Super Critical
MGRMaximum Guarantee Rating
VWOValve Wide Open
NPVNet Present Value
IRRInternal Rate of Return
RTRegenerative Turbine
HPHigh Pressure
IPIntermediate Pressure
LPLow Pressure
DRDouble Reheat
SRSingle Reheat
O&MOperation & Maintenance

References

  1. Greenhouse Gas Inventory; Research Center of Korea. National Greenhouse Gas Inventory Report of Korea; GGI&RC: Seoul, Korea, 2015; Volume 426, pp. 87–92.
  2. Nah, U.H.; Cho, S.I.; Shin, H.; Kim, Y.S.; Yang, S.H. Steam Turbine Technology for Advanced Steam Condition. Trans. KSME 2003, 4, 2175–2179. [Google Scholar]
  3. Nicol, K. Status of Advanced Ultra-Supercritical PULVERISED Coal Technology; IEA Clean Coal Centre: London, UK, 2013. [Google Scholar]
  4. Phillips, J.U.S. Program for Advanced Ultrasupercritical Coal Fired Power Plants; EPRI: Palo Alto, CA, USA, 2011. [Google Scholar]
  5. Retzlaff, K.M.; Ruegger, W.A. Steam Turbines for Ultrasupercritical Power Plants; Technical Report GER-3945A; General Electric: Boston, MA, USA, 1996. [Google Scholar]
  6. Kimura, H.; Sato, T.; Bergins, C.; Imano, S.; Saito, E. Development of technologies for improving efficiency of large coal-fired thermal power plants. Hitachi Rev. 2011, 60, 365–371. [Google Scholar]
  7. Jang, S.H.; Kim, B.S.; Min, M.T. Development of Thermal Power Generation Technology for Ultrasonic Threshold Pressure (USC). Trans. Korean Soc. Mech. Eng. 2012, B, 205–210. [Google Scholar]
  8. Ibrahim, D.; Husain, A. Thermodynamic analysis of reheat cycle steam power plants. Int. J. Energy Res. 2001, 25, 728–735. [Google Scholar] [CrossRef]
  9. Habib, M.A.; Zubair, S.M. Second-law-based thermodynamic analysis of regenerative-reheat Rankine-cycle power plants. Energy 1992, 17, 296–300. [Google Scholar] [CrossRef]
  10. Ibrahim, D.; Yunus, A.C. Energy, Entropy and Exergy Concepts and Their Roles in Thermal Engineering. Entropy 2001, 3, 116–127. [Google Scholar] [CrossRef]
  11. Mehmet, K.; Ibrahim, D.; Marc, A.R. Understanding energy and exergy efficiencies for improved energy management in power plants. Energy Policy 2007, 35, 3969–3977. [Google Scholar]
  12. Mohamed, E.; Kareem, S.A.D.; Abd, E.H.A. Utilizing exergy analysis in studying the performance of steam power plant at two different operation mode. Appl. Therm. Eng. 2019, 150, 284–290. [Google Scholar]
  13. Luo, X.; Zhang, B.; Chen, Y.; Mo, S. Modeling and optimization of a utility system containing multiple extractions steam turbines. Energy 2011, 36, 3501–3510. [Google Scholar] [CrossRef]
  14. Wang, L.; Yang, Y.; Morosuk, T.; Tsatsaronis, G. Advanced Thermodynamic Analysis and Evaluation of Supercritical Power Plant. Energies 2012, 5, 1851–1860. [Google Scholar] [CrossRef]
  15. Sankaran, R.; Christoper, F. Edwards, Maximum-efficiency architectures for heat-and work-regenerative gas turbine engiens. Energy 2016, 100, 116–125. [Google Scholar] [CrossRef]
  16. Erbay, L.B.; Selahattin, G.; Hasbi, Y. Optimal design of the regenerative gas turbine engine with isothermal heat addition. Appl. Energy 2001, 68, 252–260. [Google Scholar] [CrossRef]
  17. Graham, J.R.; Harvey, C.R. The theory and practice of corporate finance: Evidence from the field. J. Financ. Econ. 2001, 60, 187–243. [Google Scholar] [CrossRef]
  18. Sudong, Y.; Tiong, R.L.K. NPV-at-Risk Method in Infrastructure Project Investment Evaluation. J. Constr. Eng. Manag. 2000, 126, 227–233. [Google Scholar] [CrossRef]
  19. Kumar, R.; Sharma, A.K.; Tewari, P.C. Cost analysis of a coal-fired power plant using the NPV method. Ind. Eng. Int. 2015, 11, 496–503. [Google Scholar] [CrossRef]
  20. Lee, K.M.; Kuo, S.F.; Chien, M.L.; Shih, Y.S. Parameters analysis on organic rankine cycle energy recovery system. Energy Convers. Manag. 1988, 28, 130–136. [Google Scholar] [CrossRef]
  21. Zhong, G.; Jian, L.; Yuanyuan, D.; Zhen, Y.; Zhiyoung, X. Thermodynamic Performance Analyses and Optimization of Dual-Loop Organic Rankine Cycles for Internal Combustion Engine Waste Heat Recovery. Appl. Sci. 2019, 9, 680. [Google Scholar] [CrossRef]
  22. Hong, C.S.; Lee, E.B. Power Plant Economic Analysis: Maximizing Lifecycle Profitability by Simulating Preliminary Design Solution of Steam-Cycle Conditions. Energies 2018, 11, 2245. [Google Scholar] [CrossRef]
  23. Lee, H.C.; Lee, E.B.; Alleman, D. Schedule Modeling to Estimate Typical Construction Durations and Areas of risk for 1000 MW Ultra-Critical Coal-Fired Power Plants. Energies 2018, 11, 2850. [Google Scholar] [CrossRef]
  24. Kim, Y.G.; Lee, E.B. Optimization Simulation, Using Steel Plant Off-Gas for Power Generation: A Life-Cycle Cost Analysis Approach. Energies 2018, 11, 2884. [Google Scholar] [CrossRef]
  25. Wang, L.; Yang, Y.; Dong, C.; Yang, Z.; Xu, G.; Wu, L. Exergoeconomic Evaluation of a Modern Ultra-Supercritical Power Plant. Energies 2012, 5, 3381–3397. [Google Scholar] [CrossRef] [Green Version]
  26. Fukuda, M. Advanced USC technology development in Japan. Mater. Ultra-Supercrit. Adv. Ultra-Supercrit. Powerpl. 2017, 733–750. [Google Scholar] [CrossRef]
  27. Liu, Z.; Xie, X. The Chinese 700 °C A-USC development program. Mater. Ultra-Supercrit. Adv. Ultra-Supercrit. Powerpl. 2017, 715–728. [Google Scholar] [CrossRef]
  28. Nomoto, H. Advanced ultra-supercritical pressure (A-USC) steam trubines and their combination with carbon capture and storage systems (CCS). Adv. Steam Turbines Mod. Power Plants 2017, 503–515. [Google Scholar] [CrossRef]
  29. Gianfrancesco, A.D. A-USC R&D programs in other countries. Mater. Ultra-Supercrit. Adv. Ultra-Supercrit. Powerpl. 2017, 755–770. [Google Scholar] [CrossRef]
  30. Gianfrancesco, A.D.; Blum, R. A-USC programs in the European Union. Mater. Ultra-Supercrit. Adv. Ultra-Supercrit. Powerpl. 2017, 773–800, 810–830. [Google Scholar] [CrossRef]
  31. Wright, C. PEPSE; Scientech: Idaho Falls, ID, USA, 2007; Available online: http://famos.scientech.us/PEPSE.html (accessed on 29 March 2019).
  32. Spencer, R.C.; Cotton, K.C. A Method for Predicting the Performance of Steam Turbine-Generators…16,500 kW and Larger; Technical Report GER-2007C; General Electric: Boston, MA, USA, 1974. [Google Scholar]
  33. Minner, G.L.; Fleming, D.R.; Kettenacker, W.C. Engineering Model Description; PEPSE Manual; Scientech: Idaho Falls, ID, USA, 2007; Volume 2. [Google Scholar]
  34. Cotton, K.C. Evaluating and Improving Steam Turbine Performance, 2nd ed.; Cotton Fact Inc.: Rexford, NY, USA, 1998; ISBN 10 0963995510. [Google Scholar]
  35. Korea Power Exchange (KPX). Electric Power Statistics Information System (EPSIS); KPX: Seoul, Korea; Available online: http://epsis.kpx.or.kr (accessed on 30 March 2019).
  36. Gang, X.; Luyao, Z.; Shifei, Z.; Feifei, L.; Cheng, X.; Yongping, Y. Optimum superheat utilization of extraction steam in double reheat ultra-supercritical power plants. Appl. Energy 2014, 10, 2–8. [Google Scholar] [CrossRef]
  37. Palisade Corporation. Risk Analysis and Simulation Add-In for Microsoft Excel (User’s Guide); Palisade: Ithaca, NY, USA; Available online: https://www.palisade.com/support/manuals.asp (accessed on 25 April 2019).
Figure 1. Improvement of heat consumption rate by the steam condition [2].
Energies 12 01681 g001
Figure 2. Data collection and research methodology flow diagram.
Energies 12 01681 g002
Figure 3. The system schematic of the 500 MW USC steam cycle.
Energies 12 01681 g003
Figure 4. Exhaust loss curve [2].
Energies 12 01681 g004
Figure 5. Simulation USC model (SR + 8 FWH).
Energies 12 01681 g005
Figure 6. Simulation A-USC model (DR&9 FWH with RT 9).
Energies 12 01681 g006
Figure 7. Comparison of plant efficiency with USC & A-USC.
Energies 12 01681 g007
Figure 8. Graphical comparison of overheating of USC & A-USC with RT.
Energies 12 01681 g008
Figure 9. Investment versus IRR based on 30-year lifespan for (a) A-USC and (b) A-USC (RT).
Energies 12 01681 g009
Figure 10. Sensitivity analysis on A-USC (red) & A-USC with RT (blue).
Energies 12 01681 g010
Table 1. The steam condition of 500 MW supercritical pressure coal-fired power plant.
Type of PlantP/T *IEA [3]EPRI [4]GE (US) [5]Hitachi (Japan) [6]Korea [7]
Sub CriticalP<226<168<226<226<226
T<540<565/565---
Super CriticalP226~225>253>226>226>226
T540~580>565/585---
Ultra-Super CriticalP226~225>253>226>226>226
T580~620>593/621>566>593>593
Advanced Ultra Super CriticalP255~357>352---
T700~725>677/677---
* P = Pressure [kg/cm2]; T = Temperature [°C]; T is main steam temperature/reheated steam temperature.
Table 2. The steam condition of 500 MW supercritical pressure coal-fired power plant.
DescriptionUnitVWOMGR75% MGR50% MGR
Total power outputMW552521390260
Main steam flowKg/h1,597,3171,491,4261,082,176711,980
Main steam pressureKg/cm2247247200135
Main steam temperature°C566566566566
Reheat steam pressureKg/cm253503725
Reheat steam temperature°C593593593593
Heat consumption rateKcal/kWh1777178418221900
Table 3. Turbine performance constant.
DescriptionEfficiency MultiplierBowl
Coefficient
Shape
Constant
Governing stage1.02276--
Intermediate HP stage-14,366703.02
Last HP stage-28,659-
First IP (intermediate pressure) stage1.0238850,050524.79
Last IP stage-100,466502.44
First LP (low pressure) stage-225,333557.10
2nd of Intermediate LP stage-373,303595.38
3rd of -1,173,660610.02
4th of-2,325,090650.00
Last LP stage-5,093,230-
Table 4. Comparison of total output and heat consumption rate with actual power plant.
Power Output (MW)VWOMGR75% MGR50% MGR
Real plant551.9520.8390.5260.4
Simulation model550.1520.5390.8262.5
Relative error−0.33%−0.05%0.08%0.78%
Heat rate (Kcal/KWh)
Real plant1777178418221900
Simulation model1785178818241887
Relative error0.44%0.25%0.14%−0.66%
Table 5. Required data for economic analysis.
DescriptionUnitValueRemark
A-USCA-USC (RT)
Electric power sales Cent/kWh77By 2015
Bituminous coal costCent/kWh33By 2016
Maintenance costCent/kWh0.60.6By 2013
Operability%9090
Depreciation periodYear2020Straight-line method
Corporate tax%2525
Power plant life spanYear3030
Discount rate%88WACC
Investment$ million137138
Table 6. The output and heat rate of the USC & A-USC simulation model.
DescriptionUnitUSC
SR + 8 FWHSR + 9 FWHDR + 8 FWHDR + 9 FWH
Power outputMW550.0511.7618.4563.8
Heat rateKcal/kWh1784178217421725
Turbine Efficiency%48.248.349.449.9
A-USC
Power outputMW696.2620.1777.0690.1
Heat rateKcal/kWh1637163216051587
Turbine Efficiency%52.552.753.654.2
Table 7. Comparison of superheating amongst all models.
ModelTemp. [℃]FWH #1 (LP)FWH #2 (LP)FWH #3 (LP)FWH #4 (LP)FWH #5 (DA)FWH #6 (HP)FWH #7 (HP)FWH #8 (HP)FWH #9 (HP)
SR +
8 FWH
USCSteam58.979.0109.0235.4309.2452.4345.3394.0N/A
SRSaturation 39.162.882.9103.2168.0178.8220.7276.6
8 FWHS.H 19.816.226.1132.2141.2273.6124.6117.4
SR +
9 FWH
USCSteam55.575.0107.7234.0306.5452.5326.1369.0493.5
SRSaturation39.259.478.998.7161.3171.9213.1266.8288.4
9 FWHS.H16.315.628.8135.3145.2280.6113.0102.2205.1
DR +
8 FWH
USCSteam60.881.2111.1238.0319.2454.7469.8479.1N/A
DRSaturation39.164.785.1105.7171.7182.6225.0274.7
8 FWHS.H21.716.526.0132.3147.5272.1244.8204.4
DR +
9 FWH
USCSteam57.777.6110.4237.3318.0455.3448.2498.3444.1
DRSaturation39.261.681.5101.7165.7176.4218.0266.0287.5
9 FWHS.H18.516.028.9135.6152.3278.9230.2232.3156.6
SR +
8 FWH
A-USCSteam60.3104.8179.0326.5409.8572.8414.2465.3N/A
SRSaturation 39.164.285.1106.7172.8183.8225.7282.5
8 FWHS.H21.240.693.9219.8237.0389.0188.5182.8
SR +
9 FWH
A-USCSteam57.0103.3178.1325.3407.0572.8393.5438.9571.7
SRSaturation39.260.981.3102.4166.4177.1218.2272.8293.9
9 FWHS.H17.842.496.8222.9240.6395.7175.3166.1277.8
DR +
8 FWH
A-USCSteam70.1107.0181.6329.6421.4575.9559.2567.7N/A
DRSaturation39.166.087.2109.1176.4187.5229.9280.3
8 FWHS.H31.041.094.4220.5245.0388.4329.3287.4
DR +
9 FWH
A-USCSteam62.2110.3185.5334.6425.4583.8522.7643.1561.6
DRSaturation39.362.182.8104.1168.9179.7221.0266.4315.3
9 FWHS.H22.948.2102.7230.5256.5404.1301.7376.7246.3
S.H. = superheating temperature.
Table 8. Comparison of overheating of USC & A-USC with RT.
ModelTemp. [°C]FWH #1 (LP)FWH #2 (LP)FWH #3 (LP)FWH #4 (LP)FWH #5 (DA)FWH #6 (HP)FWH #7 (HP)FWH #8 (HP)FWH #9 (HP)
DR +
9 FWH
A-USCSteam62.2110.3185.5334.6425.4583.8522.7643.1561.6
DRSaturation39.362.182.8104.1168.9179.7221.0266.4315.3
9 FWHS.H Degree22.948.2102.7230.5256.5404.1301.7376.7246.3
DR +
9 FWH with RT
A-USCSteam88.7154.1238.5143.5188.5256.0333.3422.6527.3
SRSaturation38.662.583.9118.3169.0179.8207.0241.1284.8
9 FWH + RTS.H Degree50.191.6154.625.219.576.2126.3181.5242.5
S.H. = Superheating temperature.
Table 9. Comparison of operating conditions and performance of A-USC with and without RT.
DescriptionUnitA-USCA-USC (RT)Remark
Total power outputMW690.1695.5
Heat consumption rateKcal/kWh15841577
Boiler efficiency%90.890.8HHV Basis
Power plant efficiency%49.249.5Plant loss 0.1%
Main steam flowKg/h1,597,3171,597,317VWO
Main steam pressureKg/cm2350350
Main steam temperature°C700700
single reheat steam pressureKg/cm2160130
single reheat steam temperature°C730730
double reheat steam pressureKg/cm25030
double reheat steam temperature°C730730
Condensate pressuremmHg38.138.1
QTY of feedwater heaterea99
Application of RT-N/AApplication
Table 10. NPV and IRR comparison of A-USC with and without RT assuming $1409 M initial investment.
DescriptionUnitValueDelta
A-USCA-USC (RT)
NPV$M USD1888192033
IRR%11.912.10.2
Table 11. NPV and IRR comparison of A-USC with differing fuel rates assuming $1409 M initial investment.
DescriptionUnitA-USC (RT) Fuel Costs
$0.01/kWh$0.03/kWh$0.05/kWh
NPV$M USD3764192060
IRR%22.912.10.4%

