Article

Transient Heat Transfer Between Two Horizontal Pipelines in a Heat Tracing Enclosure

1
Department of Mechanical Engineering, National Cheng Kung University, Tainan 701, Taiwan
2
Department of Civil Engineering, National Cheng Kung University, Tainan 701, Taiwan
*
Authors to whom correspondence should be addressed.
Energies 2019, 12(8), 1440; https://doi.org/10.3390/en12081440
Submission received: 26 January 2019 / Revised: 30 March 2019 / Accepted: 10 April 2019 / Published: 15 April 2019

Abstract

:
In this study, a numerical simulation of natural convection between two horizontal differentially heated pipelines inside a circular air-filled enclosure is performed using the finite difference method. The relevant parameters of the problem are the inclinations of the two cylinders (positioned vertically in this study, with the cold cylinder above the hot cylinder), the distance between cylinders and the Rayleigh number. The results show that transient irregular fluctuations in the flow field and heat transfer occur when the Rayleigh number increases or the distance between cylinders decreases. Under the current test conditions, increasing the Rayleigh number significantly increases the average heat transfer coefficient between the cold and hot cylinders.

1. Introduction

In industrial applications, heat tracing is a commonly used heat transfer technique [1,2,3]. In an external heat tracing system, a pipeline (simulated as a cold cylinder) is heated to prevent fluids from freezing or condensing by placing another steam-heated or electricity-heated pipe (simulated as a hot cylinder) around the pipeline [4]. In underground high-voltage cable cooling, the heat generated by the electricity cables (simulated as a hot cylinder) can be transferred to a cooled liquid flowing through pipes (simulated as a cold cylinder). Natural convection in an enclosure is fundamentally relevant to a heat tracing system [5,6].
Natural convection in a closed container has been extensively investigated [7]. However, there are few studies on the natural convection between two cylinders in circular closed containers. One study that investigated convective behavior in this environment was conducted by Ho et al. [8], who explored natural convection flow patterns and heat transfer in the air surrounding two horizontal, differentially heated cylinders confined within an adiabatic circular enclosure. In their study, the Rayleigh (Ra) number, angle of inclination and distance between cylinders were identified as significant factors considering the fluid flow complexity and heat transfer characteristics in the air around the cylinders and within the enclosure walls. In a subsequent study, Ho et al. [9] conducted experiments within a similar environment using horizontal, differentially heated cylinders within a circular air-filled enclosure subjected to external convection. In that numerical study, buoyancy-induced fluid flow and heat transfer were investigated between cylinders supplemented with flow visualization and holographic interferometric measurements. The buoyant convection flow was increased by external convection along the wall of the circular enclosure, which significantly increased the heat transfer between the cylinders.
Wang et al. [10] used the multi-block lattice Boltzmann method (LBM) to study natural convection around two hot and cold horizontal microtubes in large square and circular containers, and no significant differences were found between the vortex structures in these containers. Dai et al. [11] simulated natural convection in an adiabatic cylindrical enclosure containing a parallel pair of hot and cold horizontally placed microtubes. The researchers employed the hybrid lattice Boltzmann finite difference method (LBFDM) coupled with the direct forcing (DF) technique and determined that maximal heat transfer was achieved when the cold microtube was placed above the hot microtube at an inclination angle of 60° when the Ra number is <1400. Khalili et al. [12] performed a numerical study of the natural convection of Al2O3 nanofluid between two horizontal cylinders inside a circular enclosure and found that the enclosure geometry was vertically symmetrical overall but asymmetrical relative to the horizontal midsection.
The aim of this research was to build on insights gained in previous studies [8,13] regarding the nature of transient buoyancy-driven fluid flow and heat transfer using a similar geometric configuration (shown in Figure 1); however, in this study, a cold cylinder was placed above a hot cylinder to study transient behavior. Using numerical simulations via the finite difference method, the transient two-dimensional natural convection phenomenon induced in a heat tracing system consisting of differentially heated horizontal cylinders inside a circular enclosure was investigated.

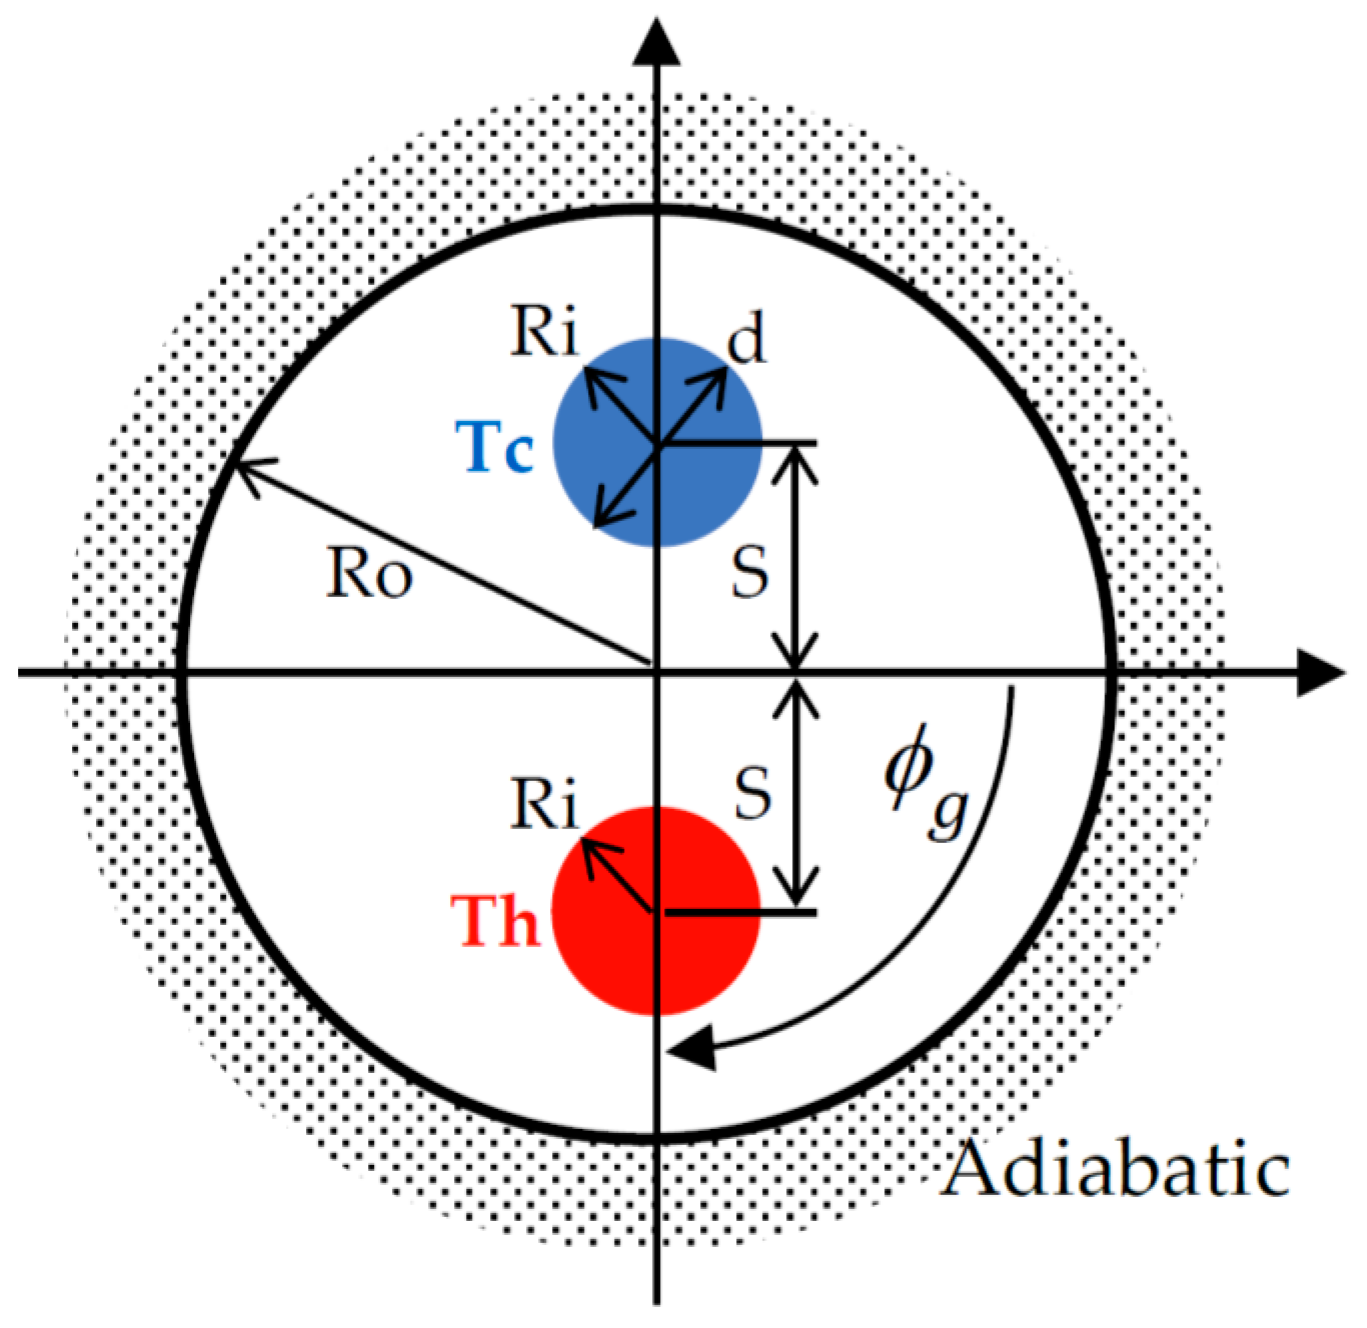
2. Problem Definition and Modeling

2.1. Mathematical Formulation

The configuration used in this study involved the placement of two horizontal circular cylinders with diameters of d within an adiabatic circular enclosure with a radius of Ro and a gravitational orientation ϕg of –90°. The cylinders were symmetrically located relative to the center of the enclosure at a center-to-center distance of 2 s and isothermally heated to temperatures of Tc and Th for the cold and hot cylinders, respectively. The buoyancy-driven fluid flow resulting from the temperature difference between the cylinders was assumed to be two-dimensional and laminar. Additionally, the thermophysical properties of the fluid were assumed to be temperature independent, apart from the density, and the Boussinesq approximation was valid. Viscous dissipation and compressibility effects were not considered in this study. We are fully aware that the 2D flow assumption in the present study precludes the 3D effects on the onset of flow unsteadiness. However, it is expected that the 2D simulations can still reveal the transitional buoyant flow dynamics well [14].
The governing partial differential equations in dimensionless forms for the conservation of mass, momentum and energy are determined in terms of the vorticity, stream function and temperature. A composite overlapping grid system (Figure 2) was applied, with a general curvilinear coordinate system for the interior embedded among three cylindrical grids around the solid circular boundaries—the two horizontal cylinders and a circular enclosure. This configuration was used to effectively address the geometrically complicated solution domain in the present problem. These cylindrical grids not only allowed any steep temperature gradients in particular regions to be resolved but also facilitated easier and more accurate evaluation of the Nusselt number at the cylinder surfaces. In addition, an overlap between the internal boundaries of the cylindrical and curvilinear grids was introduced to ensure that the composite grids remained smooth and continuous across the internal subgrid boundaries. This configuration also enabled interactions among the different subgrids by updating (transferring) the Dirichlet conditions at the internal subgrid boundaries.
Using this composite grid system, the dimensionless governing differential equations were obtained in cylindrical polar coordinates around the two horizontal cylinders and the circular enclosure and in general curvilinear coordinates for the interior among the three cylindrical grids. In cylindrical polar coordinates:
ω F o + 1 r ψ ϕ ω r 1 r ψ r ω ϕ = P r [ R a ( c o s ϕ θ r s i n ϕ r θ ϕ ) + 2 ω ]
2 ψ = ω
θ F o + 1 r ψ ϕ θ r 1 r ψ r θ ϕ = 2 θ
In curvilinear coordinates [15],
ω F o + 1 J ( U ω ξ + V ω η ) = P r { R a J [ cos ϕ g ( y η θ ξ y ξ θ η ) sin ϕ g ( x ξ θ η x η θ ξ ) ] + ˜ 2 ω }
˜ 2 = −ω
θ F o + 1 J ( U θ ξ + V θ η ) = ˜ 2 θ
where U and V are the contravariant velocity components along the ξ and η directions, respectively, and are defined as follows:
U = ψ η ;   V = ψ ξ
and:
˜ 2 = 1 J 2 ( a 1 2 ξ 2 2 a 2 2 ξ η + a 3 2 η 2 ) + P ξ + Q η
a 1 = ( x η ) 2 + ( y η ) 2
a 2 = x ξ x η + y ξ y η
a 3 = ( x ξ ) 2 + ( y ξ ) 2
Here, the coordinate control functions P and Q are based on the forms devised by Thomas and Middlecoff [16].
The boundary conditions on the surfaces of the isothermal cylinders are as follows:
ψ r = ψ ϕ = 0     ψ = ψ h     θ = 0.5       ω = 2 ψ r 2 | r = R o
ψ r = ψ ϕ = 0     ψ = ψ c     θ = 0.5       ω = 2 ψ r 2 | r = R o
and on the surface of the adiabatic enclosure:
ψ = 0       θ r = 0       ω = 2 ψ r 2 | r = R i
The governing differential equations in either cylindrical or curvilinear coordinates, Equations (1)–(6), and the boundary conditions, Equation (9), possess a symmetry that obeys the following transformation:
θ * ( r , ϕ ) = θ * ( r , ϕ + π ) , ω * ( r , ϕ ) = ω ( r , ϕ + π ) , ψ * ( r , ϕ ) = ψ ( r , ϕ + π )
where ( )*˙ denotes a transformed field. Based on this symmetry, the boundary stream functions of the two horizontal cylinders, Ψ h and Ψ c , should be identical but must be determined. The unknown value of the boundary stream function is determined based on the pressure, which leads to a line integral evaluation in terms of the vorticity and temperature on the horizontal cylinder surface [17].

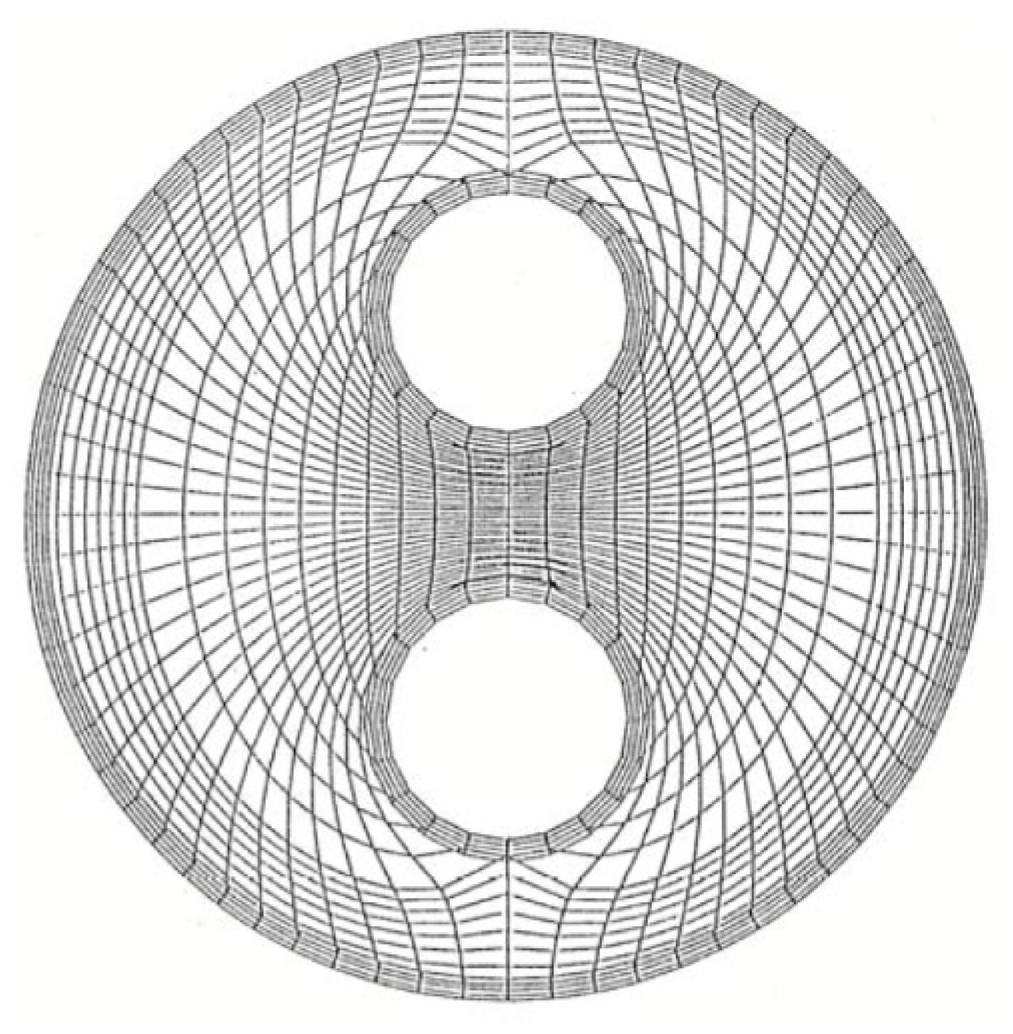
2.2. Numerical Method

The finite difference method was employed to solve governing Equations (1) to (6), subject to the boundary conditions in Equation (9). Using a second-order central differencing formula on both the cylindrical and curvilinear grids, the partial differential equations were discretized, with the second-order central differential method being used to discretize the temporal term. Through the application of a line successive relaxation scheme, the derived systems of the finite difference equations were independently solved in the four subgrid domains. The method of linking calculations in each subgrid domain involved application of Dirichlet conditions to the interior border of the overlapping grid region, adopting Park and Chang’s [18] bivariable linear interpolation scheme to perform interpolations based on the solutions calculated in the adjoining subgrid domain.
An iterative calculation procedure was employed to derive a transient solution to the present problem by updating the unknown boundary stream functions on the thermally active cylinders based on the newly obtained vorticity and transport fields. The vorticity, stream function and dimensionless temperature were set to 0 (except for the assigned boundary conditions) as the initial conditions. The iterative calculations were continued until all field variables of the problem attained the prescribed relative convergence of 5 × 10⁻⁵. Additionally, in all convergence calculations, an energy balance within 0.1 percent between horizontal cylinders was obtained.
A grid independence test was performed for each subgrid domain to test the accuracy of the calculations, employing a (15 × 41, 5 × 89, 45 × 57) composite grid system and Δ Fo = 5 × 10⁻⁵ and 10–5 (for 105   R a < 106 and Ra     106, respectively) [13].
To verify the formulation and numerical method, the simulation results for the selected steady state cases of the same configuration and parameters were compared with the results obtained in our previous study [8,13]. The comparison revealed that the calculated streamline patterns and flow visualization photographs were highly consistent, thus confirming the reliability of the simulation results.

3. Results and Discussion

Numerical simulations were conducted for the transient buoyancy-driven fluid flow and heat transfer of air (Pr = 0.71) arising between thermally active horizontal cylinders inside an adiabatic circular enclosure of Ro/Ri = 4. The relevant dimensionless parameters were as follows: ϕg (inclination angle of the enclosure) = –90°, s/d (center-to-center half spacing between cylinders) = 0.7 and Ra numbers of 1 × 10⁴, 1 × 10⁵ and 5 × 10⁵; ϕg = –90°, s/d = 0.833 and Ra numbers of 1 × 10⁴ and 1 × 10⁵.

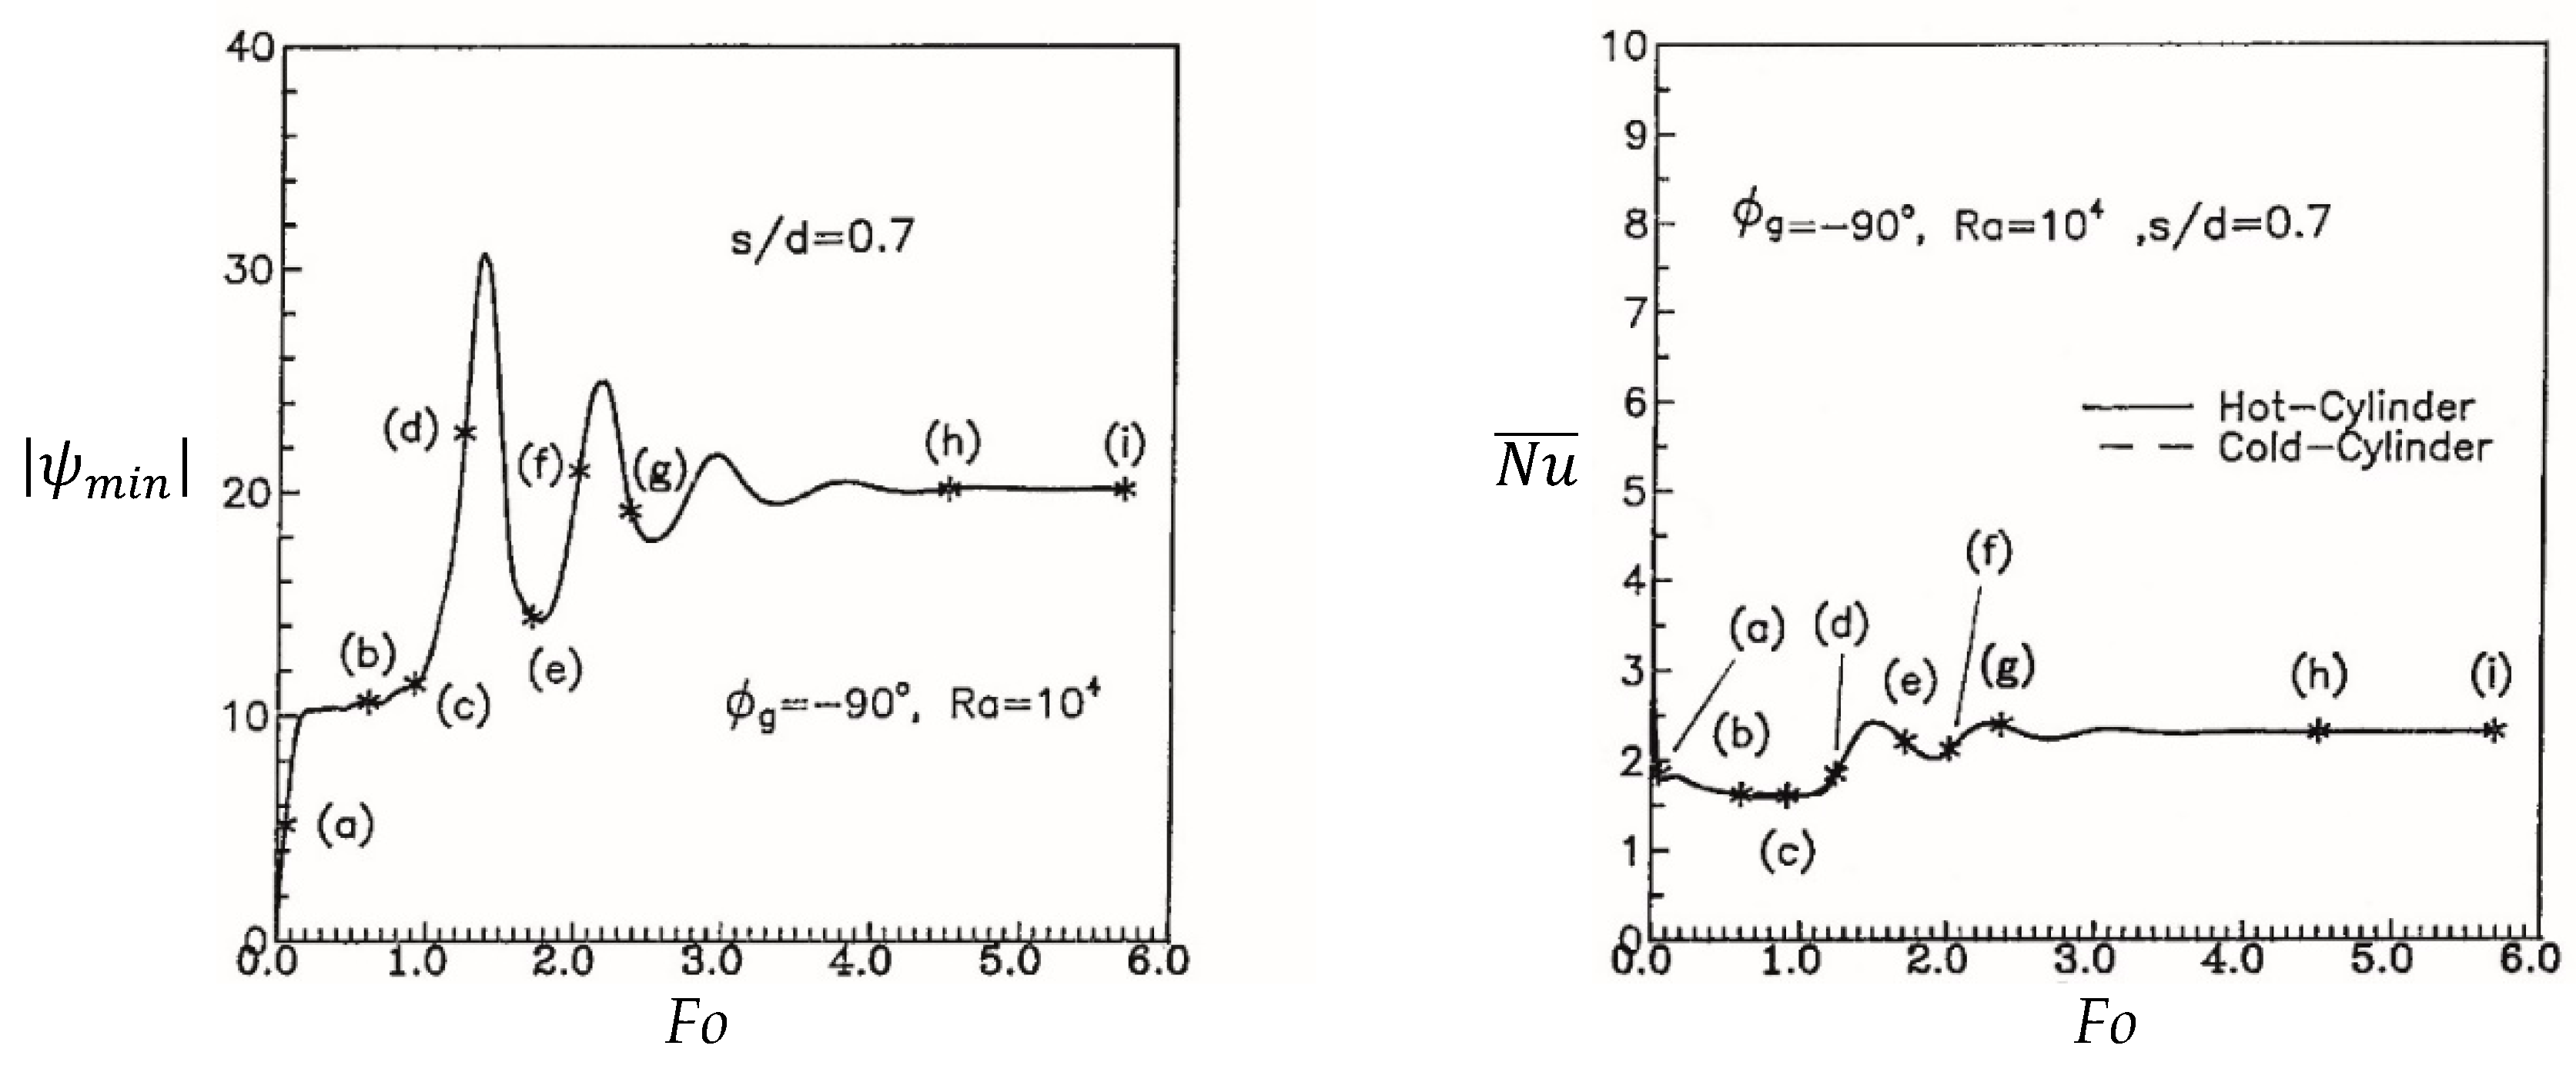
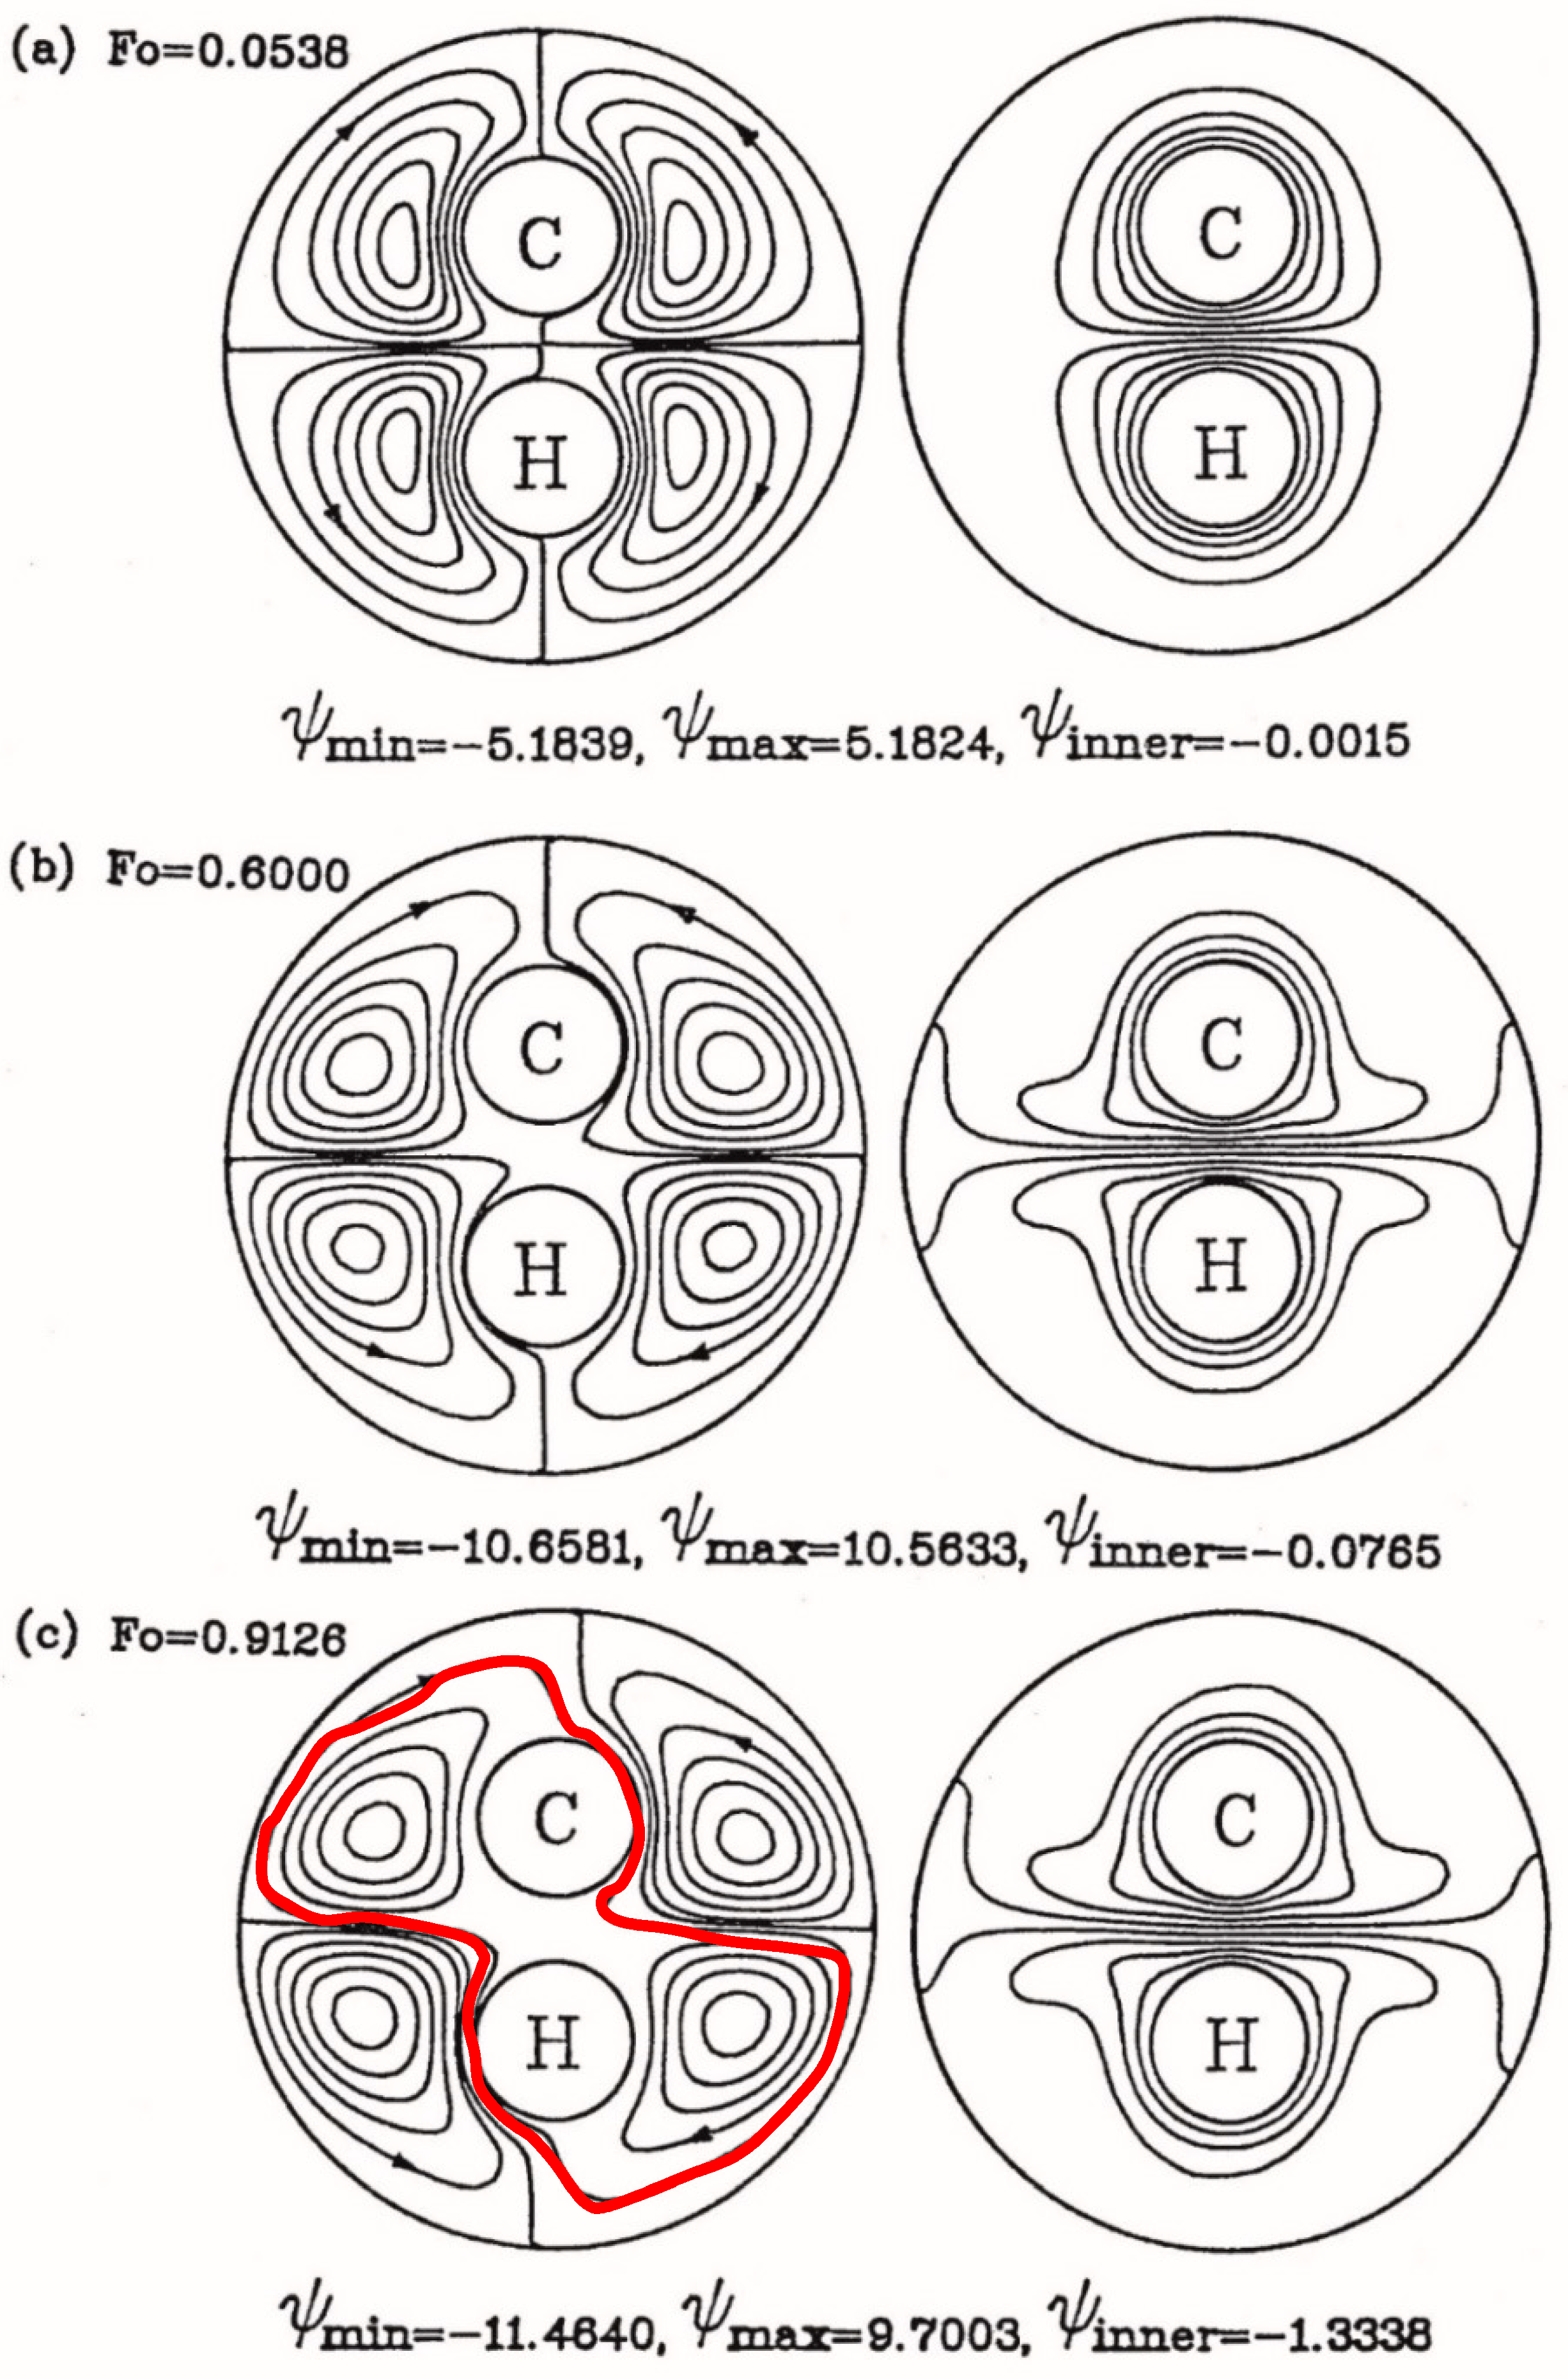
3.1. Case of Ra = 1 × 10⁴ and s/d = 0.7

Figure 3 shows the variations in the minimum stream function value, | ψ m i n | , and average Nusselt number between two cylinders, N u ¯ , versus time when s/d = 0.7 and the Ra number is 1 × 10⁴. Figure 3 clearly shows that when the dimensionless time Fo exceeds 4.5, both the minimum stream function values and Nusselt numbers between two cylinders are in the steady state. Figure 4 shows the variation in the flow field and temperature distribution versus dimensionless time.
Figure 3 shows that in the early stage, the heat from the cold and hot cylinders transfers into the test section via heat conduction, resulting in high heat transfer rates. As time elapses, the temperature difference gradually decreases, and the heat conduction-induced average heat transfer rate gradually decreases. Next, the heat convection effect gradually strengthens (symbol (d) in Figure 3; Figure 4d). Therefore, the heat transfer coefficient increases with time and eventually stabilizes. Figure 4a,b show that during the initial convection stage, the flow field exhibits a pattern of four nearly symmetric circulations (top left, top right, bottom left and bottom right). The top left and bottom right flow fields circulate clockwise, and the top right and bottom left flow fields circulate counterclockwise. At approximately Fo = 1.2362 (Figure 4d), the cold plume circulating clockwise at the top left disrupts the balance, flows toward the bottom right and merges with the bottom right clockwise flow. The bottom right hot plume flows toward the top left and merges with the top left clockwise flow. The two (original top left and bottom right circulations) merge into a major clockwise circulation around the cold and hot cylinders. A strong buoyancy effect increases the average heat transfer coefficient (symbol (d) in Figure 3 (right)). The original top right and bottom left counterclockwise circulations are suppressed by this major clockwise circulation and become minor circulations.
Subsequently, the clockwise major circulation decreases. At Fo = 1.7107, this major clockwise circulation decreases from a large dimension (Figure 4d) to a small dimension. The top right and bottom left counterclockwise circulations increase, as shown in Figure 4e. The average heat transfer coefficient decreases slightly. Then, the major clockwise circulation and counterclockwise circulations attenuate and grow, respectively. During this fluctuation, the overall average heat transfer coefficient increases again, as shown in Figure 3 (right) (symbols (e–g)) and Figure 4e–g. After Fo = 4.5, the location and strength of the circulation stabilize. Therefore, the minimum stream function value and average Nusselt number gradually stabilize.

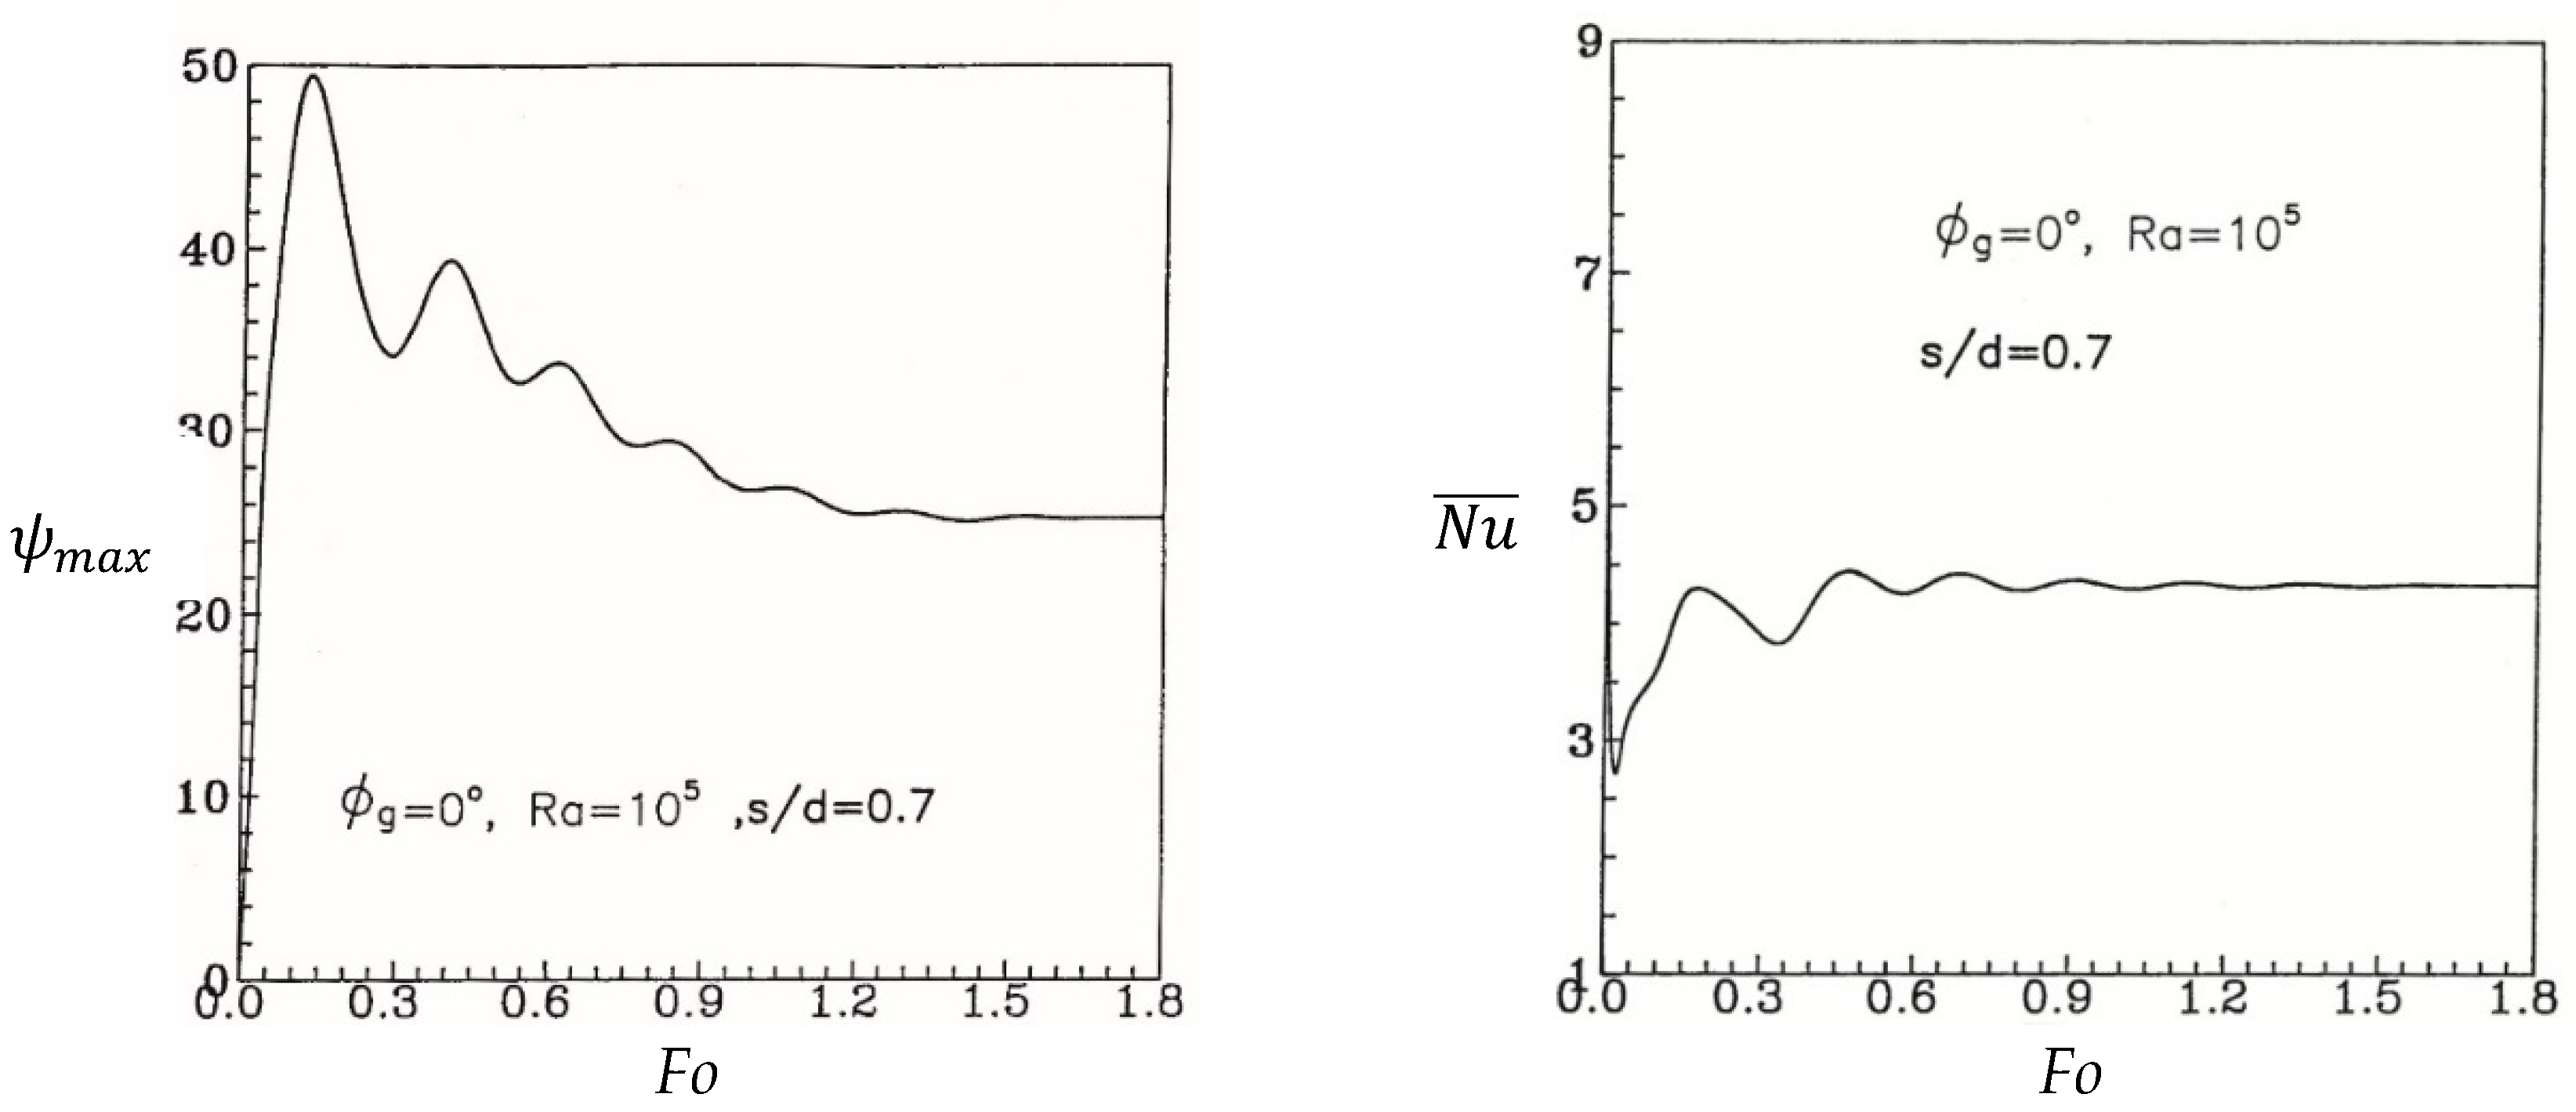
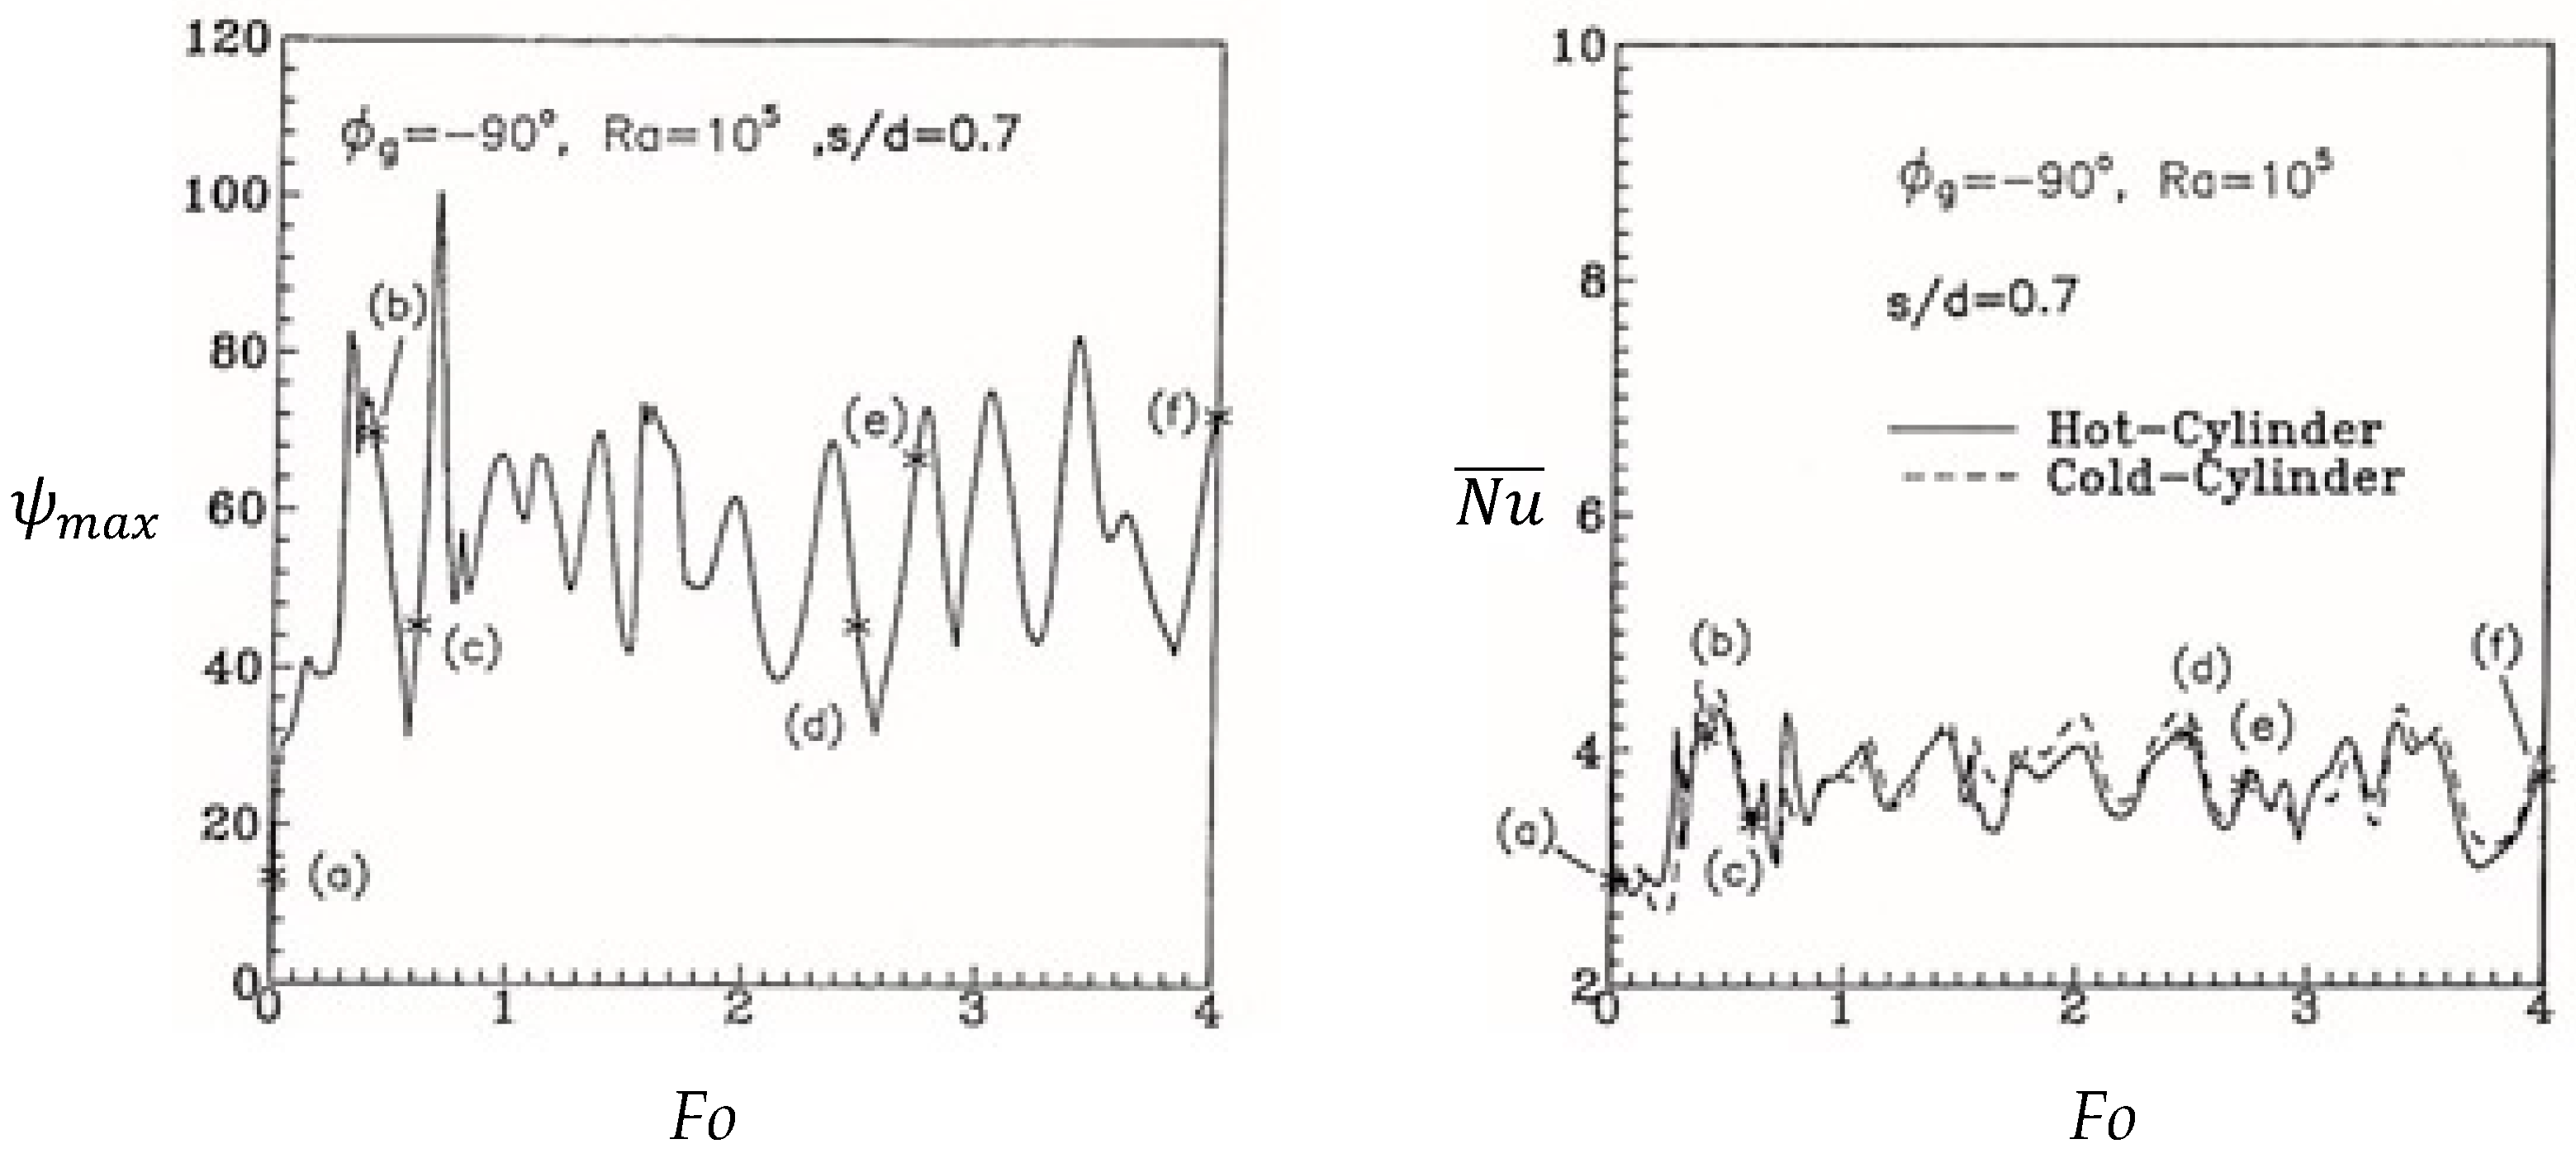
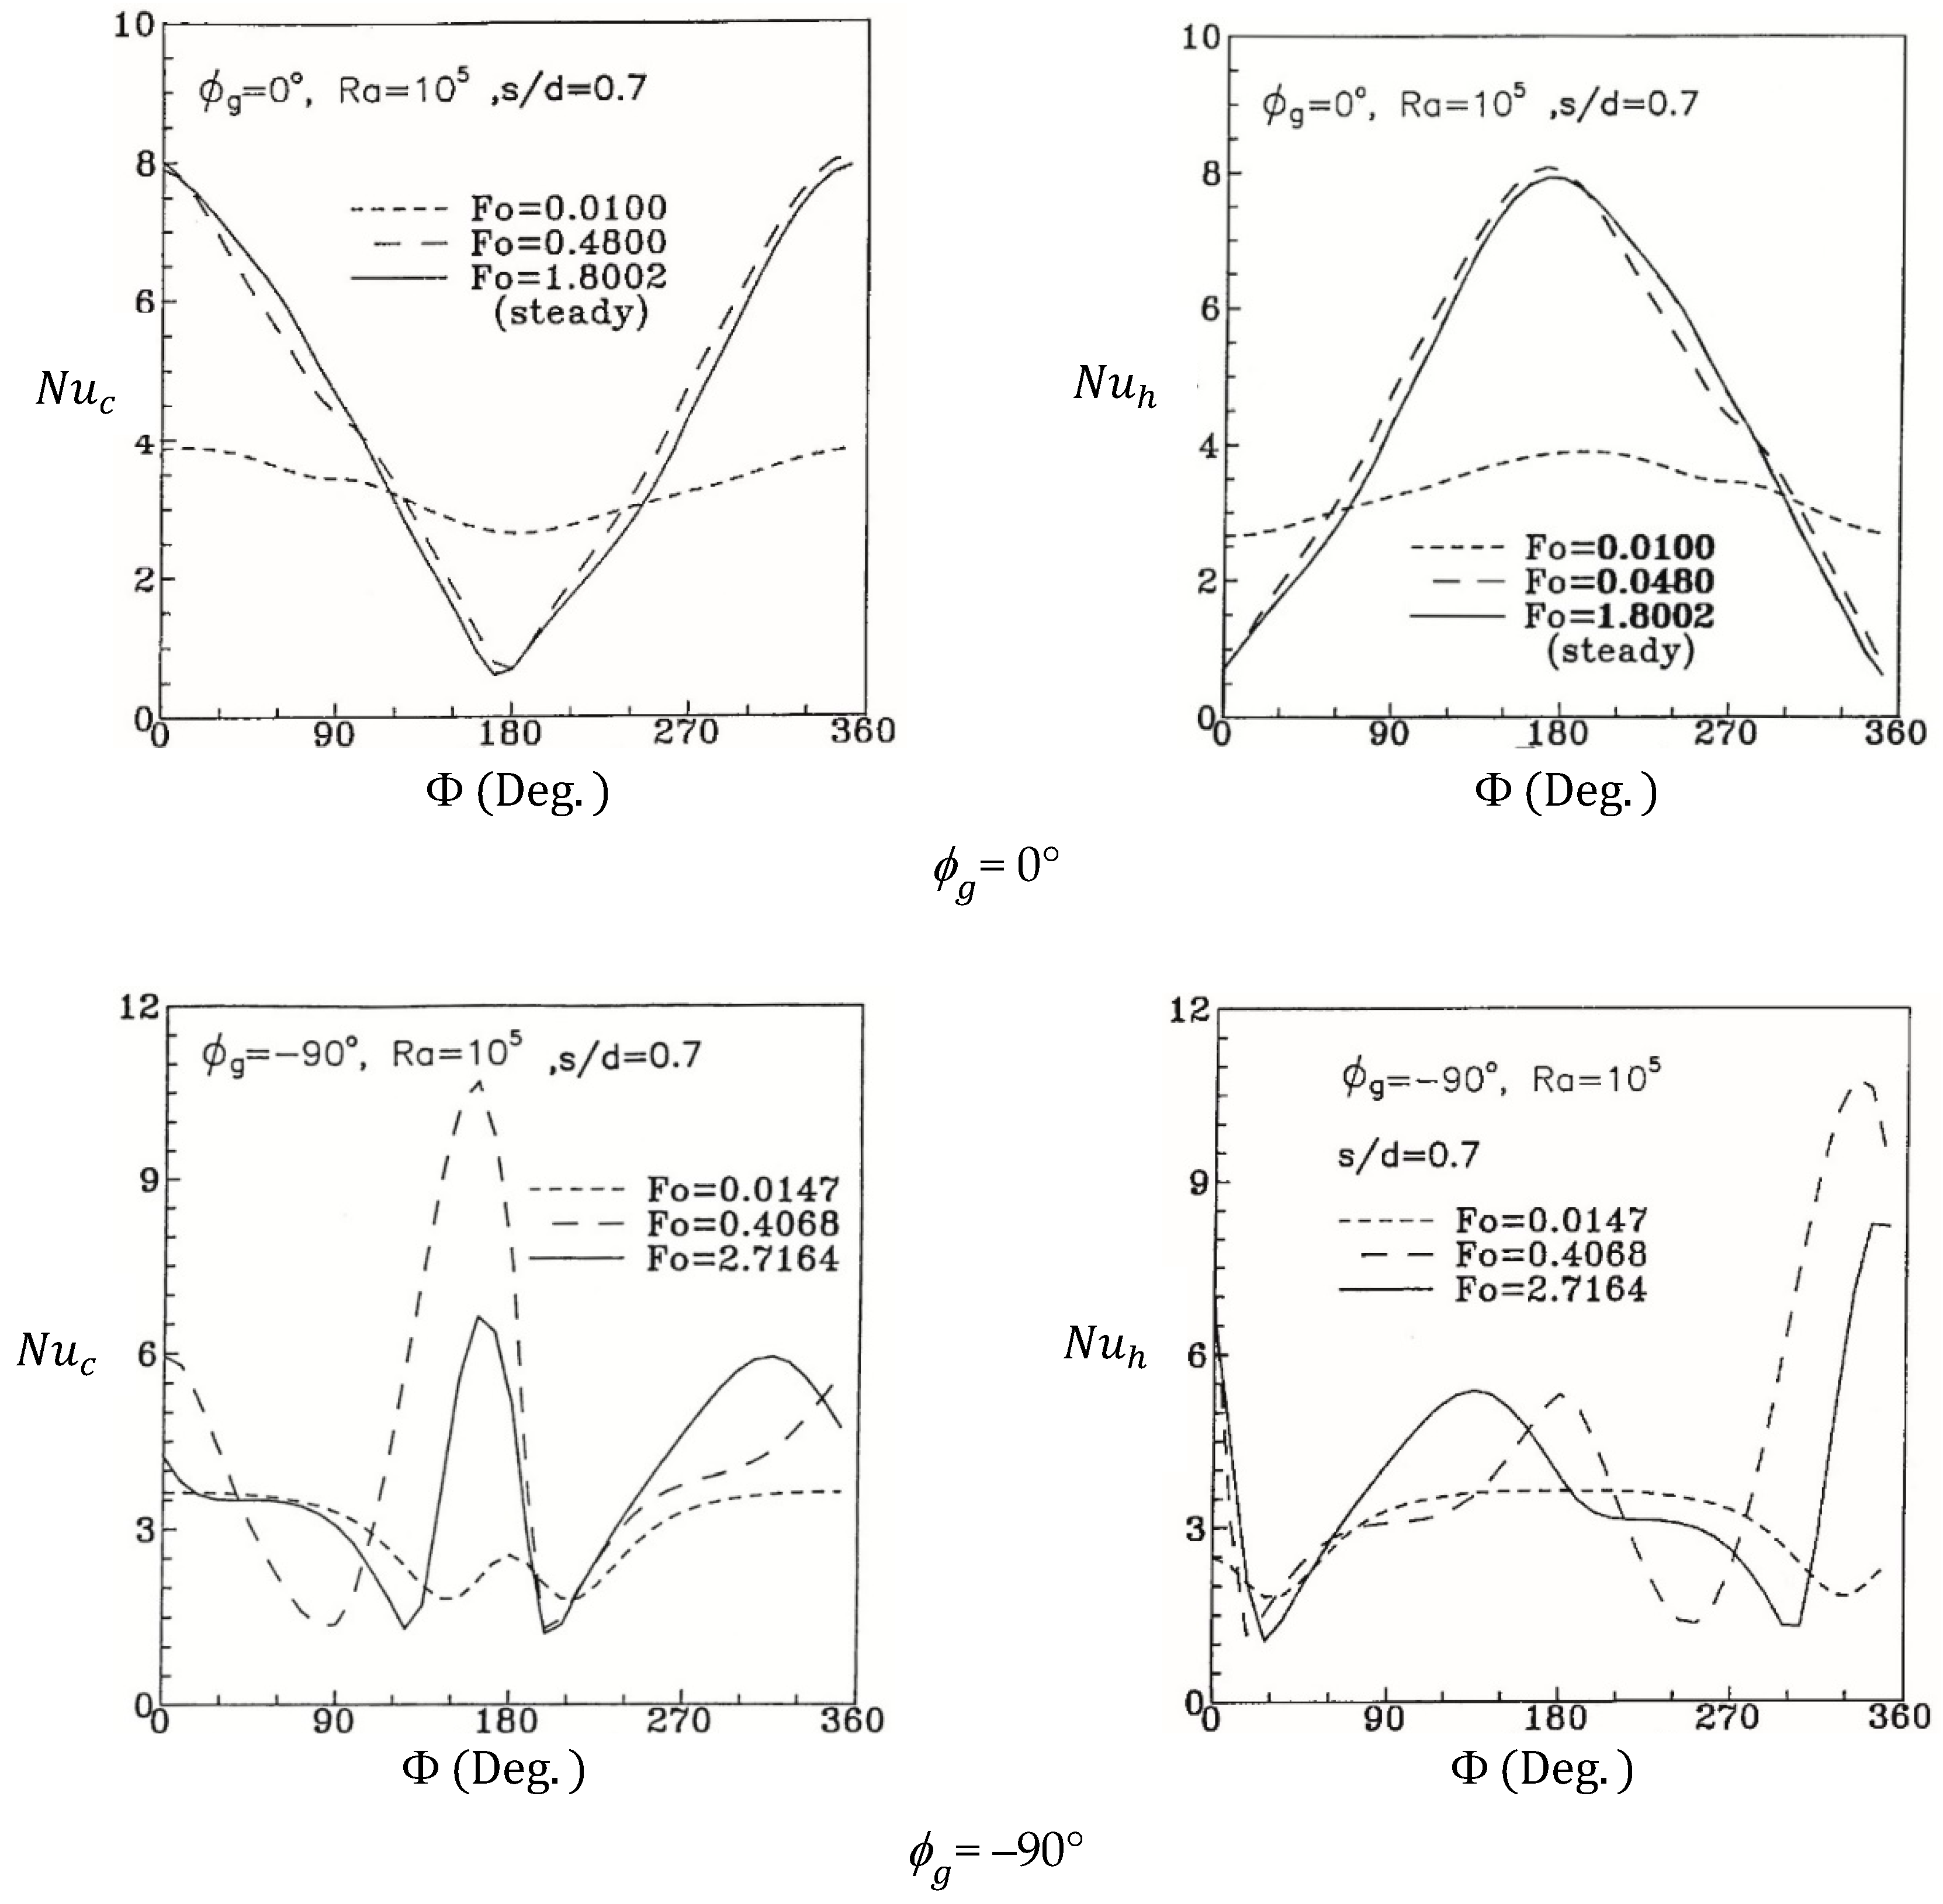
3.2. Case of Ra = 1 × 10⁵ and s/d = 0.7

Figure 5 shows the variation in maximum stream function value and average Nusselt number versus dimensionless time when Ra = 10 5. Figure 6 shows the variation in flow field and temperature distribution versus time. When the Ra number increases to 105, the phase diagram (figure not shows) demonstrates that the flow becomes chaotic. Figure 5 (right) indicates that simultaneously, the cold and hot cylinders cannot sustain an energy balance because the hot and cold plumes have different strengths, resulting in different heat flows from the two cylinders.
Figure 6a shows that at Fo = 0.0147, the flow field consists of four symmetric circulations. At Fo = 0.4068 (Figure 6b), the top right counterclockwise cold plume disrupts the balance, flows toward the bottom left and merges with the bottom left counterclockwise hot plume to form the counterclockwise main circulation around the cold and hot cylinders. A strong buoyancy effect increases the heat transfer, as shown in Figure 5 (symbol (b)). The original top left and bottom right clockwise circulations are suppressed into two small clockwise circulations by this main circulation.
At Fo = 0.6078, Figure 6c shows that the two clockwise small circulations recover and suppress the counterclockwise main circulation. These two clockwise circulations merge into a major clockwise circulation around the cold and hot cylinders. However, the flow strength of the inner cells (shown by the red-dashed line) in the major circulation increases, and the heat exchange efficiency between the cold and hot cylinders decreases, as shown in Figure 5 (symbol (c)). As time elapses, the flow field and temperature distribution demonstrate an irregular variation pattern. Figure 6d–f shows that as the four plumes interact with each other and their respective strengths attenuate or grow, the flow direction of the major flow field changes accordingly.
When Ra = 5 × 10⁵ and a significant temperature difference exists between the cold and hot cylinders, after Fo = 0.2, the overall flow field and heat transfer are chaotic (data not shown). Because the circulation strength is high, the cold plume and hot plume merge into a counterclockwise major circulation around the cold and hot cylinders. In this major circulation, there are two counterclockwise inner cells on the left and right sides of the cold and hot cylinders (due to paper length constraints, this diagram is not shown).

3.3. Case of Ra = 1 × 10⁴ and s/d = 0.8333

When Ra = 104, as shown in Figure 7, the initial flow field develops into a pattern similar to the case of s/d = 0.7. The flow field consists of four symmetric circulations (top left, top right, bottom left and bottom right). The bottom right clockwise hot plume of the hot cylinder and the top left clockwise cold plume of the cold cylinder flow toward each other and eventually merge into a clockwise major circulation around the cold and hot cylinders, as shown at the bottom of Figure 7.
Between the cold and hot cylinders, there is a minor clockwise circulation. There are also small counterclockwise circulations on the left and right sides close to the external cylinder wall. The contribution of these small circulations to the heat transfer is minor. When Ra = 105, the maximum stream function value fluctuates irregularly, and a steady state is not reached (data not shown). The flow field primarily consists of a clockwise major circulation around the cold and hot cylinders and one or more inner cells that contact the cold and hot cylinders in the major circulation. The number and flow pattern of such small inner cells vary with time.

3.4. Comparison of Different Cases

For Ra = 104, the results of s/d = 0.7 and 0.8333 are compared. A comparison of Figure 3 and Figure 7 shows that when s/d = 0.7, the distance between the cold and hot cylinders is small, and the heat exchange works well between the two cylinders; thus, the average Nusselt number is slightly larger when s/d = 0.7 than when s/d = 0.83. In the transient variation, when s/d = 0.7, the strengths of the cold and hot flows are close in value, and the flow field and temperature distribution are symmetric. Therefore, the heat flowing from the hot cylinder is equal to the heat absorbed by the cold cylinder, and the average Nusselt number of the two cylinders is consistent. When s/d = 0.8333, as the cold plume and hot plume strengths are dissimilar during transient development, i.e., the flow field and temperature distribution are asymmetric, the average Nusselt number of the cold and hot cylinders varies. In a steady state, the cold plume and hot plume stabilize, and the fluctuation ceases. Thus, the average Nusselt number of the two cylinders becomes consistent.
The differences between ϕg = –90° and 0° are also assessed (s/d = 0.7 and Ra = 105). A comparison of Figure 5 and Figure 8 shows that when ϕg = 0°, the cold and hot cylinders always maintain an energy balance, i.e., the heat flow coming from the hot cylinder is equal to the heat absorbed by the cold cylinder. Therefore, during transient development, the average Nusselt number of the cold and hot cylinders is always identical. Furthermore, the flow field strength and heat transfer gradually reach a steady state as time elapses. When ϕg = –90°, the average Nusselt number of the cold and hot cylinders is no longer consistent during the transient process because the downward and upward cold and hot flows near the enclosure center restrain each other, and the flows cannot reach the opposite cylinder for heat exchange. Hence, the transient heat transfer between the cold and hot cylinders is inconsistent. When ϕg = 0°, the flow field and temperature distribution are symmetric (figures not shown). When ϕg = –90°, the flow field and temperature distribution are symmetric only during the initial stage. Figure 9 shows that the local Nusselt numbers ( N u h or N u c ) around the cylinder peripheries vary considerably when subjected to the flow pattern. Local Nusselt numbers increase with decreasing distance between the two cylinders.

4. Conclusions

In this paper, transient natural convection between cold and hot cylinders in a circular air-filled adiabatic enclosure is investigated via a finite differential numerical method. The cylinders are parallel to the ground. Based on the above results, the following conclusions are obtained:
(1)
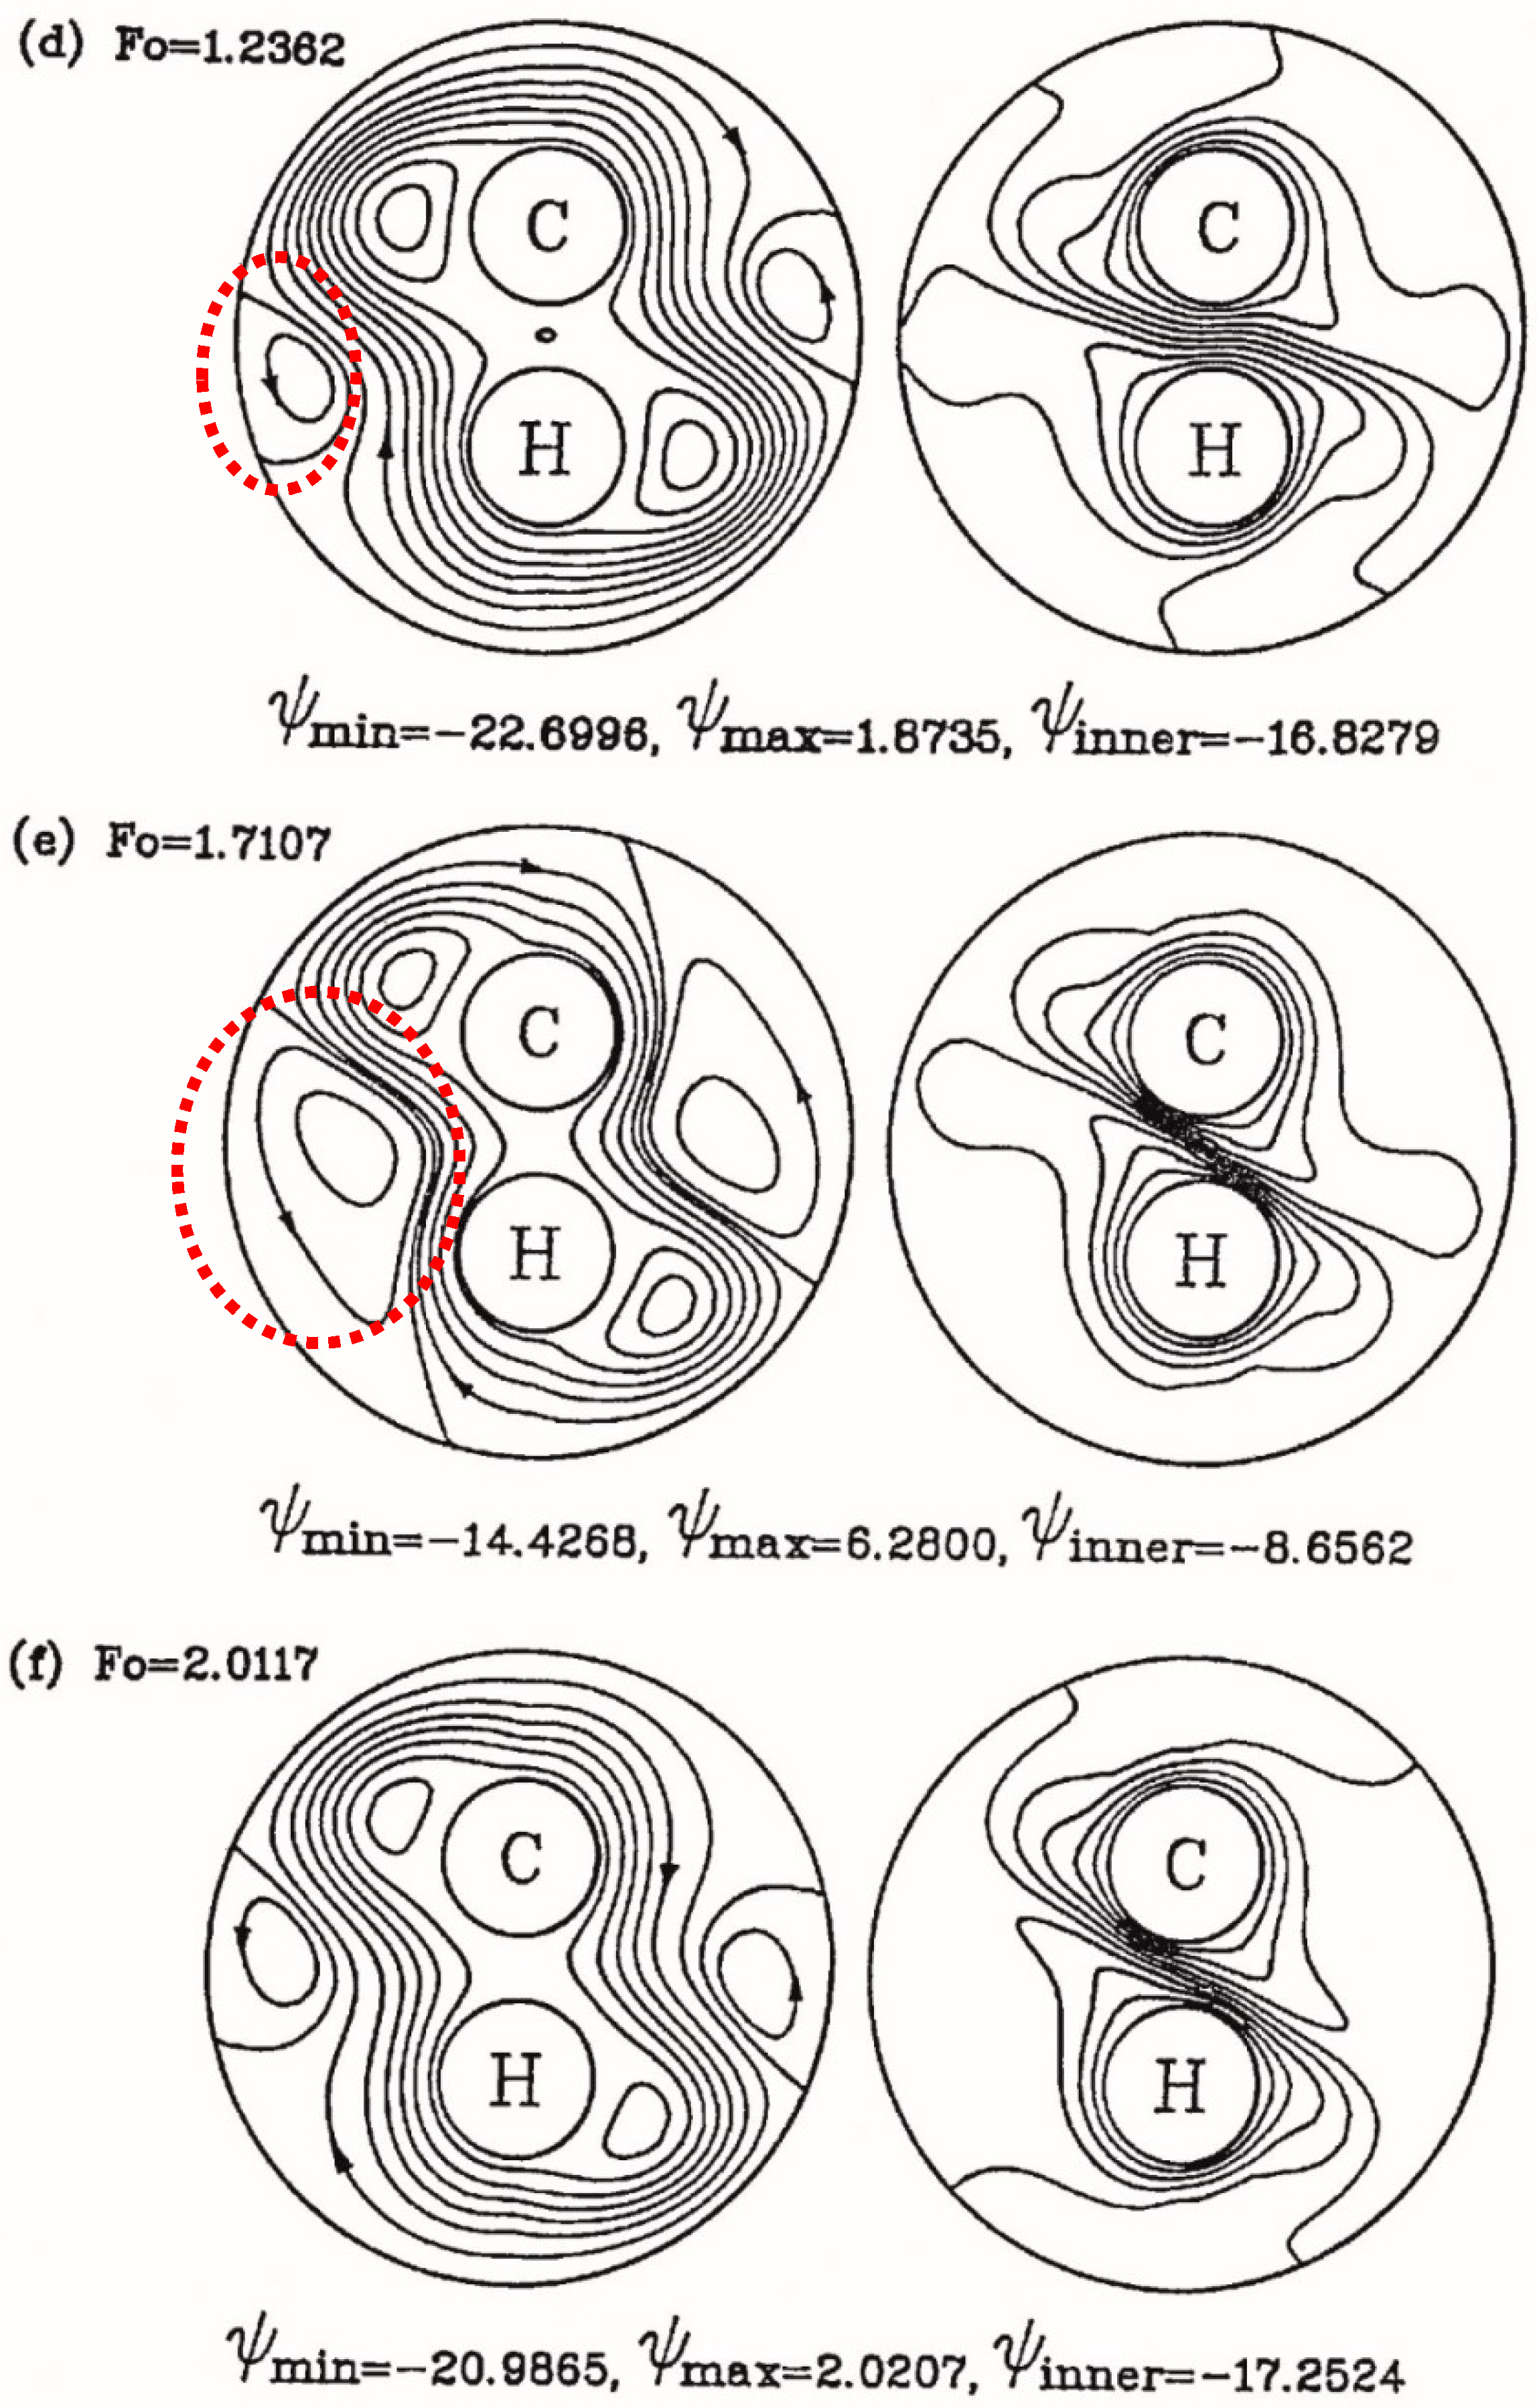
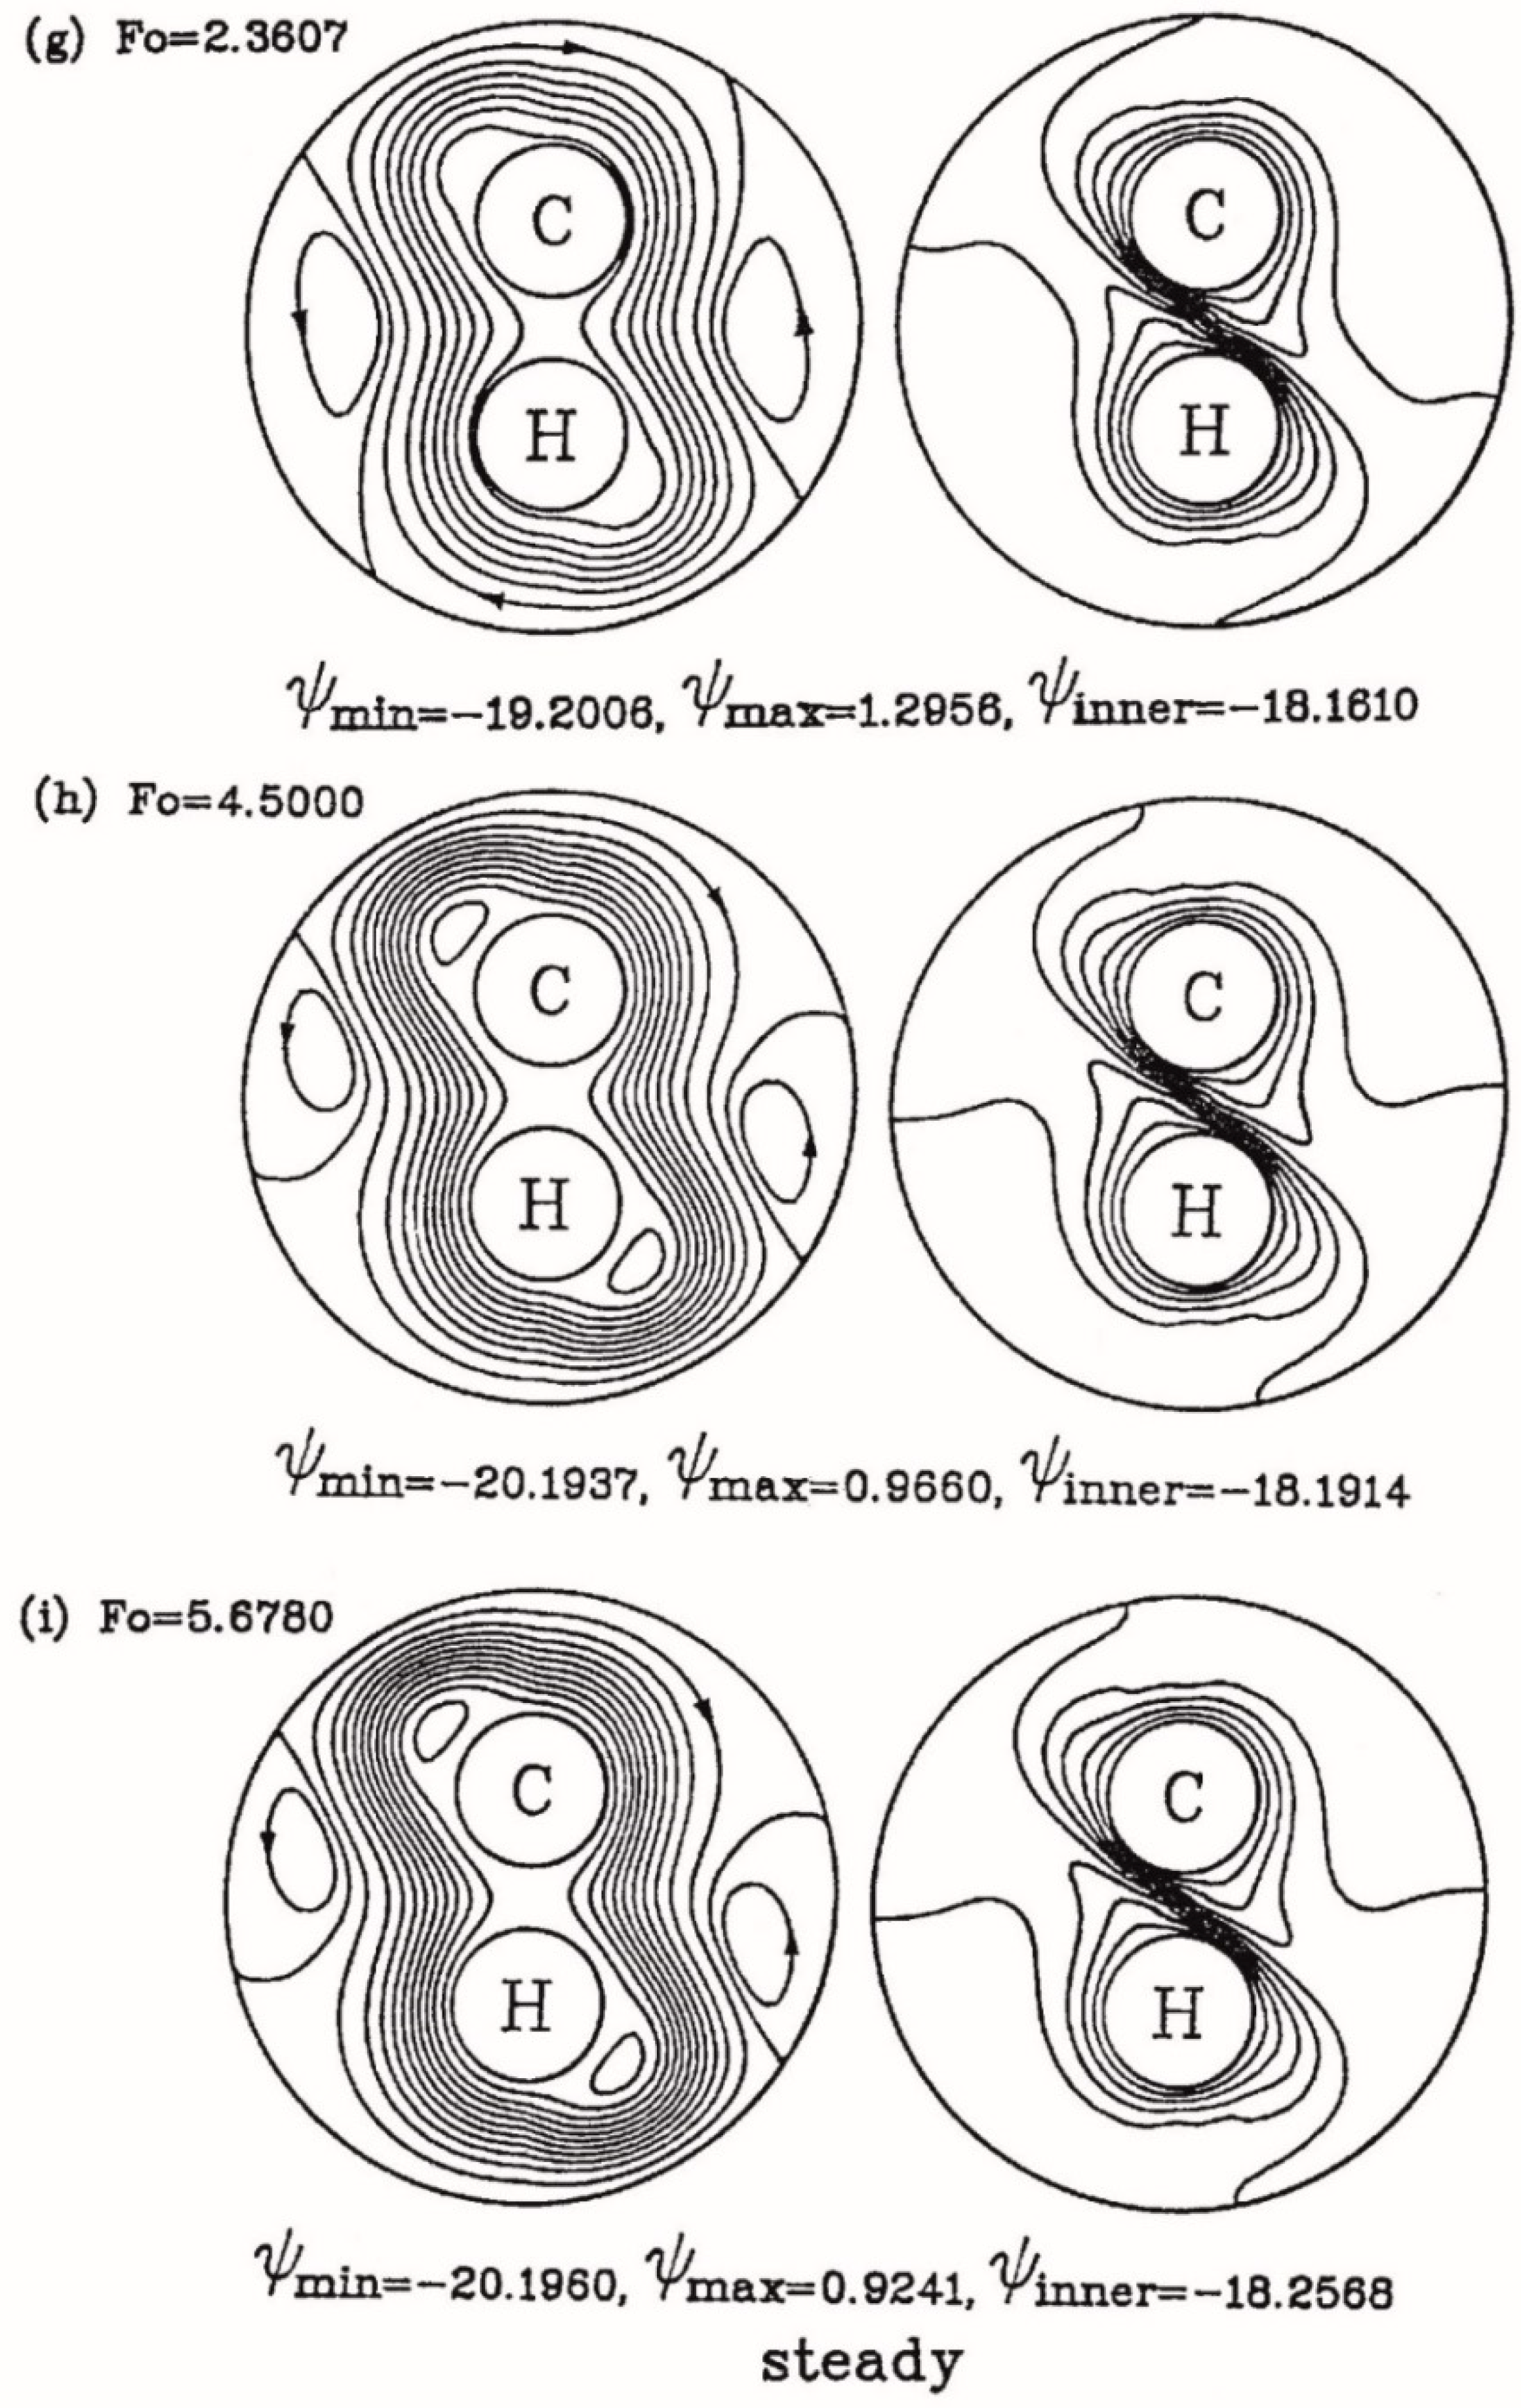
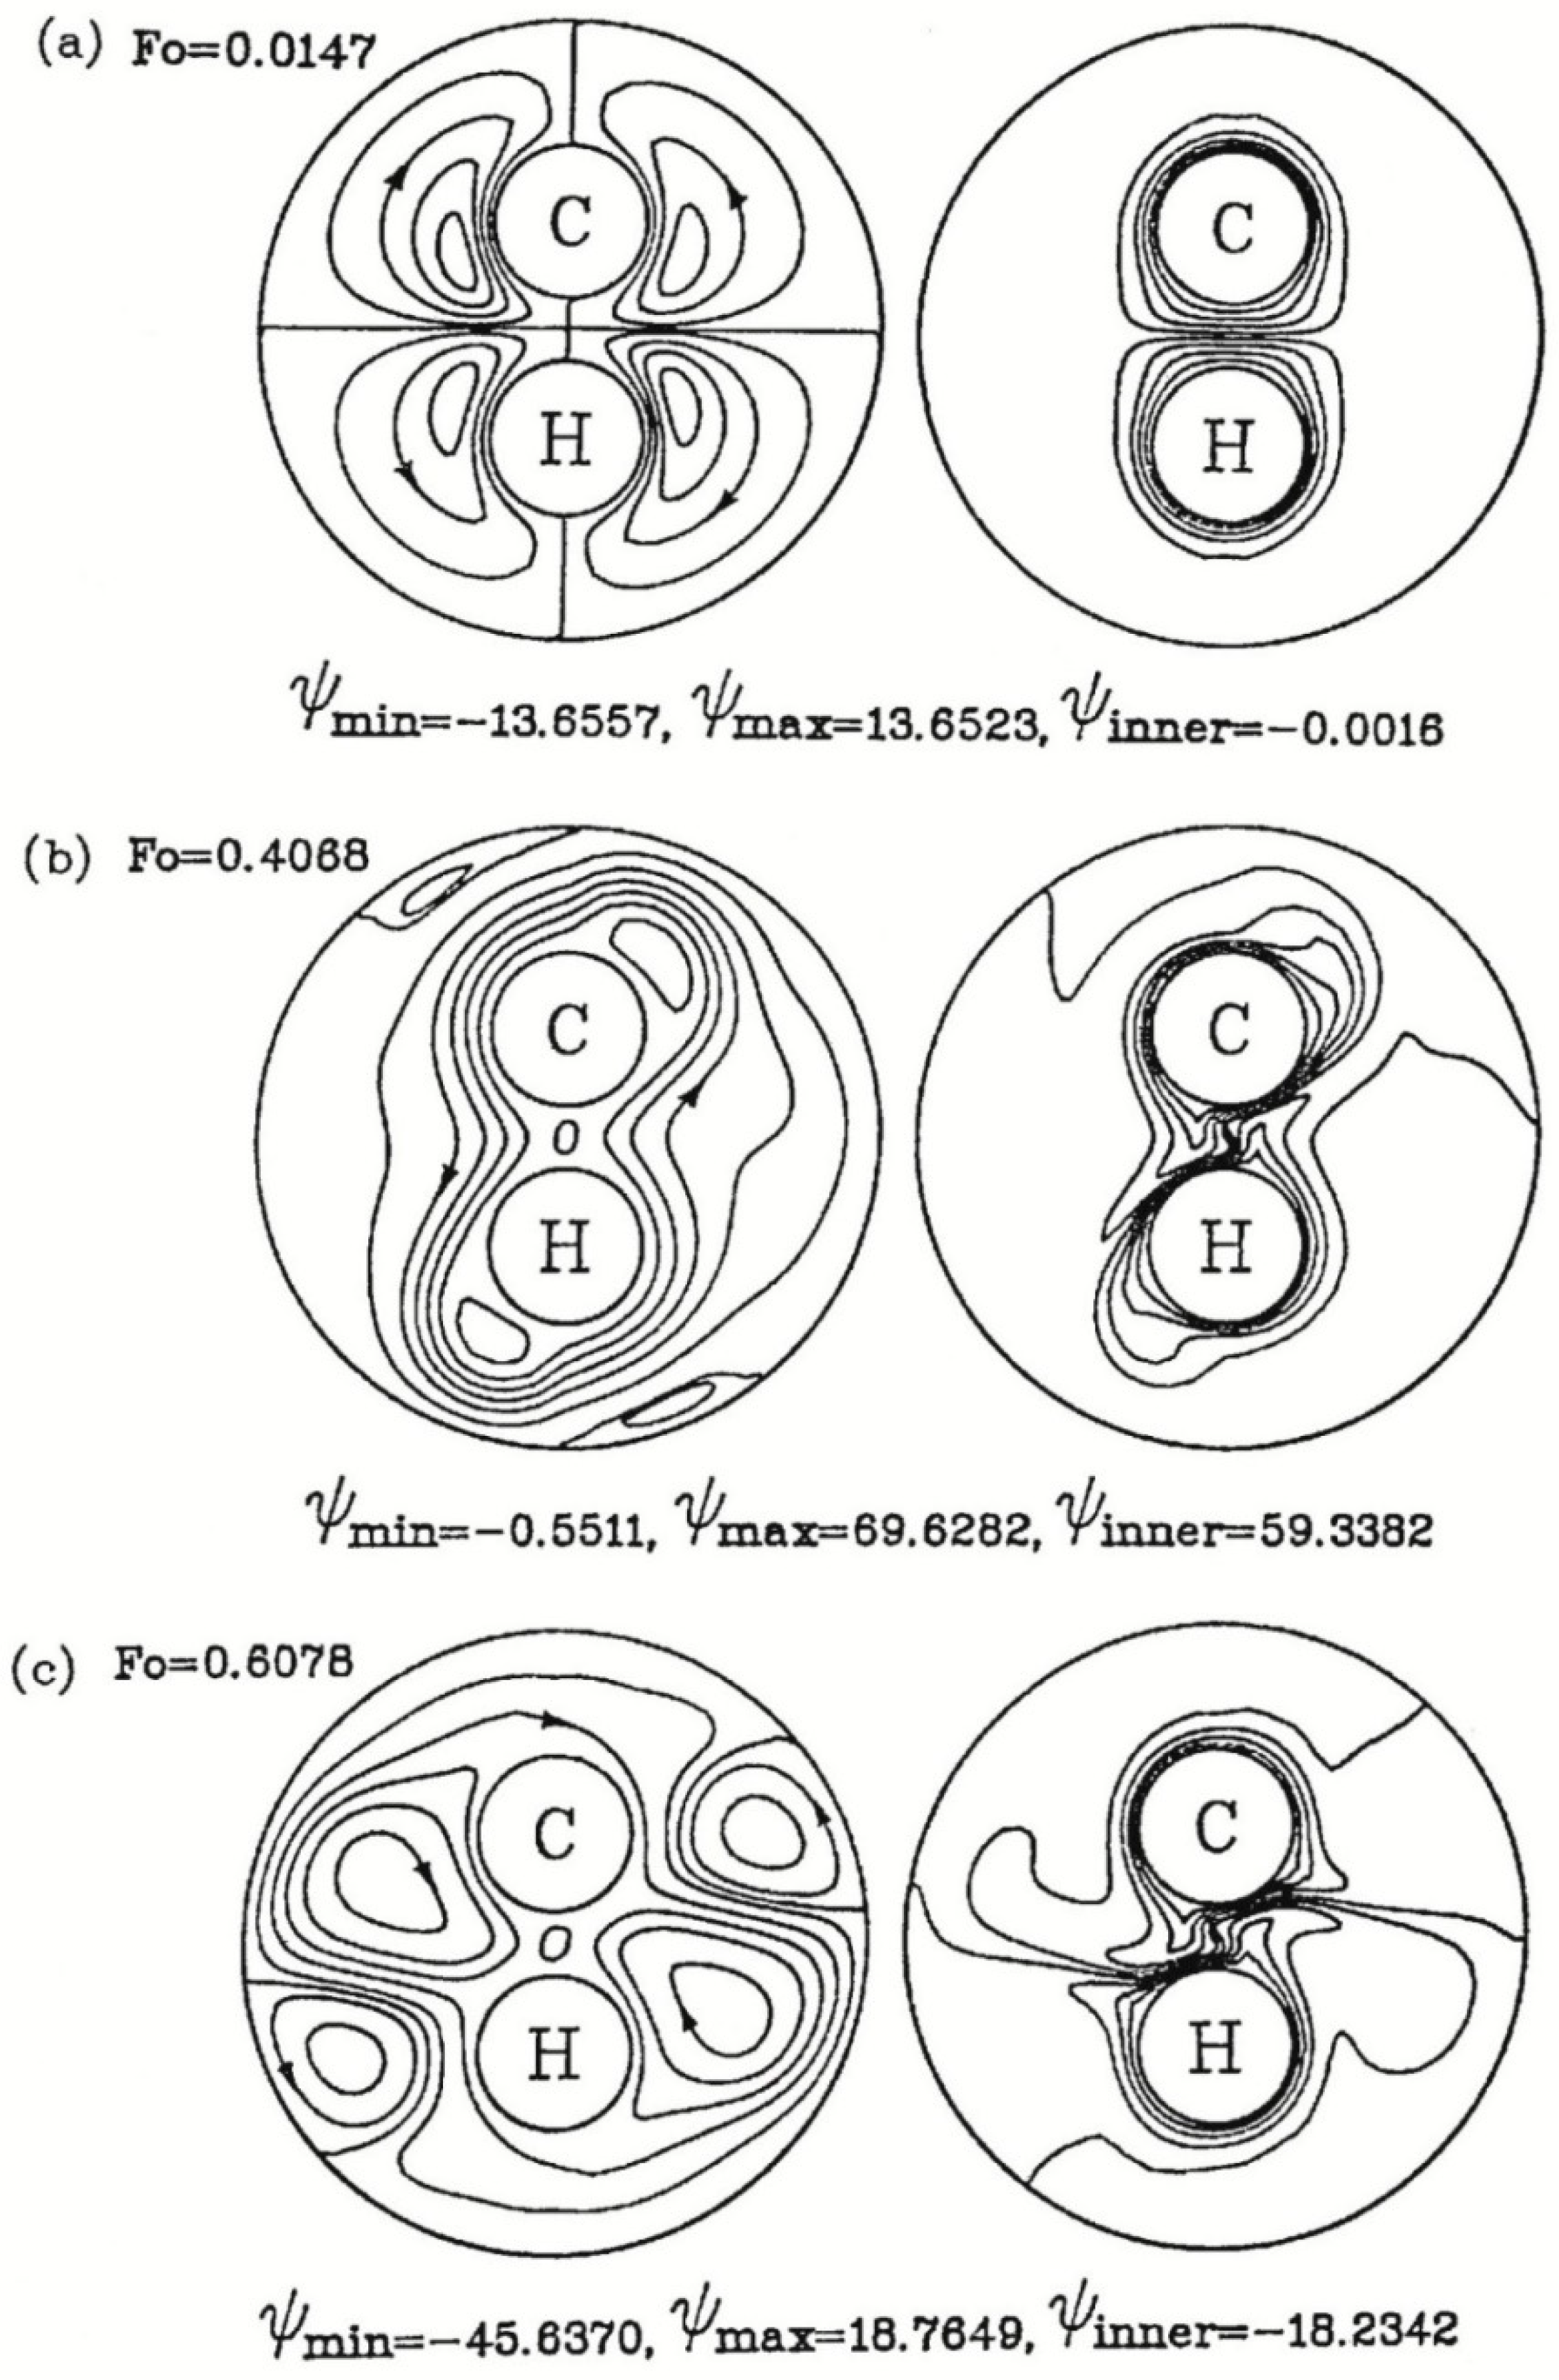
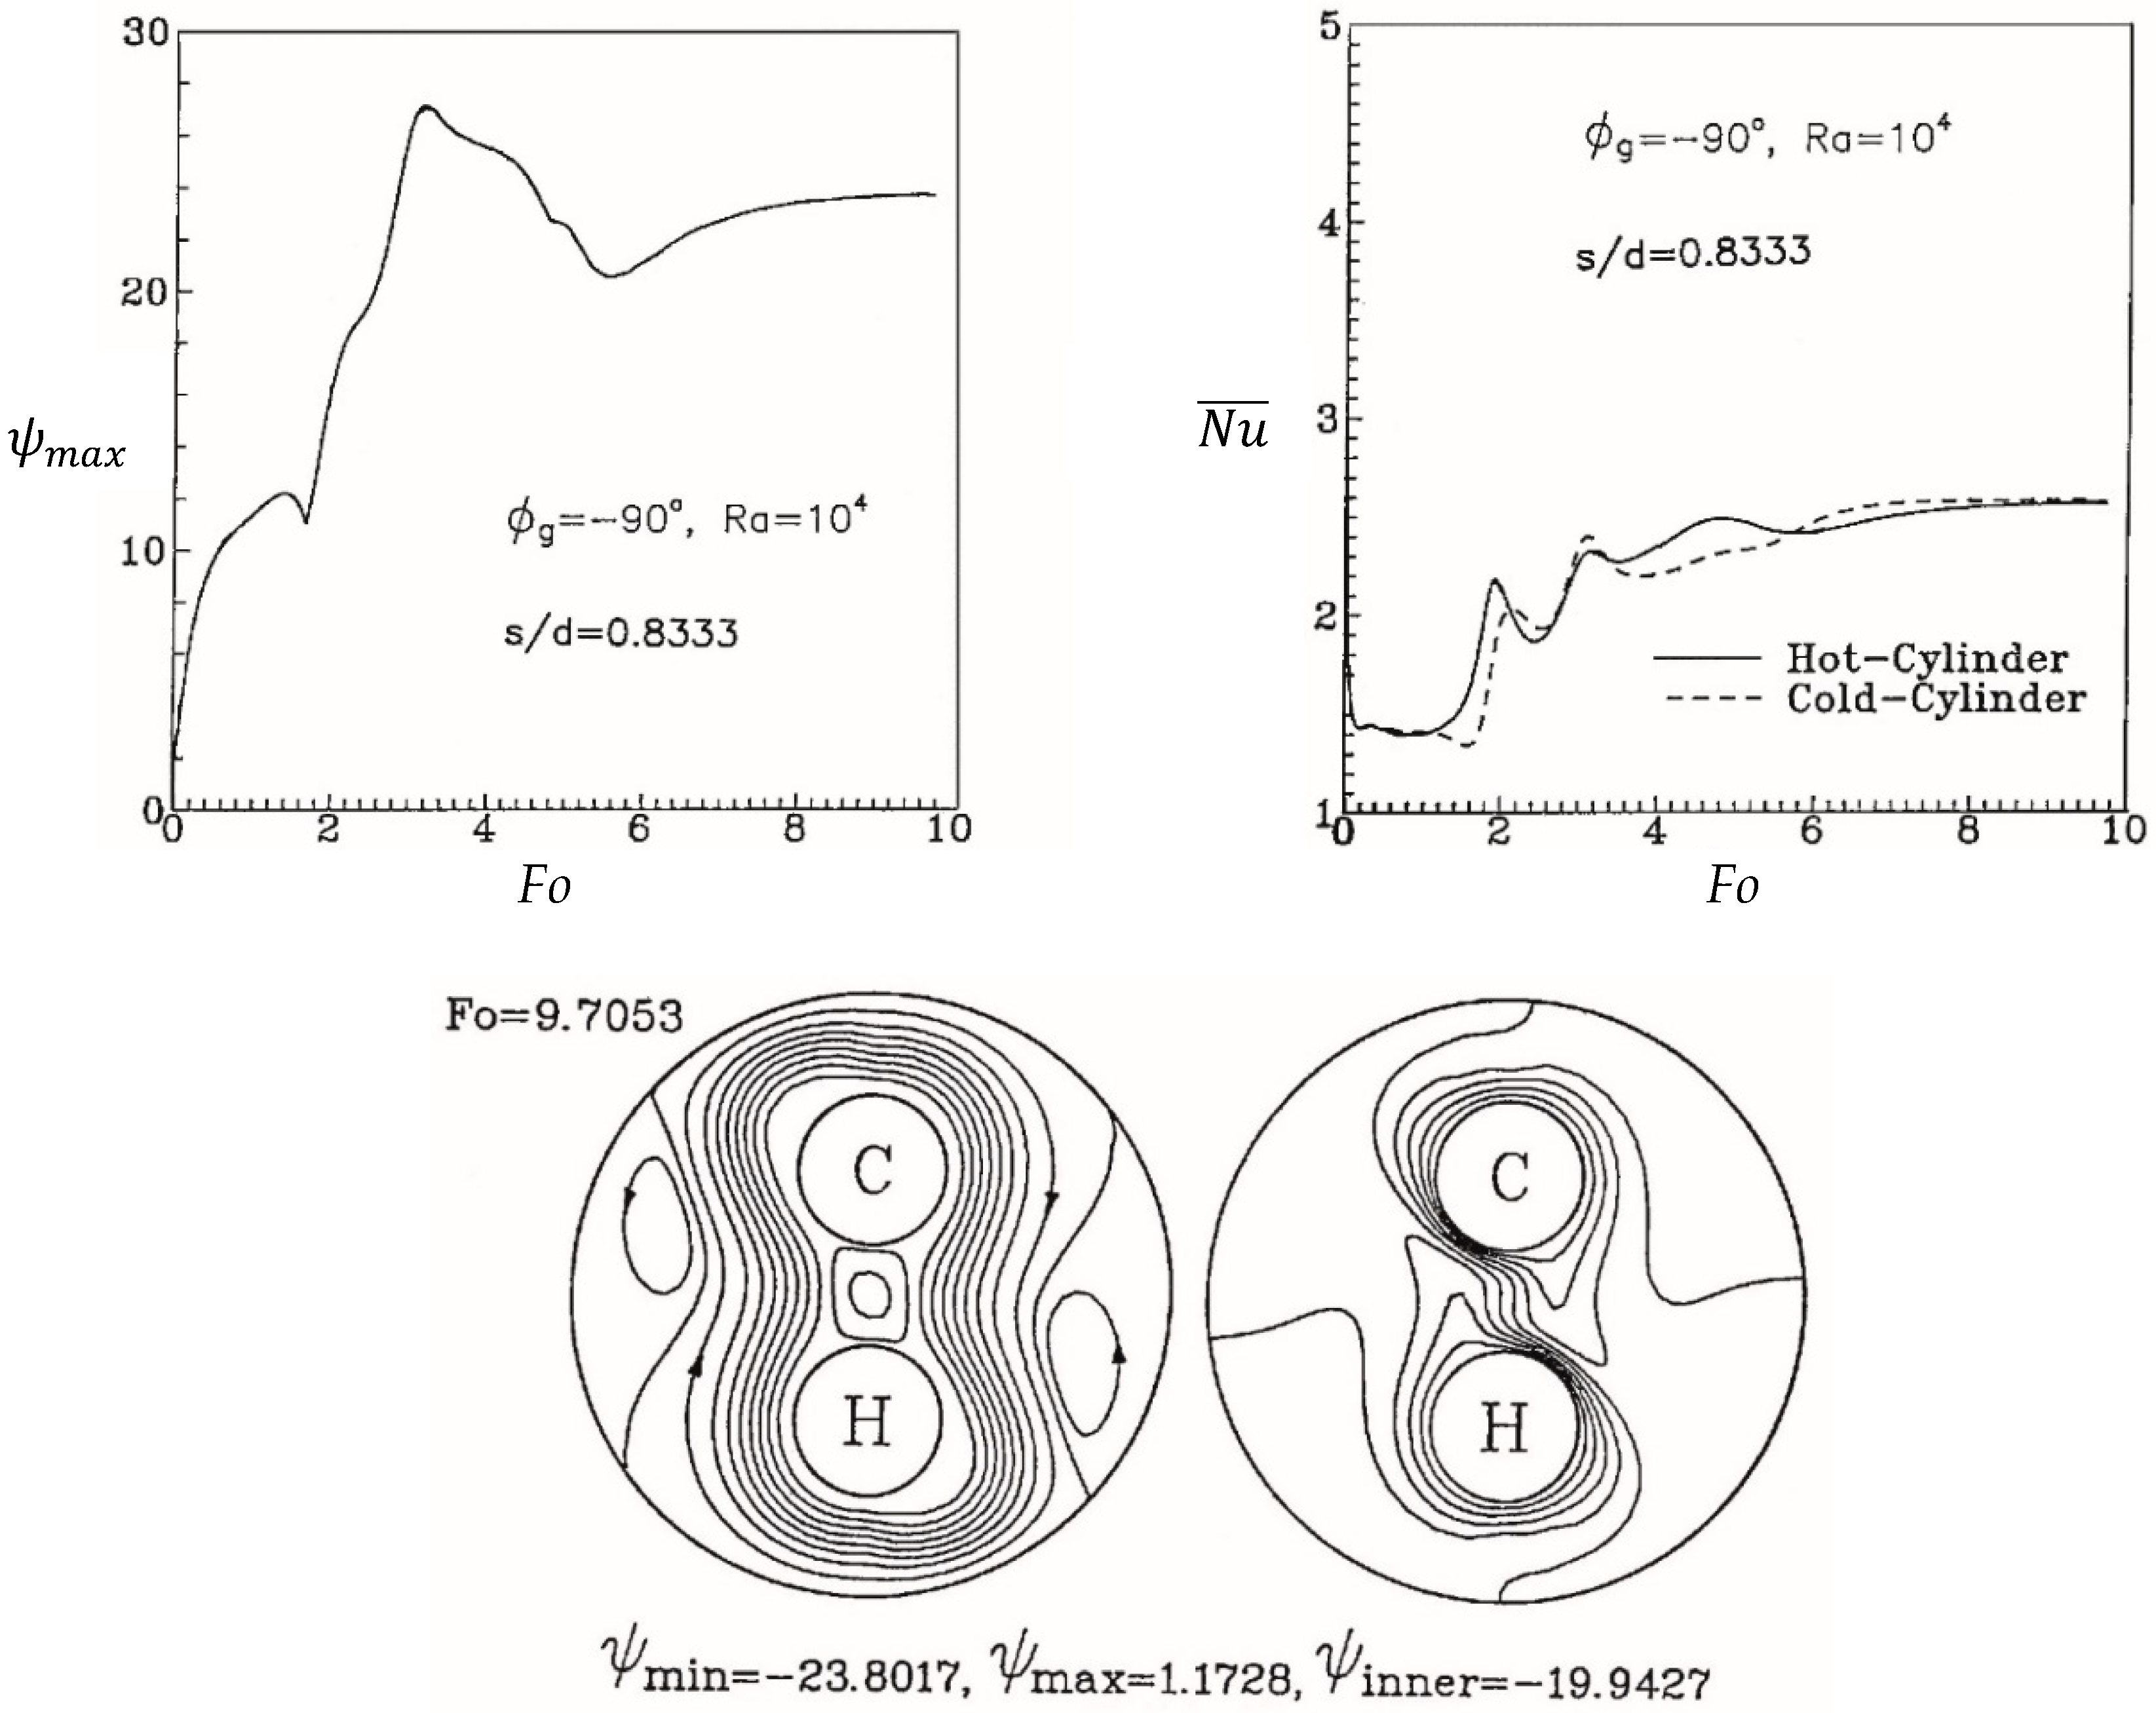
When the cylinders are positioned vertically (ϕg (inclination angle of the enclosure) = –90°; with the cold cylinder above the hot cylinder) and the Rayleigh (Ra) number is small, the flow field varies significantly during development due to the buoyancy effect; however, the flow field eventually reaches a steady state. The maximum Ra number that reaches a steady state is lower than that when the cylinders are positioned horizontally (ϕg = 0°).
(2)
When the cylinders are positioned vertically (ϕg = –90°), as heat flow from the hot cylinder moves upward and the cold flow from the cold cylinder moves downward, the temperature distribution and flow field are distorted. However, when the strengths of the two flows are close in value, symmetry can be maintained.
(3)
When the cylinders are positioned vertically (ϕg = –90°), transient fluctuations in the flow field and heat transfer occur as the Ra number increases or the distance between cylinders decreases.
(4)
Compared with horizontally positioned cylinders (ϕg = 0°), vertically positioned cylinders (ϕg = –90°) are more likely to feature chaotic flow field and heat transfer patterns. Similarly, a center-to-center half-spacing of 0.7 between cylinders is less stable than that of 0.8333.
(5)
Under the current investigated conditions, increasing the Ra number significantly increases the average heat transfer between cold and hot cylinders.

Author Contributions

C.J.H. and C.-M.L. conceived of and designed the model; G.N.S. performed the numerical simulations; C.J.H., G.N.S. and C.-M.L. analyzed the data; and C.-M.L. wrote the paper.

Funding

This research received no external funding.

Conflicts of Interest

The authors declare no conflicts of interest.

Nomenclature

a1, a2, a3Geometric coefficients
cSpecific heat (J/kg K)
dDiameter of cylinder (m)
FoFourier number (αt/d2)
gGravitational acceleration (m/s2)
hHeat transfer coefficient (W/m2 K)
JJacobian
kThermal conductivity coefficient (W/m K)
NuNusselt number
N u ¯ Average Nusselt number ( 1 2 π 0 2 π Nud ϕ )
PCoordinate control function
PrPrandtl number ( ν / α )
QCoordinate control function
r+Radial coordinate (m)
rDimensionless radial coordinate (r+/d)
RaRayleigh number (g β (Th – Tc)d3/ ν α )
RiRadius of cylinder (d/2)
RoRadius of circular enclosure
sCenter-to-center half spacing between cylinders
tTime (s)
TTemperature
TmMean temperature ((Th + Tc)/2))
U o ¯ Overall heat transfer coefficient
U, VContravariant velocity components
Greek symbols
α Thermal diffusivity (k/ ρ c) (m2/s)
β Thermal expansion coefficient (1/K)
δ Thickness (m)
ηTransformed coordinate
θ Dimensionless temperature ((T – Tm)/(Th – Tc))
νKinematic viscosity (m2/s)
ρ Density (kg/m3)
ξTransformed coordinate
ϕAngular coordinate
ΦAngular location on cylinder surface
ϕgInclination angle
ψ Dimensionless stream function
ω Dimensionless vorticity
Subscripts
cCold cylinder
hHot cylinder
mMean value
oCircular enclosure

References

  1. Kassai, M. Experimental investigation on the effectiveness of sorption energy recovery wheel in ventilation system. Exp. Heat. Transfer 2017, 32, 106–120. [Google Scholar] [CrossRef]
  2. Kassai, M. Investigation of carbon dioxide cross-contamination in sorption energy recovery wheel in ventilation system. Build. Serv. Eng. Res. Trans. 2018, 39, 463–474. [Google Scholar] [CrossRef]
  3. Kassai, M.; Simonson, C.J. Experimental effectiveness investigation of liquid-to-air membrane energy exchangers under low heat capacity rates conditions. Exp. Heat. Transf. 2016, 29, 445–455. [Google Scholar] [CrossRef]
  4. Kohli, I.P. Steam tracing of pipelines. Chem. Eng. J. 1979, 86, 156–163. [Google Scholar]
  5. Kassai, M. Effectiveness and humidification capacity investigation of liquid-to-air membrane energy exchanger under low heat capacity ratios at winter air conditions. J. Therm. Sci. 2015, 24, 391–397. [Google Scholar] [CrossRef]
  6. Kassai, M.; Simonson, C.J. Performance investigation of liquid-to-air membrane energy exchanger under low solution/air heat capacity rates ratio conditions. Build. Serv. Eng. Res. Trans. 2015, 36, 535–545. [Google Scholar] [CrossRef]
  7. Baïri, A.; Zarco-Pernia, E.; de María, J.M.G. A review on natural convection in enclosures for engineering applications. The particular case of the parallelogrammic diode cavity. Appl. Therm. Eng. 2014, 63, 304–322. [Google Scholar] [CrossRef]
  8. Ho, C.J.; Chang, W.S.; Wang, C.C. Natural convection between two horizontal cylinders in an adiabatic circular enclosure. J. Heat Transf. 1993, 115, 158–165. [Google Scholar] [CrossRef]
  9. Ho, C.J.; Cheng, Y.T.; Wang, C.C. Natural convection between two horizontal cylinders inside a circular enclosure subjected to external convection. Int. J. Heat Fluid Flow 1994, 15, 299–306. [Google Scholar] [CrossRef]
  10. Wang, Q.X.; Lei, H.Y.; Wang, S.X.; Dai, C.S. Natural convection around a pair of hot and cold horizontal microtubes at low Rayleigh numbers. Appl. Therm. Eng. 2014, 72, 114–119. [Google Scholar] [CrossRef]
  11. Dai, C.S.; Li, M.; Lei, H.Y.; Wang, S.X. Numerical simulation of natural convection between hot and cold microtubes in a cylinder enclosure. Int. J. Therm. Sci. 2015, 95, 115–122. [Google Scholar] [CrossRef]
  12. Khalili, E.; Saboonchi, A.; Saghafian, M. Natural convection of Al2O3 nanofluid between two horizontal cylinders inside a circular enclosure. Heat Transf. Eng. 2017, 38, 177–189. [Google Scholar] [CrossRef]
  13. Ho, C.J.; Sou, G.N.; Lai, C.M. Effects of a flow mode transition on natural convection heat transfer in a heat tracing enclosure. Proc. Inst. Mech. Eng. E J. Process Mech. Eng. 2018. [Google Scholar] [CrossRef]
  14. Ho, C.J.; Tu, F.J. Numerical study on oscillatory convection of cold water in a tall vertical enclosure. Int. J. Numer. Method Heat Fluid Flow 1999, 9, 487–508. [Google Scholar] [CrossRef]
  15. Thompson, J.F.; Thames, F.C.; Mastin, C.W. Automatic numerical generation of body-fitted curvilinear coordinate system for field containing any number of arbitrary two-dimensional bodies. J. Comput. Phys. 1974, 15, 299–319. [Google Scholar] [CrossRef]
  16. Thomas, P.D.; Middlecoff, J.F. Direct control of the grid point distribution in meshes generated by elliptic equations. AIAA J. 1980, 18, 652–656. [Google Scholar] [CrossRef]
  17. Adlam, J.H. Computation of two-dimensional time-dependent natural convection in a cavity where there are internal bodies. Comput. Fluids 1986, 14, 141–157. [Google Scholar] [CrossRef]
  18. Park, S.K.; Chang, K.S. Numerical study on interactive laminar natural convection from a pair of vertically separated horizontal cylinders. Numer. Heat Transf. 1988, 14, 61–74. [Google Scholar] [CrossRef]
Figure 1. Schematic diagram of the physical configuration investigated.
Energies 12 01440 g001
Figure 2. The typical composite overlapping grid system used in this study [13].
Energies 12 01440 g002
Figure 3. Variation in the minimum stream function value (left) and average Nusselt number between two cylinders (right) versus time (ϕg = −90°, Ra = 104 and s/d = 0.7).
Energies 12 01440 g003
Figure 4. Transient variations in streamlines (left) and isotherms (right) (ϕg = −90°, Ra = 104 and s/d = 0.7).
Energies 12 01440 g004aEnergies 12 01440 g004bEnergies 12 01440 g004c
Figure 5. Variations in the maximum stream function (left) and average Nusselt number (right) of the cold and hot cylinders versus time (ϕg = −90°, Ra = 105 and s/d = 0.7).
Energies 12 01440 g005
Figure 6. Transient variations in flow pattern (right) and temperature field (left) (ϕg = −90°, Ra = 105 and s/d = 0.7).
Energies 12 01440 g006
Figure 7. Variation in the maximum stream function value (top left) and average Nusselt number (top right) versus time, and the steady state flow field and temperature distribution (bottom) (ϕg= −90°, Ra = 104 and s/d = 0.8333).
Energies 12 01440 g007
Figure 8. Variation in the maximum stream function (left) and average Nusselt number (right) of cold and hot cylinders versus time (Ra = 105) (ϕg = 0°, Ra = 105 and s/d = 0.7) [13].
Energies 12 01440 g008
Figure 9. Variation in the local heat transfer coefficients of the cold cylinder (left) and hot cylinder (right) versus time (Ra = 105 and s/d = 0.7).
Energies 12 01440 g009

