1. Introduction
Uncoordinated use of energy and high penetration of electric vehicles (EV) causes demand to peak and also degrades power quality which results in high energy costs. Consequently, the onus lies on the utility company to devise ways of reducing peak demand via various demand-side management (DSM) methods such as peak shaving and energy arbitrage via financial incentives [
1]. DSM sets up incentives to encourage users to consume less power during peak times or defer energy use during peak times to off-peak times to mitigate the peak demand, this protects the grid and also lowers the electricity cost for a stable grid [
2,
3].
DSM using techniques such as price and incentive-based demand response (DR) programs have been widely deployed to manage the grid via building energy-management systems (BEMS) as presented in [
4,
5]. DSM in recent years has evolved to use battery energy storage systems (BESS) in its operation due to their inherent advantages. BESS compared to other traditional storage system are modular, tractable, has a fast and high-power density; this makes them suitable a large number of applications [
6].
The sole purpose of most DSM methods is to mitigate peak demand by enforcing a peak demand limit. BESS is employed to ensure that peak demand does not surpass the set peak limit, thereby maintaining the voltage imbalance factor within the recommended value [
7], these solutions did not consider the economic benefit of using BESS. The study by [
8] aims at reducing the electric cost of a building using energy arbitrage and peak control. This solution relies on time-of-use (TOU) tariffs as issued by utility companies via load shifting and peak clipping respectively to reduce electricity bill for customers. These solutions help distress utility companies especially during high peak power demands times; nonetheless, their BESS schedule is not optimal, and methods do not account for future peak violations.
To account for future peaks violations most DSM solution resort to a day ahead forecast of demand for peak control which is mostly regression-based methods or artificial neural networks. The work in [
9] forecasted daily demand profile of an industrial facility using a Feed Forward Neural Network (FFNN). This method provides an optimal peak control operation using deterministic forecasts. Deterministic forecast do not account for demand uncertainties, as such it does not give a practical representation of future demand. Based on ex-post demand data, deterministic forecasts predict a single demand value at each time instance within a defined horizon. DSM based on deterministic forecast retain forecast errors and are not robust. In a case where the forecasted demand deviates from the observed demand, the schedule BESS operation cannot meet the required peak control. In a practice, it is difficult to make forecasts with certainty, as a result, probabilistic forecasts are suitable since they provide demand forecast at time instances as a probability distribution. Probabilistic forecast accounts for uncertainties, in view of this, its usefulness is not limited to forecasting but also in determining control policies and optimal operations [
10,
11]. The study proposed by [
12] deals with the control of HVAC for users’ thermal comfort and cost minimization using stochastic model predictive control to account for input uncertainties. The study does not consider peak demand control using BESS. The research by [
13] discusses a real-time dynamic interval density forecast to account for future demand uncertainties. The DSM solution is focused on the use of stationary BESS for peak demand control using stochastic optimization. The method does not consider the implementation of a fleet EVs as a means of energy storage for ancillary service which presents a complex problem due to their mobility.
In addition to its benefits, BESS can provide electrification for vehicles to reduce the amount of greenhouse gases (GHG) produced by road transportation [
14]. Plug-in electric vehicles (PEVs) can charge their onboard batteries and use the stored energy for transportation as well as provide ancillary service such as peak shaving for DSM in a configuration known as vehicle-to-grid (V2G) [
14].
Aside from these benefits, uncontrolled use of PEVs in bulk is likey to cause demand to peak. The total energy needed to support demand-side management in a V2G setting depends on the number of EVs connected to the grid, and the contribution of each PEV has to be fairly distributed.
V2G management control can be set up as a centralised and decentralised control; the centralised control mode has an aggregator at the helm of affairs with the responsibility of managing each participating PEV on how and when to charge or discharge PEV in a coordinated fashion as presented in [
15,
16]. In the decentralised control, each PEV is responsible for its charge and discharging operation making it convenient and easier to implement practically; this gives room for a localised grid [
17,
18,
19]. One downside of a decentralised operation is a feature of uncertainties in the arrival and departure time of PEVs, this introduces randomness in the available capacity committed by PEVs for DSM. Also, high penetration of PEVs can increase the dimension of the optimisation problem thereby needing more time to produce results.
Several approaches for DSM via PEV have been presented in the literature [
20,
21,
22,
23]. Most research considering V2G follows the peak limit tightly by discharging PEVs when the demand exceeds the peak limit. The work presented by [
20] developed an intelligent strategy to effectively utilise the available PEV battery capacity in a controlled fashion for local peak load shaving at PEV owners’ households. It does not consider the coordination of a fleet of PEVs. Reference [
21] proposed a V2G control algorithm for peak shaving and valley filling, considering vehicle requirements, load demands, EV and V2G constraints. These methods resort to deterministic forecast which is susceptible to failure under uncertainty. Since the demand forecast and EV user’s availability cannot be foretold with certainty, a solution that does not consider these conditions is not robust. Also, it’s very important to consider the minimum SoC at departure to allow EV user enough energy for a trip back home. This condition is mostly ignored in these works.
The works in [
17,
18,
24] proposes a DSM solution considered uncertainties in demand via a worst-case scenario. These assumptions may be cost-intensive on an operational level. In [
25] the authors discussed energy management for a micro-grid with solar generation, BESS and EVs considering the stochastic nature of demand and EV mobility. The method does not consider ways to restore the confidence of stochastic forecast to improve its accuracy within a time horizon. Also, the objective of the proposed model minimises the squared error of the difference in demand and peak limit without considering energy arbitrage.
High penetration of PEVs can increase the dimension of the optimisation problem needing more time to produce results. Machine learning and clustering algorithms proposed by [
26,
27] are used to cluster EV behaviour using k-means and an artificial neural network for EV behaviour prediction, but the method does not consider clustering of similar EV behaviour to scale the optimisation scheme making it independent of high EV penetration. The study by [
17] groups EVs based on charging location to enable an optimal scheduling scheme scale to a large EV population it does not consider clustering of EVs based on arrival and departure behaviour as well as storage parameters such as SOC.
This research introduces a real-time DSM solution for peak demand control using gridable EVs while considering uncertainties in demand and the mobility of PEV as a distributed energy storage. The proposed method provides an online probabilistic forecast and stochastic optimisation while considering uncertainties in demand and storage mobility to mitigating the peak demand of a building and reduce electricity cost. Dynamic-interval density forecast (DIDF) is employed to forecast the demand distribution profile of a building at set time intervals within a day horizon. DIDF and its accuracy are important for the performance of DSM, but the subject is outside the scope of this research; the authors are preparing a separate work on the subject. In this paper, we present the concept and format of DIDF as applied for the dynamic scheduling of a PEV. Piecewise peak approximation (PPA) as proposed by [
13] is employed to reduce the dimension of the forecast produced by DIDF to better the time complexity of the algorithm.
The solution is modelled to include EVs in V2G mode considering the stochastic nature in the arrival and departure times of PEV users. To obtain the available energy capacity that PEVs contribute at each time instance in a day, the arrival, departure and committed energy during plugin period is modelled as a random variable. To ensure the algorithms scales to high PEV populations, EVs are clustered into similar groups using k-means algorithm using arrival time, departure time and SOC parameter as a tuple. The algorithm is modelled to ensure a coordinated and even charge and discharging of available PEV considering each EVs mobility. Furthermore, the solution ensures a minimum SOC level is reserved at the time of departure. This is realised in conjunction with a day ahead density demand forecast, a given peak demand limit and the characteristics of PEVs. The achieved model is then formulated as an optimisation problem for a robust schedule resulting in cost saving as well as peak demand reduction while satisfying the technical constraint of maximising BESS efficiency and life cycle.
The main contributions of this article can be summarised as follows.
- (1)
Propose a real-time DSM solution with dynamic probabilistic forecast, dimensionality reduction and stochastic optimisation to provide a robust peak demand control for a building with economic benefit using PEV as a distributed energy storage.
- (2)
Develop an objective function to consider an ensemble of peak control and economic benefit based on probabilistic data.
- (3)
Incorporating clustering algorithms such as K-Means to clusters similar EV behaviour in other to resolve the dependency of EV optimisation schemes’ response time on high EV penetration.
The remainder of the paper is arranged in the following order:
Section 2 presents the details of the DSM algorithm considering uncertainties.
Section 3 describes the formulation of the proposed model.
Section 4 discusses the experimental setup; case study and evaluation of the proposed method
Section 5 compares the proposed method to a deterministic method and elaborates on the results. Finally,
Section 6 discusses a summary of the results and conclusions.
2. Methodology
The proposed DSM solution is made up of four main modules namely: dynamic-interval density forecast module, a dimensionality reduction module, an EV mobility module, and a stochastic optimisation module. These models are implemented for peak demand control and cost saving.
2.1. Dynamic-Interval Density Forecast
An effective DMS depends on a demand forecast for reliable operation. Using ex-post data density forecast generates a day ahead demand forecast as a probability distribution at each time instance in a day horizon. This is to cater for the stochastic nature of demand which is ignored in the case of an out of sample forecast. Electric demand exhibit uncertainties which depend on factors like weather conditions, special events and occurrences, and socioeconomic factors. Since electric demand exists in real-life with uncertainties a DMS solution that ignores the uncertainty factor is susceptible to errors. In such a case the BESS schedule will not be robust, and peak demand might not be resolved in cases where demand forecast substantially deviates from observed demand [
13].
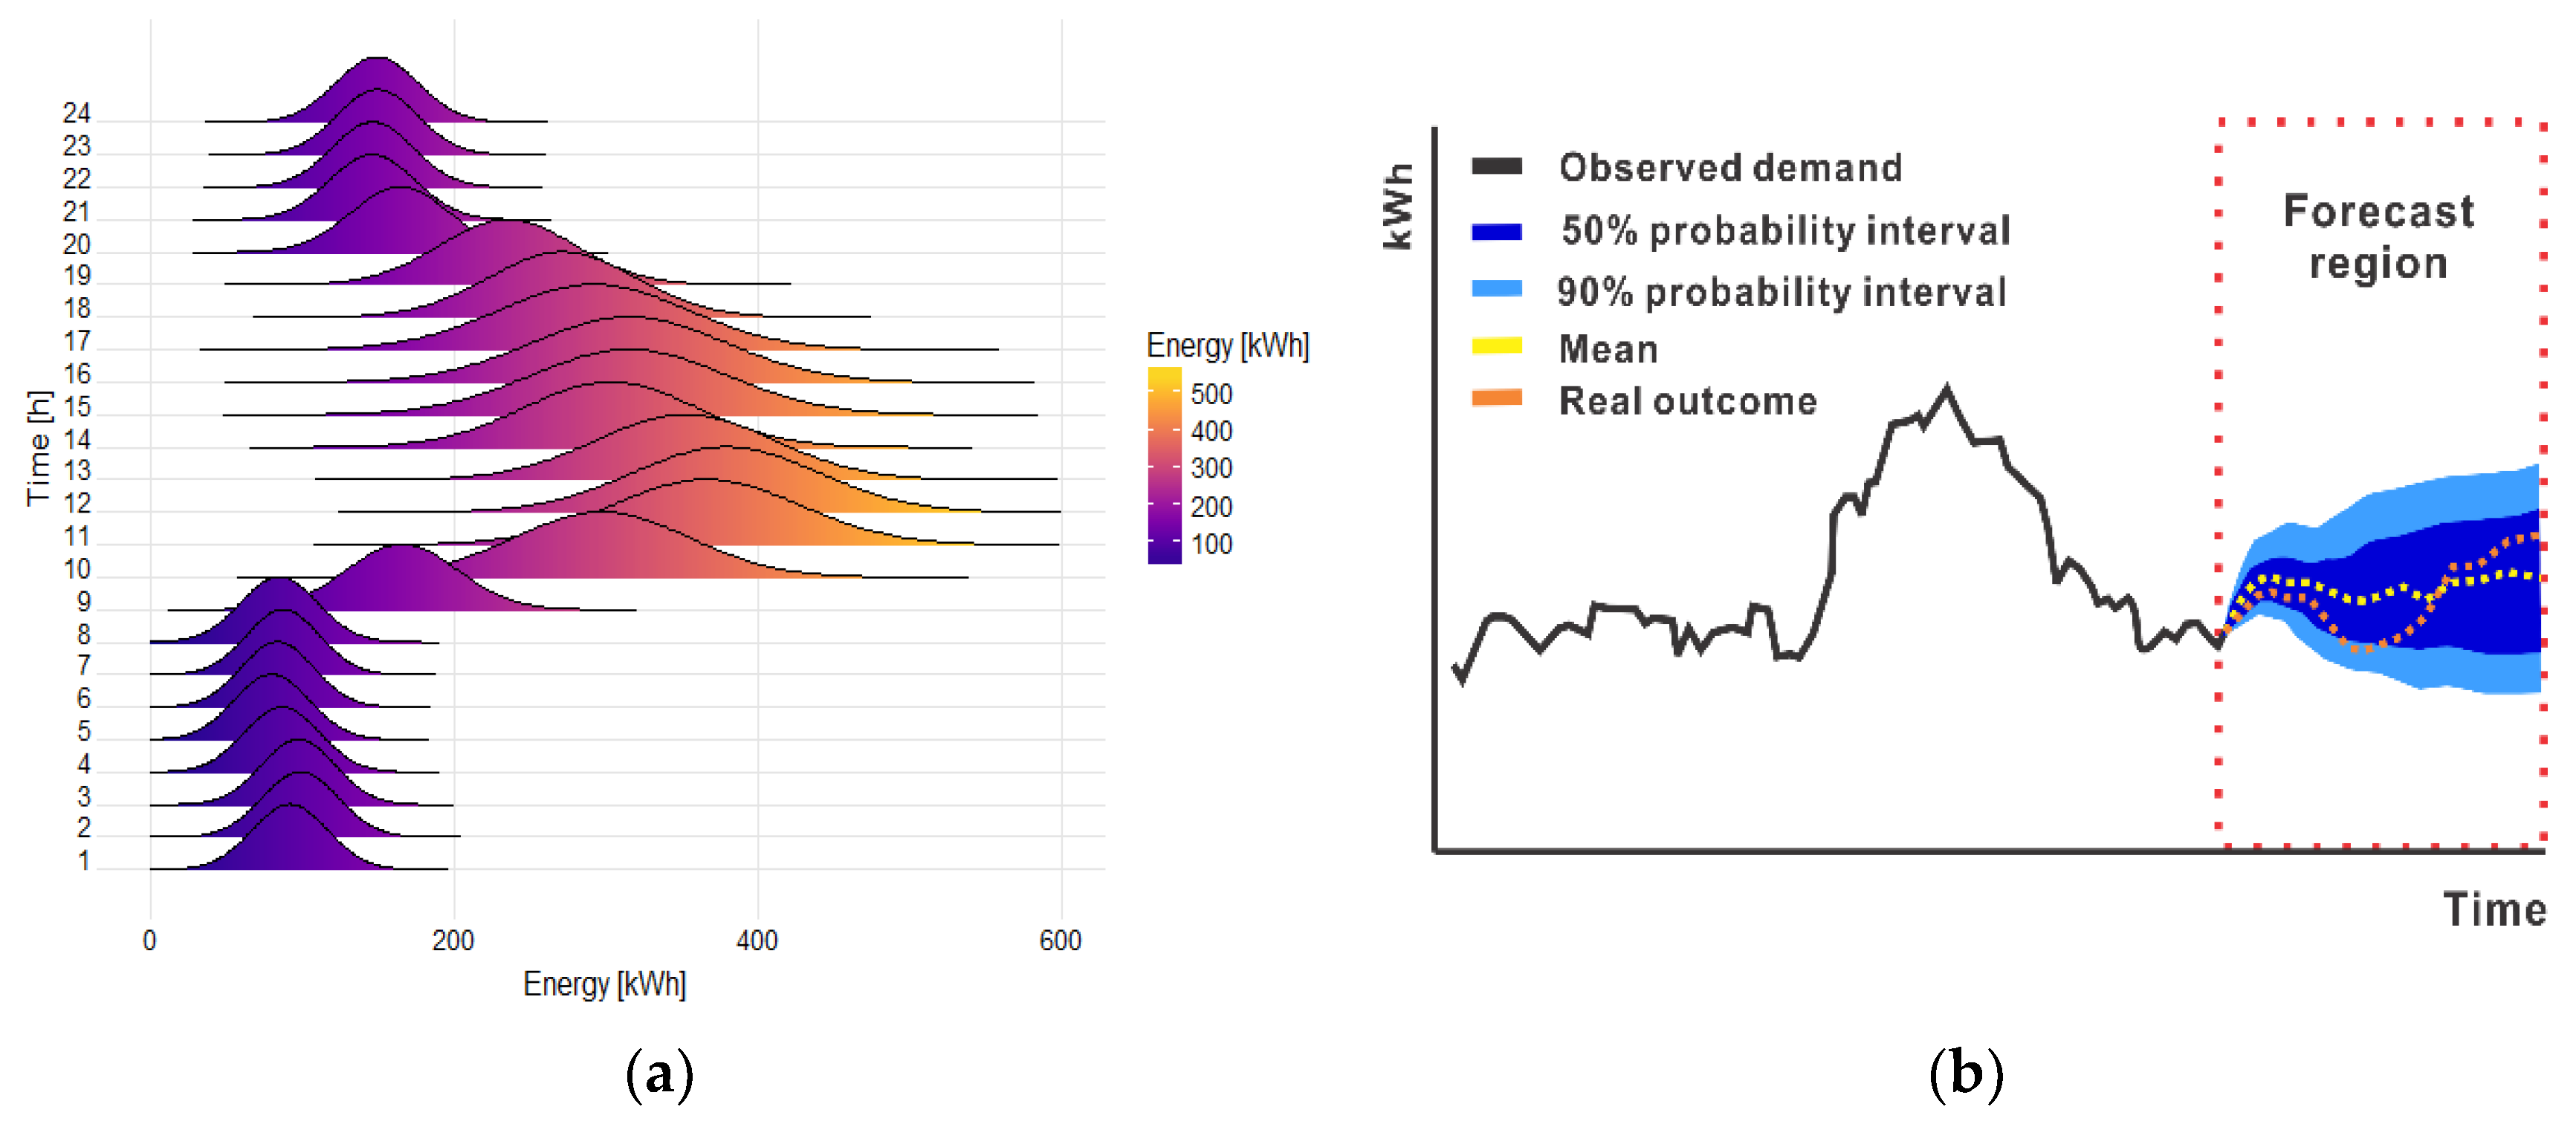
Figure 1a shows demand forecast as a probability distribution in the day horizon, this is denoted as a demand probability distribution (DPD) profile. The most common approach to develop the DPD profile is via probabilistic forecast which can be achieved by using point forecast and assuming the forecast is normal, and the errors are homoscedastic. For each point forecast, a range of ±1.96 standard deviations are padded or percentiles of the distributions of the historical errors of the data are added to the point forecasts. This method is sufficient for a practical implementation of the proposed method. As shown in
Figure 1b, the forecast accuracy on the density forecast degrades progressively at future time instances, this is evident as the confidence interval of the probability distribution widens farther away from the initial forecast. Due to this phenomenon, there is a need to re-forecast to reinstate the confidence of the demand forecast. To solve the problem, the density forecast is performed at set intervals (dynamic intervals) in a day horizon to restore the accuracy of the demand forecast. The dynamic interval is achieved by forecasting demand in real-time at wider intervals concerning the previous forecast during low demand periods and re-forecasting at narrow intervals during high demand periods. Dynamic-interval density forecast (DIDF) is important since it’s able to improve the confidence of forecasted distribution in the next forecast interval.
2.2. Dimensionality Reduction Module
Density forecast provides a demand forecast as a demand distribution, which introduces many possible demand profile scenarios. Given demand distribution samples at 15-min interval in a day horizon with n sample points and a sample in each demand distribution, the number of scenarios that setup introduces is an. If n = 96 and a = 5, there exist 596 possible demand profile scenarios. This number of scenarios is not feasible for computation in any programming environment. A Monte Carlo method can be used to simulate plausible scenarios, but this can be computationally expensive. Time is of the essence in practical applications; therefore the dimension of the data has to be reduced.
We rely on piecewise peak approximation (PPA) as proposed by [
13] to decrease the size of the demand distribution profile with high fidelity. According to [
13], a probability distribution forecast with demand probability distribution (DPD), can be represented as
X = {
d1,
d2,…,
dn} where
di is the demand distribution forecasted at the
i-th instance of time, PPA can decrease the dimension of DPD from
n to
m for a faster computational time. PPA is evaluated by dividing a day horizon into
partitions to follow time-of-use (TOU) price periods, where different periods in a day horizon are assigned different price tag for energy use. Since one objective of DSM is to reduce peak demand below a set peak limit, the likelihood to surpass the peak limit for each distribution in the DPD (peak propensity) is evaluated using (1). The reduction is achieved by approximating all distributions found in each of the
m partitions with the distribution having the maximum peak propensity (probability to exceed the peak limit) as expressed by (2):
where
Pl is the peak limit,
b =
n/
m for each partition,
P(•) is a probability function,
PP(
di) is the peak propensity of the distribution at time
i,
evaluates the infinite norm of its input parameters.
A reduced demand probability distribution (RDPD) is obtained after PPA is performed on DPD, RDPD is represented as , where jr marks the beginning of the (j + 1)-th partition and end of the r-th partition, is the distribution with the maximum peak propensity in the r-th partition, with r = 1,2,…,m. corresponds to points where TOU pricing changes occur. PPA provides convenience in applying the right TOU price to the data during optimization since it conserves the TOU price-change points during dimensionality reduction.
2.3. EV Mobility
To participate in the DSM as an ancillary service, a service agreement to register EV owners is required. To foster coordination and control, EVs are deemed to communicate relevant data to grid operator in real-time. A Vehicle Information System (VIS) managed by the operator is responsible for real-time data collection of EVs’ information such as current position (GPS), EV travelling distance, and expected arrival time. The EVs’ batteries arrival state of charge (SOC) is estimated via EV travelling distance and EV average energy consumption per mile as employed by [
28]. Part of this information is collected manually upon V2G service registration; other information is collected wirelessly at set time intervals. There exist mainly two V2G architectures: the direct architecture and centralised architecture. In the direct V2G architecture the communication and energy contract is private and exists between the EV owner and grid service provider or energy management system (EMS). This type of architecture is prudent for a relatively small-scale EMS such as a Building Energy Management System (BEMS) or a Factory Energy Management System (FEMS) where EVs are parked for long durations during a day. This architecture is simple and faster, making it convenient, flexible and optimized for profit among the stakeholders. On the flip side, the centralised or aggregator-based architecture involves EV owners in a service agreement with aggregators who are the providers of electricity services.
Based on the available information recorded from EVs and EV owners, the service provider determines the available number of PEVs as well as the total committed energy capacity for DSM a day ahead.
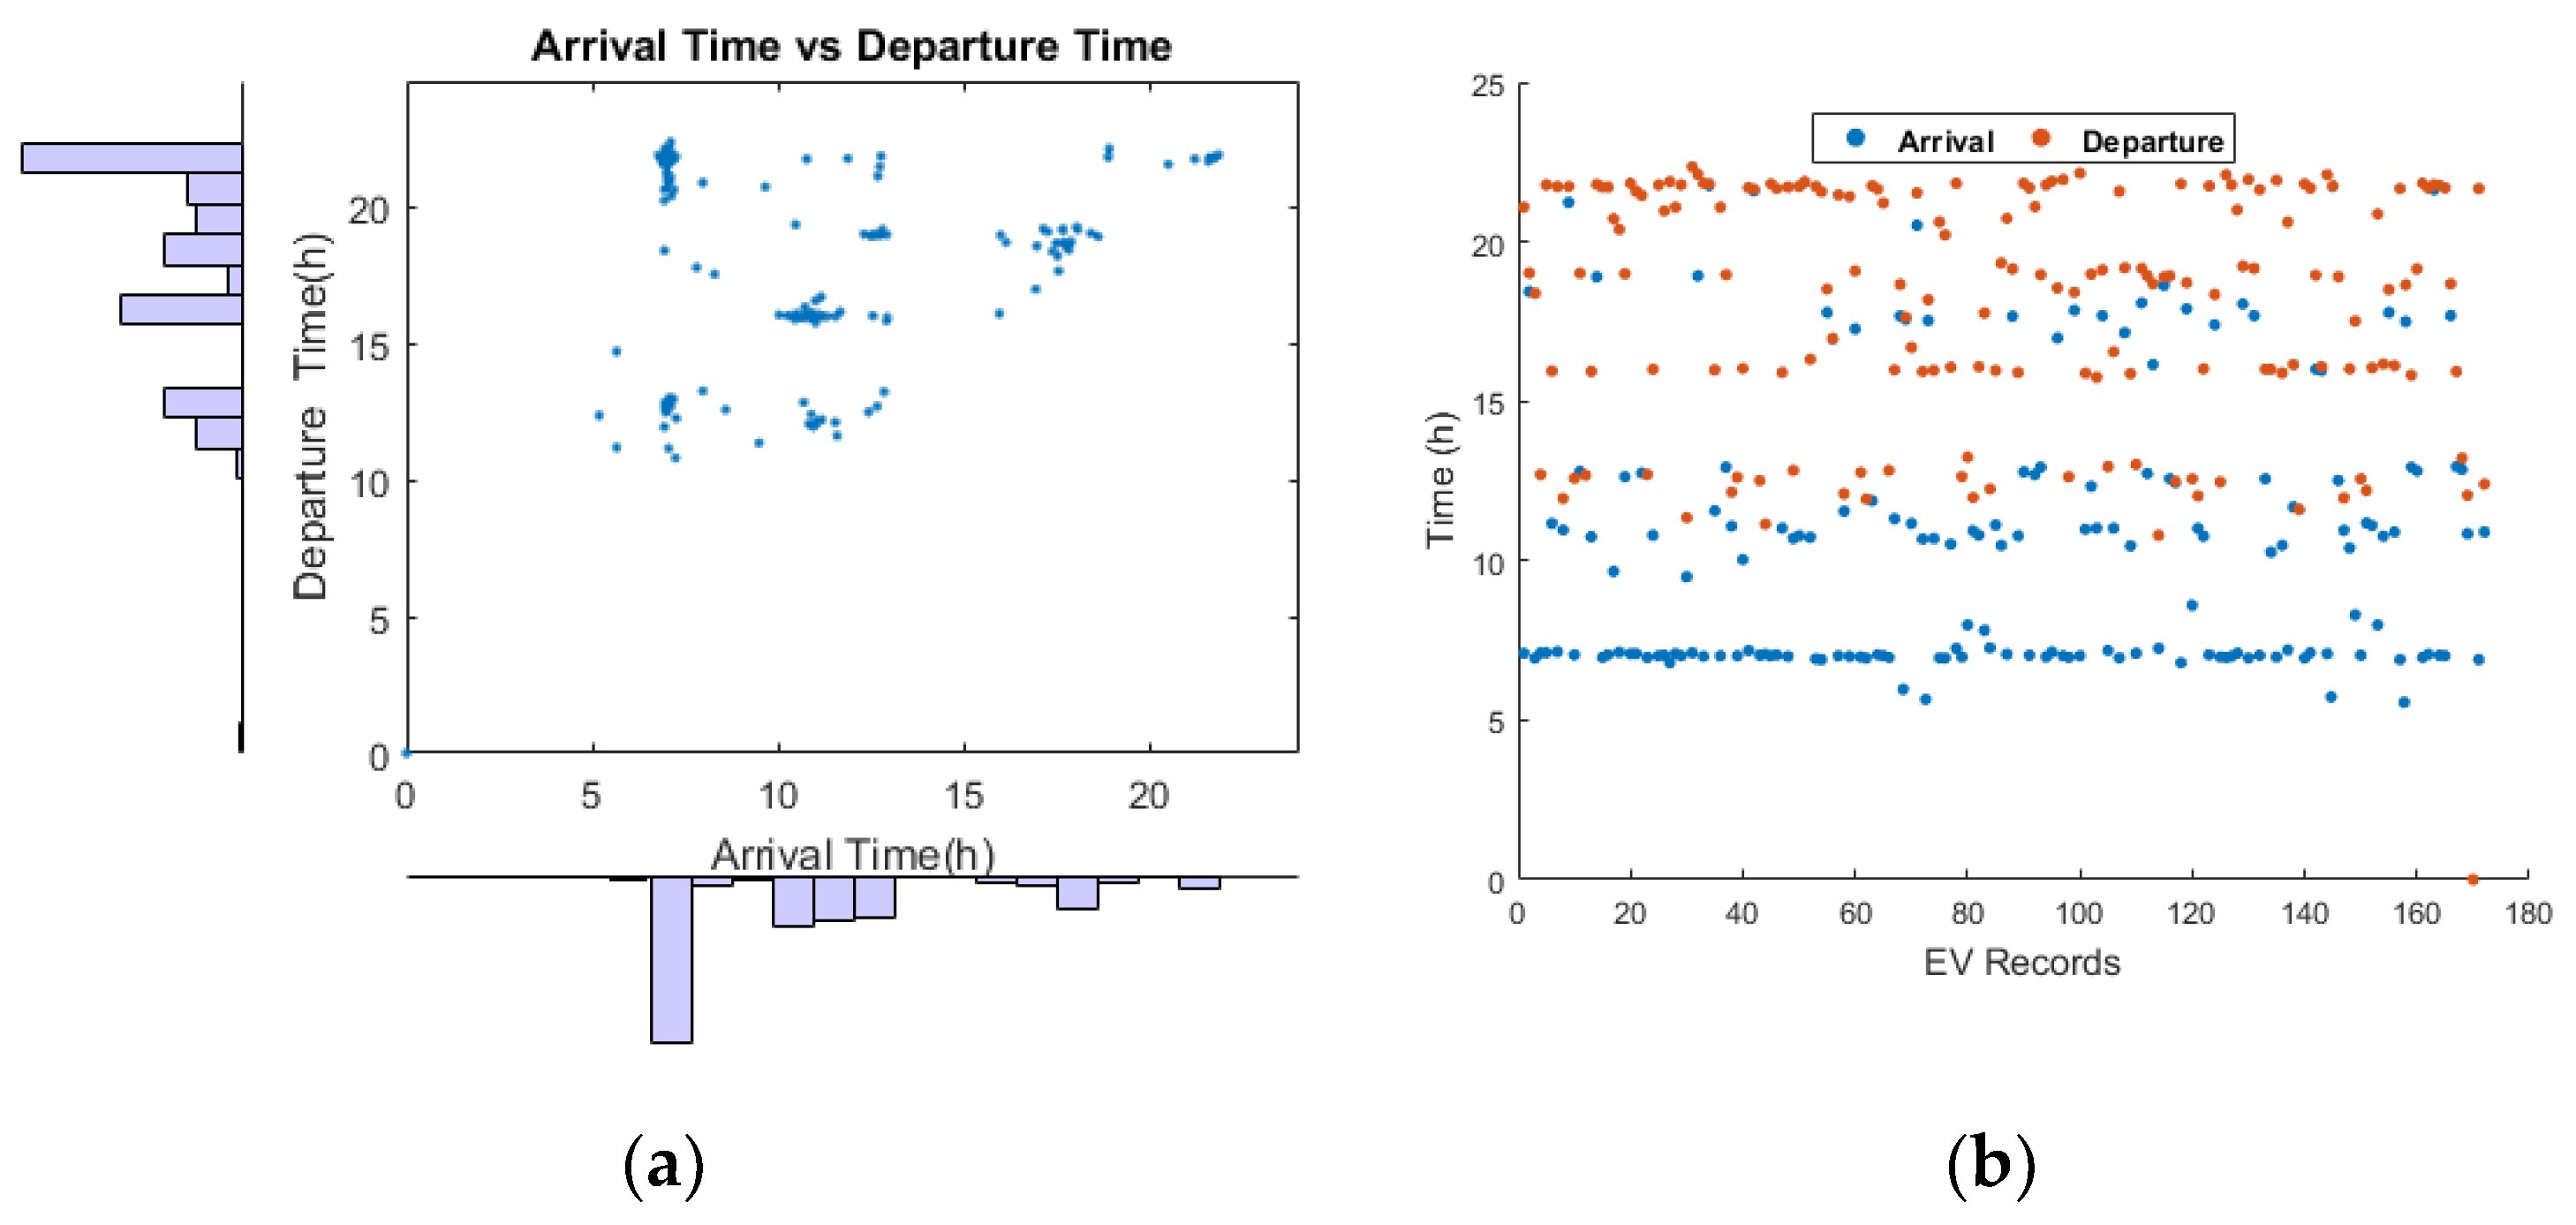
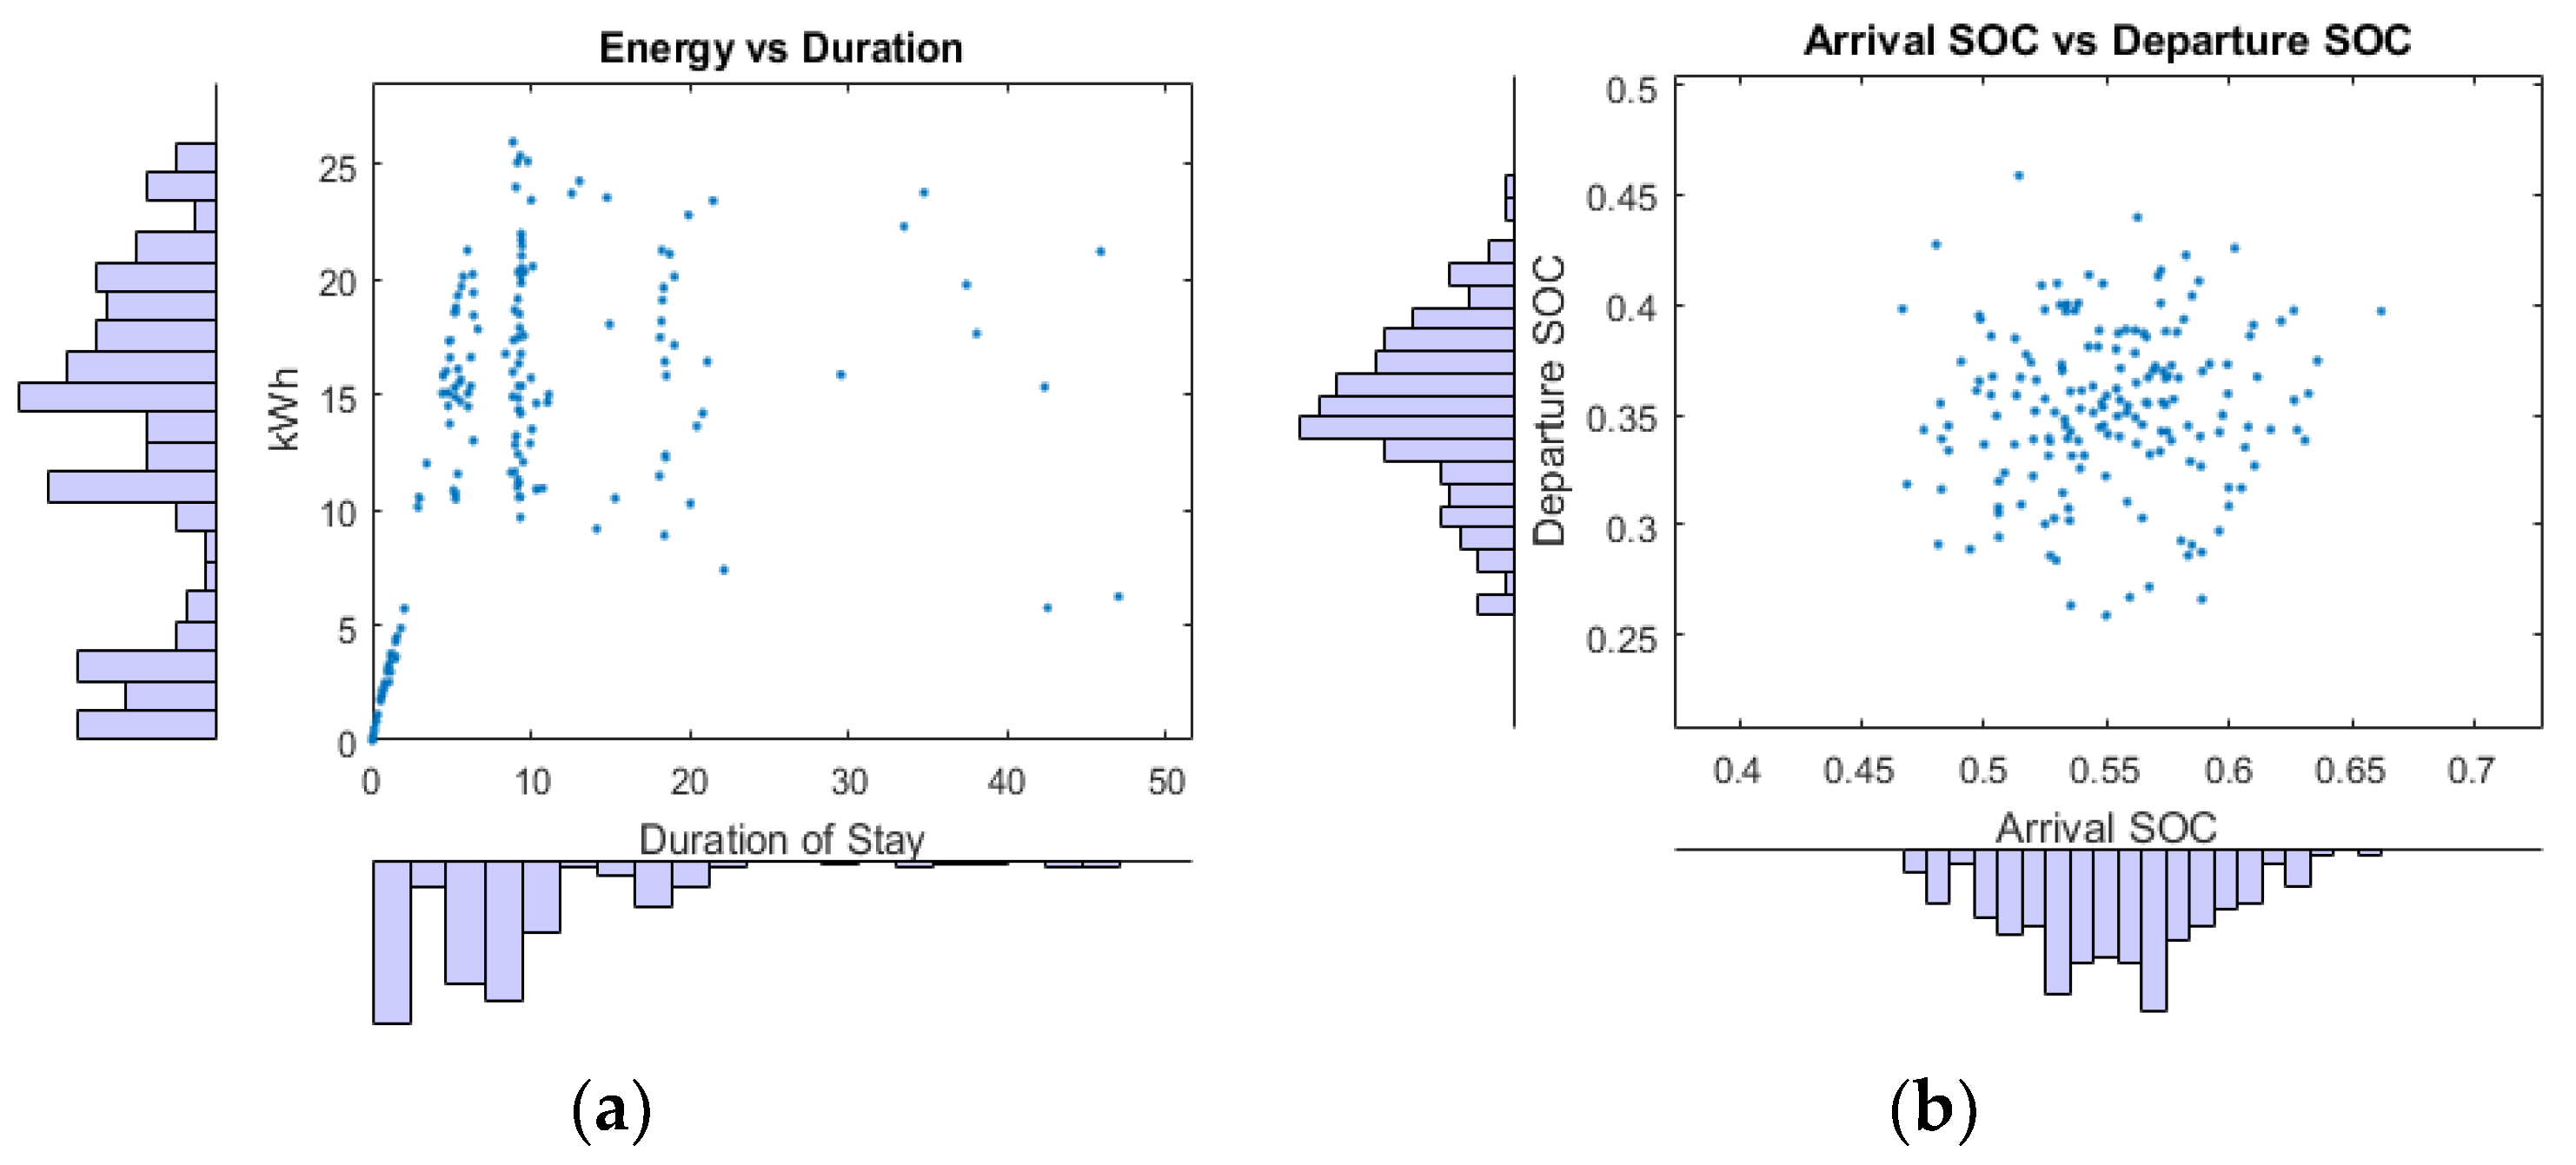
To better model this, the stochastic behaviours of EVs, and a realistic daily travel scenario and charging patterns of EVs are monitored and recorded over some time. From this data, a goodness-of-fit method is used to identify and model to correct the probability distribution of arrival and departure time as well as the distribution of arrival and departure SoC.
Figure 2 and
Figure 3 show the resulting behavioural EV user recorded at the industrial site. The correlations of EV arrival/departure and stay durations/energy committed are shown in
Figure 2a and
Figure 3a, respectively, while a scatter plot of arrival and departure is shown in
Figure 2b.
Figure 3b shows the correlations of EV SoC and arrival and departure SoC distribution.
From
Figure 2a it is clear that the distribution of arrival and departure times do not follow a single distribution. A large section of the EV owners arrive at 7:30 AM on average and depart at 10:00 PM on average. The other section of EV user behaviour is scattered throughout the day with some arriving in the afternoon or evening and departing at night or in the afternoon, respectively. This behaviour is evident in the shift working policy practised at the industrial site and other EV users living close to the charging station.
Other section of the EV users also stay for a short duration as shown in
Figure 3a. These characterise different EV user behaviour which inherently affects the V2G service. As a requirement PEV are prevented from full discharge to allow EVs minimum energy for a trip home.
Based on the real-time data obtained from EVs in conjunction with the ex-post data, a density forecast of arrival and departure time, arrival and departure SoC and duration of stay are obtained at regular intervals. From this information, the expected arrival and departure time expected arrival and departure SoC, available capacity, expected to commit energy and expected the duration of stay is evaluated for the stochastic optimisation.
2.4. Stochastic Optimization
The strength of stochastic programming lies in modelling optimisation problems with uncertainty [
29]; it models systems that are highly nonlinear, high dimensional, or otherwise inappropriate for classical deterministic methods of optimisation. Deterministic optimisation assumes that perfect information is available with known parameters. This information is used to determine the search direction in a deterministic manner at every step of the algorithm.
Problems identified in practical settings invariably contain parameters with random noise which are mostly unknown. For a feasible solution, the algorithm seeks for all possible parameter choices and optimises a given objective when the system parameters are uncertain but are assumed to lie in a range of some possible values. In this study stochastic optimisation seeks to minimise the total cost on average, for demand-side management (DMS), where D is the demand value as a random variable, and x are the decision variables.
3. Problem Formulation
The proposed DMS method has as objective to mitigate peak demand and reduce cost. The method achieves this by considering uncertainties in demand using EVs as a distributed energy storage. To begin with, a day ahead forecast of demand is evaluated using a probabilistic forecast based on historical data. This process produces a profile of probability distribution at each time interval in a day horizon as shown in
Figure 1a. The dimension of the obtained demand probability distribution (DPD) is reduced for faster computation using piecewise peak approximation (PPA) to produce a dimensionally reduce demand profile called reduced demand probability distribution (RDPD). An objective function is formulated using RDPD in conjunction with energy tariff and constraint parameters which seeks to provide a robust PEV operation schedule for a coordinated effect aimed as mitigating peak demand for economic benefit. The objective function is solved using a stochastic optimisation [
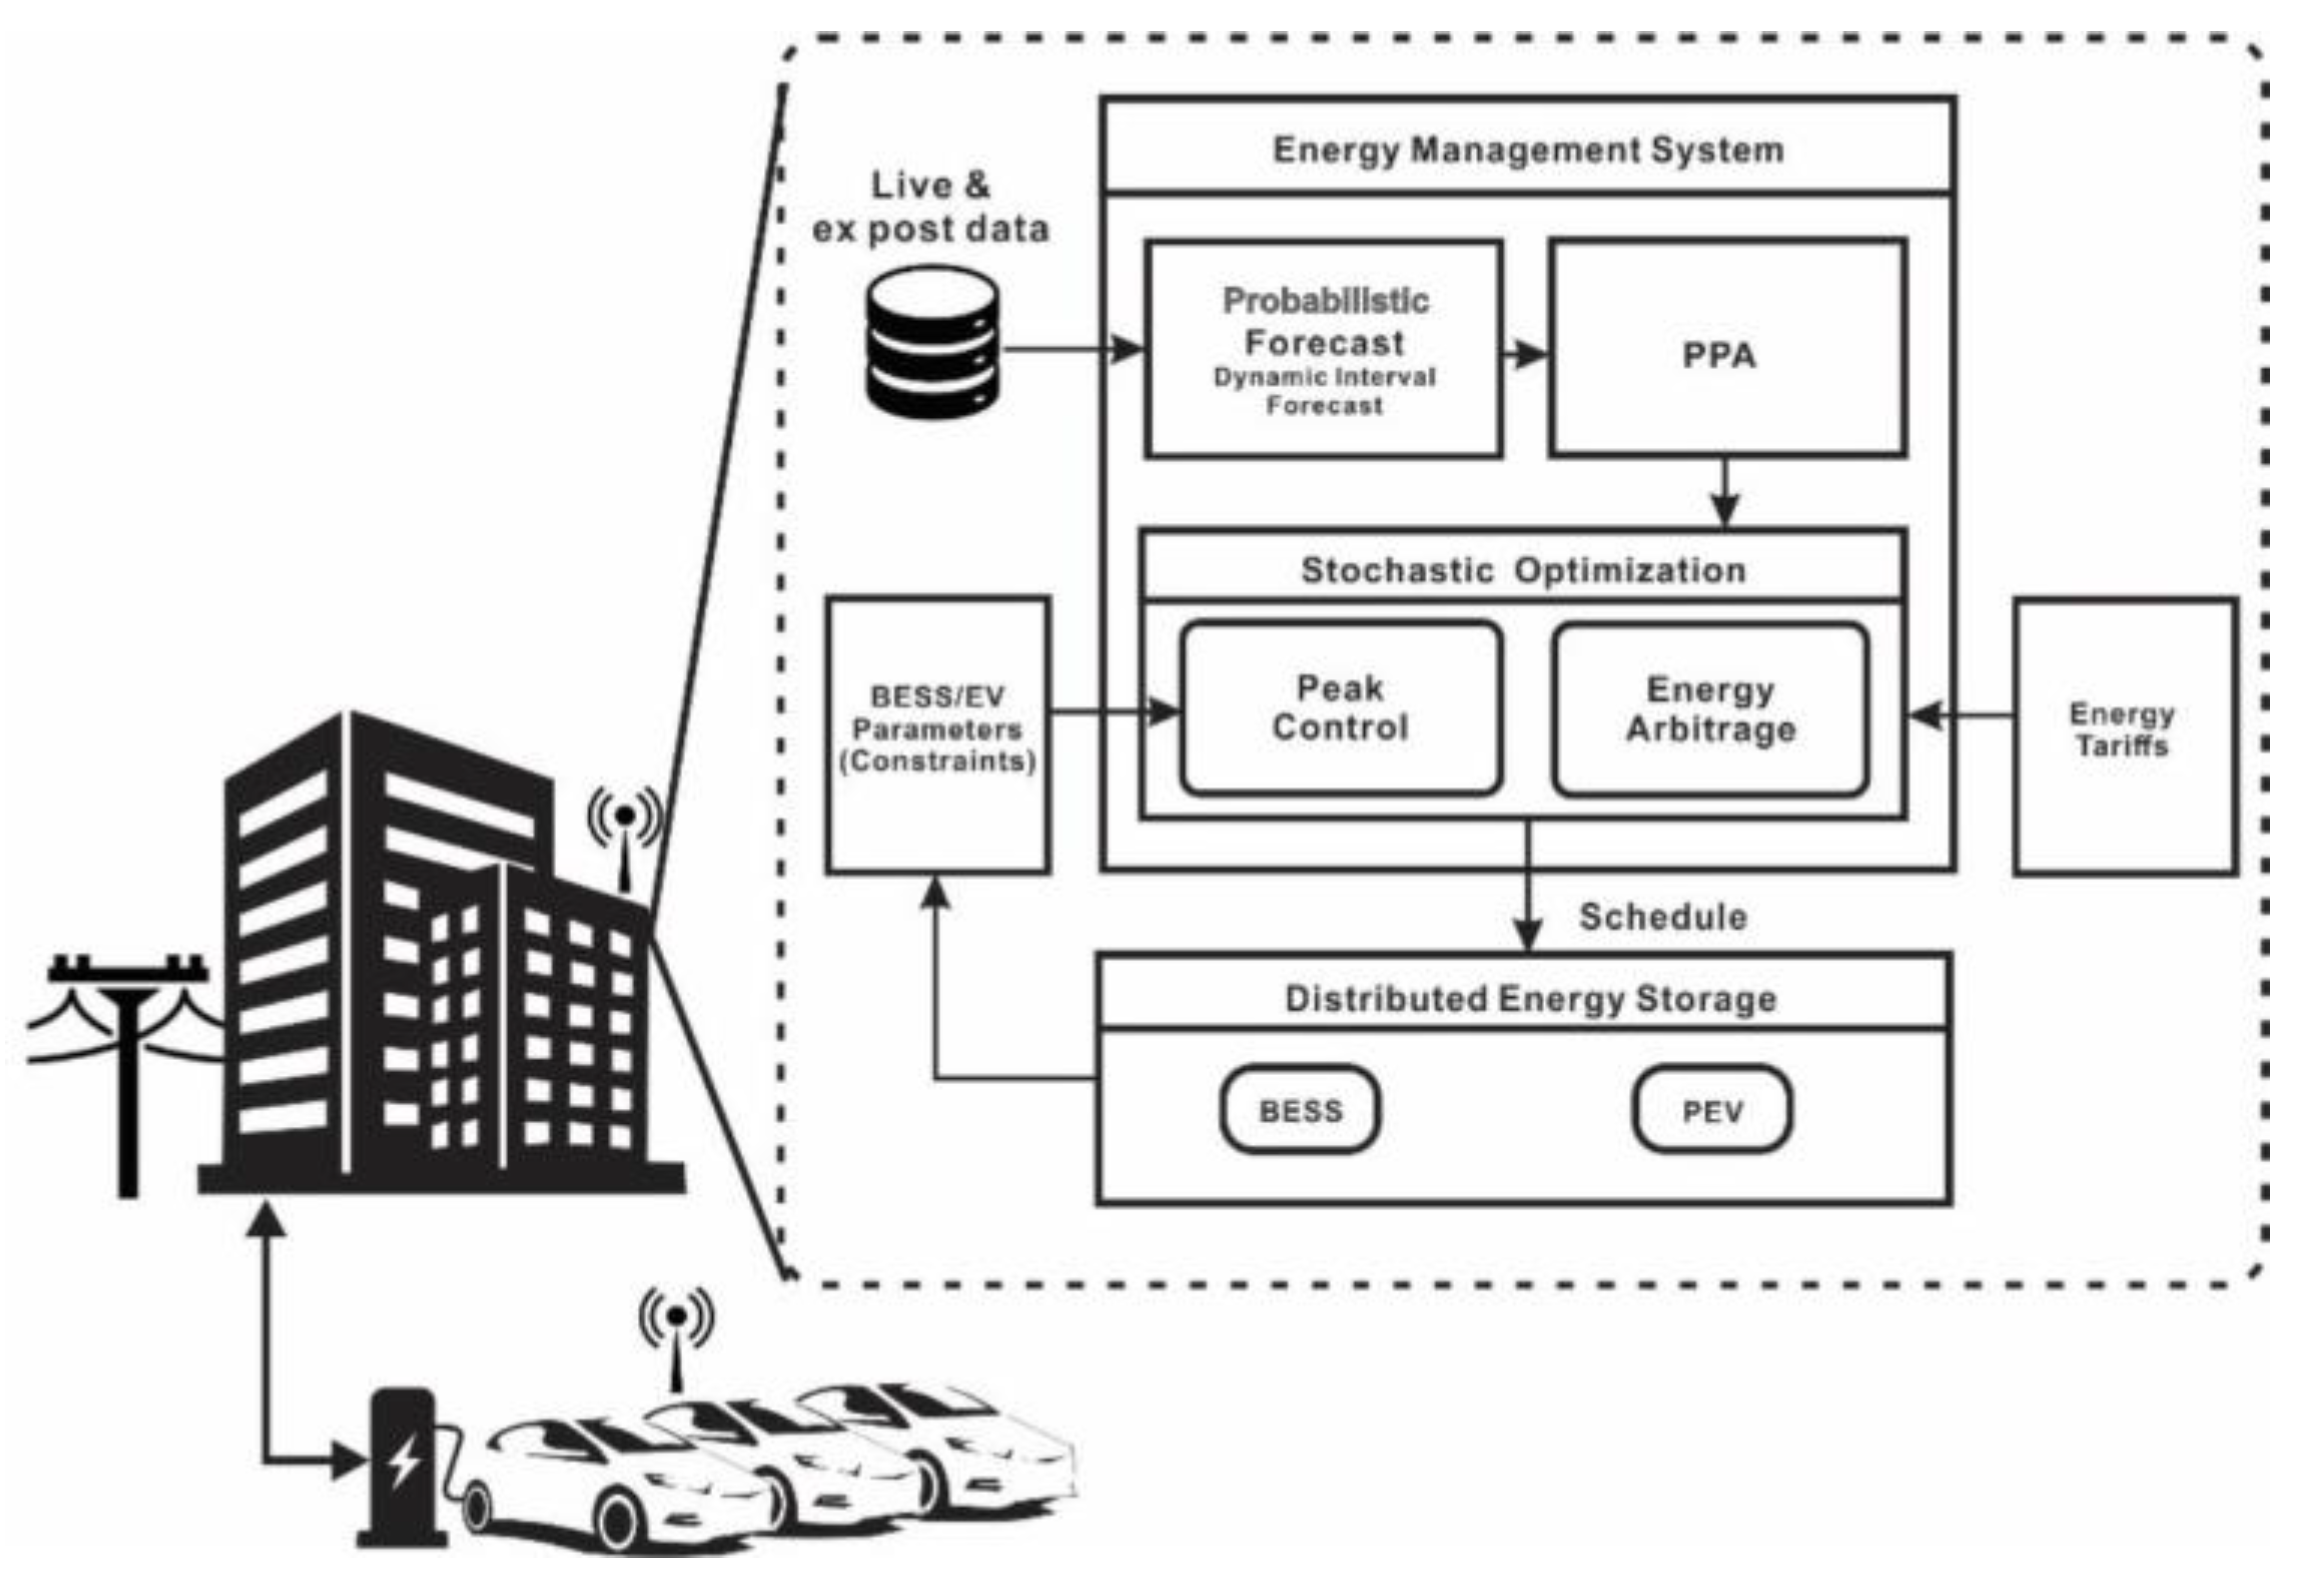
30]. These together form the energy management system.
Figure 4 shows the architecture of the demand side management solution. The objective function of the stochastic optimisation is made up of two parts: Demand (Peak) Cost, which is estimated at the end of every month and Energy Cost (TOU), which is calculated at time instances in a day [
13,
31].
3.1. Energy Cost
The energy cost is evaluated as the total product of energy at each time instance in a day and its corresponding time-of-use (TOU) price. Energy at each time instance comprises PEV charge and discharge power as well as other load demand identified as a demand probability distribution (DPD). For 24-h horizon, the objective function aims at optimising the V2G operation schedule at each time interval. This is the decision variables of the objective function which is represented as , where is the operation schedule for the x-th PEV where x = 1,2,…,s and s is the number of EVs participating in the V2G service.
Considering the nature of DPD the cost is expressed as the product of total expected demand and TOU price; this is evaluated using Equation (3):
where
is the energy charged or discharged by the
i-th PEV at the
r-th instance given by the optimisation algorithm,
gr is the expected demand of the
r-th distribution in RDPD,
is the
r-th distribution in RDPD,
is the TOU energy price at the
r-th instance, and Cost
tou is the total expected cost of energy in a day.
3.2. Demand Cost
Demand cost is evaluated as the product of demand charge and the maximum value of average demand over each 15-min interval in a month (5). From Equations (3) and (4) the demand cost and energy cost have different time units, which need to be unified. The energy cost is evaluated at a unit time interval in a day horizon whereas the demand cost is evaluated monthly. Due to the difference in units, the demand cost is remodelled to comply with that of the energy cost. This is achieved by evaluating demand cost correctly at unit time intervals such that the accumulated demand cost over a month is equal to the monthly demand cost; this is expressed by Equation (9). The unified demand cost is expressed by Equation (10):
where Cost
d is the unified daily demand cost, Cost
D is the monthly demand cost, C
D is demand price for a month,
Cu is the unified demand charge at any instance in a day,
Dmax is maximum demand for a month,
is the demand distribution at an instance
r in RDPD on the
l-th day,
is the maximum demand on the
l-th day,
hlr is the peak demand distribution at instance
r on the
l-th day, with
l = 1,2,…,
q,
q is the number of days in a month,
Pl is the peak demand limit, P(.) is a probability function.
To foster peak demand control, Equation (8) is used to evaluate demand cost. The condition ensures that when the recorded demand at a time instance is greater than the Pl the recorded demand is used to evaluate the demand cost, on the other hand when the recorded demand is less than the Pl, Pl is used to evaluate the demand cost.
3.3. Optimisation
As an objective, the stochastic optimisation seeks to minimise an ensemble of energy cost and demand cost constrained by PEV parameters and operation (13) with a PEV energy schedule and
as a decision variable. For each iteration of the optimisation process, the algorithm provides a candidate BESS charge and discharge schedule. The candidate schedule is used to evaluate the ensemble cost. The process is repeated for each iteration of the design variables until the processes with the least ensemble cost on average are obtained. Equation (15) models the objective function for the stochastic optimisation:
3.4. Constraints
The optimisation is bounded by constraints to enforce a feasible solution. To conform to this, a constraint is imposed to ensure the total discharged energy transferred to the grid by each PEV is less than or equal to the maximum available energy committed by each PEV. This is evaluated by Equation (16). The constraints imposed on the objective function guarantee a feasible solution:
where
is the energy of the
i-th PEV at an instance,
is the maximum available capacity for the
i-th PEV,
is the expected arrival SoC of the
i-th PEV,
is the SOC distribution forecasted for the
i-th PEV,
is the maximum SOC of the
i-th PEV,
is the final or minimum allowable SoC to enable a trip by EV owners back to their destination after V2G service,
is the storage capacity of the
i-th PEV,
Rtrg is the distance to EV owners to his destination after V2G service to the,
Ri is the nominal distance of the
i-th PEV,
is the energy required to fully charge the
i-th PEV,
is the rated power of the
i-th PEV,
is the total time or duration to fully charge PEV at rated power.
Another constraint limits the amount of discharged energy transferred to the grid, this is dictated by the onboard charger and is evaluated by Equation (21):
where Δ
t is the time interval between two operating schedules. For an hour interval Δ
t = 1.
The objective function is again constrained by Equation (23) to enforce that the departing state of charge (SOC) of each PEV at departing time should be the same as that of the target SOC for extra trips after V2G service. During the V2G service, the SOC of each PEV should be in the range of maximum SOC and minimum SOC expressed by Equation (24):
where
SoCi.r is the SOC at instance
r of the
i-th PEV;
and
are the departure and final SOC of the
i-th PEV, respectively,
and
are the minimum and maximum SOC of the
i-th PEV, respectively,
effch and
effdch are the charge and discharge efficiency, respectively.
3.5. EV Penetration Analysis
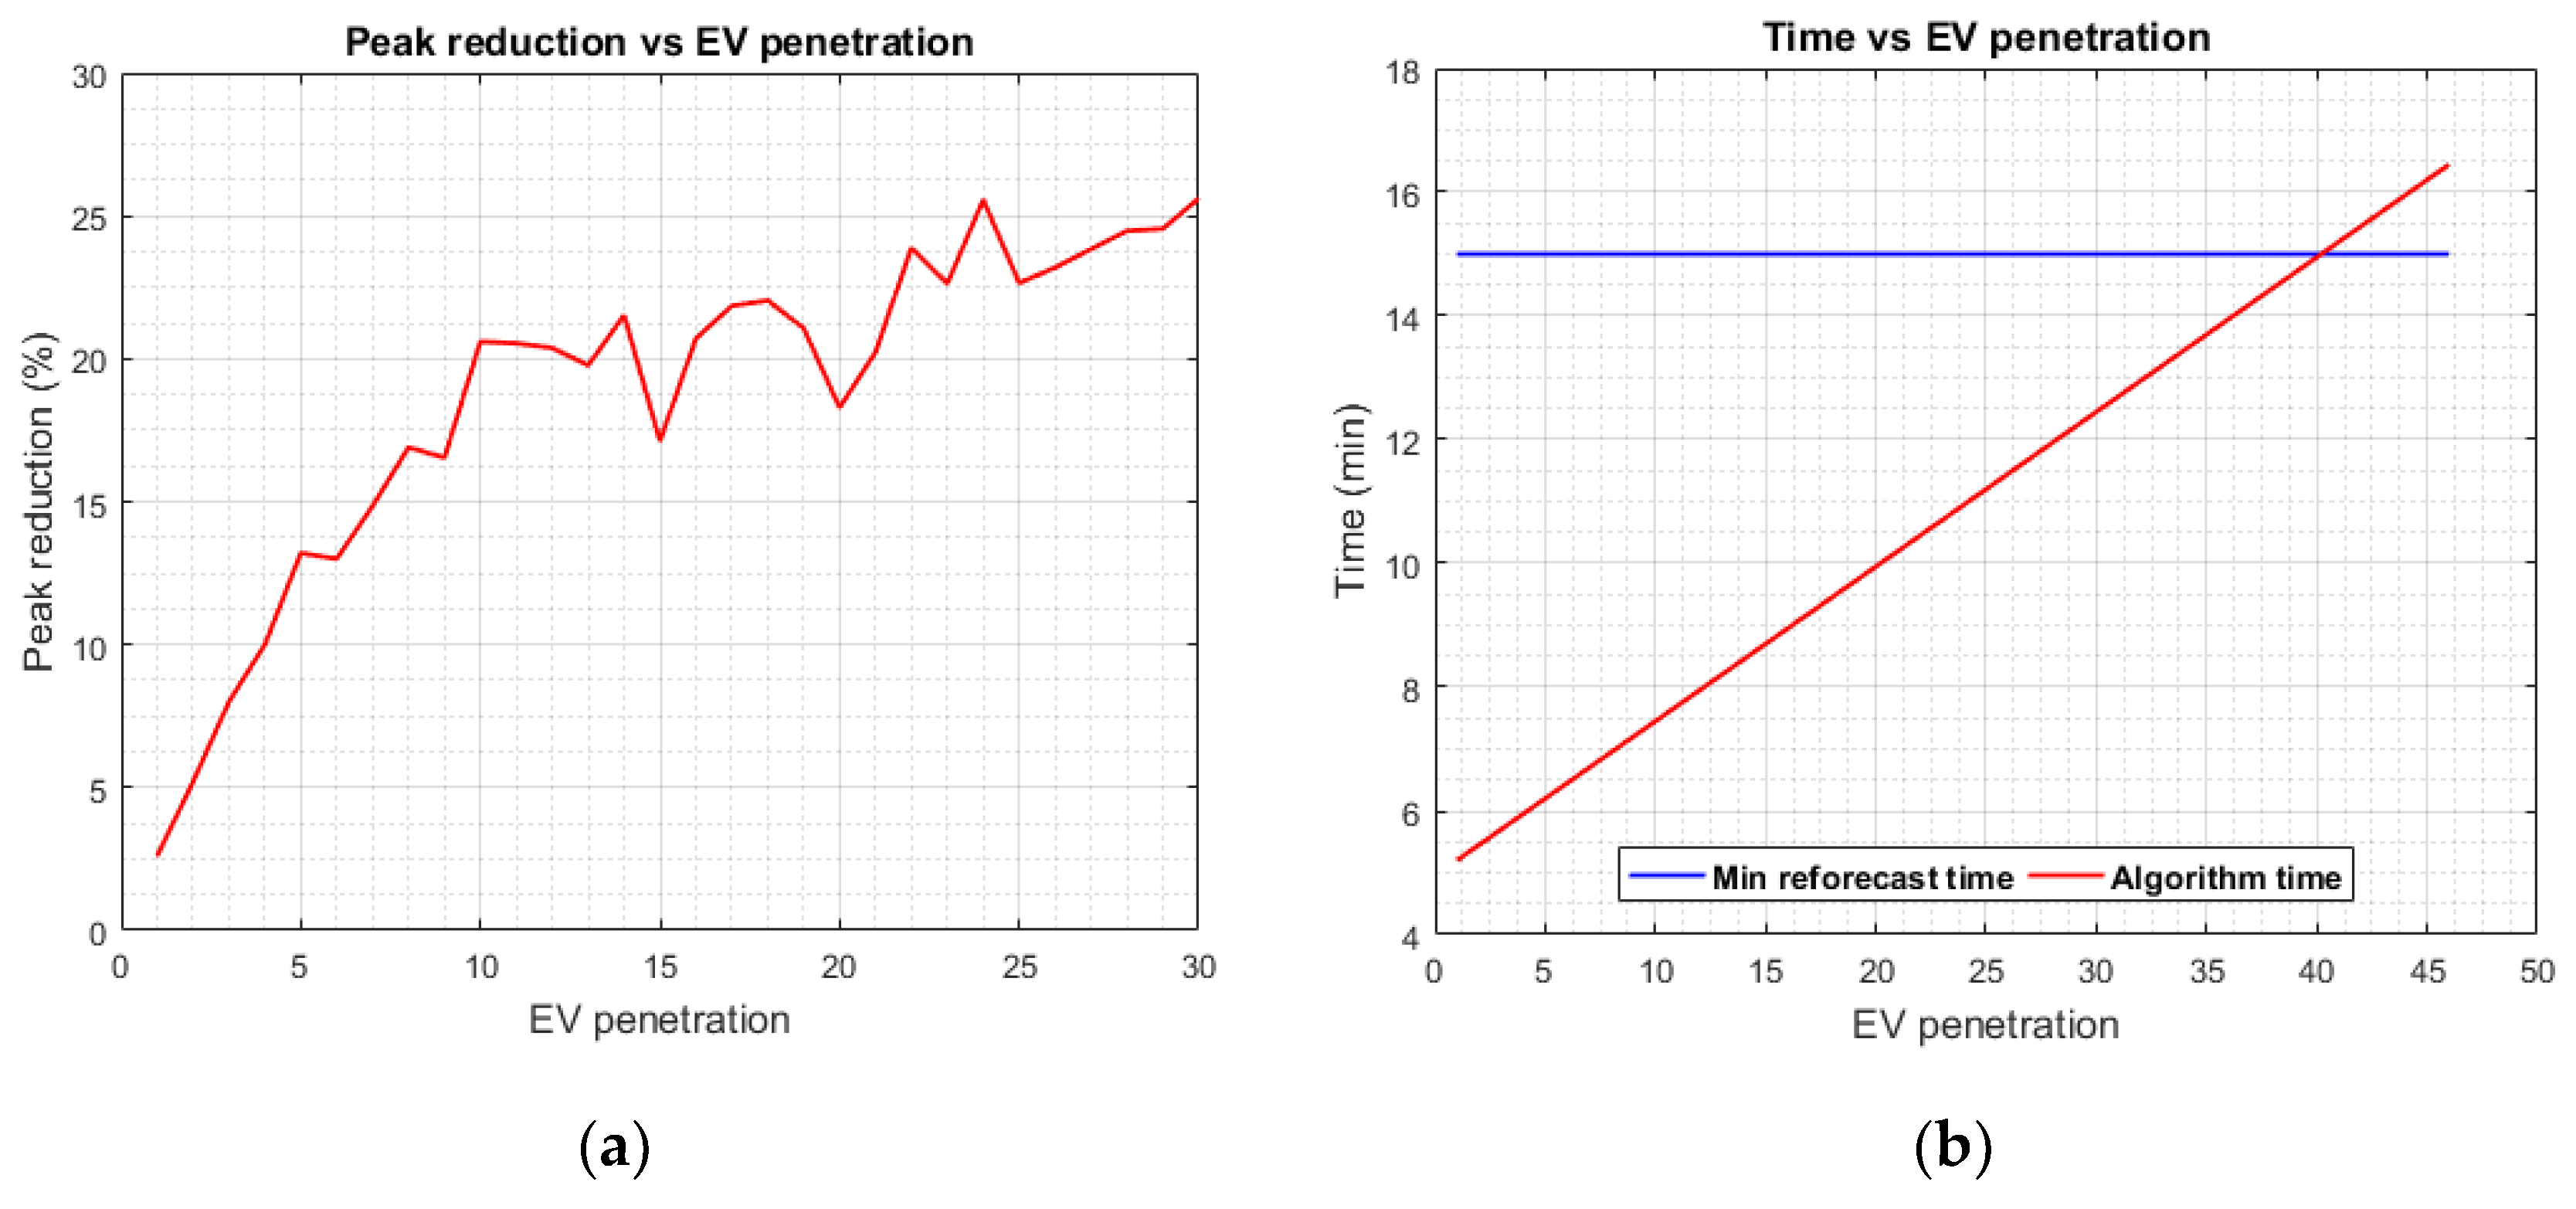
Uncontrolled charge and discharge of EVs due to their high penetration could degrade the power quality of the grid. Low levels of EV penetration without a control scheme could lead to peak demand violation, forcing the need for reserve capacity to mitigate peaks. At an increasing level of EV penetration, the proposed DSM algorithms can control the EVs effectively depending on the peak limit. As seen in
Figure 5a, as the number of PEVs increases the energy capacity for DSM increases and the better the peak reduction. A zero-penetration level depicts a no show of the EVs for V2G; as such, there is no peak reduction. Peak reduction only occurs when there are PEVs available for DSM and the extent of reduction depends on the energy capacity that the PEVs contribute. Due to the dynamic reforecasting and optimisation algorithm, a small change in the arrival or departure time of EVs which contribute to the available energy capacity is addressed by the optimisation algorithm in the next reforecasting interval. This is done by rescheduling the available PEVs for peak control. At low EV penetration level, the algorithm charges available PEVs in the grid during the off-peak period to be discharged later for peak control. In order not to violate the peak limit at high penetration levels the algorithms charge less, and the peak demand control depends only on arrival SoC of the PEVs. As shown in
Figure 5a, after a penetration level of 11 PEVs, the amount of peak reduction begins to settle.
One drawback of a high penetration level of PEVs is the time complexity of the algorithm. The minimum time interval for a re-forecast during dynamic-interval density forecast (DIDF) is 15 min, at the end of this interval, the algorithm provides the energy schedule of PEVs for the next time horizon. From
Figure 5b it is shown that an increase in penetration causes an increase in the time complexity of the algorithm. Therefore, as seen in
Figure 5b, the penetration capacity for the algorithm is 40 PEVs.
3.6. EV Clustering
As discussed in the previous section, high penetration levels of EV though advantageous can overwhelm the optimisation algorithm. In real-time solutions time is of the essence and to enable the scheduling algorithm’s response time scale or be mutually exclusive to the high population of EVs, a clustering algorithm is employed to reduce the EV population into groups with similar behaviour.
Unsupervised machine learning algorithm such as K-means algorithm [
26,
32] is employed to partition EV data into similar groups based on EV behaviour parameters such as arrival and departure time. This EV behaviour parameters are represented as a tuple for clustering (27).
where
is the tuple data for each participating EV,
tarv and
tdpt are the arrival and departure time, respectively.
K-means clustering aims to partition a group of data observations into k clusters with each observation belonging to a cluster, as such the algorithm require the number of possible clusters be provided forehand. Nevertheless, the optimal clusters k for given observations can be determined using by using methods such as cross-validation, elbow method, average silhouette method, and Gap statistic method. A combination of all these indices are used, and the majority rule is applied to the number of clusters k with the highest frequency among all indices [
33].
Dynamic time wrapping for K-means is used as a measure of similarity measure instead of Euclidean measure which is much less susceptible to pessimistic similarity measurements [
32]. With this update, the objective function of the optimisation algorithm (4) becomes:
where
k is the optimal number of clusters,
is the total energy charged or discharged by the
k-th PEV cluster at the
r-th time instance given by the optimisation algorithm.
4. Case Study
The demand profile spanning 2016 and 2017 of an industrial site in South Korea is used as a case study. The data is partitioned into two, where 2016 data is used to start the dynamic density forecast for 2017, and the 2017 observed data is used for testing.
The study considers a total of 10 PEVs under the direct V2G architecture as it is suitable for an industrial setting. From the algorithm, the PEVs contribute their capacity together to solve peak demand, with this scheme PEV are charged and discharged via an onboard charger capable of bidirectional power transfer.
DSM for a day is achieved by performing dynamic-interval density forecast (DIDF) at an hour interval, this is increased to 2 h in the next interval than to 3 h etc., during off-peak periods. This process is repeated, with the number of re-forecast intervals depending on the size of the off-peak period. For peak periods DIDF is performed at a constant 15 min interval. The re-forecast interval is narrow within this period because it’s a critical period. The obtained forecast is dimensionally reduced using piecewise peak approximation (PPA) for a faster computational time. The stochastic optimisation is implemented using particle-swarm optimisation (PSO) [
34] with a swarm size of 1000, inertia of 0.6, and desired accuracy of
. The DSM algorithm is simulated for results with probability distribution (RDPD) as input to the stochastic optimisation in conjunction with parameters in
Table 1, EV and hourly TOU tariff from Korea Electric Power Corporation (KEPCO) [
35].
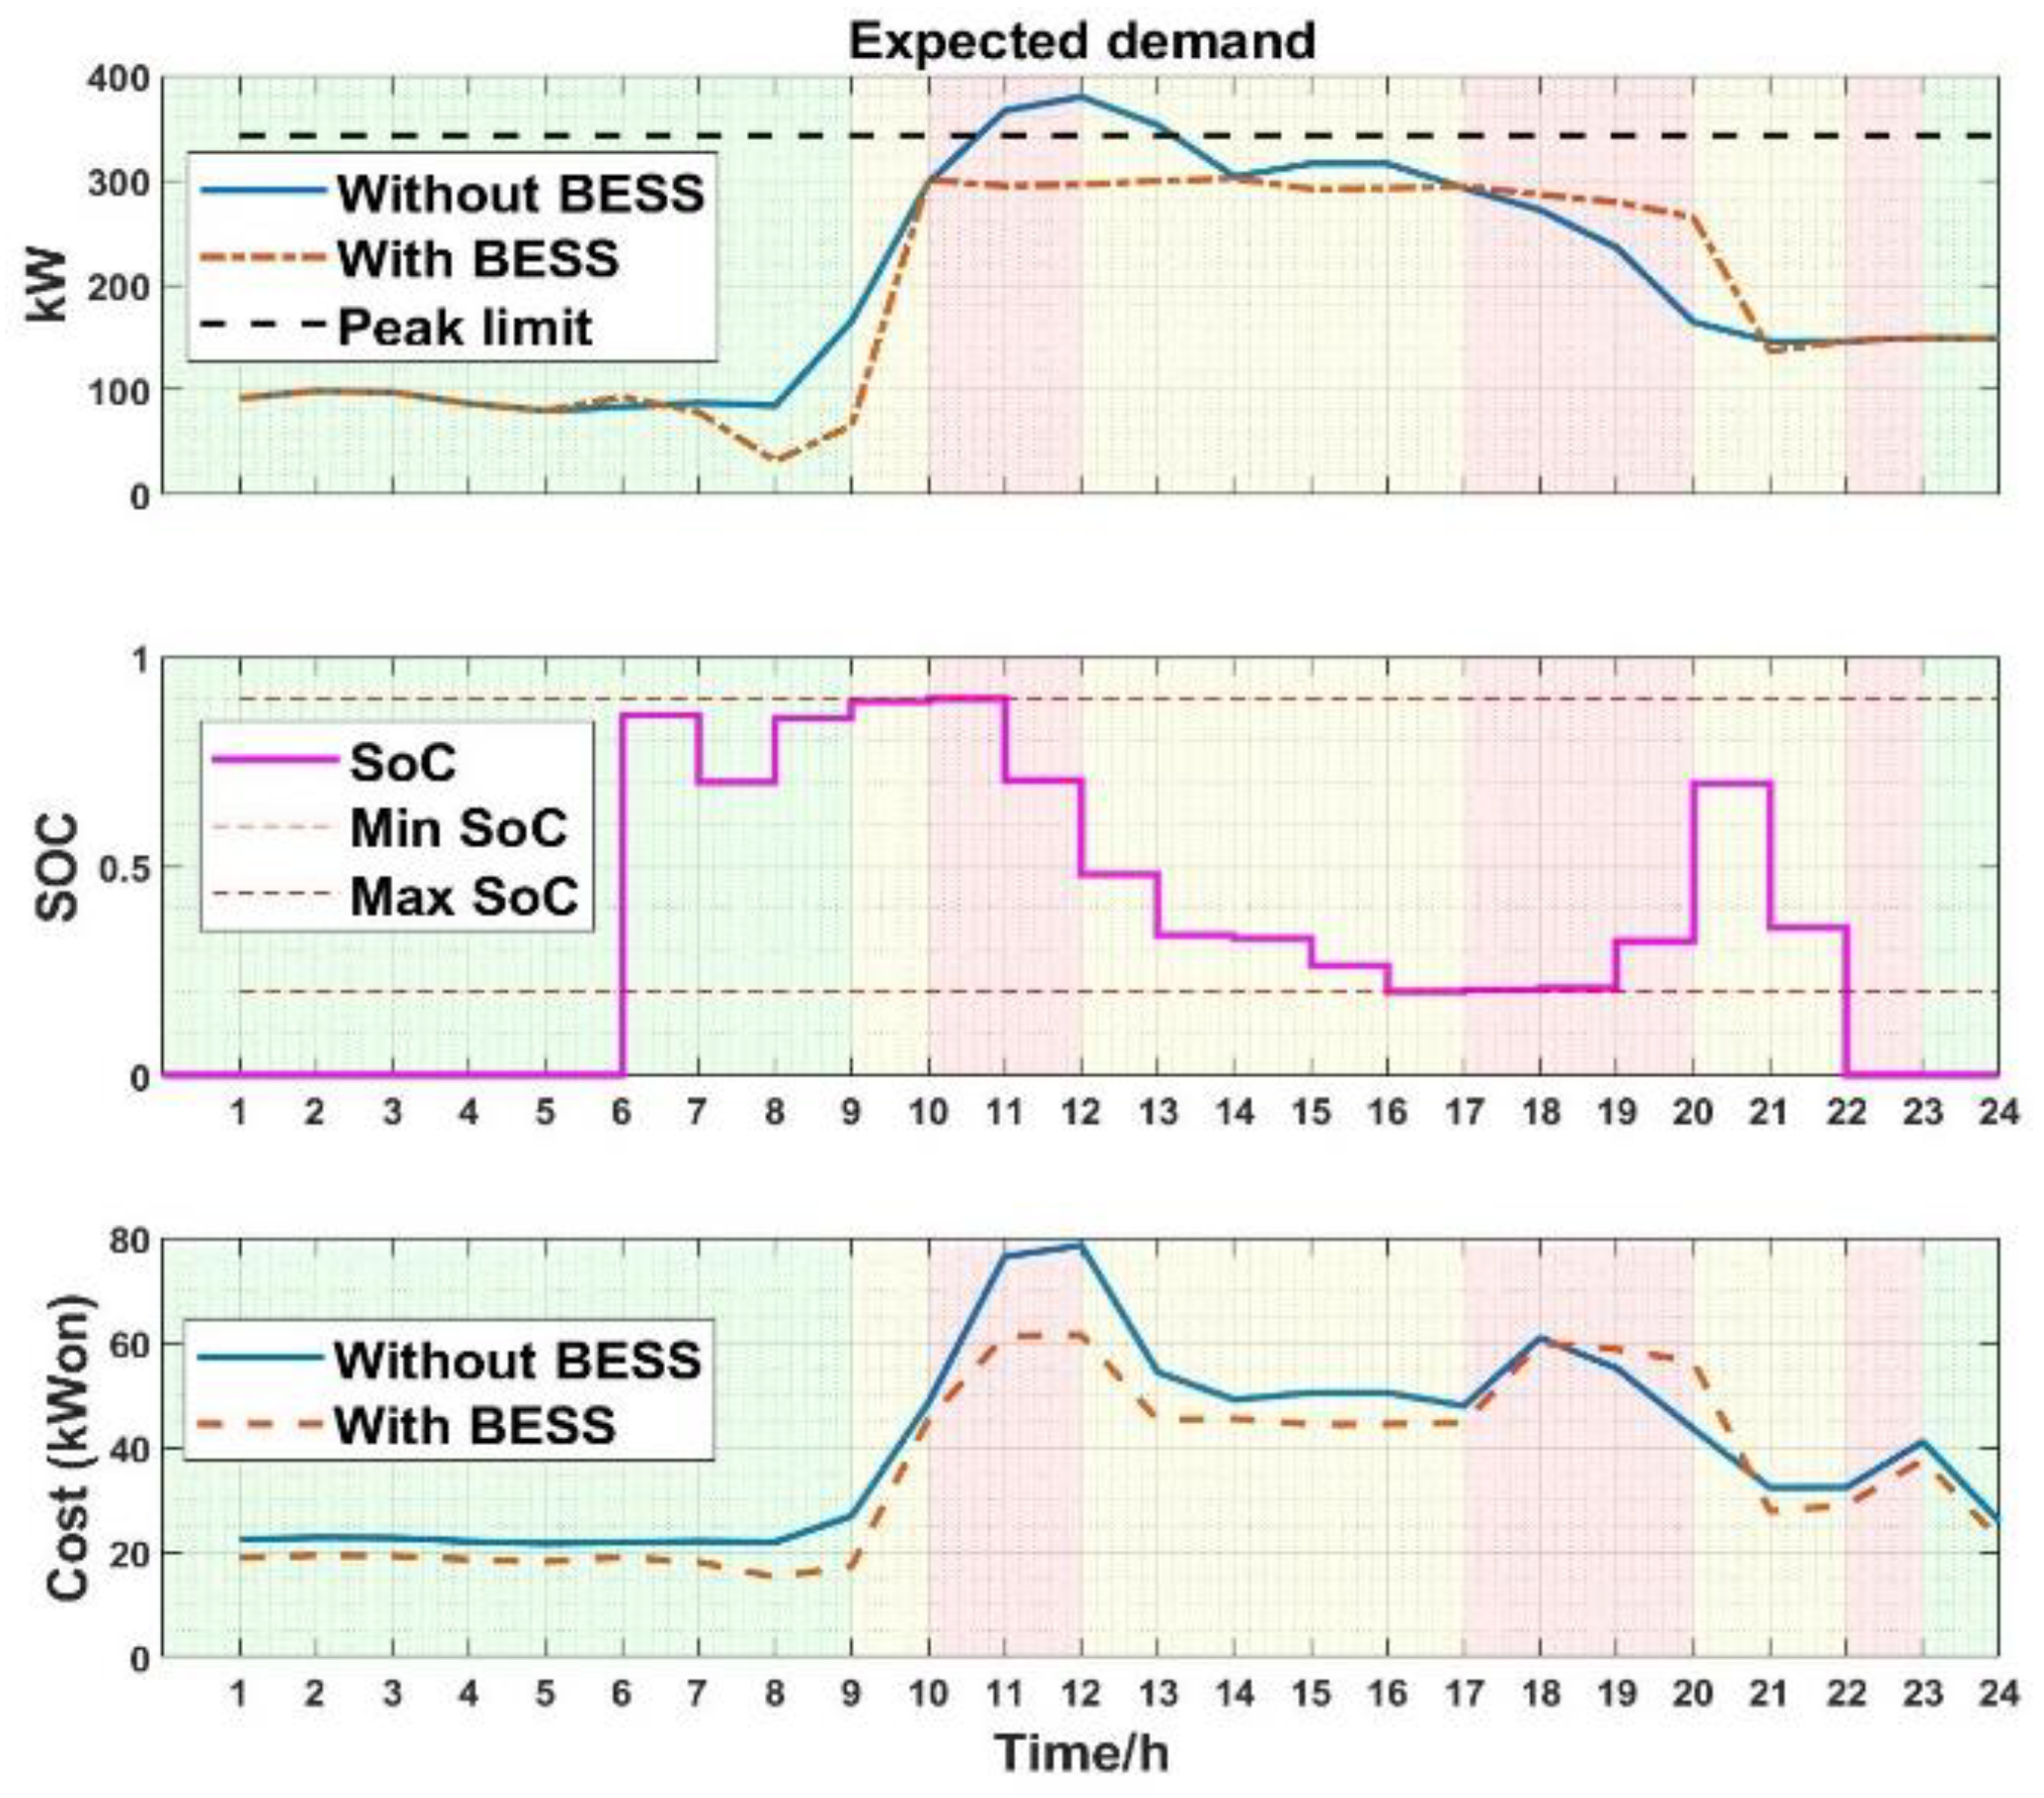
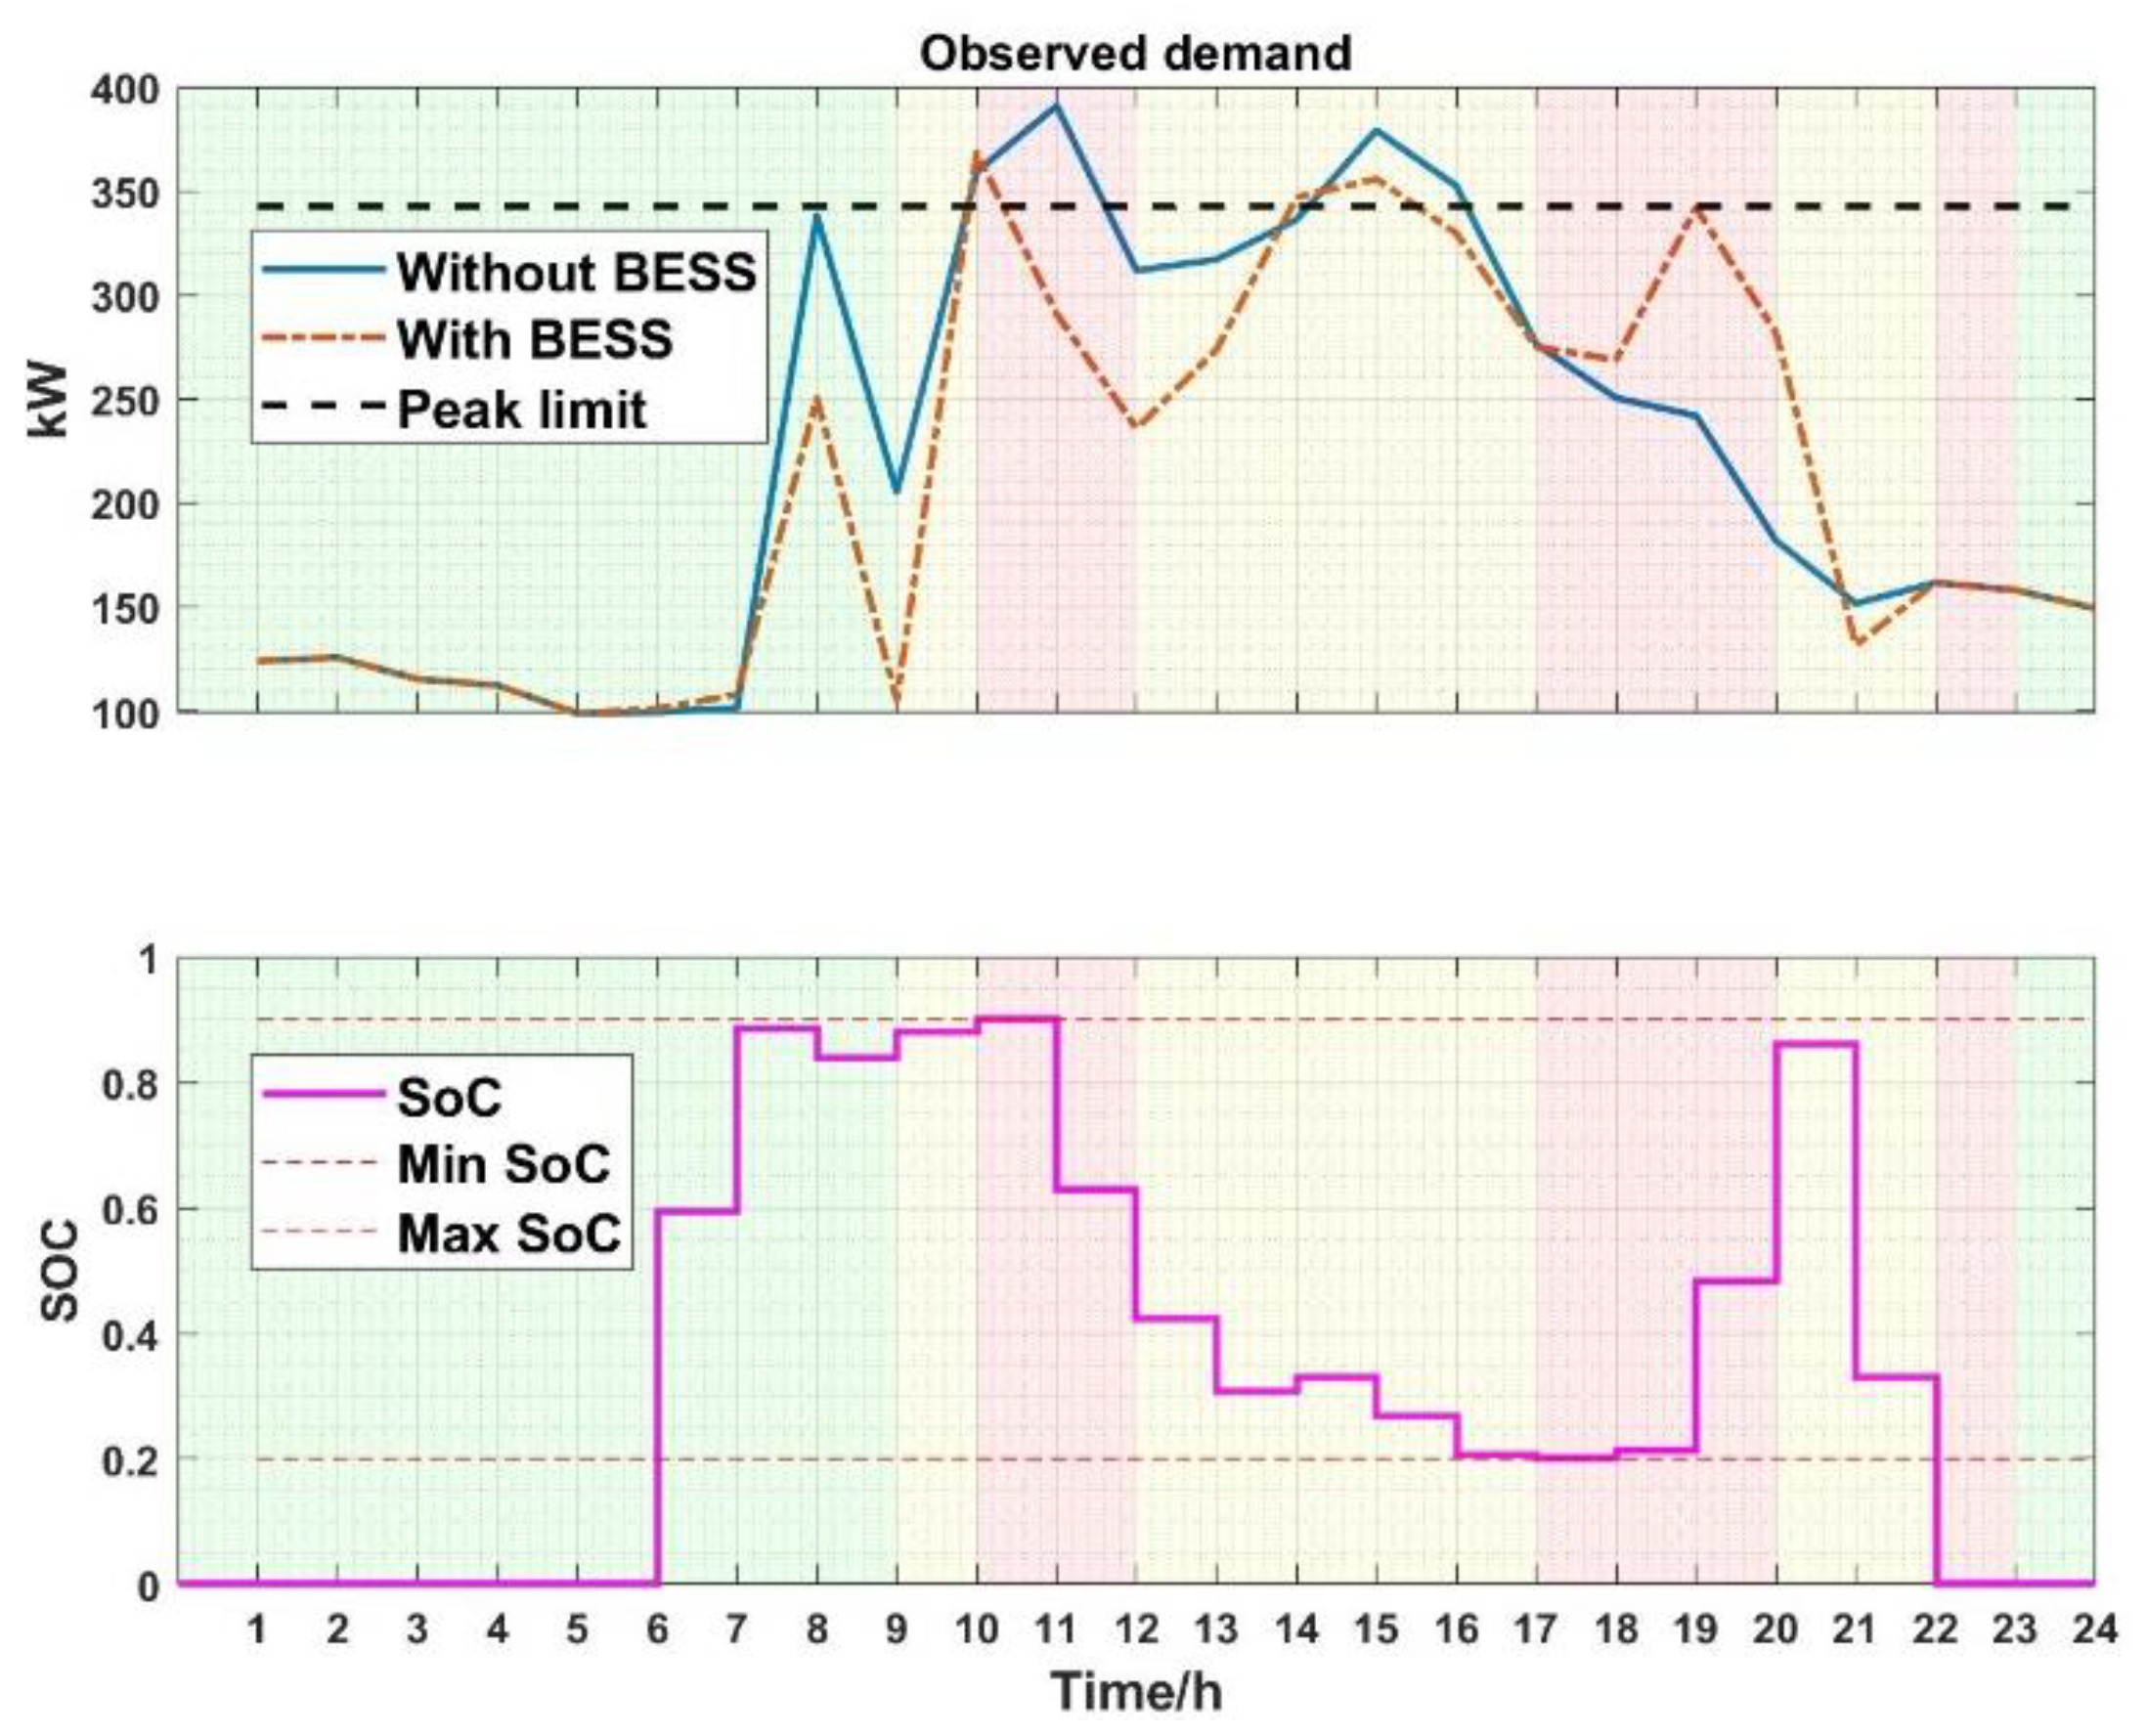
Based on the tariff data, energy usage at different periods in a day horizon attract different charges. The changes are different depending on the time of day, the day of the week and season. Form the result graphs, periods marked in red are potential peak periods which attract the highest charge per energy usage, periods marked in yellow are mid-peak periods attracting a medium charge and periods marked in green are off-peak periods having the lowest charge per energy use. Off-peak periods are mostly in the morning whereas peak and mid-peak periods spun a period of late morning to evening as illustrated in
Figure 6.
Table 1 details the design parameters for the simulation. The contract demand of the industrial site guides the demand use, peak demand limit for case study stems from the sites previous year’s peak demand. From
Table 1, the number of samples in distribution,
a and the partitions of PPA
m are adequate values derived from experiment considering response time and accuracy. Battery efficiency, maximum and minimum SOC are chosen to maximise the battery life cycle. MATLAB 2016 is used as a programming environment on an Intel i5 PC with 16 GB of RAM. It takes about 5 min on average, to complete a single run of the algorithm.
The EV data is clustered into 10 optimal groups of PEVs participating in V2G service. The PEVs commit a total capacity of 411 kWh, in addition to this, past and live data are used to model uncertainties. From
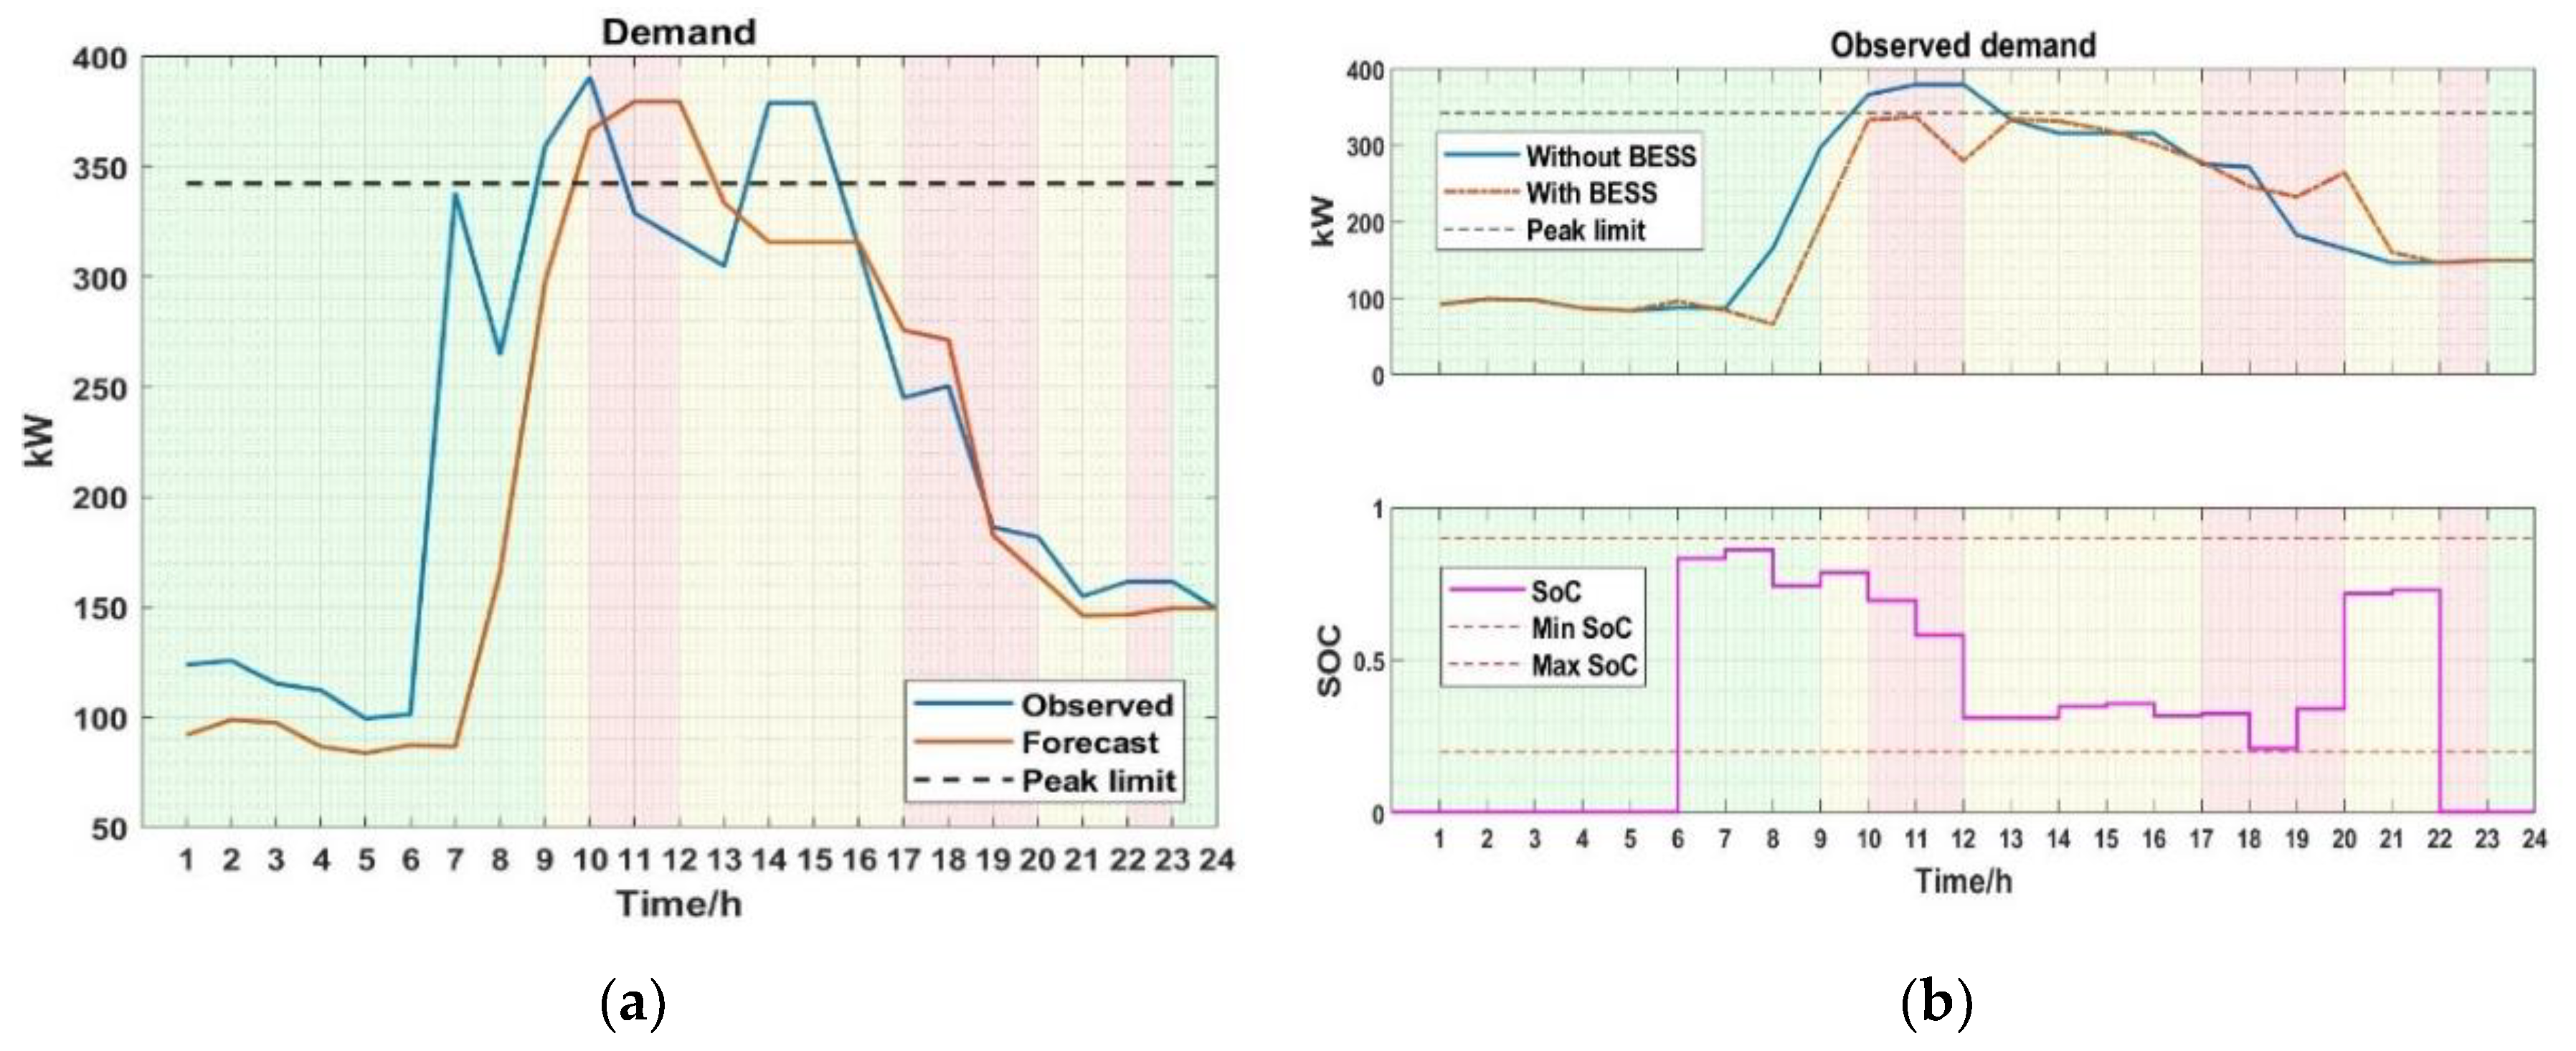
Figure 6, the periods before the arrival of EVs and after the departure of EVs exhibit no activity. During working hours, the first EV turns up at 6:00 AM and the last EV depart at 8:05 PM. As other EVs arrive, PEVs are charged and discharge dynamically to reduce peak demand whenever they join the grid. From this setup, the PEVs can reduce the peak from 379.5 kW to 301.5 kW depicting a 21% reduction in peak demand and a yearly cost reduction of ₩8,729,423 by reducing electric cost from ₩206,990,917 to ₩198,261,495. It can be observed via the SoC plot that the BESS of the PEV discharges more during the peak periods, as shown in red and yellow bands to reduce peak as much as possible and also to reduce cost since the TOU charge is high during this period. As much as possible all PEVs are charged to full capacity during the off-peak period before discharge in the peak period. It can also be observed that PEV charge close to their departure time to satisfy the final SoC constraint to allow a trip back home.
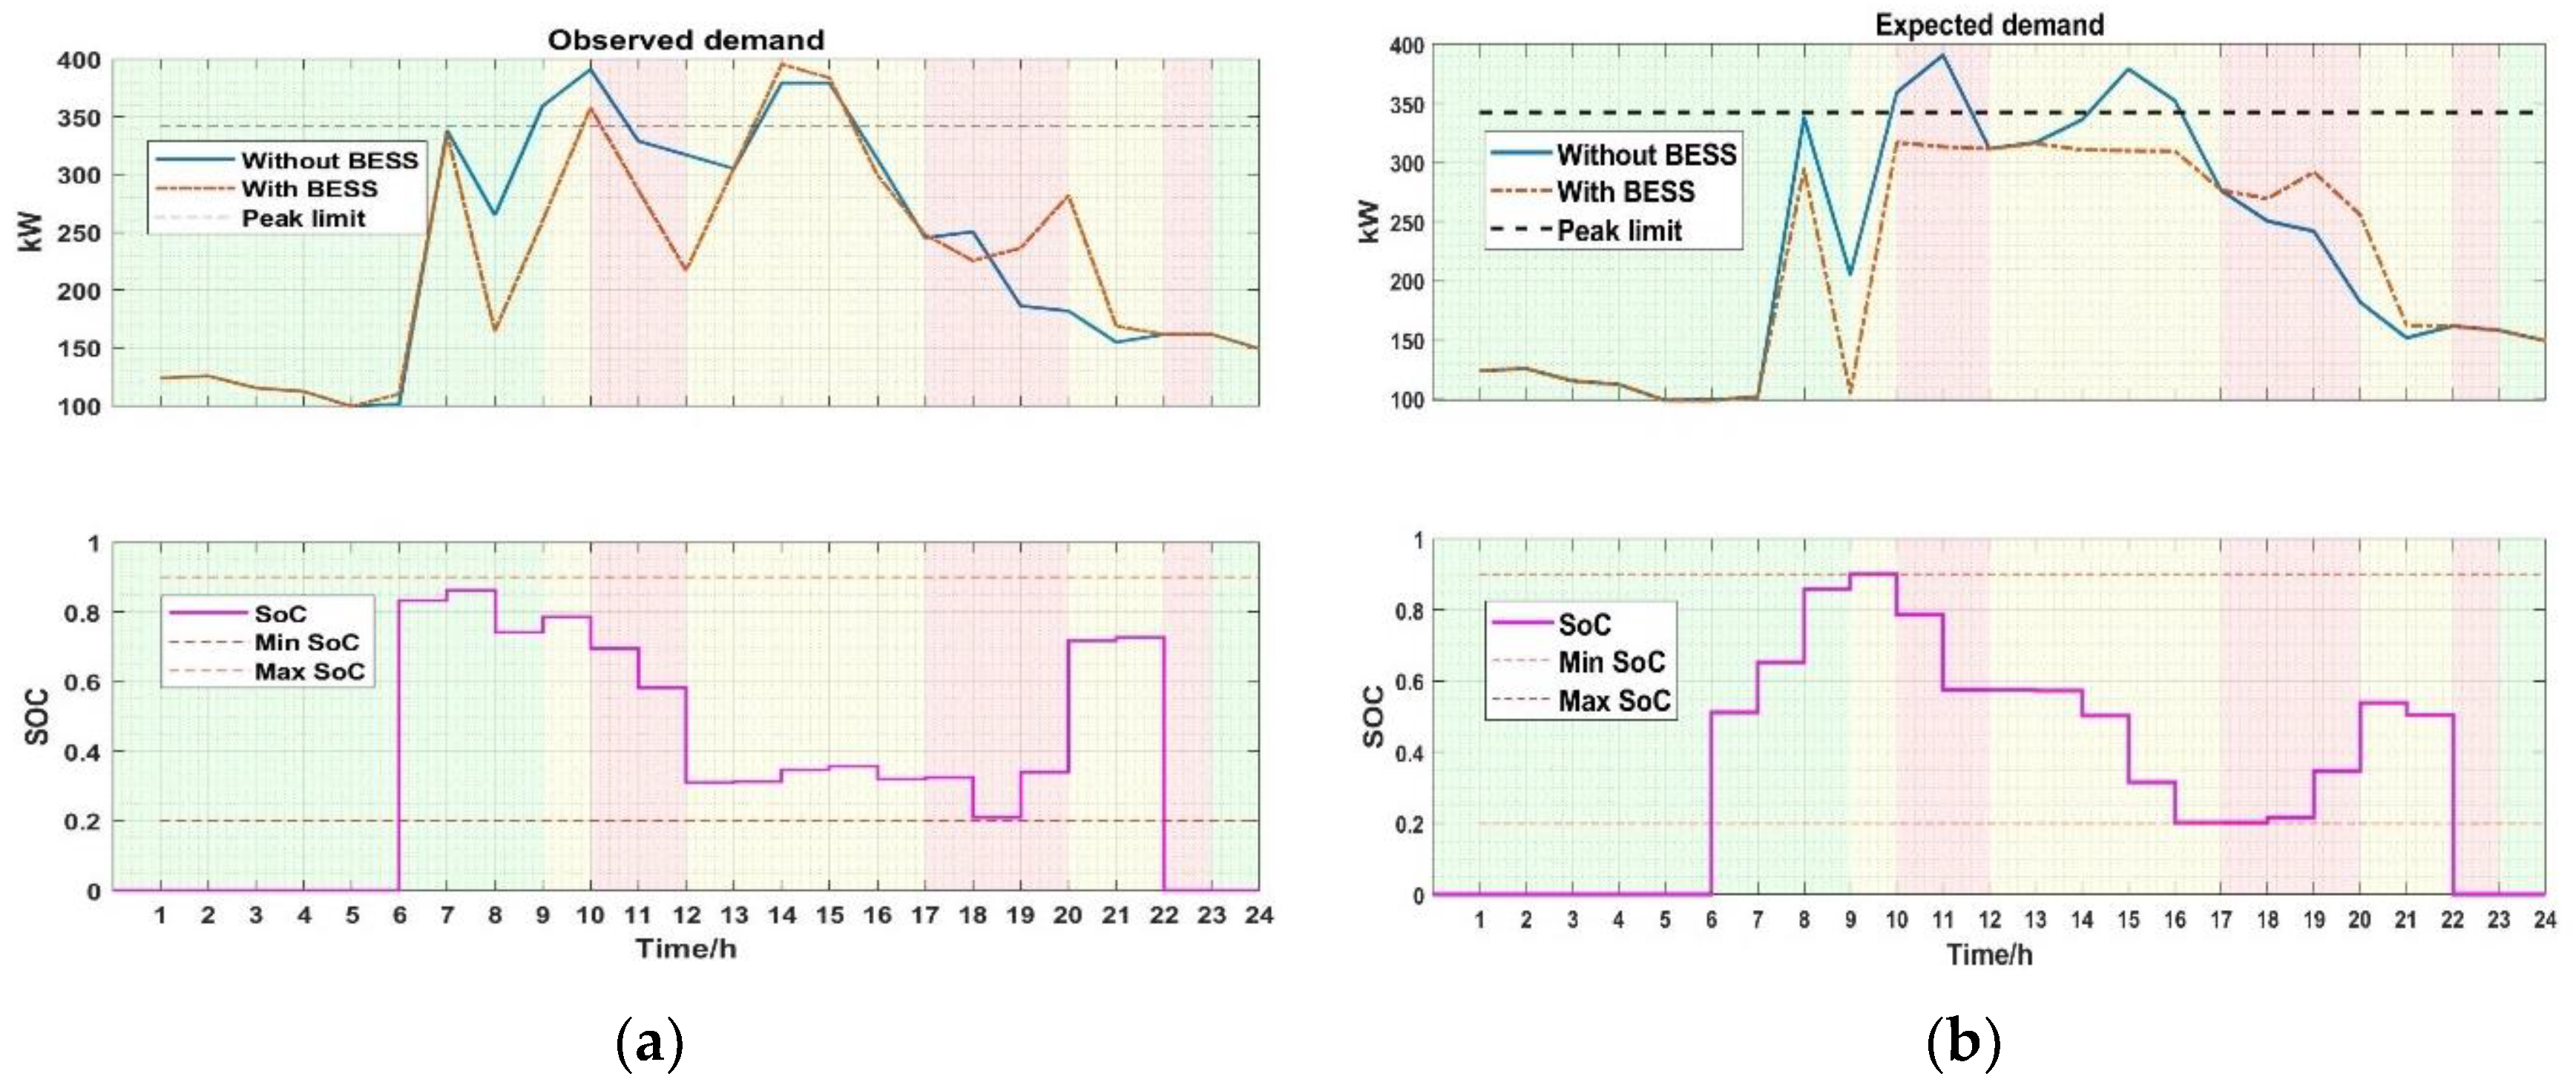
From the
Figure 6, although PEV capacity in V2G service is enough to suppress more of the demand at the beginning of the peak periods, due to the anticipation of future peaks, the algorithm sufficiently shaves all current peak and proportionally reserves adequate capacity for future. This is to ensure a uniform peak shaving performance throughout the day. At higher penetration levels of PEV, the controlled reduction is much substantial as compared to low PEV penetration levels. This is as a result of the amount of energy available due to V2G. In summary, independent of the demand profile characteristics, the proposed method can shave peak since the operation schedule of each PEV is updated at each time step to account for uncertainties shortly. Higher penetration levels of PEV can lead to saturation, a scenario where the number of PEV participating in V2G no longer affect the peak reduction. Based on the capacity of the service transformer, PEV charging due to V2G may result in new peaks. As such it is prudent to identify the desired level of peak reduction taking into consideration grid load as well as the number of PEVs with their mobility parameters.
6. Conclusions
This study presents a DSM algorithm that implements V2G while considering demand uncertainties and mobile storage uncertainties. The proposed method I dynamic probabilistic forecast with data dimensionality reduction for stochastic optimisation to generate a robust PEV operating schedule for peak control and cost minimisation.
A penetration analysis shows that an increase in the penetration of EVs causes an increase in peak demand reduction, but after penetration of about 11 EVs, the reduction begins to slow down. Also, an increase in EV penetration increases the time complexity of the algorithm, since the minimum time interval needed for the dynamic probabilistic forecast is 15 min so the algorithms can handle up to 40 PEVs. To solve this problem, a K-means algorithm is used to group EVs of similar arrival and departure characteristics together in other to make the optimisation problem independent of EV population, as such EV population does not affect the time complexity of the optimisation algorithm.
To verify the proposed method, a case study is performed using demand data from an industrial site in South Korea. Computational results show the proposed approach is correct and useful for DMS to mitigate peak and reduce electric cost. As compared to the deterministic and probabilistic forecast using confidence interval, dynamic probabilistic forecast performs demand forecast multiple times in a day horizon to correct demand forecast errors. While incorporating PEV, the solution factors in both uncertainties in demand and mobility of EV for a robust energy schedule via stochastic optimisation, the objective function of the stochastic optimisation is designed to account for both advantages of peak control and economic benefit via energy arbitrage. From the verification results, the proposed method achieves a better peak reduction as well as a better cost saving as compared to a case using a deterministic day ahead demand forecast and its impervious to demand changes in the presence of PEV.
From the results, it is prudent to identify the desired level of peak reduction taking into consideration the capacity of the service transformer, grid load as well as the EV penetration levels to prevent transformer overload. Future works which considers the integration of other distributed energy resource like a photovoltaic system (PV) could help increase the energy capacity of the grid in the event of high EV penetration. Future work will also explore battery degradation and power loss to enhance the system’s efficiency further.


