Fractal and Multifractal Analysis of Pore Size Distribution in Low Permeability Reservoirs Based on Mercury Intrusion Porosimetry

Abstract
1. Introduction
2. Materials and Methods
2.1. Single Fractal Theory
2.2. Multifractal Theory
3. Samples and Experiments
4. Results and Discussion
4.1. Single Fractal Characteristics
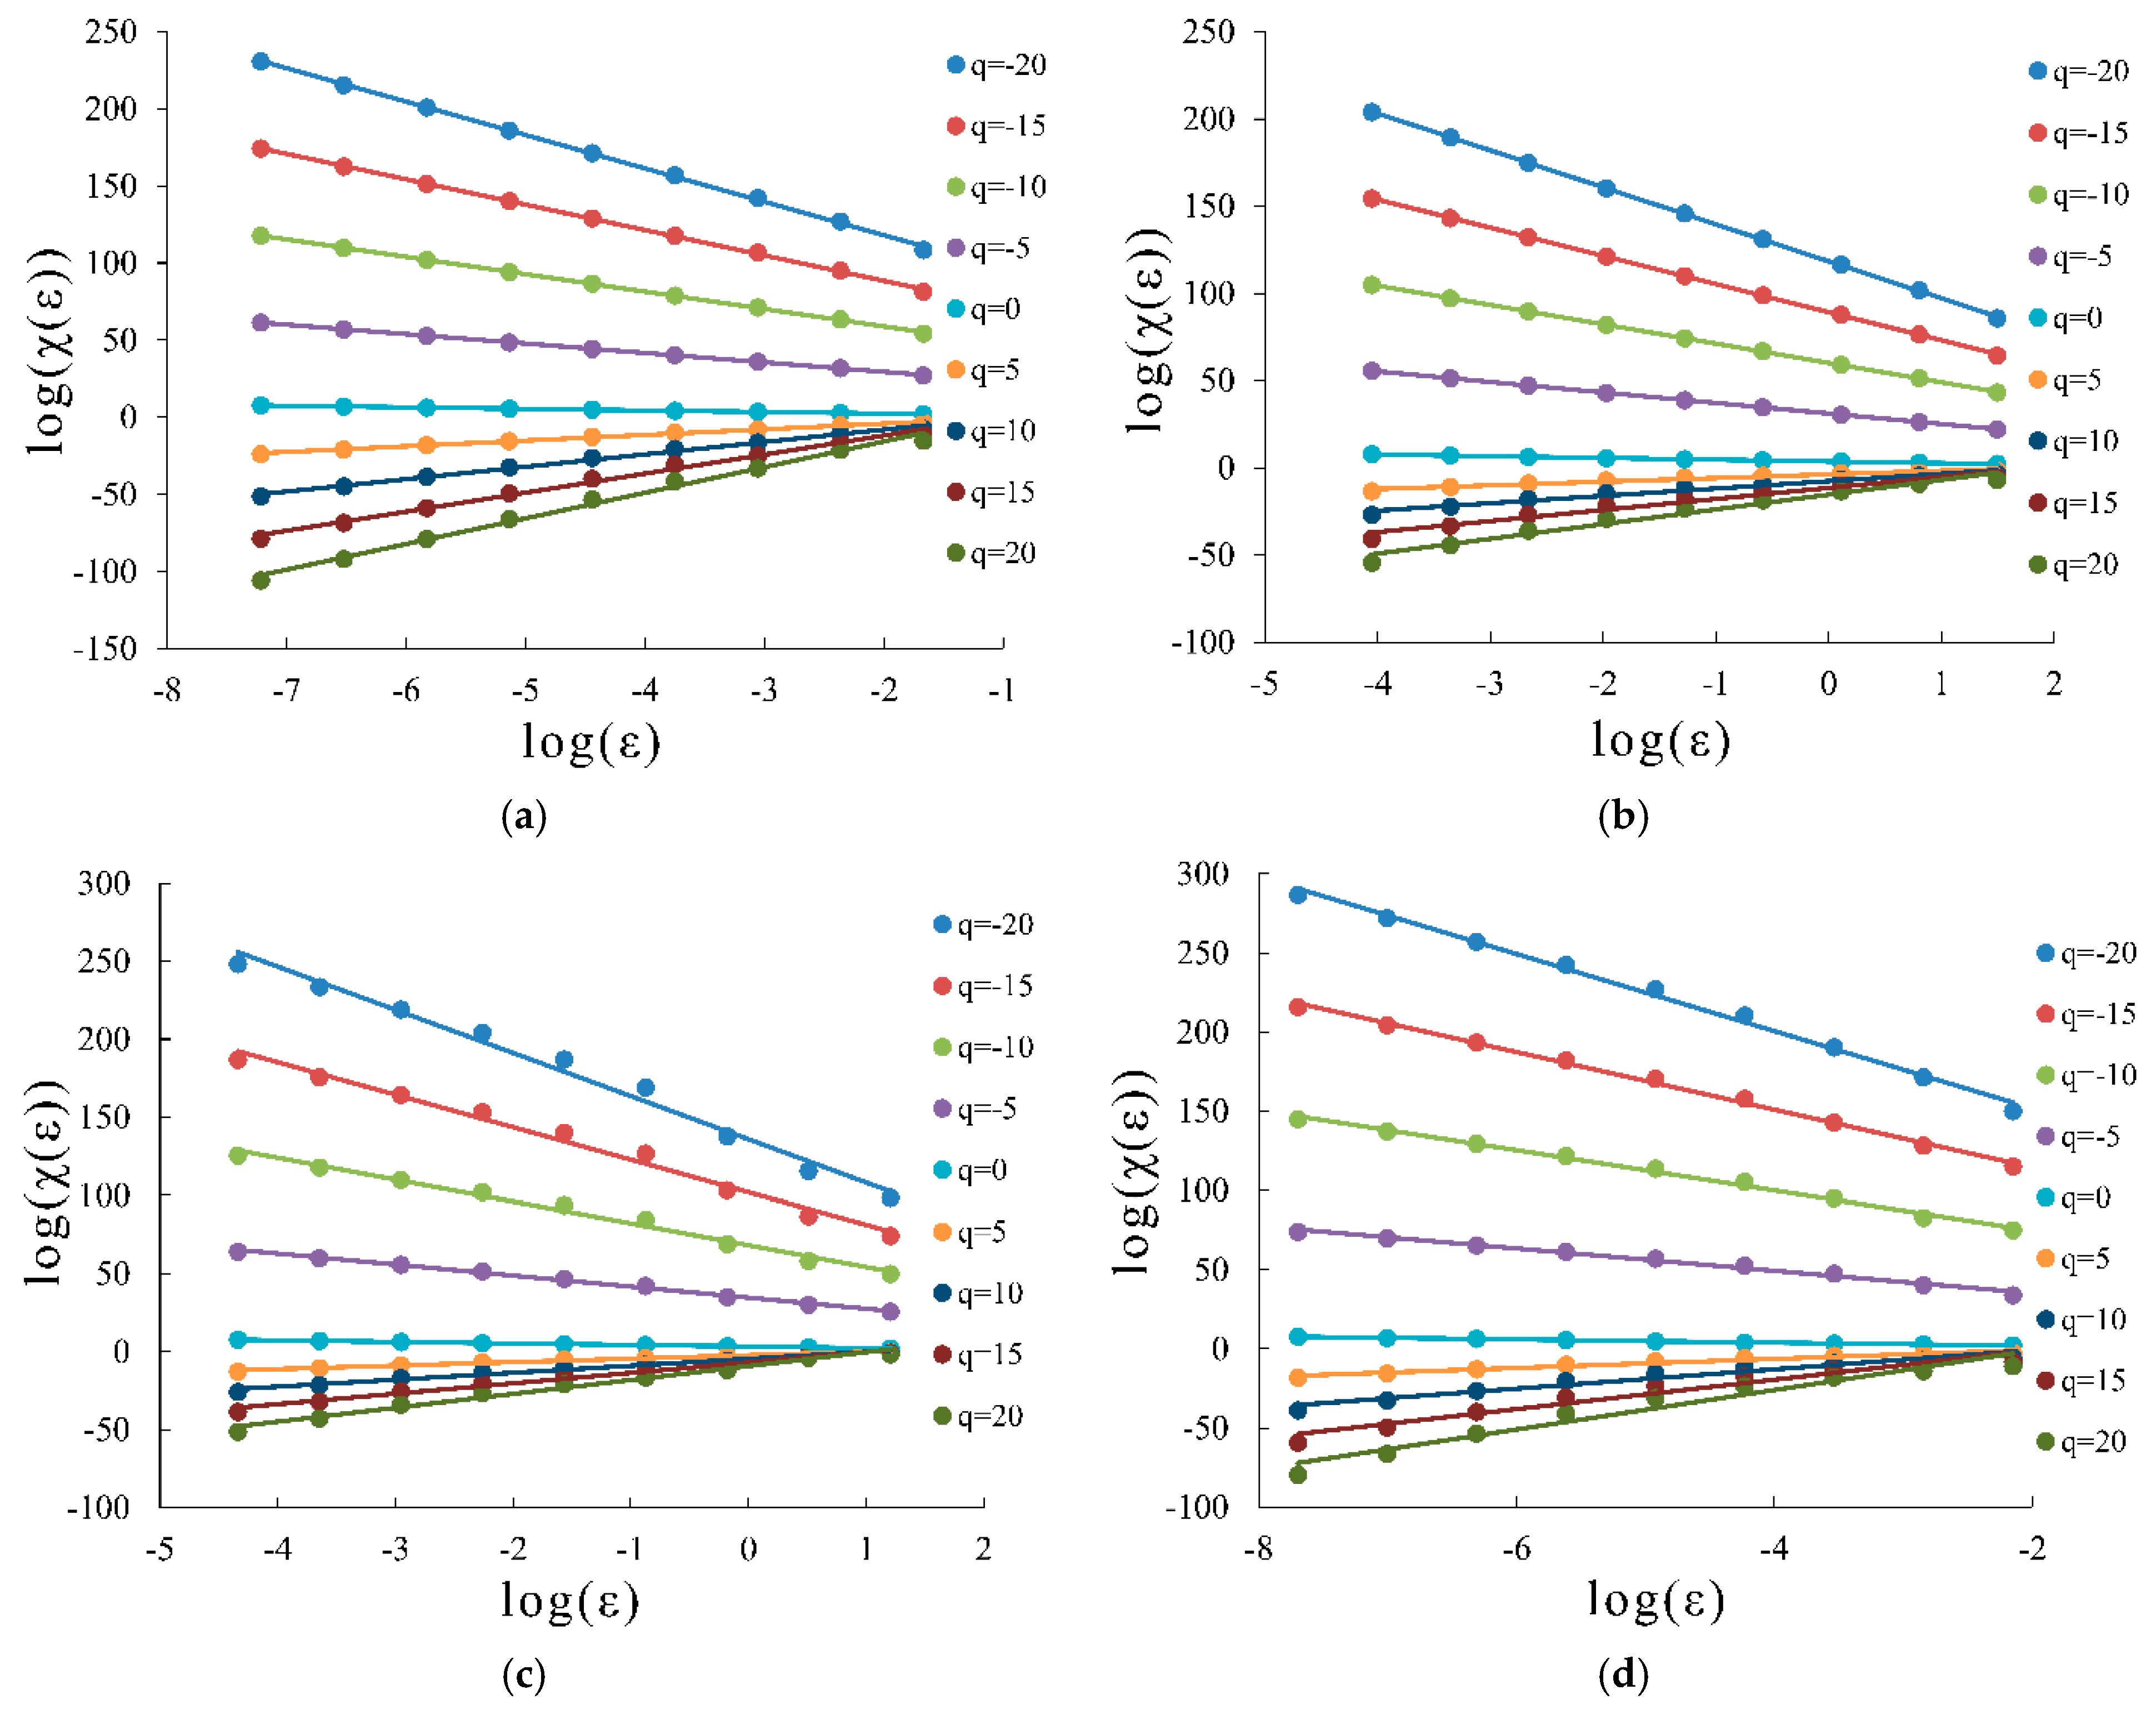
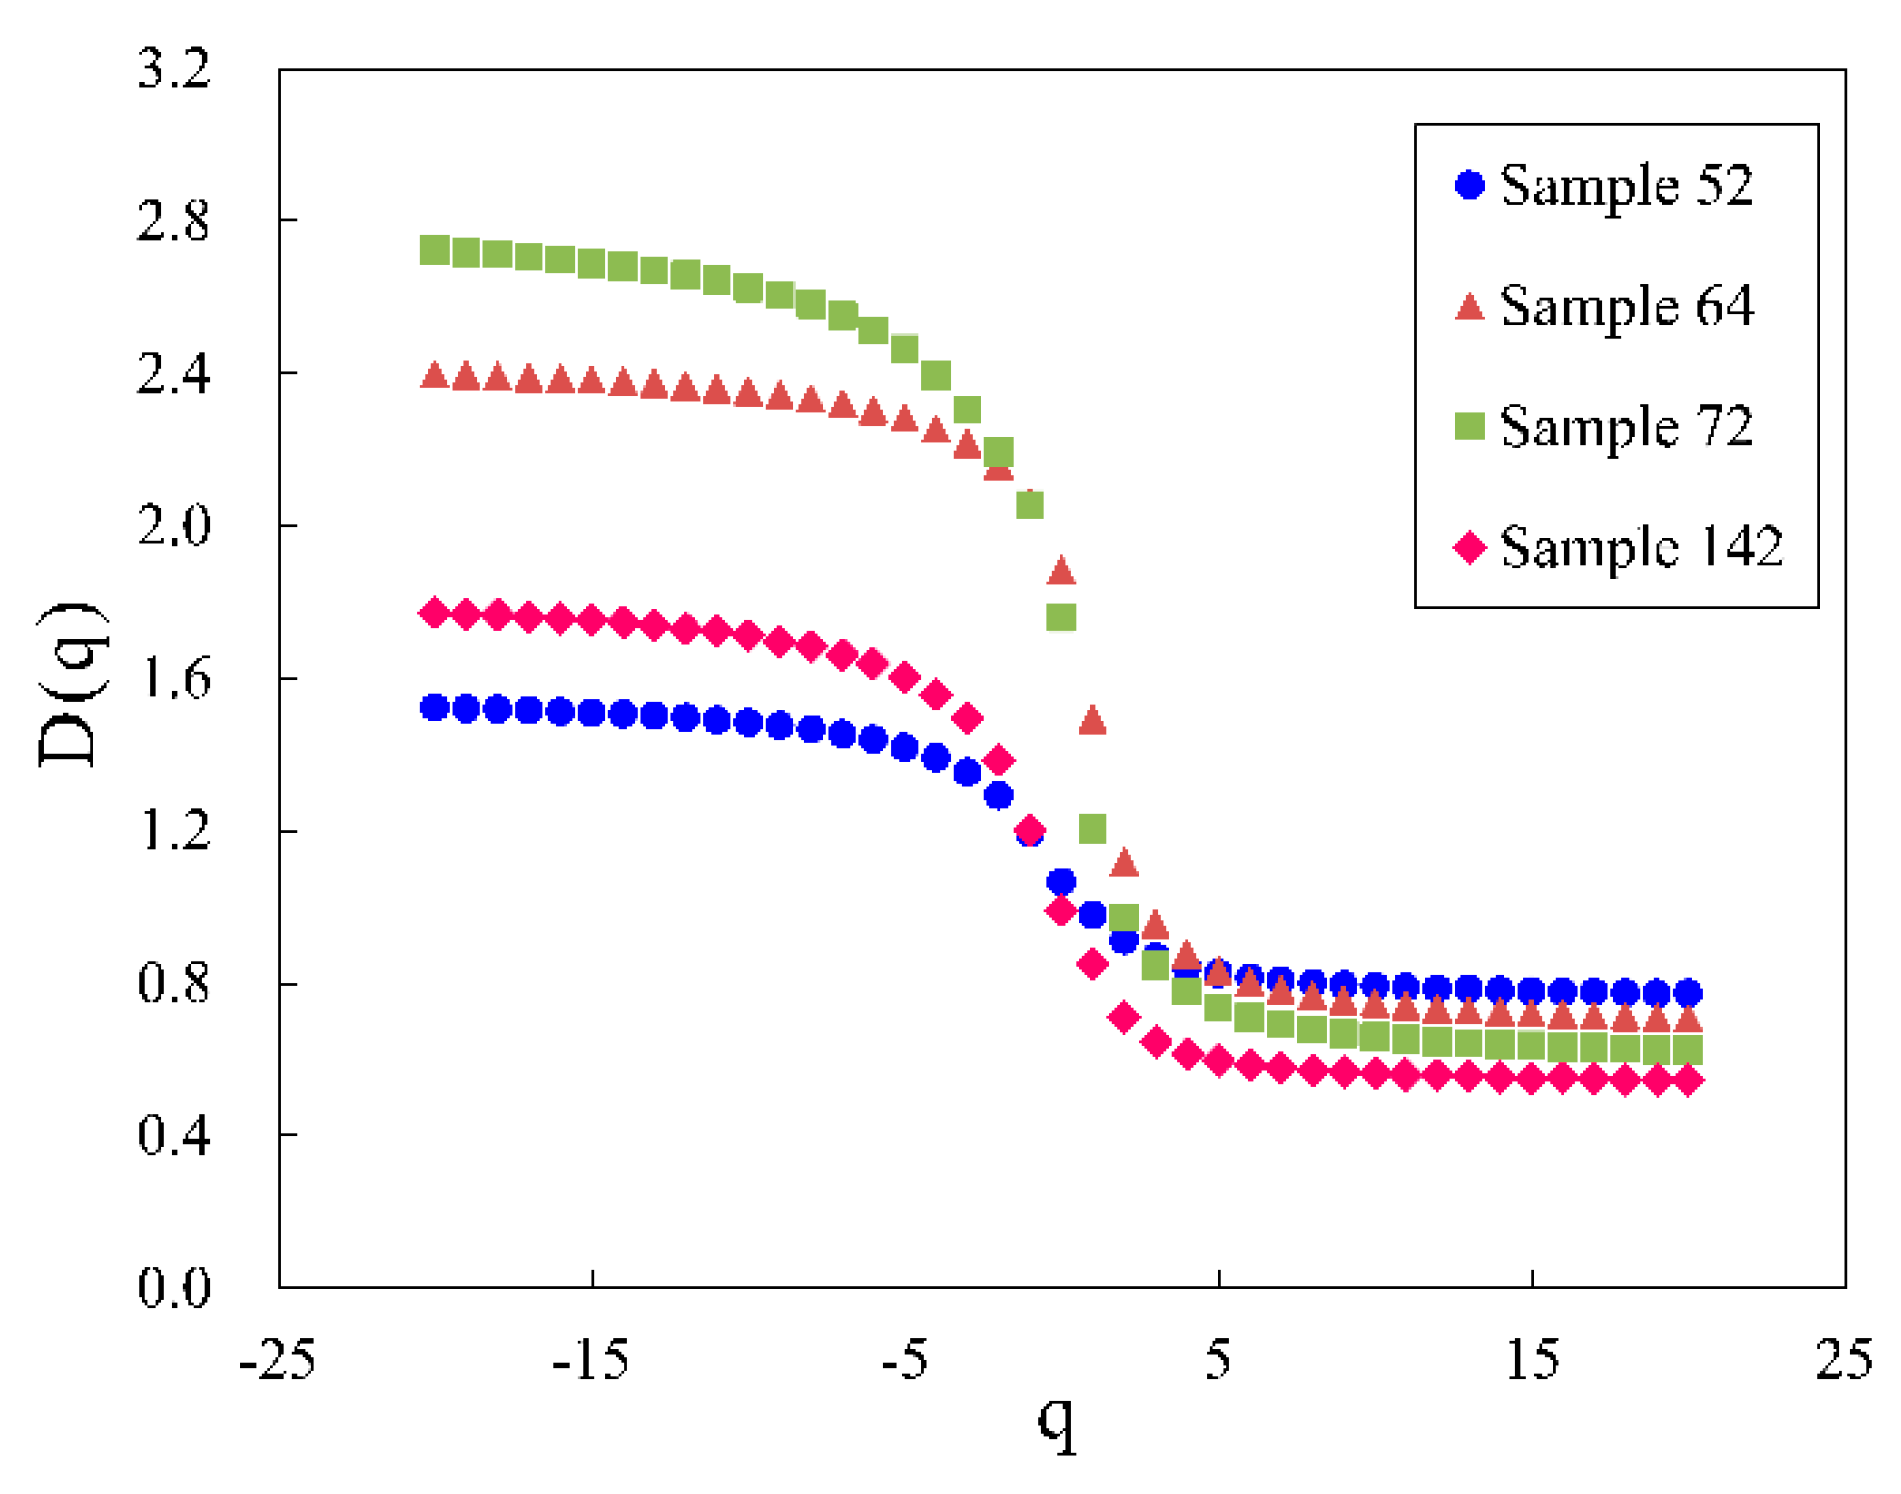
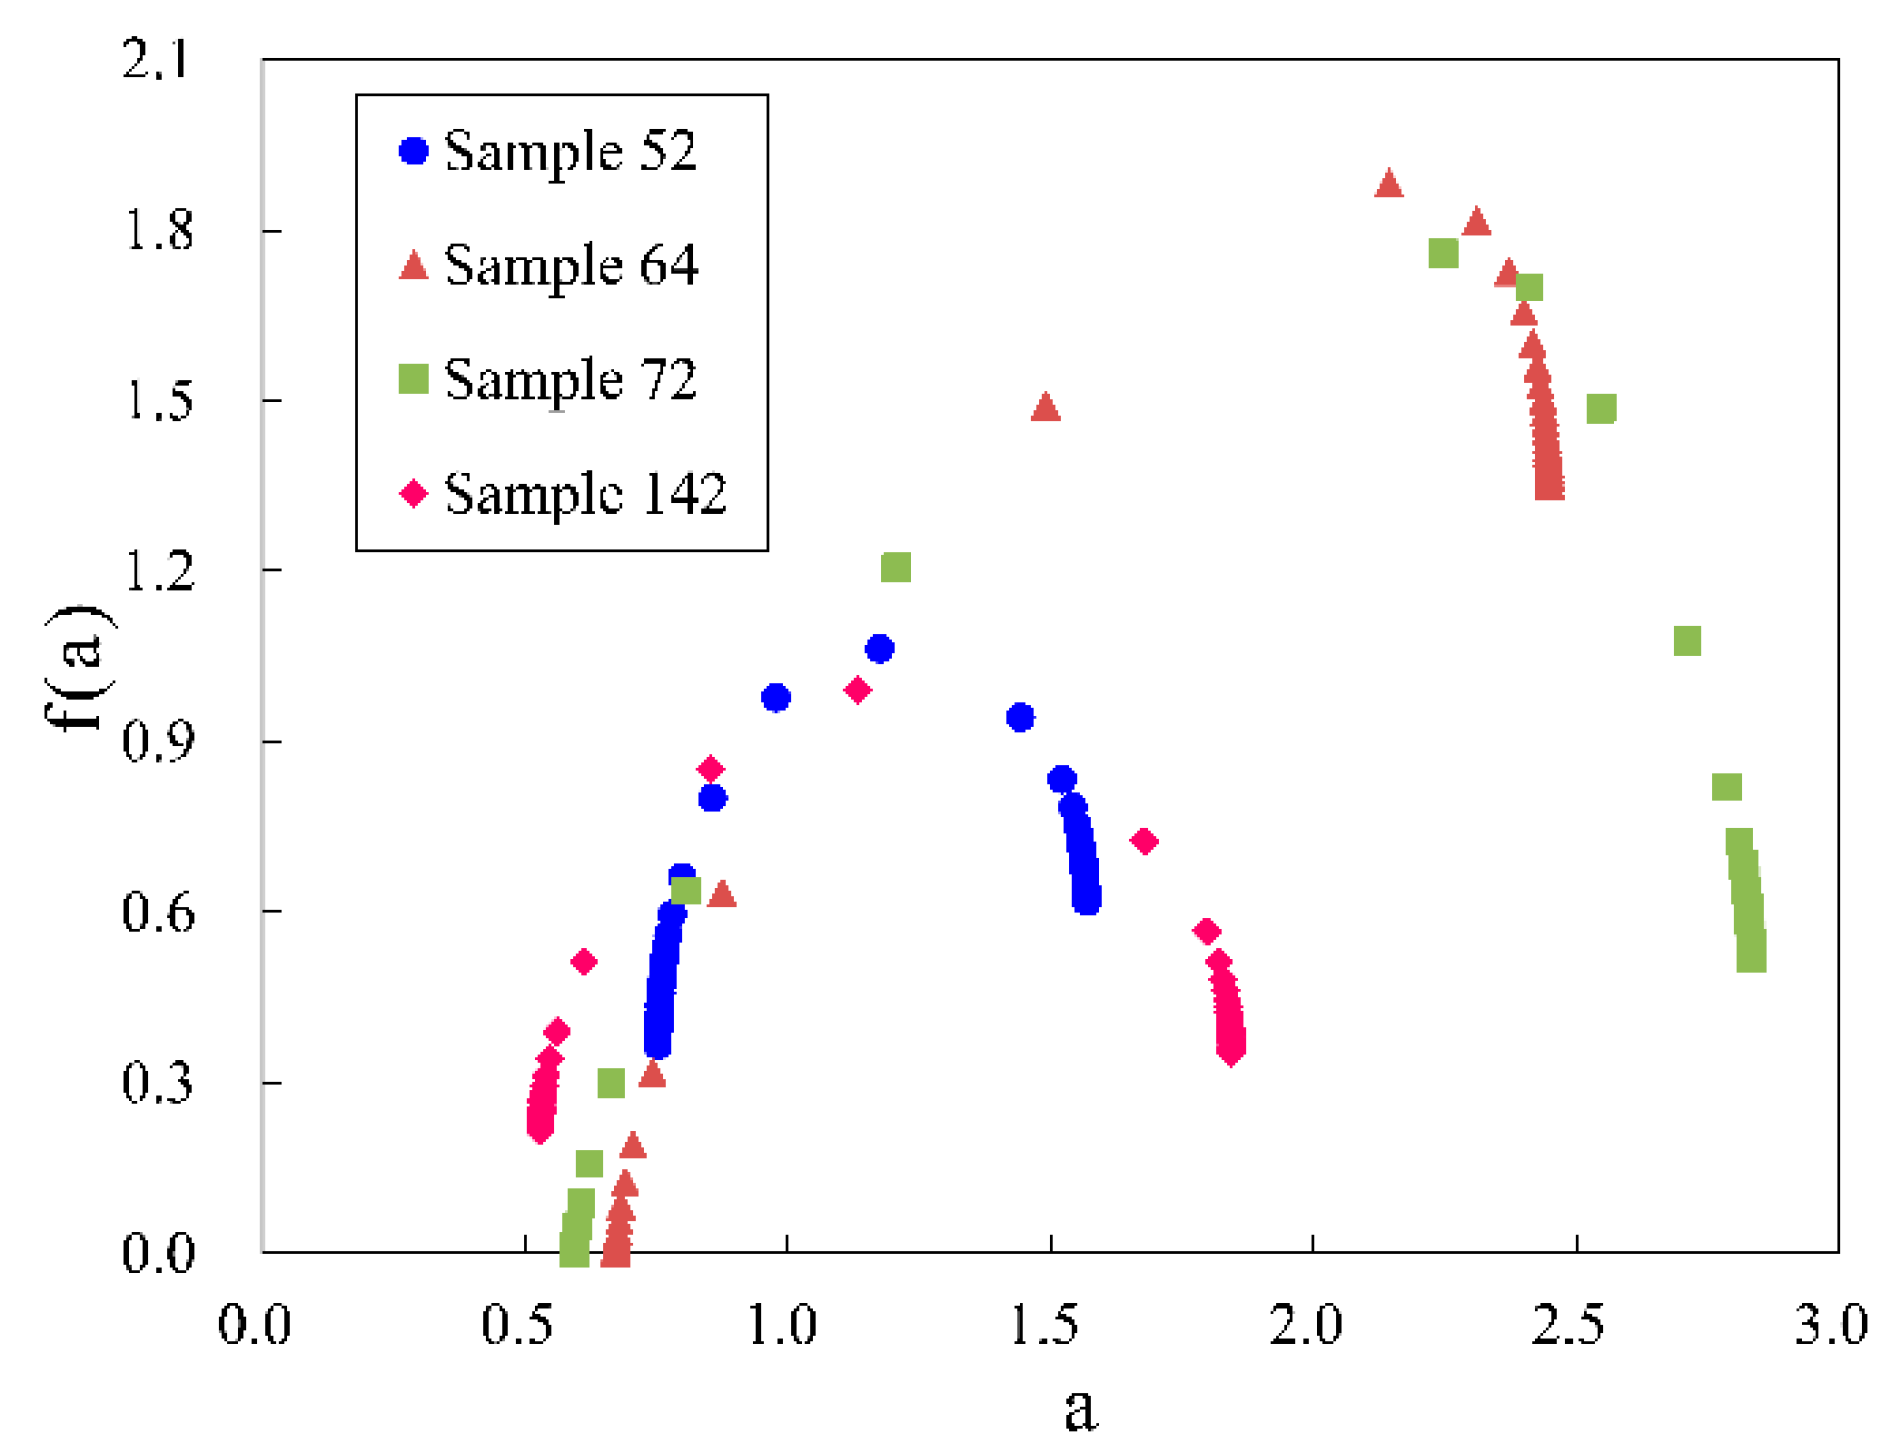
4.2. Multifractal Characteristics
4.3. Relationship between Petrophysical and Single Fractal Parameters
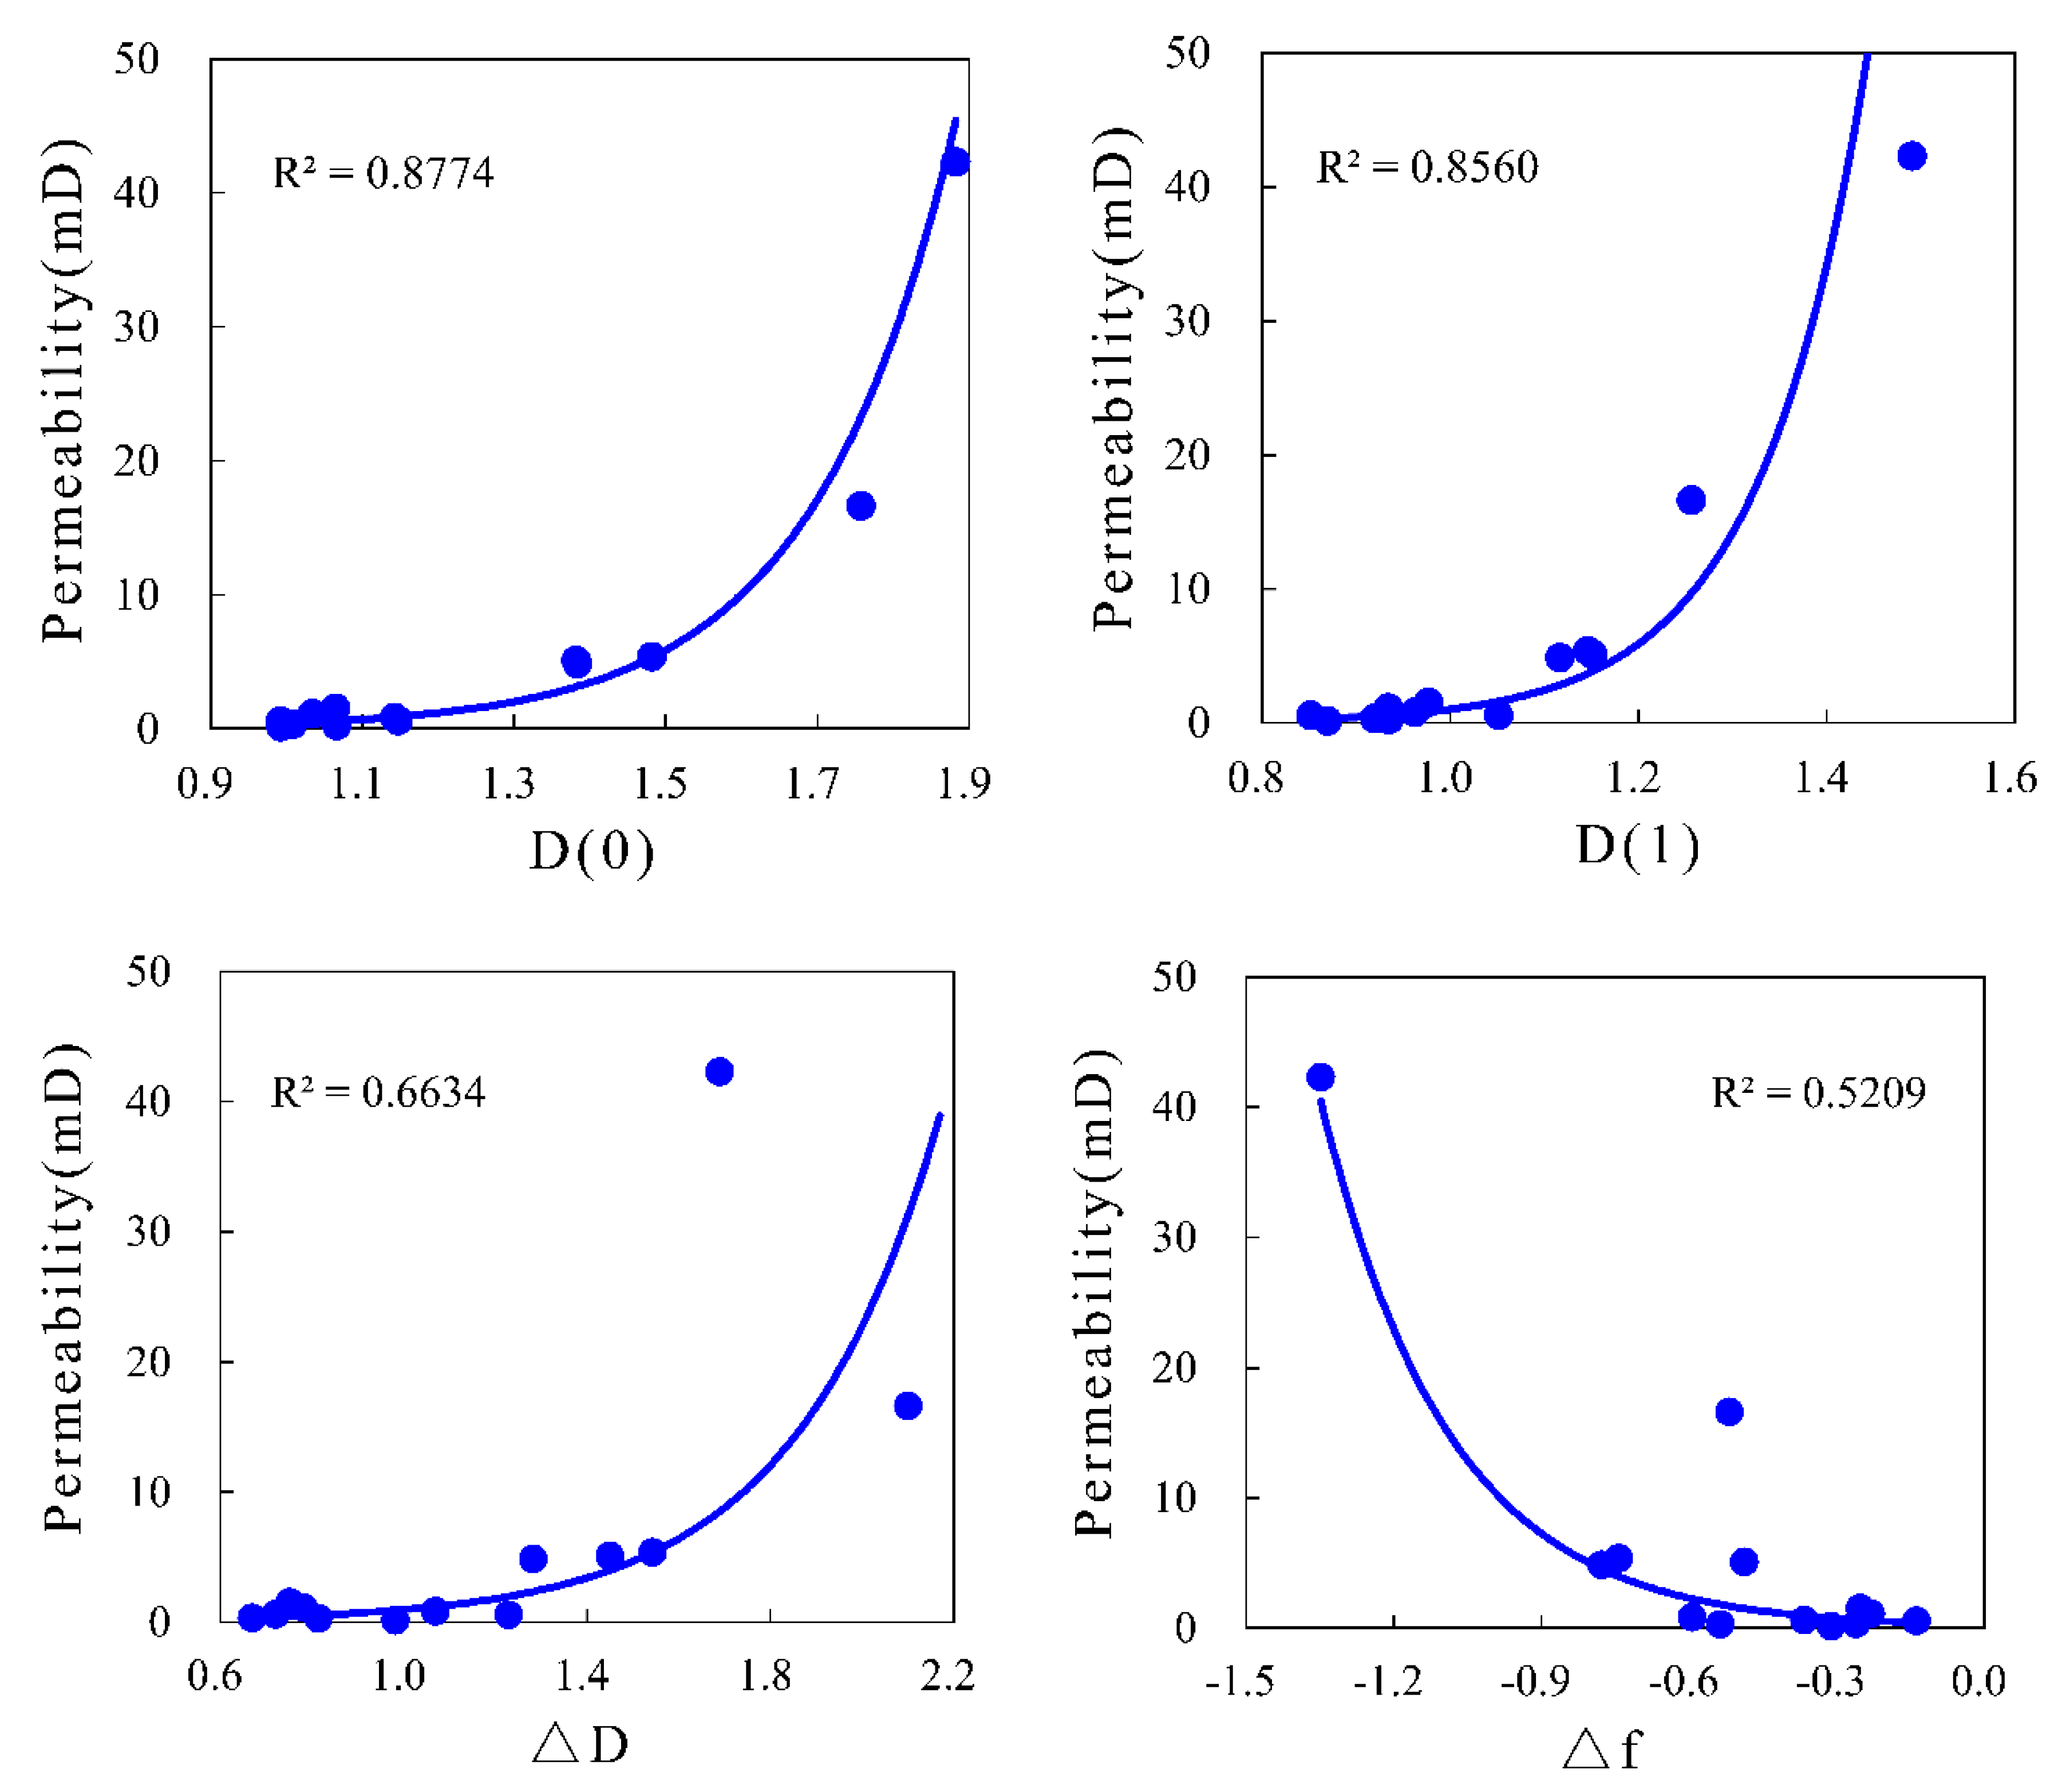
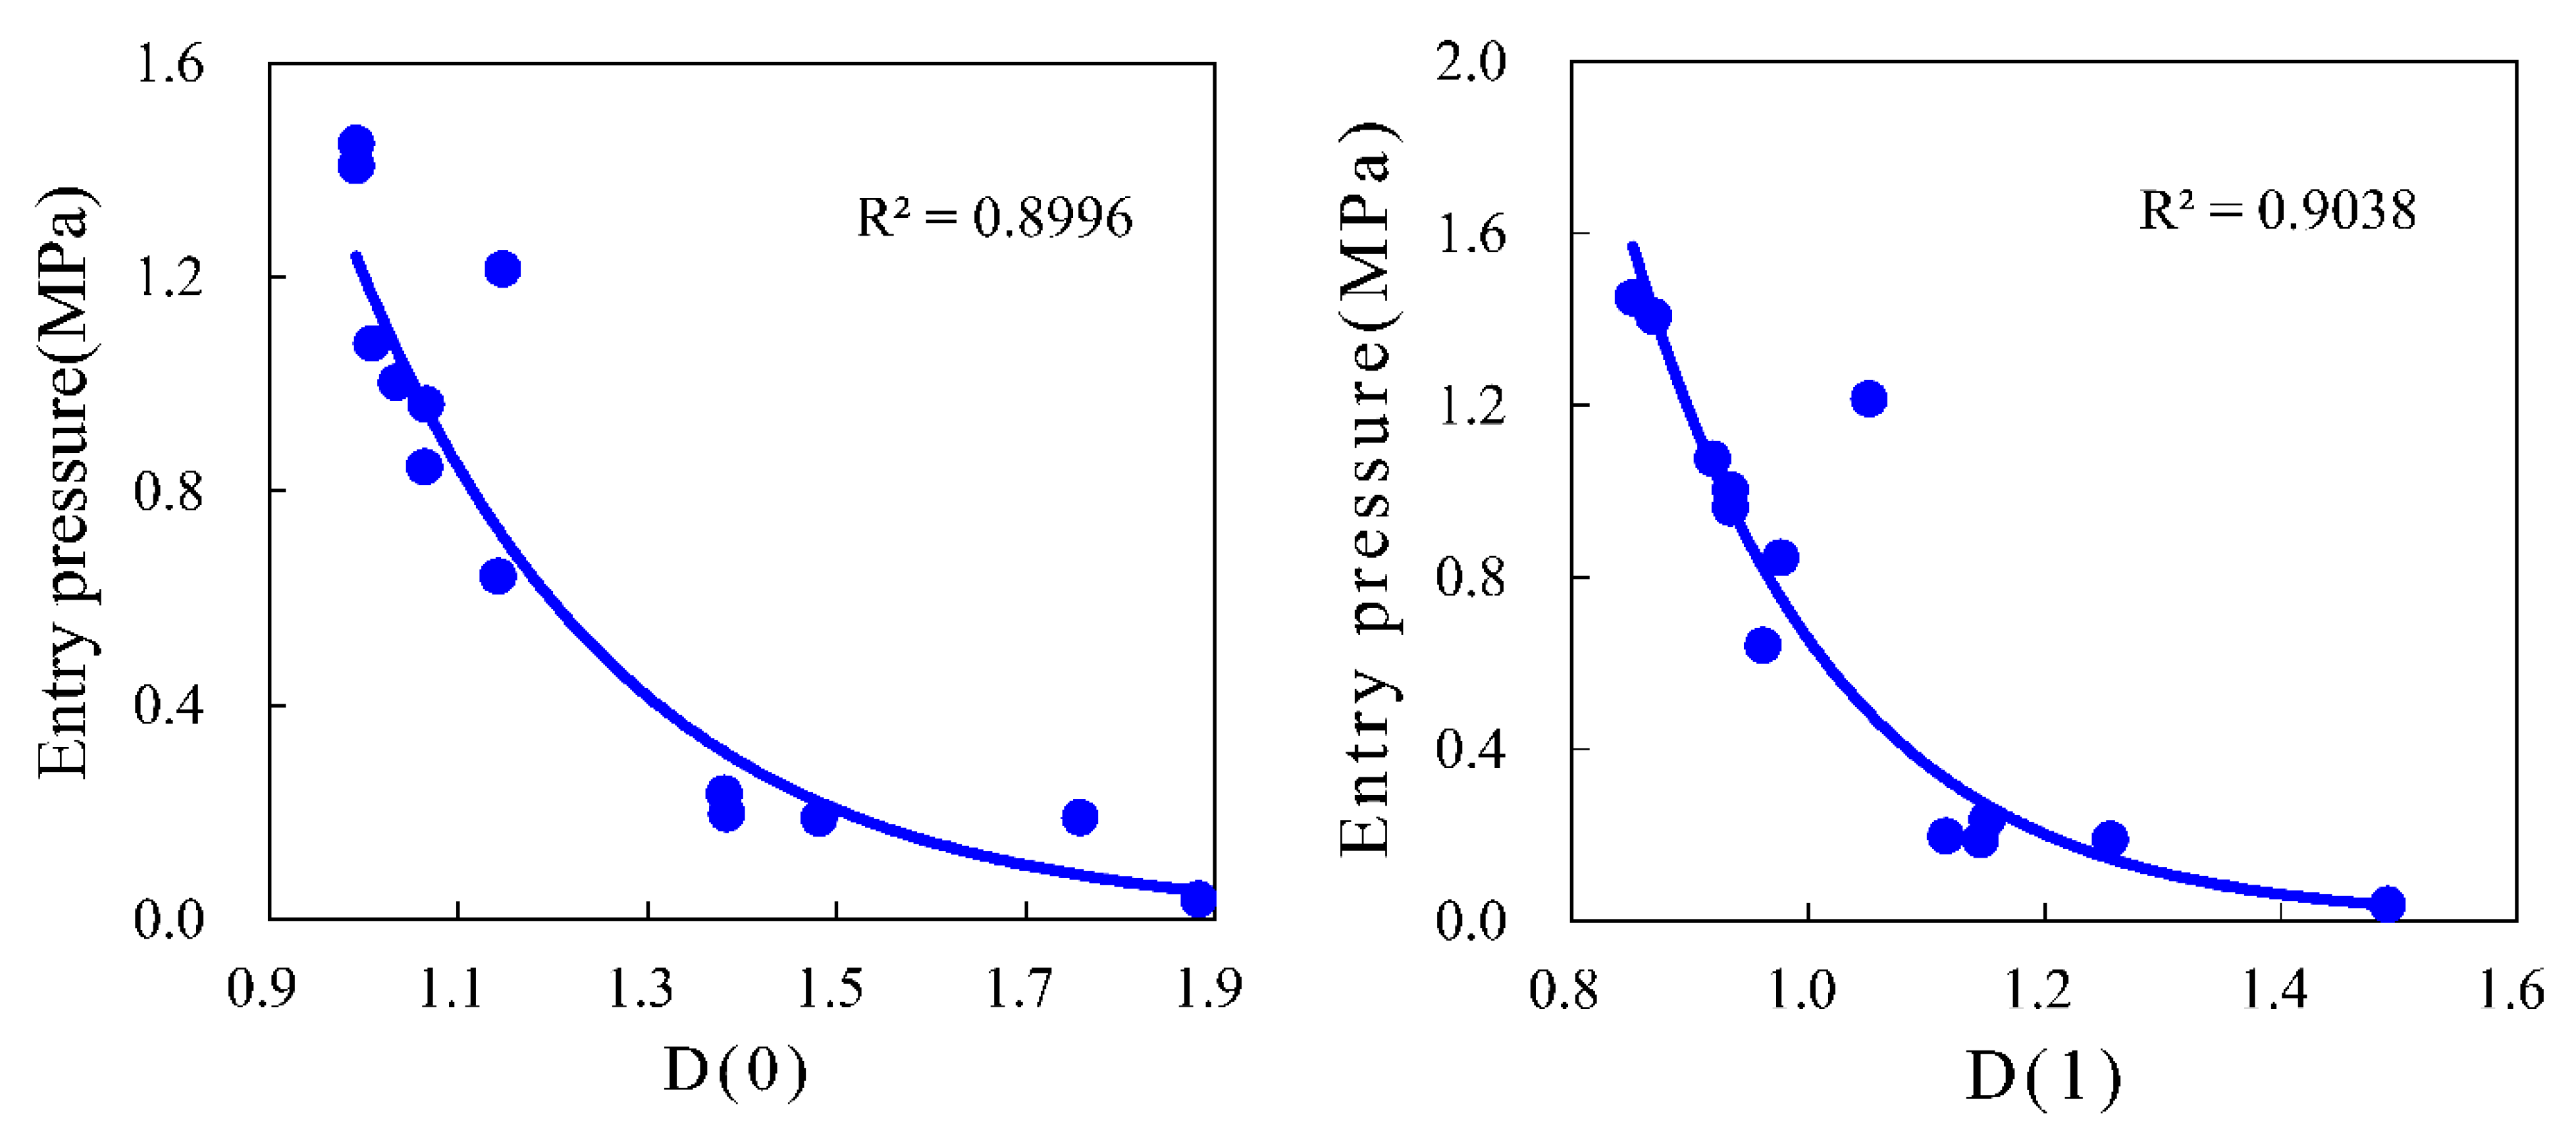
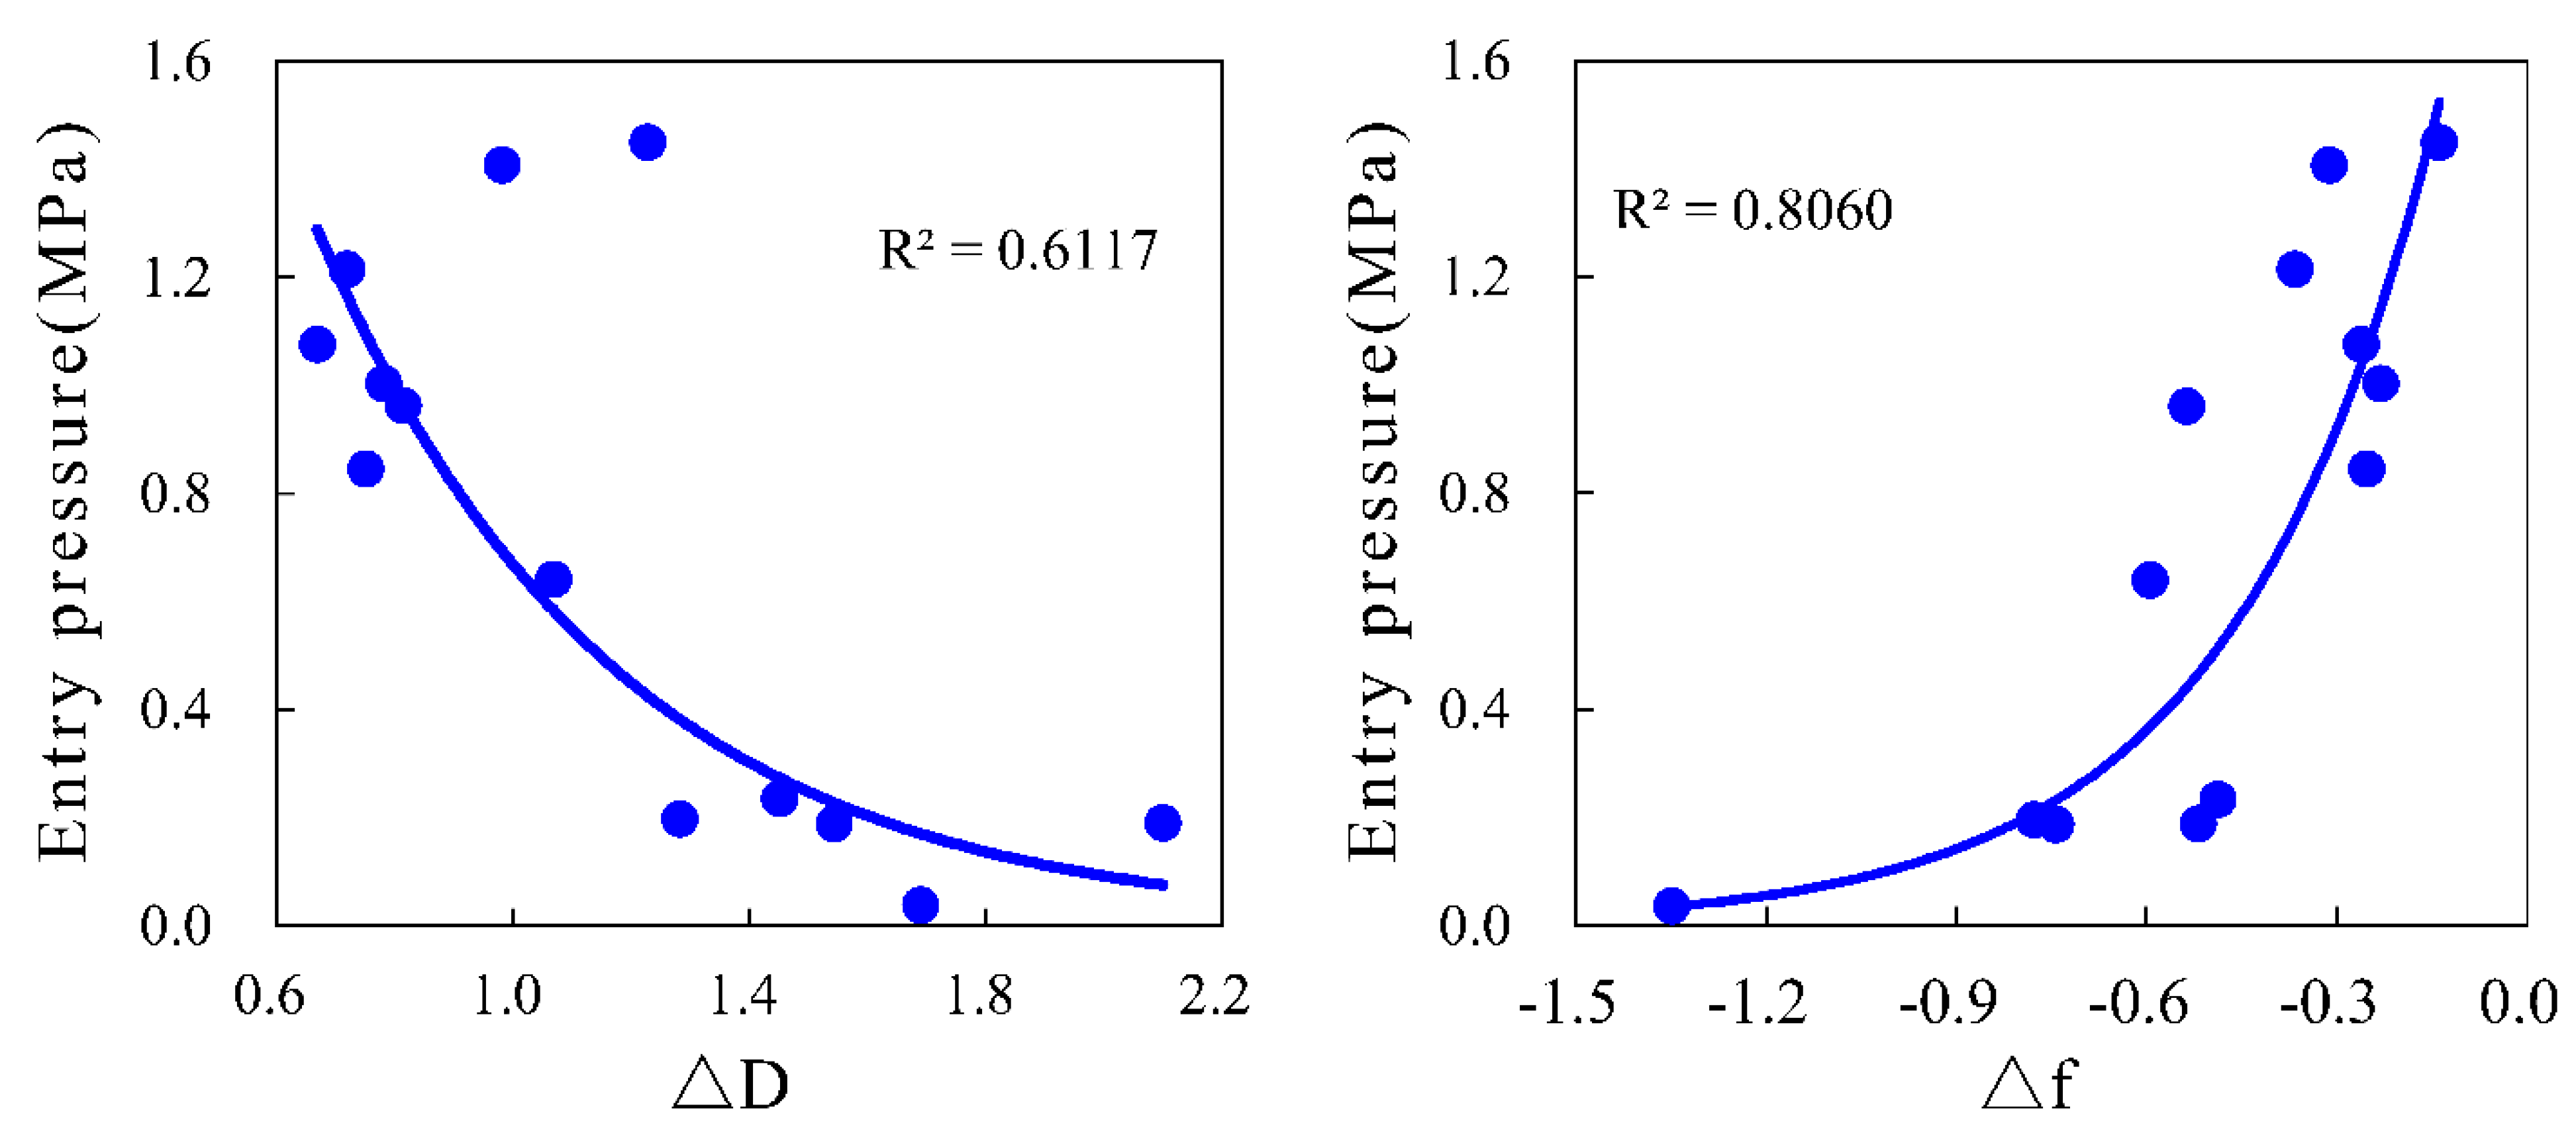
4.4. Relationship between Petrophysical and Multifractal Parameters
4.5. Comparison between Single Fractal and Multifractal Analysis
5. Conclusions
- (1)
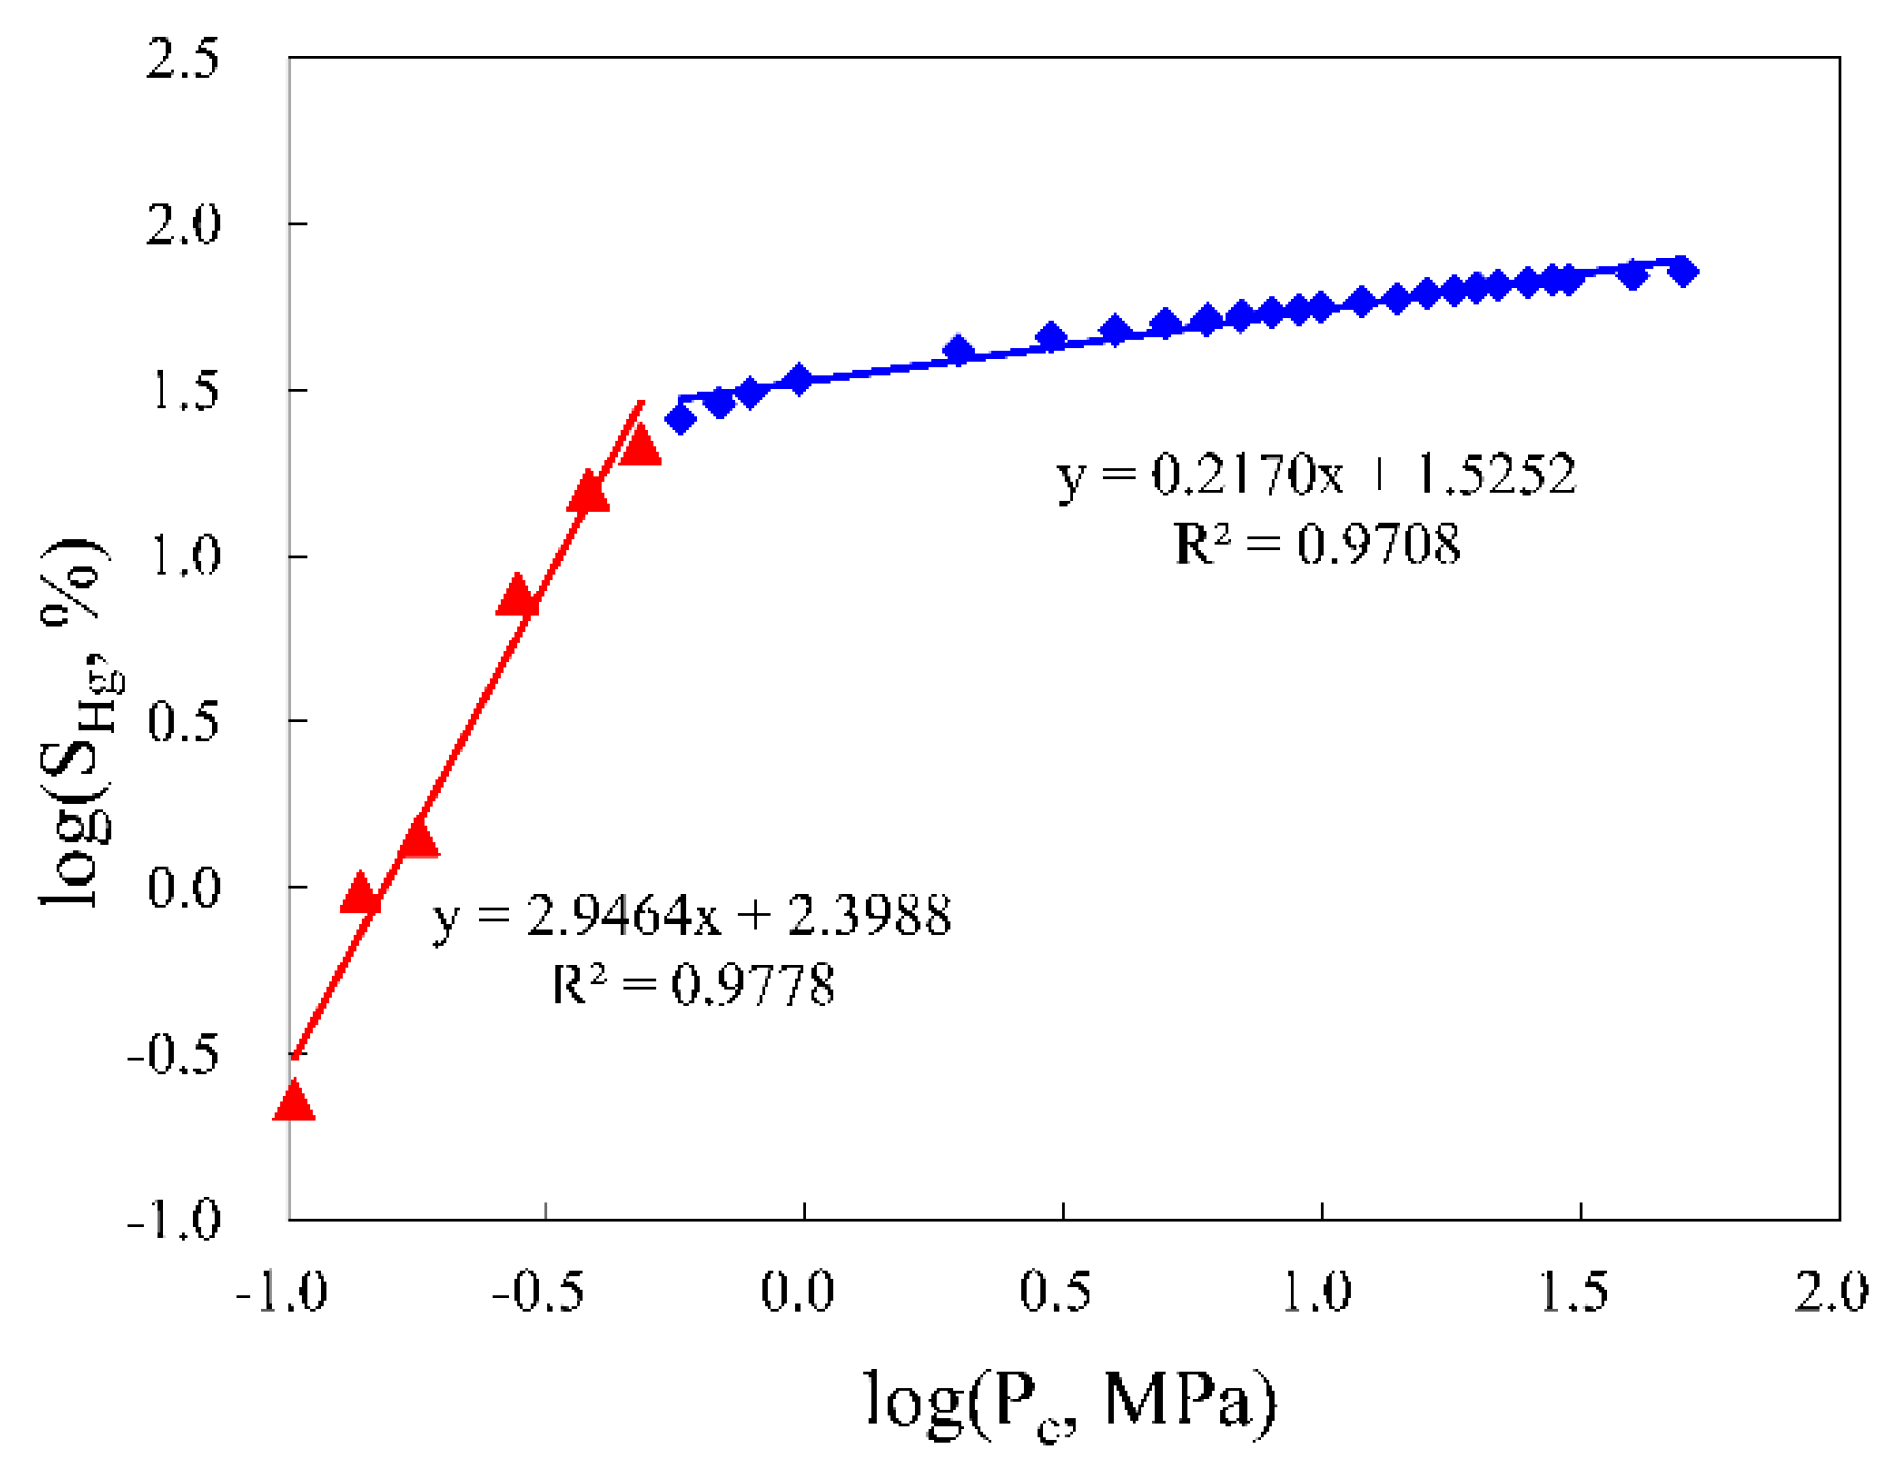
- The single fractal curves exhibit segmented fractal characteristics and the fractal dimensions of the low-pressure section is greater than the fractal dimension of the high-pressure section. The saturation-weighted fractal dimension Dsw has a better correlation with permeability and entry pressure than D1 or D2.
- (2)
- Linear relationships exist between log(ε) and log(μ,(ε)) for the 13 samples when −20 ≤ q ≤ 20, suggesting that the pore structures of the 13 samples exhibit multifractal characteristics. Multifractal parameters D(0) and D(1) correlate well with permeability and entry pressure. The physical properties of the reservoir improve with increases in the range of pore size distribution.
- (3)
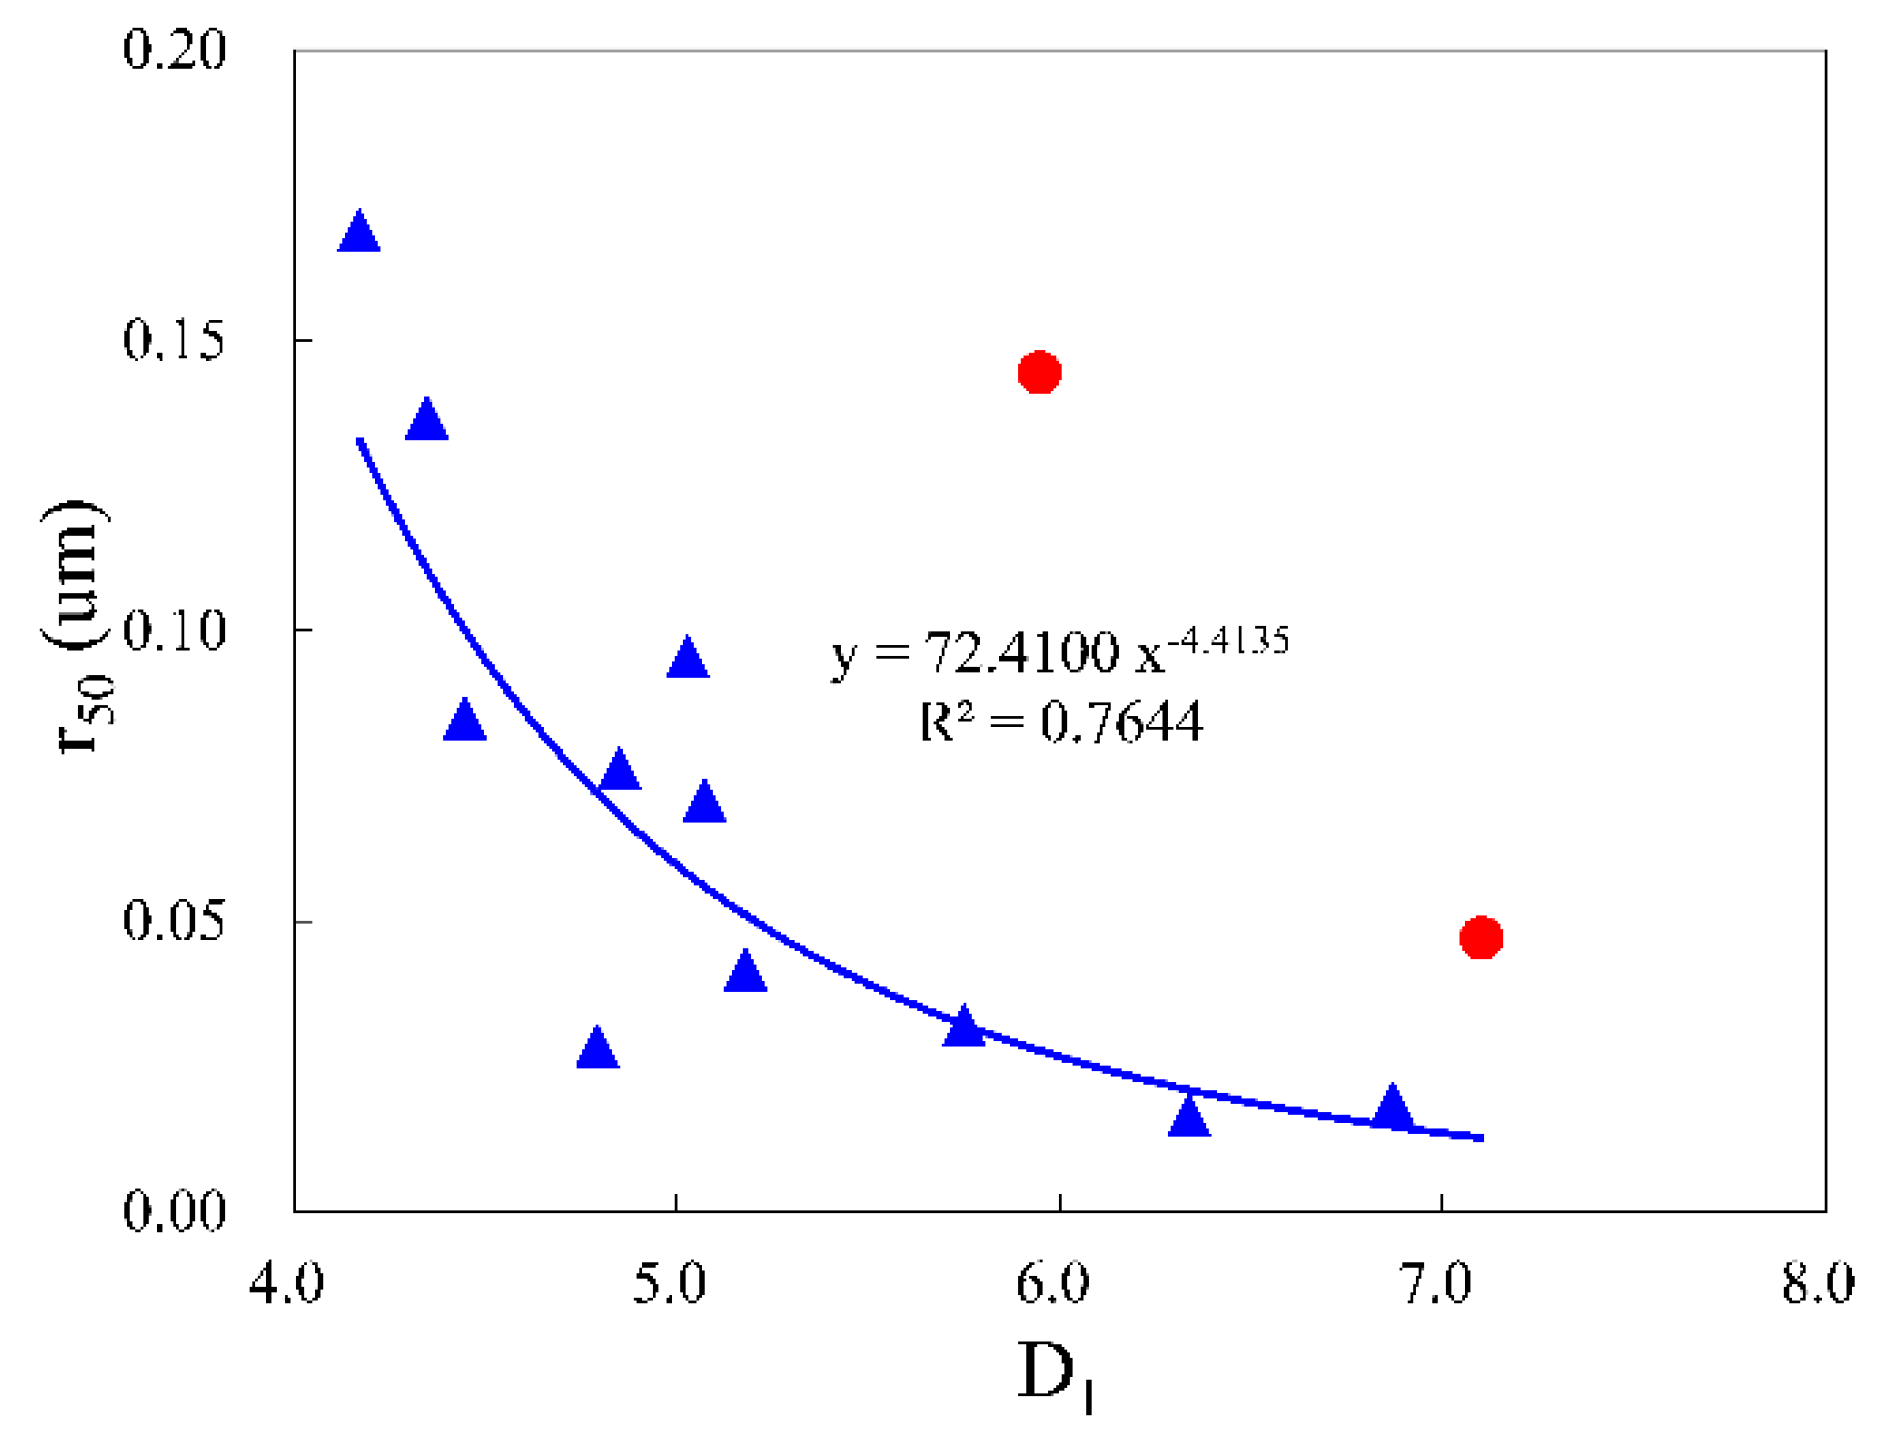
- The ratio of larger pores volumes to total pore volumes acts as a control on the fractal dimension over a specific pore size range, while the range of pore size distribution has the greatest effect on the multifractal analysis and multifractal parameters.
- (4)
- Fractal analysis and multifractal analysis are feasible methods for characterizing the complexity of pore size distribution in a reservoir. Multifractal analysis with parameters D(0) or D(1) produce better correlations with reservoir physical properties. In conclusion, multifractal analysis is more suitable for characterizing the heterogeneity of pore size distributions when the pore size distribution of samples is addressed without any a priori assumptions.
Author Contributions
Funding
Conflicts of Interest
References
- Li, W.; Liu, H.; Song, X. Multifractal analysis of Hg pore size distributions of tectonically deformed coals. Int. J. Coal Geol. 2015, 144, 138–152. [Google Scholar] [CrossRef]
- Ghanbarian, B.; Hunt, A.G.; Daigle, H. Fluid flow in porous media with rough pore-solid interface. Water Resour. Res. 2016, 52, 2045–2058. [Google Scholar] [CrossRef]
- Pfeifer, P.; Avnir, D. Chemistry in noninteger dimensions between two and three. I. Fractal theory of heterogeneous surfaces. J. Chem. Phys. 1983, 79, 3558–3565. [Google Scholar] [CrossRef]
- Katz, A.J.; Thompson, A.H. Fractal sandstone pores: Implications for conductivity and pore formation. Phys. Rev. Lett. 1985, 54, 1325–1328. [Google Scholar] [CrossRef] [PubMed]
- Friesen, W.I.; Mikula, R.J. Fractal dimensions of coal particles. J. Colloid Interface Sci. 1987, 120, 263–271. [Google Scholar]
- Hu, J.; Tang, S.; Zhang, S. Investigation of pore structure and fractal characteristics of the Lower Silurian Longmaxi shales in western Hunan and Hubei Provinces in China. J. Nat. Gas Sci. Eng. 2016, 28, 522–535. [Google Scholar] [CrossRef]
- Chen, X.; Yao, G.; Cai, J.; Huang, Y.; Yuan, X. Fractal and multifractal analysis of different hydraulic flow units based on micro-CT images. J. Nat. Gas Sci. Eng. 2017, 48, 145–156. [Google Scholar] [CrossRef]
- Lei, G.; Cao, N.; Liu, D.; Wang, H. A Non-Linear Flow Model for Porous Media Based on Conformable Derivative Approach. Energies 2018, 11, 2986. [Google Scholar] [CrossRef]
- Angulo, R.F.; Alvarado, V.; Gonzalez, H. Fractal dimensions from mercury intrusion capillary tests. In Proceedings of the SPE Latin America Petroleum Engineering Conference, Caracas, Venezuela, 8–11 March 1992. [Google Scholar]
- Shen, P.; Li, K. A new method for determining the fractal dimension of pore structures and its application. In Proceedings of the 10th Offshore South East Asia Conference, Singapore, 6–9 December 1994. [Google Scholar]
- Su, P.; Xia, Z.; Qu, L.; Yu, W.; Wang, P.; Li, D.; Kong, X. Fractal characteristics of low-permeability gas sandstones based on a new model for mercury intrusion porosimetry. J. Nat. Gas Sci. Eng. 2018, 60, 246–255. [Google Scholar] [CrossRef]
- Stanley, H.E.; Meakin, P. Multifractal phenomena in physics and chemistry. Nature 1988, 335, 405. [Google Scholar] [CrossRef]
- Lai, J.; Wang, G.; Fan, Z.; Chen, J.; Wang, S.; Zhou, Z.; Fan, X. Insight into the pore structure of tight sandstones using NMR and HPMI measurements. Energy Fuels 2016, 30, 10200–10214. [Google Scholar] [CrossRef]
- Jiang, F.; Chen, D.; Chen, J.; Li, Q.; Liu, Y.; Shao, X.; Dai, J. Fractal analysis of shale pore structure of continental gas shale reservoir in the ordos basin, NW China. Energy Fuels 2016, 30, 4676–4689. [Google Scholar] [CrossRef]
- Peng, C.; Zou, C.; Yang, Y.; Zhang, G.; Wang, W. Fractal analysis of high rank coal from southeast Qinshui basin by using gas adsorption and mercury porosimetry. J. Pet. Sci. Eng. 2017, 156, 235–249. [Google Scholar] [CrossRef]
- Martínez, F.S.J.; Martín, M.A.; Caniego, F.J.; Tuller, M.; Guber, A.; Pachepsky, Y.; García-Gutiérrez, C. Multifractal analysis of discretized X-ray CT images for the characterization of soil macropore structures. Geoderma 2010, 156, 32–42. [Google Scholar] [CrossRef]
- Jouini, M.S.; Vega, S.; Mokhtar, E.A. Multiscale characterization of pore spaces using multifractals analysis of scanning electronic microscopy images of carbonates. Nonlinear Process. Geophys. 2011, 18, 941–953. [Google Scholar] [CrossRef]
- Subhakar, D.; Chandrasekhar, E. Reservoir characterization using multifractal detrended fluctuation analysis of geophysical well-log data. Phys. A Stat. Mech. Its Appl. 2016, 445, 57–65. [Google Scholar] [CrossRef]
- Ferreiro, J.P.; Vázquez, E.V. Multifractal analysis of Hg pore size distributions in soils with contrasting structural stability. Geoderma 2010, 160, 64–73. [Google Scholar] [CrossRef]
- Xie, S.; Cheng, Q.; Ling, Q.; Li, B.; Bao, Z.; Fan, P. Fractal and multifractal analysis of carbonate pore-scale digital images of petroleum reservoirs. Mar. Pet. Geol. 2010, 27, 476–485. [Google Scholar] [CrossRef]
- Wang, P.; Jiang, Z.; Ji, W.; Zhang, C.; Yuan, Y.; Chen, L.; Yin, L. Heterogeneity of intergranular, intraparticle and organic pores in Longmaxi shale in Sichuan Basin, South China: Evidence from SEM digital images and fractal and multifractal geometries. Mar. Pet. Geol. 2016, 72, 122–138. [Google Scholar] [CrossRef]
- Zhao, P.; Wang, Z.; Sun, Z.; Cai, J.; Wang, L. Investigation on the pore structure and multifractal characteristics of tight oil reservoirs using NMR measurements: Permian Lucaogou Formation in Jimusaer Sag, Junggar Basin. Mar. Pet. Geol. 2017, 86, 1067–1081. [Google Scholar] [CrossRef]
- Liu, K.; Ostadhassan, M. Quantification of the microstructures of Bakken shale reservoirs using multi-fractal and lacunarity analysis. J. Nat. Gas Sci. Eng. 2017, 39, 62–71. [Google Scholar] [CrossRef]
- Zheng, Q.; Yu, B. A fractal permeability model for gas flow through dual-porosity media. J. Appl. Phys. 2012, 111, 024316. [Google Scholar] [CrossRef]
- Yu, B.; Li, J. Some fractal characters of porous media. Fractals 2001, 9, 365–372. [Google Scholar] [CrossRef]
- Ge, X.; Fan, Y.; Li, J.; Zahid, M.A. Pore structure characterization and classification using multifractal theory—An application in Santanghu basin of western China. J. Pet. Sci. Eng. 2015, 127, 297–304. [Google Scholar] [CrossRef]
- Wang, J.; Zhang, M.; Bai, Z.; Guo, L. Multi-fractal characteristics of the particle distribution of reconstructed soils and the relationship between soil properties and multi-fractal parameters in an opencast coal-mine dump in a loess area. Environ. Earth Sci. 2015, 73, 4749–4762. [Google Scholar] [CrossRef]
- Liu, K.; Ostadhassan, M.; Kong, L. Fractal and multifractal characteristics of pore throats in the Bakken Shale. Transp. Porous Media 2019, 126, 579–598. [Google Scholar] [CrossRef]
- Zhang, T.; Li, X.; Li, J.; Feng, D.; Wu, K.; Shi, J.; Han, S. A fractal model for gas–water relative permeability in inorganic shale with nanoscale pores. Transp. Porous Media 2018, 122, 305–331. [Google Scholar]
- Lai, J.; Wang, G. Fractal analysis of tight gas sandstones using high-pressure mercury intrusion techniques. J. Nat. Gas Sci. Eng. 2015, 24, 185–196. [Google Scholar] [CrossRef]


| Samples | Permeability | Porosity | Entry Pressure | Sorting Coefficient | r50 |
|---|---|---|---|---|---|
| mD | % | MPa | um | ||
| 9 | 0.3250 | 13.3547 | 1.0760 | 1.6867 | 0.0415 |
| 13 | 0.1420 | 7.2449 | 1.4070 | 1.5212 | 0.0186 |
| 22 | 5.0690 | 12.2603 | 0.2350 | 2.5778 | 0.1444 |
| 37 | 1.1000 | 14.0306 | 1.0030 | 1.8189 | 0.0956 |
| 46 | 0.5730 | 12.3959 | 1.2150 | 1.4568 | 0.2471 |
| 52 | 1.5060 | 8.1072 | 0.8450 | 1.9145 | 0.0706 |
| 64 | 42.2990 | 16.6477 | 0.0370 | 3.3595 | 0.1688 |
| 72 | 16.5960 | 11.2793 | 0.1900 | 2.6728 | 0.1367 |
| 81 | 0.8070 | 13.3353 | 0.6400 | 2.1086 | 0.0762 |
| 93 | 4.8510 | 14.9307 | 0.1970 | 2.6960 | 0.0285 |
| 105 | 5.3600 | 11.0967 | 0.1880 | 2.5586 | 0.0848 |
| 142 | 0.5420 | 6.3134 | 1.4500 | 1.4509 | 0.0165 |
| 146 | 0.2420 | 9.6940 | 0.9620 | 1.7438 | 0.0320 |
| Samples | D1 | Correlation Coefficient R2 | D2 | Correlation Coefficient R2 | Dsw |
|---|---|---|---|---|---|
| 9 | 5.1787 | 0.925 | 3.301 | 0.997 | 4.138 |
| 13 | 6.8716 | 0.946 | 3.302 | 0.985 | 4.592 |
| 22 | 5.9464 | 0.978 | 3.217 | 0.971 | 3.814 |
| 37 | 5.0279 | 0.920 | 3.319 | 0.957 | 4.092 |
| 46 | 7.1014 | 0.951 | 3.156 | 0.898 | 4.831 |
| 52 | 5.0715 | 0.948 | 3.276 | 0.939 | 3.989 |
| 64 | 4.1698 | 0.999 | 3.223 | 0.950 | 3.422 |
| 72 | 4.3472 | 0.927 | 3.195 | 0.968 | 3.638 |
| 81 | 4.8489 | 0.919 | 3.207 | 0.957 | 4.000 |
| 93 | 4.793 | 0.985 | 3.211 | 0.955 | 3.604 |
| 105 | 4.4449 | 0.998 | 3.216 | 0.989 | 3.636 |
| 142 | 6.3375 | 0.942 | 3.365 | 0.983 | 4.229 |
| 146 | 5.7515 | 0.992 | 3.281 | 0.999 | 4.367 |
| q | Correlation Coefficient R2 | |||
|---|---|---|---|---|
| Sample 52 | Sample 64 | Sample 72 | Sample 142 | |
| −20 | 0.9993 | 0.9999 | 0.9861 | 0.9947 |
| −15 | 0.9994 | 0.9999 | 0.9870 | 0.9966 |
| −10 | 0.9996 | 0.9999 | 0.9890 | 0.9978 |
| −5 | 0.9998 | 1.0000 | 0.9945 | 0.9982 |
| 0 | 1.0000 | 1.0000 | 1.0000 | 1.0000 |
| 5 | 0.9957 | 0.9718 | 0.9829 | 0.9616 |
| 10 | 0.9937 | 0.9701 | 0.9820 | 0.9528 |
| 15 | 0.9928 | 0.9700 | 0.9820 | 0.9499 |
| 20 | 0.9924 | 0.9700 | 0.9820 | 0.9485 |
| Sample | D(0) | D(1) | D(2) | D(1)/D(2) | Dmin | Dmax | △D |
|---|---|---|---|---|---|---|---|
| 9 | 1.0082 | 0.9198 | 0.8314 | 0.9123 | 0.6934 | 1.3620 | 0.6686 |
| 13 | 0.9922 | 0.8695 | 0.7408 | 0.8764 | 0.5629 | 1.5441 | 0.9812 |
| 22 | 1.3816 | 1.1515 | 0.9762 | 0.8335 | 0.7323 | 2.1828 | 1.4506 |
| 37 | 1.0343 | 0.9346 | 0.8563 | 0.9036 | 0.7185 | 1.5000 | 0.7815 |
| 46 | 1.1469 | 1.0517 | 1.0171 | 0.9170 | 0.9096 | 1.6289 | 0.7193 |
| 52 | 1.0641 | 0.9773 | 0.9124 | 0.9185 | 0.7718 | 1.5227 | 0.7509 |
| 64 | 1.8827 | 1.4907 | 1.1157 | 0.7918 | 0.7073 | 2.3974 | 1.6901 |
| 72 | 1.7577 | 1.2061 | 0.9716 | 0.6862 | 0.6237 | 2.7235 | 2.0998 |
| 81 | 1.1421 | 0.9624 | 0.7910 | 0.8426 | 0.5907 | 1.6600 | 1.0692 |
| 93 | 1.3835 | 1.1169 | 0.8027 | 0.8073 | 0.5586 | 1.8413 | 1.2826 |
| 105 | 1.4816 | 1.1465 | 0.8809 | 0.7739 | 0.6233 | 2.1664 | 1.5431 |
| 142 | 0.9918 | 0.8520 | 0.7109 | 0.8590 | 0.5445 | 1.7734 | 1.2289 |
| 146 | 1.0658 | 0.9348 | 0.8195 | 0.8771 | 0.6215 | 1.4359 | 0.8144 |
| Sample | amin | amax | △a | f(amin) | f(amax) | △f(a) | R | f(a)max |
|---|---|---|---|---|---|---|---|---|
| 9 | 0.6795 | 1.3962 | 0.7167 | 0.4158 | 0.6772 | 0.2614 | 0.1644 | 1.0082 |
| 13 | 0.5460 | 1.5946 | 1.0486 | 0.2234 | 0.5347 | 0.3113 | 0.1183 | 0.9922 |
| 22 | 0.7046 | 2.2587 | 1.5541 | 0.1782 | 0.6656 | 0.4874 | 0.2530 | 1.3816 |
| 37 | 0.7024 | 1.5436 | 0.8412 | 0.3967 | 0.6277 | 0.2311 | 0.0933 | 1.0343 |
| 46 | 0.8911 | 1.6651 | 0.7740 | 0.5395 | 0.9048 | 0.3653 | 0.0938 | 1.1469 |
| 52 | 0.7515 | 1.5680 | 0.8165 | 0.3654 | 0.6184 | 0.2530 | 0.0368 | 1.0641 |
| 64 | 0.6719 | 2.4498 | 1.7779 | 0.0003 | 1.3485 | 1.3482 | 0.6560 | 1.8827 |
| 72 | 0.5925 | 2.8338 | 2.2413 | 0.0000 | 0.5185 | 0.5185 | 0.4763 | 1.7577 |
| 81 | 0.5713 | 1.7032 | 1.1319 | 0.2018 | 0.7956 | 0.5938 | 0.3636 | 1.1421 |
| 93 | 0.5385 | 1.8867 | 1.3482 | 0.1557 | 0.9335 | 0.7778 | 0.5375 | 1.3835 |
| 105 | 0.5994 | 2.2303 | 1.6310 | 0.1442 | 0.8874 | 0.7432 | 0.4671 | 1.4816 |
| 142 | 0.5280 | 1.8444 | 1.3164 | 0.2142 | 0.3526 | 0.1384 | -0.0823 | 0.9918 |
| 146 | 0.6001 | 1.4712 | 0.8711 | 0.1931 | 0.7297 | 0.5366 | 0.3952 | 1.0658 |
© 2019 by the authors. Licensee MDPI, Basel, Switzerland. This article is an open access article distributed under the terms and conditions of the Creative Commons Attribution (CC BY) license (http://creativecommons.org/licenses/by/4.0/).
Share and Cite
Su, P.; Xia, Z.; Wang, P.; Ding, W.; Hu, Y.; Zhang, W.; Peng, Y. Fractal and Multifractal Analysis of Pore Size Distribution in Low Permeability Reservoirs Based on Mercury Intrusion Porosimetry. Energies 2019, 12, 1337. https://doi.org/10.3390/en12071337
Su P, Xia Z, Wang P, Ding W, Hu Y, Zhang W, Peng Y. Fractal and Multifractal Analysis of Pore Size Distribution in Low Permeability Reservoirs Based on Mercury Intrusion Porosimetry. Energies. 2019; 12(7):1337. https://doi.org/10.3390/en12071337
Chicago/Turabian StyleSu, Penghui, Zhaohui Xia, Ping Wang, Wei Ding, Yunpeng Hu, Wenqi Zhang, and Yujie Peng. 2019. "Fractal and Multifractal Analysis of Pore Size Distribution in Low Permeability Reservoirs Based on Mercury Intrusion Porosimetry" Energies 12, no. 7: 1337. https://doi.org/10.3390/en12071337
APA StyleSu, P., Xia, Z., Wang, P., Ding, W., Hu, Y., Zhang, W., & Peng, Y. (2019). Fractal and Multifractal Analysis of Pore Size Distribution in Low Permeability Reservoirs Based on Mercury Intrusion Porosimetry. Energies, 12(7), 1337. https://doi.org/10.3390/en12071337