Article

Impact on Reduction of Pollutant Emissions from Passenger Cars when Replacing Euro 4 with Euro 6d Diesel Engines Considering the Altitude Influence

1
CMT–Motores Térmicos, Universitat Politècnica de València, 46022 València, Spain
2
HORIBA Europe GmbH, D-64293 Darmstadt, Germany
*
Author to whom correspondence should be addressed.
Energies 2019, 12(7), 1278; https://doi.org/10.3390/en12071278
Submission received: 18 March 2019 / Revised: 29 March 2019 / Accepted: 31 March 2019 / Published: 3 April 2019

Abstract

:
The impact of Euro 4 compression ignition engines over the air quality in Europe has been analyzed in this work by comparing them with Euro 6d emissions regulation. The Euro 6d diesel engine has been chosen as the preferred replacement according to its advantages in global warming potential (GWP) emissions, like methane hydrocarbons (MHC) and CO2, with respect to Euro 6d petrol-based powertrains. The motivation for this study is that the effects of the emissions reduction policies, as the implementation of the regulation Euro 6d, are necessarily limited due to the great number of passenger cars still in circulation that were homologated under Euro 4 or older standards. To address the impact of the old vehicle pool, a Worldwide harmonized Light-vehicles Test Cycle (WLTC) has been used to analyze the performance and pollutant emissions of a Euro 4 diesel engine in altitude conditions. This driving cycle and engine are considered as a baseline for the subsequent discussion, where the altitude plays a key role because of the European geography. It forces passenger cars to drive over sea level during a significant number of trips. Thus, an analysis of how significant would be the impact of energy policies promoting the substitution of the pre-Euro 5 diesel fleet (>10 years old) by modern Euro 6d engines in the short term on the pollutants and GWP emissions reduction is presented.

Graphical Abstract

1. Introduction

As new internal combustion engines emission regulations are implemented, the automotive engine manufacturers look for new control strategies and technologies to face the challenge of the increasingly restrictive limits to pollutant emissions [1]. Obviously, the benefits of this research are limited to new vehicle models appearing in the market. Nevertheless, according to data from the European Automobile Manufacturers Association (ACEA) in 2017 [2], when Euro 6d-Temp came into force for the new types of passenger cars, 174 million cars circulating were Euro 4 or older and 41% of them were diesel engines. They are about 71 million and at least 10 years older than the nowadays Euro 6d-Temp commercialized diesel engines. This is a considerable number of vehicles that are circulating without fulfilling modern regulations. Therefore, it is important to analyze how these vehicles respond at the light of the nowadays homologation procedures.
The Real Driving Emissions (RDE) test includes altitude as a new relevant homologation variable. In parallel, Worldwide harmonized Light-vehicles Test Cycle (WLTC) [3] is used as a baseline to represent real driving conditions at engines laboratories. It is generally accepted that the fuel consumption and emissions of internal combustion engines are deeply affected by the altitude conditions [4,5]. This is due to the control strategy of the turbocharger or the combustion, which makes the engine operate closer to its mechanical limits. The engine power is even severely affected by the altitude despite the boosting system availability [5]. The turbocharger strategy increases the backpressure to keep the boosting, which increases the backflows in the exhaust ports and the pollutant emissions [6]. In addition to the effect that the in-cylinder pressure has over the behavior of the injected fuel spray, the increase in altitude lowers the pressure and the density of the air despite the turbocharging [7]. Consequently, a decrease of the spray angle is found [8] and the spray penetration increases. By contrast, the lower density reduces the fuel drop size giving, as a result, lower coalescence [9,10] and improving the evaporation of the fuel and its mixture with the air.
There are different options for testing an engine in order to analyze the altitude-induced phenomena and their effects on the engine performance and emissions. The first one is to perform real driving tests. However, this approach involves very high costs, low accuracy, low repeatability, and provides limited understanding of the governing phenomena. The hypobaric chambers emerge as an option, which solves the drawbacks of the real driving tests while keeping the vehicle environment as close as possible to real conditions. This option has been the most commonly used in the past and during the initial phases of the engine calibration. Nevertheless, it includes drawbacks: Low availability, due to the extensive planning and investment necessary for its construction, and high energy consumption. In addition, working inside hypobaric chambers comprises a health risk since the human body cannot withstand continuous pressure changes [11]. This limits the number of hours that the driver can be inside the chamber carrying out dyno tests. Lastly, there is the option of using an altitude simulator, which generates the desired altitude inside the intake and exhaust engine pipes, while keeping the rest of the engine at room conditions. This characteristic allows the study of the engine behavior in altitude without the limitations of the previously mentioned facilities. An example of this kind of equipment is the one presented by Testa et al. [12], in which the engine is connected to two root compressors, which control the environment working pressure. The volumetric compressor in the engine intake works as a throttling valve to generate vacuum while the one in the exhaust tailpipe end generates the flow movement. Contrarily, when simulating overpressure, the compressor moving the flow is the one in the intake while the exhaust one is acting as a backpressure valve.
This paper proposes combining altitude and WLTC in a number of experiments performed in laboratory-controlled testing conditions as representative as possible of RDE tests for old Euro 4 diesel engines, which are investigated in this work. A Euro 4 turbocharged diesel engine has been tested performing the WLTC cycle and connected to the altitude simulator HORIBA MEDAS (Multifunctional Efficient Dynamic Altitude Simulator) [13,14,15] to emulate different altitudes. The operating principle of the atmospheric simulator, which is composed of MEDAS and two performance extension modules (MEDAS Temperature Module (MTM) and MEDAS Humidity Module (MHM)) is explained in detail in References [6,16,17]. These three systems will be referred hereinafter as altitude simulator (AS). AS is tasked to control the three main psychrometric variables of the atmosphere: Pressure, temperature, and humidity. The use of the AS has been previously validated against a hypobaric chamber [17] by carrying out steady-state tests covering most of an engine working map. Also, its control stability while coupled with an engine performing load and speed cycles has been validated in two different situations: Keeping constant altitude, i.e., simulating a plateau [6], and reproducing the climb and descent of a mountain [17]. The results of these laboratory-controlled cycles are used to identify the primary causes of the pollutant peaks during altitude driving. As an important corollary, this kind of test allows quantifying and concluding that just the replacement of Euro 4 fleet would mean a very important reduction of pollutants emission from passenger cars.
Therefore, this study has been carried out to deeply analyze the behavior of a Euro 4 diesel engine when working at sea level and in different altitude conditions. Also, it is an objective to analyze the performance of Euro 4 vehicles in circulation under the current emission regulation standard cycle (WLTC). This combination of objectives has been conceived as an innovative, fast, and straightforward way to calculate the reduction of current pollutant emissions if the Euro 4 passenger-car diesel fleet was replaced. The inclusion of the altitude scenario provides further insights in the analysis by considering the average topography of the EU market. The calculation of this reduction of pollutant emissions basing the analysis on realistic driving conditions (WLTC plus altitude) can provide valuable information for opinion makers and authorities to encourage political actions towards vehicle fleet renewal.
In the first section, a study about the general topography of the EU has been carried out. This is followed in the second section by the description of the engine test bench, the AS, and the instrumentation used. Afterwards, in the third section, the engine results obtained from the tests carried out are analyzed and discussed. Finally, a study of the impact over the European and Spanish local and global emissions of replacing the current Euro 4 diesel vehicles is shown in the fourth and fifth sections.

2. Altitude Conditions in Europe

All around the world, people have been developing civilization in lower altitude zones or directly at the coast. However, there are many settlements that are located at higher altitudes. This situation is what Cohen et al. analyzed in Reference [18], from which it can be concluded that in 1994, 75.7% of the global population was located below 500 m over sea level, 17.9% of the population between 500 and 1500 m, and 6.4% over 1500 m. Figure 1 represents the data recorded by Cohen. The exponential distribution of the world population against altitude can be observed, highlighting that almost half the population is located on the coast (0 m). Figure 1 also shows, in a logarithmic scale, the percentage of the population that is located in the four levels of altitude used in this work to discretize the problem: Sea level (<500 m), 1000 m (500–1500 m), 2000 m (1500–2500 m), and 3000 m over sea level (>2500 m), respectively.
For the particular case of the European population, the UNEP-World Conservation Monitoring Centre has carried out a study collecting the demographic characteristics of the European population according to the geographical level of each region [19], from which some meaningful conclusions can be extracted. One of them is that around 20% of the European surface is above 1000 m over sea level, being some roads of the Alps and the Pyrenees above 2000 m high, as illustrated in Figure 2A. Another conclusion taken directly from this report is that the 19.1% of the European population resides above 1000 m of altitude. This represents almost 100 million people living in altitude conditions. The authors of Reference [19] concluded that (sic) “on average, almost 20% of the total population of the study area live in mountain ranges (excluding enclaves); another 25% live within 10 km of massifs; another 5% within 20 km; and a further 10% within 50 km. Thus, about 60% of the overall population in the study area lives in or close to massifs”. This interesting conclusion suggests that 60% of population have frequent trips around massif areas as graphically shown in Figure 2B.
Additionally, a simple study about the largest population centers in altitude in Europe is shown in Figure 3. Figure 3 illustrates with a clear trend how the population of the cities decreases as the altitude increases. The exception is Madrid (Spain), which is one of the largest cities in Europe but is located close to 700 m over sea level. This location emphasizes the interest for the impact of traffic in altitude conditions significantly. The data have been divided into sea-level cities, i.e., cities at an altitude lower than 500 m and cities in altitude, i.e., above 500 m. Looking at the shadowed areas, it can be observed that 65% of the studied population is located below 500 m, even considering a smaller sample of cities near sea level (4 cities) than that used for cities in height (13 cities).
Considering the population distribution presented by these different approaches, it can be concluded that all the results are comparable and that the traffic in altitude represents a very significant portion of the global European traffic. This conclusion supports the need to quantify and analyze the behavior, performance, and pollutant emissions of the automotive engines when working in altitude.

3. Test Bench Description

The test campaign performed in this paper is composed of WLTCs performed at four given altitudes: 0, 1000, 2000, and 3000 m over sea level.
Firstly, the engine used, whose main data are depicted in Table 1, has been coupled with an asynchronous brake. Secondly, the engine intake and exhaust ducts have been connected to the AS, which ensures that the atmospheric conditions inside the intake and exhaust ducts of the engine are equal to those representing desired altitudes. Therefore, all engine internal and external surfaces withstand a pressure difference, which forces the reinforcement of the soft rubber parts in the intake line to avoid their collapse. Moreover, the exhaust line and the air-box have been completely sealed to prevent vacuum loss leading to room air insertion or the dilution of the emissions sample. Finally, the engine control unit (ECU) pressure sensor must either be connected to a vacuum or have its value at the ECU modified, due to being at room pressure when simulating altitude with the AS.
In Figure 4, the connection between the engine and the AS is represented. Elements A and B in Figure 4 are the connections to the engine intake and the exhaust line, respectively. Additionally, a connection to the engine sump has been added (element C) to match the pressure inside the sump with the one at the inlet of the turbocompressor in order to avoid oil leaks from the turbocharger bearings. Furthermore, an exhaust gas analyzer HORIBA Mexa One has been connected downstream of the diesel oxidation catalyst (DOC) and upstream of the diesel particulate filter (DPF) to measure the gaseous pollutant concentration. An opacimeter AVL 439 was used to measure the opacity downstream of the DPF in order to further estimate the soot mass using the correlations proposed by [20].

4. Results and Discussion

4.1. Analysis of the Altitude Simulator (AS) Impact on Engine Behaviour

Previous to the discussion of the engine, results are needed to put the focus on the control of the atmospheric variables during the tests. Figure 5 shows the result of the pressure and temperature control carried out by the AS for the combustion air of the engine, during a WLTC homologation cycle at the four considered altitudes. Furthermore, in each figure, in which instantaneous engine results are shown, the vehicle speed profile doing a WLTC has been included, associated with the right auxiliary axis speed (km/h).
Figure 5A shows the AS pressure control during the WLTC homologation cycle at the four different altitudes. For every altitude tested, the average deviation of pressure with respect to the set point is maintained around 0 mbar. Moreover, if the blue line (3000 m over sea level) is compared with the yellow line (1000 m), it can be seen that the peaks in pressure increased when the altitude did. This was caused by the sudden variation in the demand of air by the engine while performing aggressive changes, since the reduction of the air density as the altitude increases leads to higher pressure losses. However, it must be noted that the pressure peaks did not exceed 20 mbar, being that most of them stayed below 15 mbar (150 m) and non-sustained in time. It is worth highlighting that the signal was recorded at 10 Hz, so no filtering was applied to the signal and any sudden peak was detected.
On the other hand, Figure 5B shows that the engine dynamics did not affect the temperature control, whose deviation was always kept below ±1 °C with respect to the set point.
Figure 6 shows the compressor inlet pressure during WLTC at sea level in two different configurations: Breathing air from the test cell in Valencia (Spain), which corresponds to 0 m over sea level, and connected to AS to emulate sea level pressure. In Figure 6, AS pressure control upstream of the intake filter is also represented. It can be concluded that the behavior of the pressure at the compressor inlet is almost equal when the engine is connected to AS than when it is not. The pressure peaks of the same order of magnitude in both cases. Therefore, this fact can be used to confirm that the use of AS does not impact the pressure values at the compressor inlet. As already concluded in Reference [6], the variations observed in inlet pressure are attributed to the pressure losses in the filter and the mass flow variations. With respect to the high frequency oscillations in Figure 6, these are attributed to electrical noise coming from the measurement chain devices.

4.2. Turbochager and Exhaust Gases Recirculation (EGR) Systems Performance at Altitude

Most of the altitude impact on the engine performance, both in terms of torque and gaseous emissions (CO2 and pollutants), can be explained by the impact of the altitude in the control of Euro 4 engines over two systems: The variable geometry turbine (VGT) of the turbocharger and the EGR valve.
The use of EGR for NOx emissions control is one of the most determining strategies in the Euro 4 engines performance at altitude. The position of the EGR control valve is shown in Figure 7, in which it can be seen that the EGR valve at 1000 m of altitude was more closed than at sea level (Figure 7A), and it completely closed over at 2000 m (Figure 7B). This strategy greatly affected the emissions formation, mainly NOx, and the engine performance when it is working in altitude. In addition, the temperature increased at the turbine inlet and was reached more easily the materials limit.
The altitude also greatly affected the performance of the turbocharger, whose control increased the backpressure and thus the pumping losses to keep the boosting pressure at the desired value. The differences in boost (Figure 8A) and back (Figure 8B) pressure with respect to the sea level, used as a reference, have been plotted in Figure 8 for every altitude. If the focus is put on the boost pressure change (Δp2), Figure 8A shows how it became negative with the altitude (p2 at 3000 m is lower than at 1000 m). Nevertheless, during the aggressive acceleration phases, the closed loop control of the VGT closed the turbine stator blades, increasing the power in the turbocharger to reach similar (Δp2 = 0) or even higher (Δp2 > 0) boosting pressure. Therefore, the back-pressure change (Δp3) had a similar behavior, i.e., it became negative as the altitude increased but showed sudden steps to the positive region when the closed loop worked. This way, the set point of p2 can be achieved due to the closing of the VGT stator blades. This boosting pressure control in closed loop greatly increased the engine pumping losses, which, if not properly calibrated, can lead to loss of performance, even with a higher boosting pressure.
Accordingly, both the pressure ratio for the compressor (Figure 8C) and the turbine (Figure 8D) generally increased with the altitude, due to the drop in ambient pressure and the closed loop control of the VGT. The increase in turbine pressure ratio due to altitude allowed the VGT to extract more power from the exhaust gases, which partially mitigates the impact of altitude in both boost pressure and pumping losses. This mitigation is not achieved during engine and turbocharger accelerations. Much higher turbocharger speed is required during engine accelerations to provide the extra pressure ratio demanded to the compressor by the engine control. In these cases, the penalty in pumping losses due to VGT closing is more than significant, as previously stated. The cause is the turbocharger inertia, which lag the required speeds demanding to the control an aggressive closing of the VGT blades.
Lastly, the compressor operation points during the WLTC cycle at the four tested altitudes have been plotted in Figure 9 on the turbo compressor map. The altitude increase caused an increase in the turbo speed, approaching the upper speed limit at 3000 m over sea level. Moreover, the increase in altitude caused the compressor to approach surge limit more riskily during the engine decelerations, due to a high increment of compression ratio at reduced mass flows. It is worth noting that such a risky approach to surge limit happens despite the high pressure EGR was greatly reduced at 1000 m and stayed completely closed at 2000 m and 3000 m, as shown in Figure 7. In fact, the reduction in surge margin is one reason to close the EGR under altitude operation.

4.3. Air Mass Flow Rate and Fuel Consumption

Following, the deviation with respect to sea level of the air mass (kg) consumed by the engine is represented in Figure 10 where it is shown that the air consumption of the engine is deeply related with the EGR valve control strategy. The first phenomena that can be identified occurred when comparing the sea level reference (black line) with 1000 m test (yellow line), in which the air mass increased due to the EGR closing still keeping low p2 reductions as shown in Figure 7A and Figure 8.
If the altitude is further increased to 2000 m over sea level (orange line), the effect of a lower atmosphere pressure starts to heavily impact on p2. Consequently, the intake charge density is directly affected. The air mass decreases with respect to the 1000 m test. Nevertheless, when the 2000 m test is compared against the sea level reference, it can be observed that the increase in fresh air mass due to closing the EGR is higher than the decrease caused by the lowered atmospheric pressure. Lastly, at 3000 m over sea level, the decrease of air density caused the intake fresh air mass to decrease, even with respect to sea level and despite of the fact that the EGR valve is completely closed.
With respect to the fuel consumption (CO2 emissions), Figure 11 shows that the fuel consumption (kg) dropped when increasing the altitude up to 2000 and 3000 m. This is, again, due to the actual calibration of the EGR valve. It reduces the amount of recirculated exhaust gases to protect the turbocharger from reaching physical limits such as surge, over speed, or compressor outlet temperature. Therefore, higher equivalence ratio and higher cycle efficiency, due to lower intake charge temperature, are obtained during more than 25 min of the WLTC duration at 2000 and 3000 m. The absence of high pressure EGR increases the exhaust mass flow available for the turbine and the higher altitude increases the pressure ratio in the turbine. Both contribute to increase the power recovered by the VGT and to avoid aggressive VGT closing during little dynamic phases. Therefore, the fuel consumption becomes reduced. This is supported by the 1000 m test. In this case, the 25 min phase of fuel consumption reduction did not happen since the EGR valve was opened around 40% (Figure 7).
It is worth noting that within the first 25 min, the reduction of fuel with respect to the reference was more aggressive during some engine accelerations, causing drop peaks of fuel that increase in magnitude with the altitude. This is caused by drops of boost and back pressure (see p2 and p3 in Figure 8A,B), which happen when turbocharger speed is reduced during engine pedal release phases of the WLTC. Further acceleration of the turbocharger needs aggressive VGT closing, and fuel consumption is, again, increased.
At the last part of WLTC (between 25 and 30 min), during the extra high velocity phase of the cycle, the fuel consumption grew dramatically at 2000 m and 3000 m. The previous reduction of brake-specific fuel consumption (BSFC) was quickly lost and, finally, more fuel was spent at 3000 m and low reductions are seen at 2000 m. This is a consequence of twofold. First, the EGR valve at sea level is already quite or fully closed (Figure 7) so no benefits from further EGR closing at altitude are obtained; and second, the strategy adopted for controlling p2 with the VGT in closed loop dramatically increases pumping losses in altitude (Figure 8B,D). The energy needed to overcome the turbocharger lag is responsible for the BSFC increment. The lag is caused by the highly dynamic processes involved in engine acceleration, which the turbocharger can barely follow, and therefore, the high turbocharger speed accelerations are needed to keep boost pressure level at 2000 m and 3000 m (Figure 9). At these high turbo speeds, it is also easier to reach the risky operational zones of the turbocharger unit (surge or over speed).

4.4. Pollutants Emission

Following with the pollutant emissions during the cycle, the accumulated THC, NOx, CO, and Soot referenced to sea level data are presented in Figure 12. Starting with THC (Figure 12A), it can be seen how the generation of THC greatly increases with the altitude. The decreased air density (Figure 8A) increased the penetration of the fuel spray, causing a higher jet-to-wall impingement that led to higher unburned hydrocarbons.
In Figure 12B, it is possible to see that the generation of NOx increased with the altitude due to the high-pressure EGR closing. This is clear when looking first at the 1000 m test data, which greatly increased even there were still some EGR. Also, when comparing 2000 m and 3000 m test data with 1000 m, the penalty in NOx emissions due to the absence of EGR had more weight than other factors. These other factors are twofold: The increase in mass flow at 2000 m and the reduction in fuel consumption at 2000 m and 3000 m. Both additional factors caused a rise in the equivalent air-to-fuel ratio and lower maximum in-cylinder temperature. But they did not lead to a reduction of NOx emitted due to the absence of EGR.
With respects to the CO emissions, Figure 12C shows how the accumulated CO increased in the 1000 m test but decreased in the 2000 m and 3000 m tests. The appearance of local rich zones, which happened during the engine accelerations, were the cause of the sudden increases of the CO throughout the tests. However, the CO emissions were reduced at 2000 m and 3000 m during the middle part of the WLTC (and a couple of accelerations at 1000 m) due to the reduction of fuel consumption and the consequent decrease of the equivalence ratio. Especially during the pedal release phases and further accelerations, which are in absence of EGR, the amount of oxygen available was increased (mainly at 2000 m), the combustion temperature was increased, and the amount of carbon involved in the combustion was reduced. Thus, the total CO emitted was reduced. Also, in Figure 12A local reductions in the THC emitted at 2000 m and 3000 m tests, at about 10, 13, and 20 min can be observed, which support the previous analysis. From previous discussion, it can be concluded that the DOC working point and efficiency are not the main cause for the observed CO reduction.
Lastly, Figure 12D represents the increase of soot generation with the altitude, which is mainly attributed to fuel jet impingement in the combustion chamber walls and fuel cracking. Fuel impingement was also claimed in the case of THC that follows the same path of increment than soot mass.
As a summary, Figure 13 presents the cumulative values of the pollutants and CO2 emitted in (g/km) for every altitude differentiating between each of the four WLTC stages and for the whole WLTC. The WLTC stages are called low, medium, high, and extra high, which represents urban, interurban road, conventional road, and highway, respectively.
Concerning the limit lines shown in Figure 13, the values are listed in Table 2. The THC emission limit has been obtained by subtracting the regulated THC + NOx figure from the regulated NOx emission level, since only the compound emission of THC and NOx is regulated by the Euro 6d.
On the one hand, THC emissions (Figure 13A) increased on average with the altitude for every WLTC phase, but without reaching the limits imposed by the Euro 6d regulation due to the abatement in the DOC.
On the other hand, all the other pollutants amply surpassed the limits set by the Euro 6d regulation. CO (Figure 13B) showed especially high values at 1000 m, where the EGR was still partially open, and the increase in altitude increased the time that the equivalence ratio was too low, worsening the efficiency of the combustion process. CO2 (Figure 13C) decreased with the altitude, following the trend of the fuel consumption. However, it clearly exceeds the limit. It is worth noting that the CO2 emission limit was set at the level in which the Euro 6d started, including extra taxes to the sale of vehicles for emitting too much CO2, which is calculated as:
C O 2 = T a r g e t + a × ( M M O )
where a ,   T a r g e t ,   and   M O are coefficients adopted from the regulation [3] and M has been assumed as the average for passenger cars engines (1273 kg) [21].
In the case of the average value for NOx emissions (Figure 13D), it increased with the altitude due to the closing of the EGR. It must be noted that the limit for NOx emissions stated in Euro 6d was exceeded in one order of magnitude by the Euro 4 engine, in every stage of the WLTC cycle, and not only at altitude but even at sea level.
With respect to the soot emission (Figure 13E) even when measuring after the DPF, the soot mass emitted was quite clearly over the limit imposed by the Euro 6d regulations at sea level, and it greatly increased with the altitude.
Lastly, the joint emissions of THC and NOx, as regulated, are presented in Figure 13F, in which it is clearly shown that the emission levels were way over the limit set by the Euro 6d regulation, even when there was a wide margin until the regulation limit for THC, as shown in Figure 13A.

5. Analysis of the Benefits of Euro 4 Diesel Engines Replacement in European Roads and Cities

In 2017, the European Automobile Manufacturers Association carried out a study about the European automotive fleet [2], from which an estimation of the number of Euro 4 diesel vehicles that are currently circulating through European roads and cities has been obtained.
The information extracted about the European passenger car fleet from [2] is as follows:
  • Proportion of passenger cars with a diesel engine: 41%.
  • Total number of passenger cars circulating in the European Union: 252,043,348 cars.
  • Number of vehicles in use in the European Union, which were registered for first time before 2007: 123,433,397 cars.
  • Number of vehicles in use in the European Union, split by year of first registration from 2007 up to 2015: 128,609,961 cars.
Then, taking into account the period of application of the Euro 4, 5, and 6 legislations (Table 3), the number of cars registered for the first time during a given Euro regulation period can be calculated. It is done by adding the passenger cars currently in use that were registered in the years that make up its application period, and assuming that until September 2009, 67% of the sales of that year had been made.
Therefore, the proportion of Euro 4 or older diesel passenger cars currently circulating through the European Union can be calculated following Equation (2), where R e g n e w is the number of vehicles in use in the EU which were registered in 2007, 2008, and from January to September of 2009 (67% of 2009 total registrations); R e g > 10 is the number of passenger cars currently in use in the EU, which were registered for first time before 2007; C I % is the proportion of diesel passenger cars in the EU; and P c t o t a l is the total number of passenger cars circulating through the EU.
P r o p o r t i o n   [ % ] = ( R e g n e w + R e g > 10 ) × C I % P c t o t a l 100
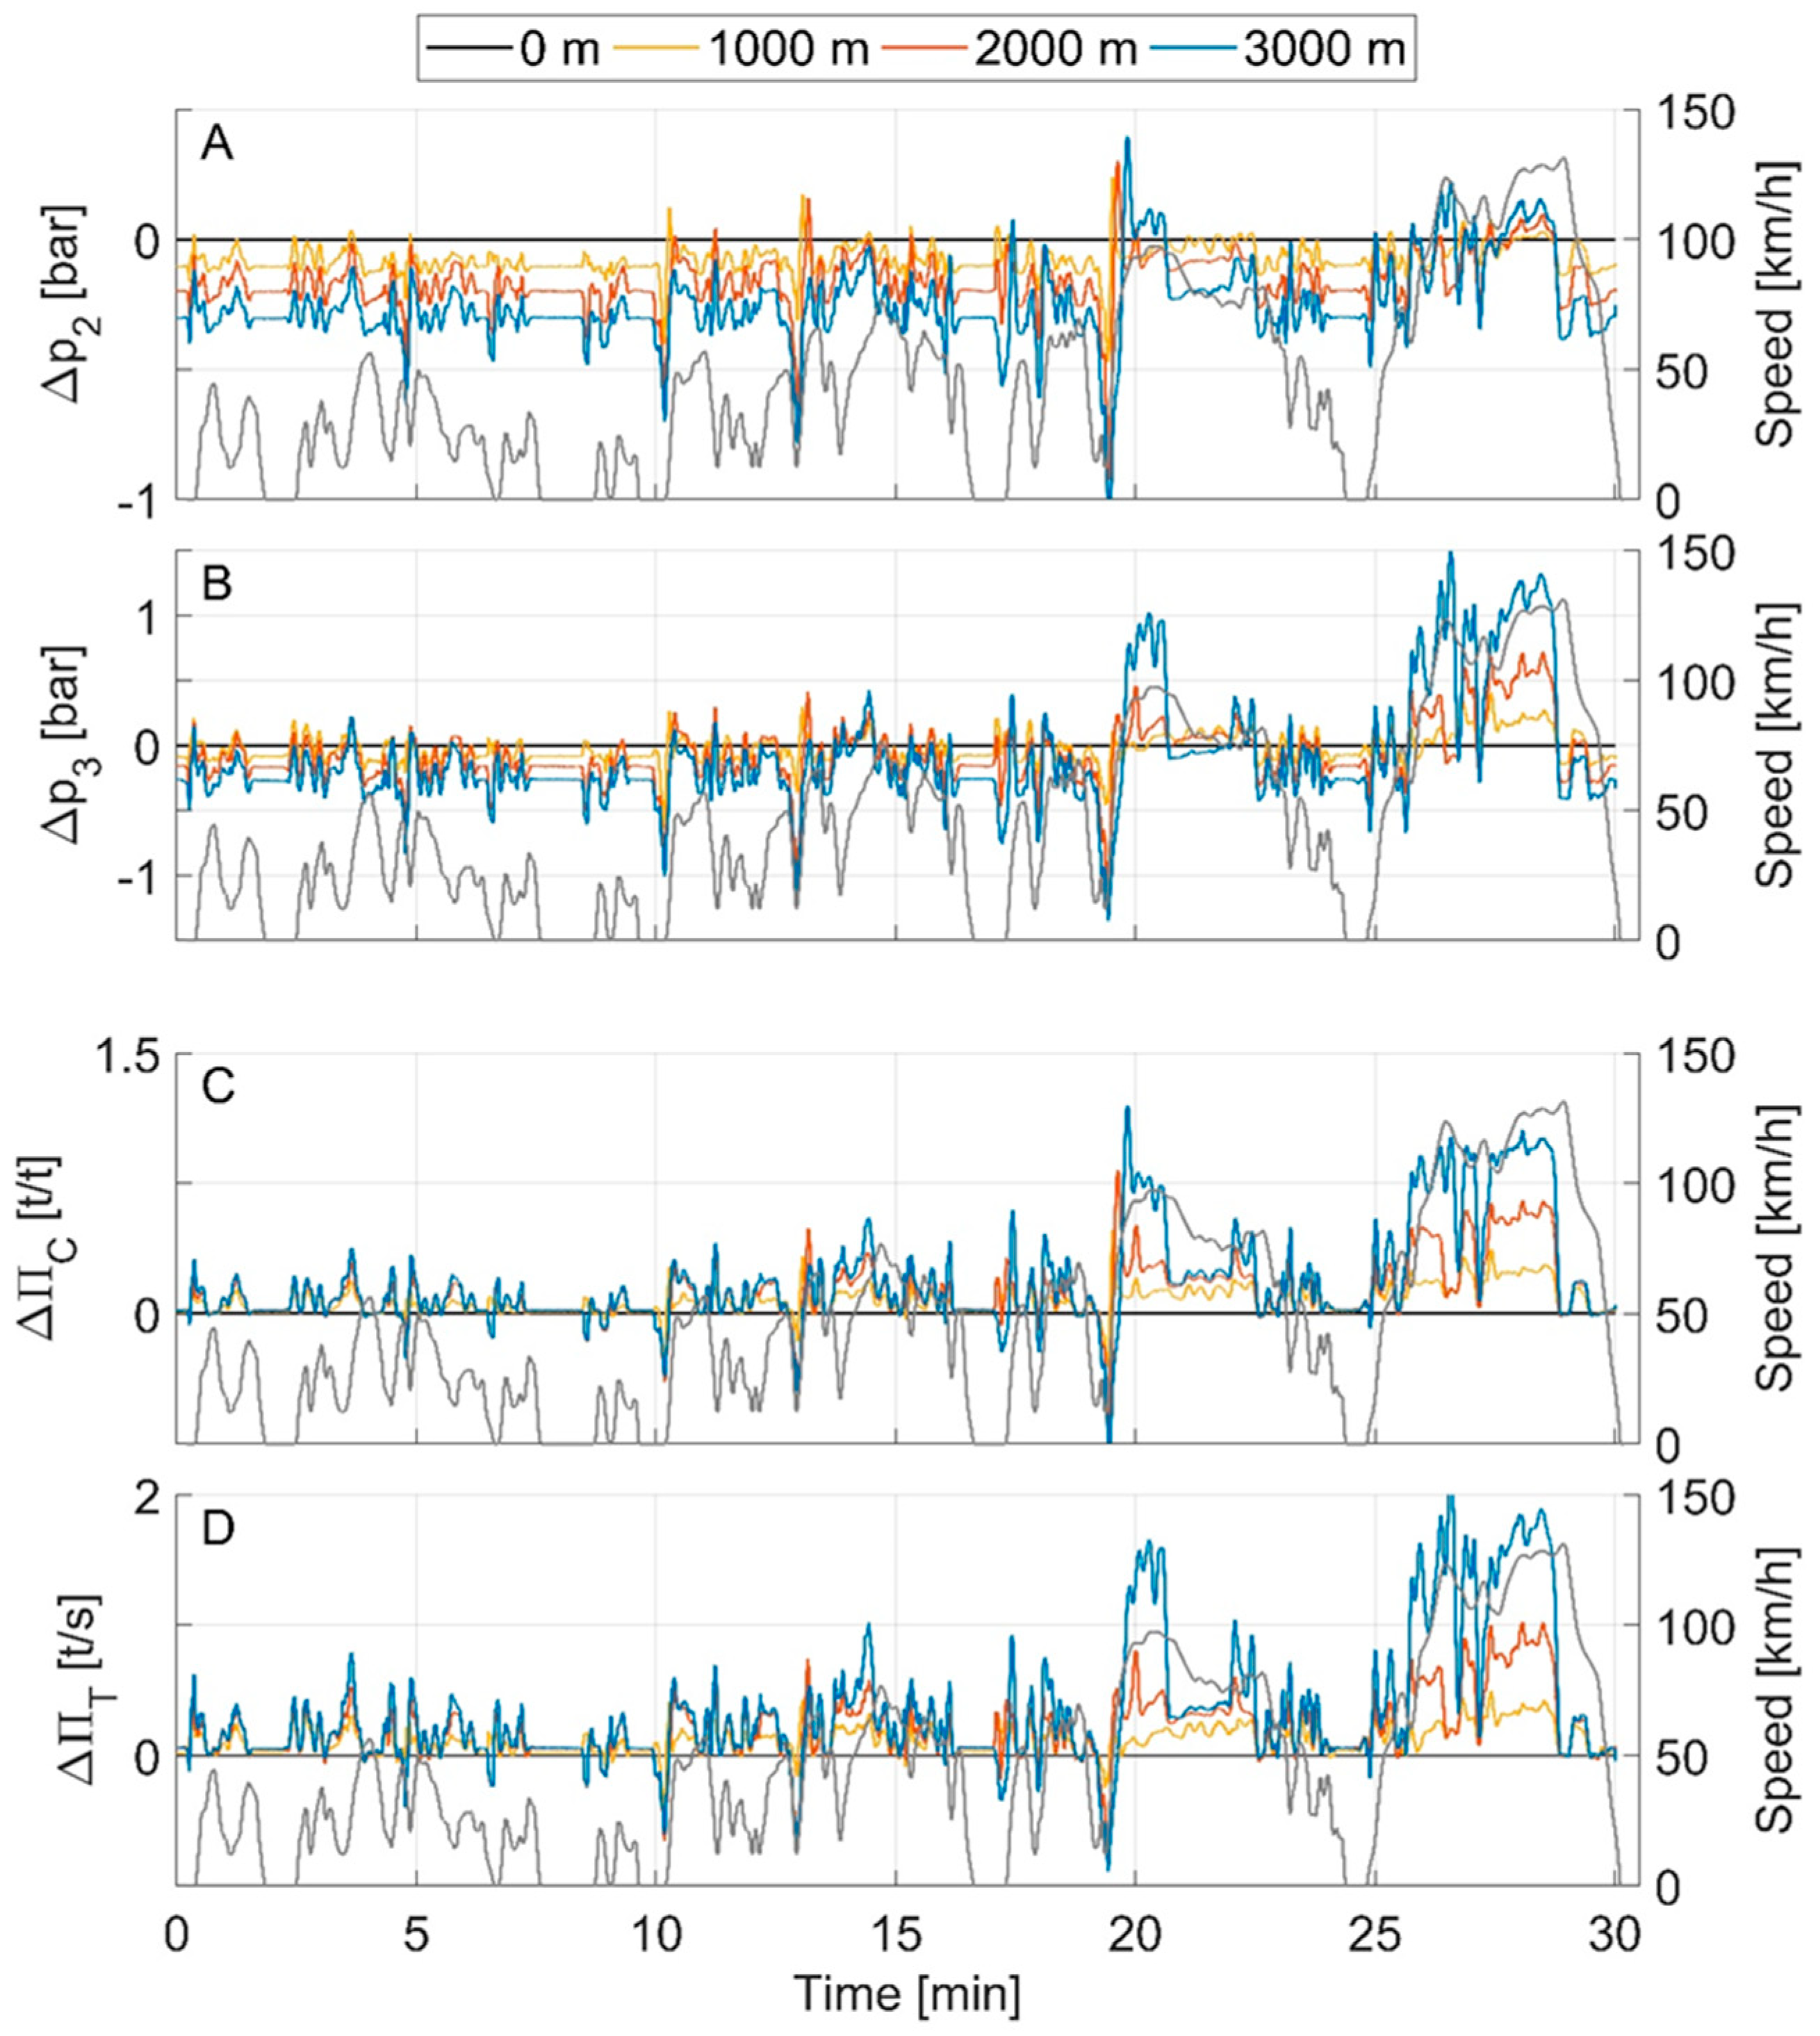
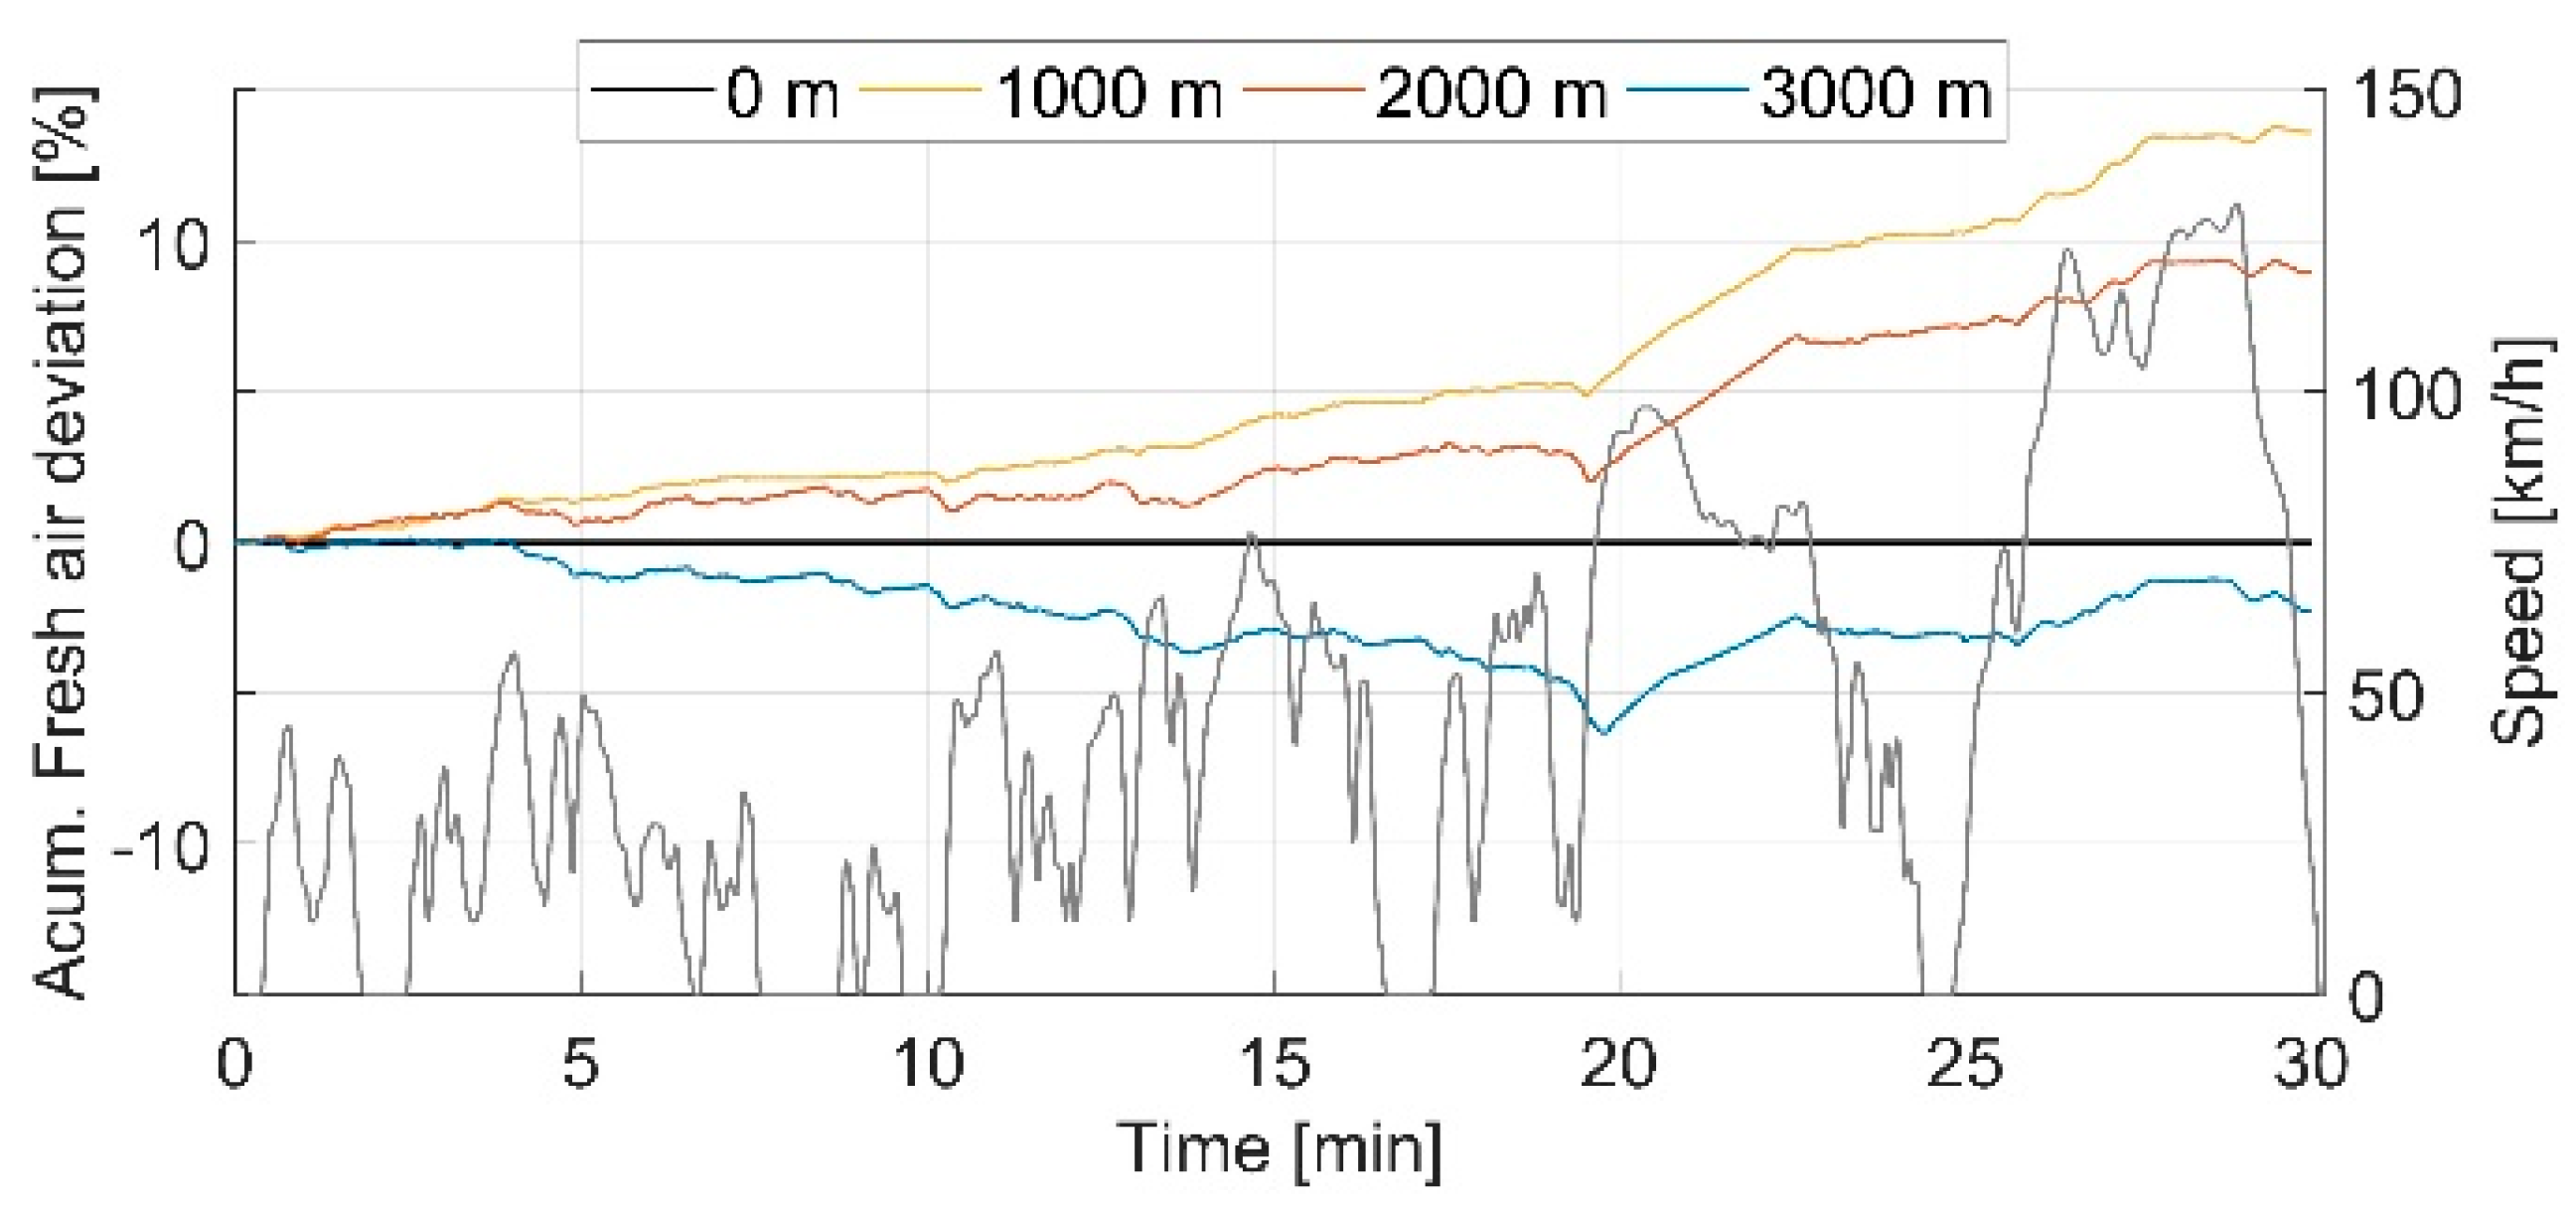
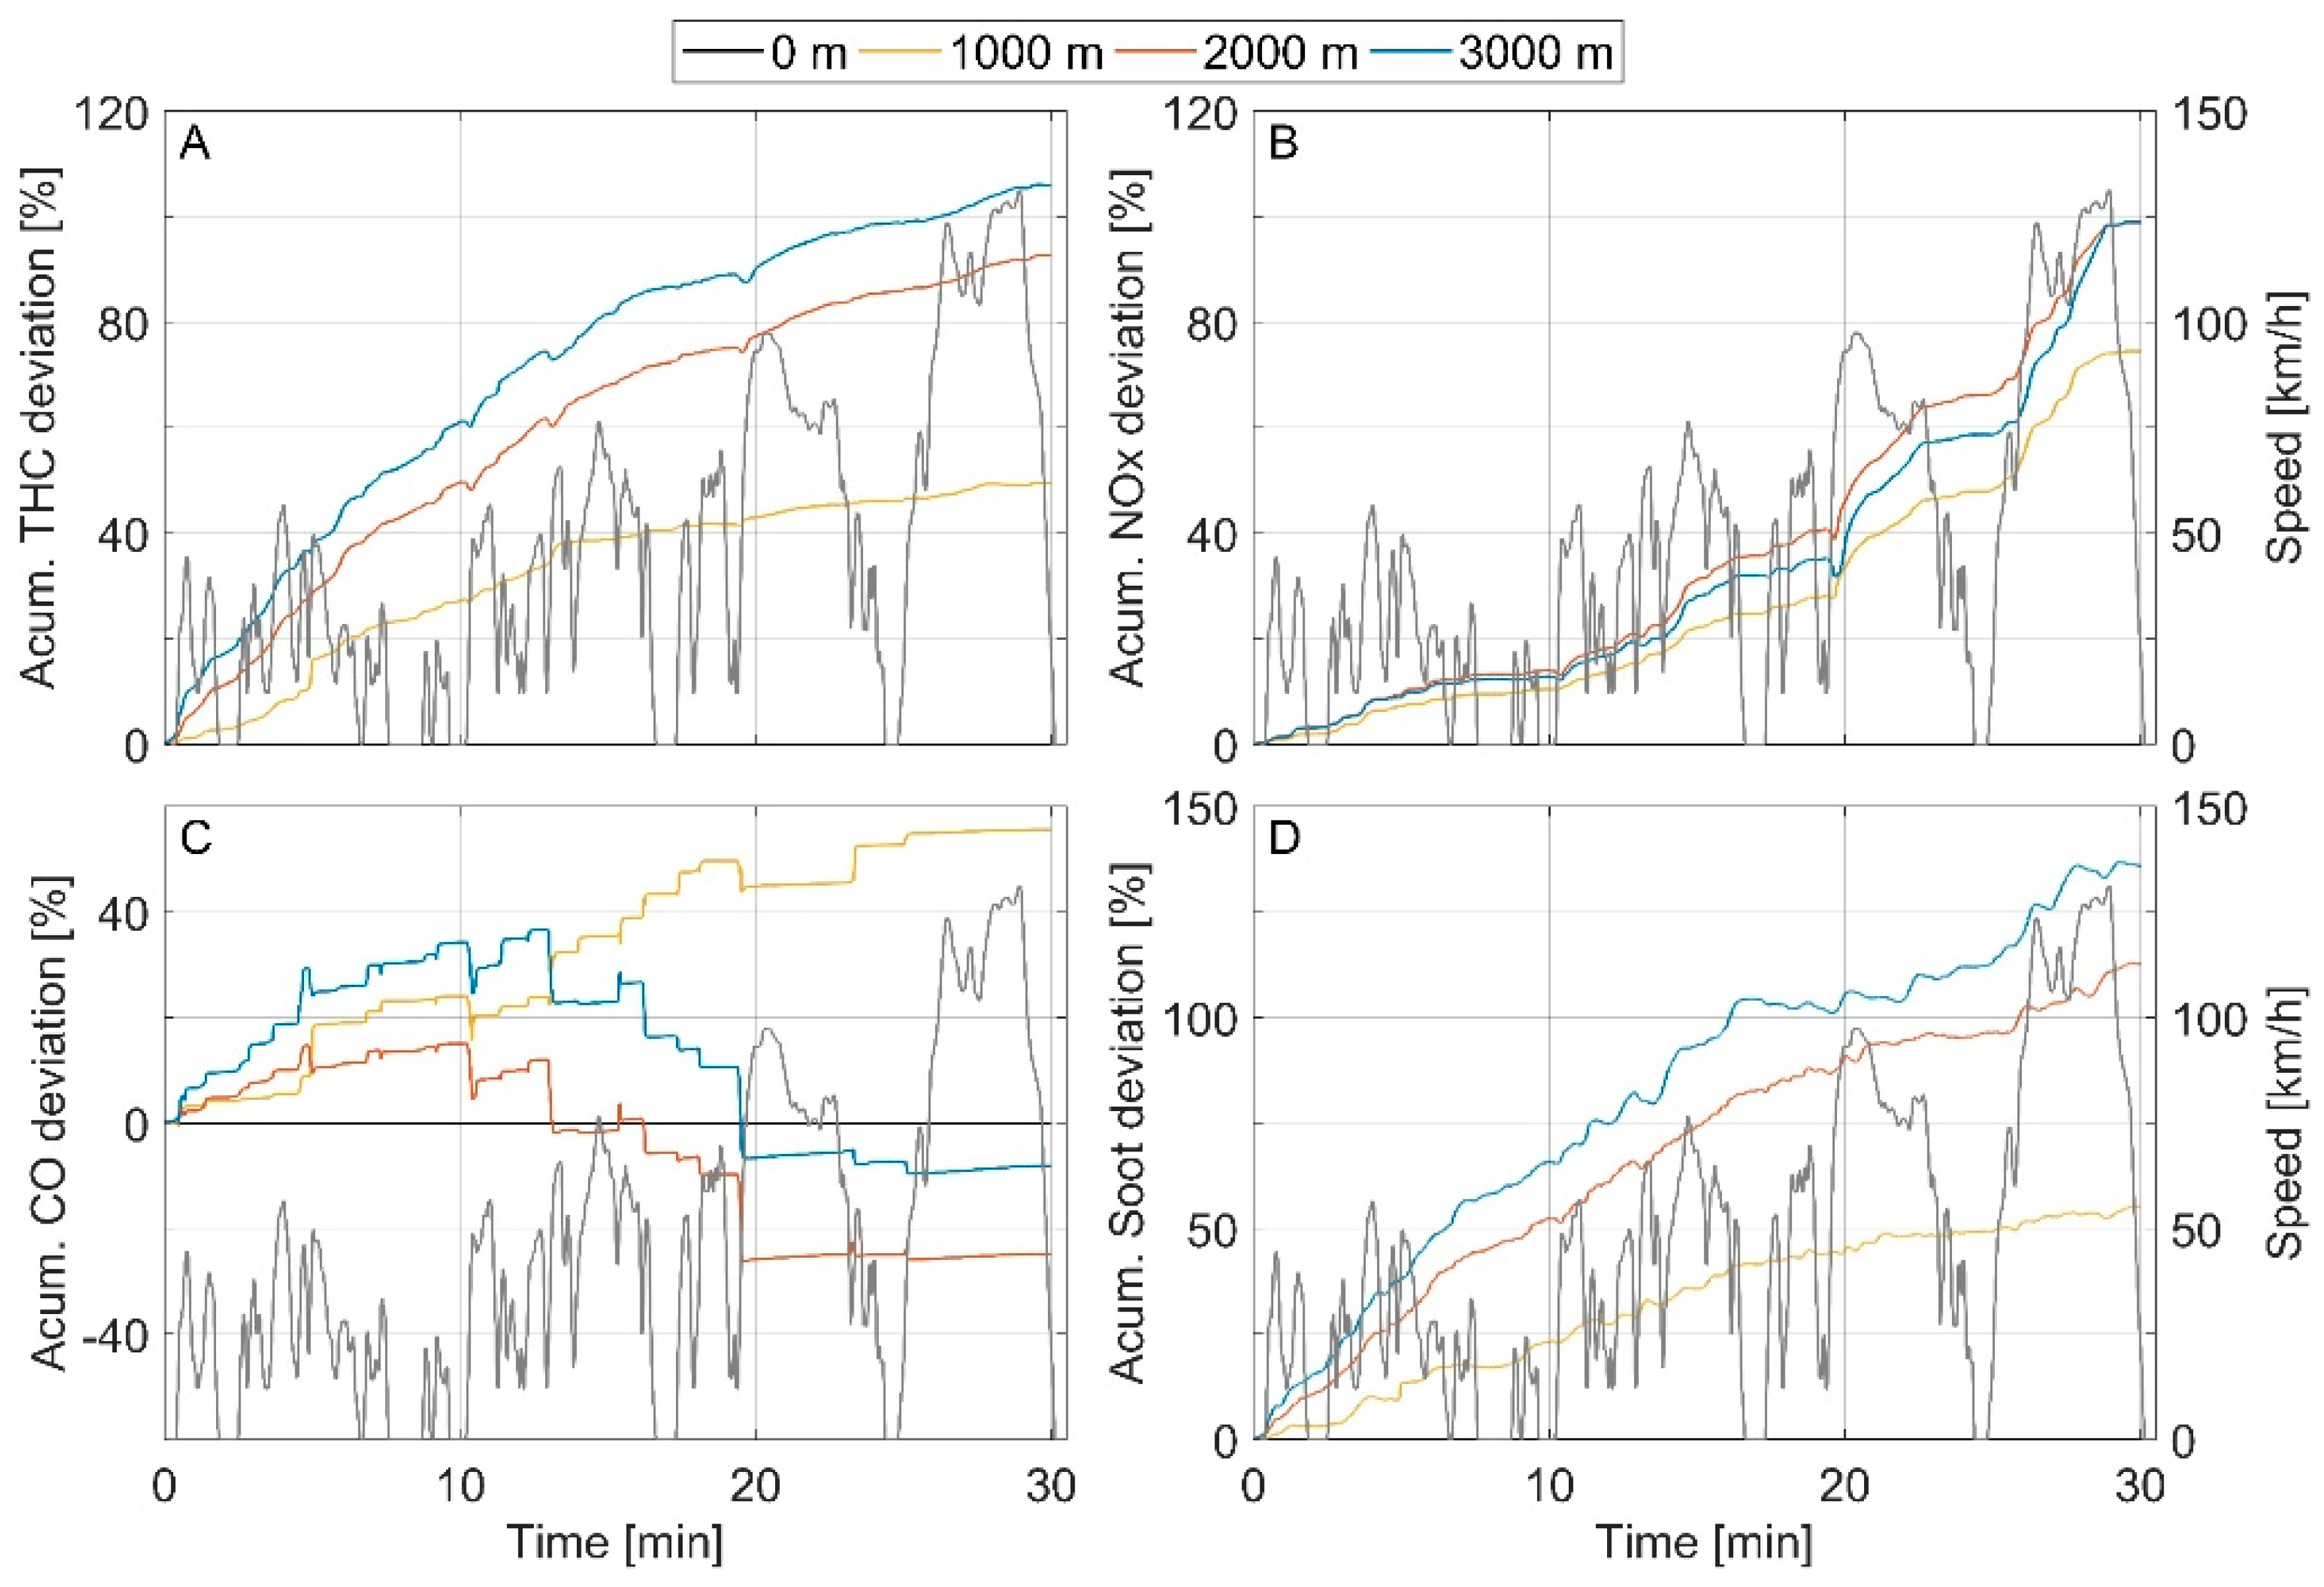
Then, the number of diesel passenger cars that meet Euro 4 or older regulations and are currently circulating in the EU can be estimated as 28.5% of the total European passenger car fleet, which means around 71 million passenger cars. This fact combined with the results shown in Figure 13 prove that the Euro 4 diesel engines have a significant impact in the current pollutant emissions through Europe. It leads us to think about what would happen to Europe’s emissions levels if, in addition to more tight legislation, the renewal of the automotive fleet is encouraged by the governments.
In Figure 14A, the four main pollutants emitted by a diesel engine (THC, CO, NOx, and Soot) and CO2 have been represented as a yield ratio (Δx) with respect to the new Euro 6d emissions limits. The ratios have been obtained following Equation (3), where E 4 e m i s s i o n is the averaged value measured of a kind of pollutant during the WLTC cycle (shown in Figure 13), and E 6 l i m i t is the corresponding Euro 6d diesel emission level (Table 2).
Δ x = E 4 e m i s s i o n E 6 l i m i t E 6 l i m i t
It has been previously stated that the results shown in Figure 13 are considered representative of an old Euro 4 diesel engine performing a modern cycle (WLTC) and including altitude as the real driving variable of the cycle (RDE). For the Euro 6d limit, diesel engines have been preferred to perform the comparison due to their GWP being, on average, 15% lower than petrol engines at equivalent vehicle size, according to the 2018 study from the Society of Motor Manufacturers and Traders (SMMT) [22].
Figure 14A shows that, with the exception of THC, the rest of the pollutants and CO2 increased with respects to the Euro 6d diesel standards. Particularly, a large increase in the emission of NOx was observed—more than 5 times the Euro 6d limitation when Euro 4 engine is at sea level and about 8 times in the cycles carried out in 2000 m altitude. In addition, an important increase of emissions, between 1- and 2-fold, for CO and soot, and up to 3 times for THC + NOx at 1000 m, have been measured.
Instead, Figure 14B represents the previously described ratios between Euro 4 measurements and Euro 6d limits, weighting each altitude with the percentage of European population making displacements in the 50 km buffer area of massifs. The weighting factor for massifs was obtained from Reference [19] and it is 60%; this percentage is illustrated in 
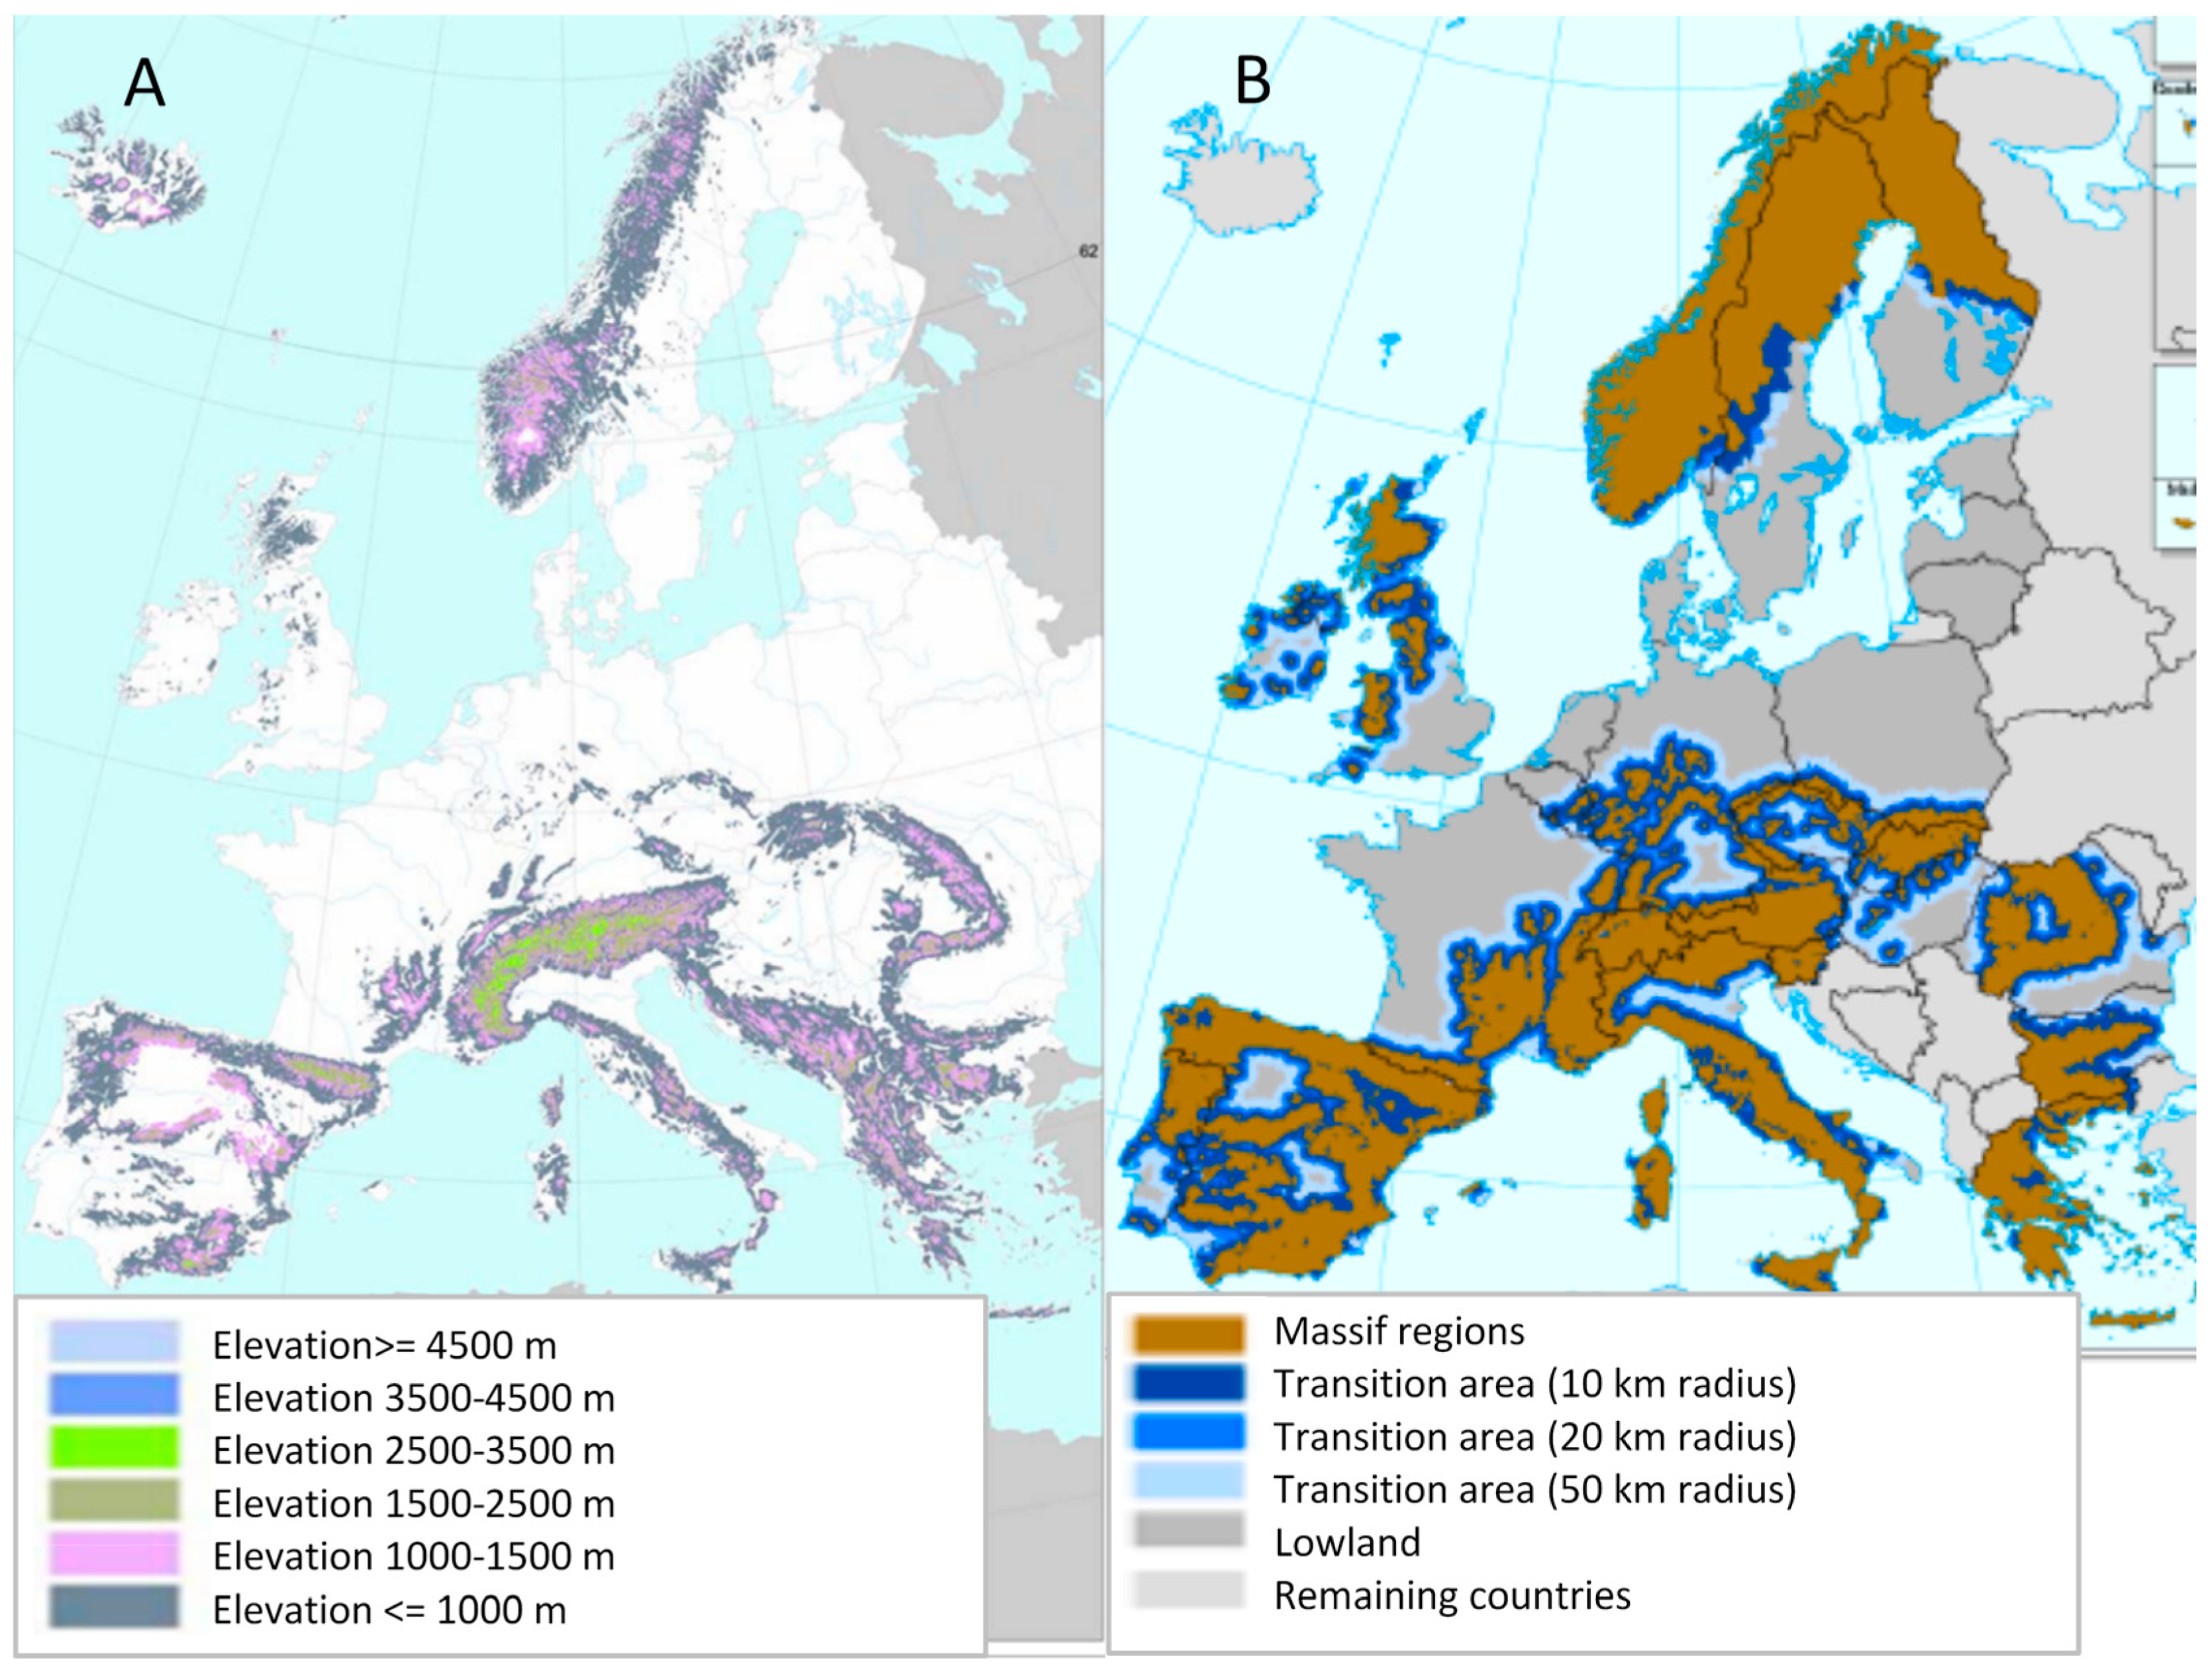
Figure 2 and split in Table 4 among 1000, 2000, and 3000 m altitude data. The splitting factor was obtained from Reference [18], assuming that the world trend of population by altitude shown in Figure 1 remains true at the European level for the 2000m and 3000 m altitude locations, i.e., 5% and 3% respectively, as shown in Table 4. The remaining 40% has been assigned to sea level share assuming they never drive into the previous mentioned 50 km massifs buffer. From these results, it can be again concluded that the potential to reduce the air pollution removing aged passenger car is not negligible and it is worth being analyzed.
Additionally, if instead of renewing the Euro 4 diesel fleet with Euro 6d diesel passenger cars (Figure 14), it is replaced by Euro 6d petrol engine cars (Figure 15), the increase of pollutant emission with respect to the Euro 6d regulation changes significantly. Figure 15A,B have been obtained following the same methodology as Figure 14, but using the Euro 6d petrol emission levels in Equation (3) instead of Euro 6d diesel emission levels (Table 2).
Figure 15B shows how the altitude-averaged increase in NOx emissions of Euro 4 diesel engines is higher on average with respect to Euro 6d petrol engines (9 times) than Euro 6d diesels (7 times, shown in Figure 14B). However, the yield ratio of CO emissions of a Euro 4 diesel engine is reduced to almost zero if the renovation is carried out with Euro 6d petrol engines. The same happens with CO2 emissions from Euro 4 diesel engines, since CO2 emissions of Euro 6d Temp diesel engines are, on average, 15% lower in passenger cars of every sector [22].
Lastly, the increment for soot and THC stayed equal between both options of renewal. In the case of soot, it was due to the fact that both petrol and diesel Euro 6d engines use particle filters that minimize soot emissions. With respect to THC, it is worth noting that even though the quantity emitted is similar between Euro 6d petrol and diesel engines, the composition is not. The THC emitted by petrol engines contains methane hydrocarbons (MHC), of which GWP is 25. Therefore, the MHC emitted by a Euro 6d petrol engine (up to 32% of the THC emitted [3]) causes lower reduction of greenhouse emissions, when renewing the Euro 4 diesel engines by Euro 6d petrol engines.

6. Benefits of Euro 4 Diesel Engines Replacement in Spanish Roads and Cities as Example of European Country Analysis

In this section, the study of passenger cars circulating in Europe has been focused on a particular country and its corresponding urban environment. The same methodology could be followed for other countries. For this study, Spain has been taken as example of country with Madrid as an example of a big city at a massif and Barcelona as an example of a big city at sea level. The reason is the altitude perspective kept in this study is well exemplified in a country like Spain. According to Reference [19], Spain’s average massif areas are higher than the EU average, such as Austria, Finland, Italy, Norway, Romania, Sweden, and Slovakia. In addition, Spain has the third largest concentrated massif area of EU, just after Sweden and Norway, and at the same time is bigger and more populated than most of the previous mentioned.
Accordingly, the information needed to complete this task has been collected from the Ministerio de Fomento (Ministry of Development) from the Spanish Government [23,24]. In these reports, statistics about private transportation through different kinds of roads in Spain and in the city of Barcelona are provided. Reference [23] collects information about the interurban and extra-urban traffic of the city of Barcelona, which can be divided into a slow circulation zone (<50 km/h) and a fast circulation zone (<80 km/h), respectively. The relevant information compiled in Reference [23] has been summarized in Table 5.
Therefore, assuming an average velocity of 50 km/h for the inter urban zone and 80 km/h for the extra-urban zone, the total number of kilometers in a day that passenger cars circulate through a city such as Barcelona can be calculated.
On the other hand, in Reference [24], the information about the traffic through Spanish roads is collected, which are then divided as low speed roads (<100 km/h), including conventional and multi-lane roads, and high speed roads (>100 km/h), consisting of both paid and free highways. The relevant information included in Reference [24] has been compiled in Table 6.
In this case, Equation (4) has been used to calculate the number of kilometers per day that passenger cars circulate across a country like Spain. In Equation (4), K m t p 1   a n d   K m t p 2 are the total number of kilometres that vehicles travel in a year through Spanish roads; P c t p 1   a n d   P c t p 2 are the respective percentage of passenger cars through these roads. In order to calculate the number of kilometers per day through low-speed roads, the values to include in Equation (4) are those corresponding to multi-lane roads and conventional roads rows from Table 6. If the objective is to calculate the kilometers per day through high-speed roads, the data that should be used are those included in paid highway and free highway rows from Table 6.
T o t a l   k m   p e r   d a y   a t   r o a d   t r a v e l [ k m d ] = K m t p 1 × P c t p 1 + K m t p 2 × P c t p 1 365
As already discussed, the driving zones described in Table 5 and Table 6 in which passenger cars circulate, have been reproduced in laboratory tests by carrying out a WLTC cycle, which contains four different parts (low, medium, high, and extra-high) resembling, respectively, the circulation zones previously described, i.e., interurban and extra-urban (Table 5) and low-speed roads and high-speed roads (Table 6 and Equation (4)).
To know the composition of the diesel light-duty fleet in Spain, the following information has been obtained from Reference [2]:
  • Proportion of passenger cars with a diesel engine in Spain: 59.7%.
  • Total number of passenger cars circulating in Spain: 22,355,549 cars.
  • Number of vehicles in use in Spain, which were registered for first time before 2007 (more than 10 years ago): 12,770,961 cars.
  • Number of vehicles in use in Spain, divided by year of first registration from 2007 up to 2015: 9,584,588 cars.
Then, the proportion of passenger cars in Spain that comply with each Euro regulation can be calculated using Equation (5), where R e g n e w is the number of cars currently circulating but registered for first time in the period of a given Euro regulation, and P c t o t a l is the total amount of cars currently circulating through Spain.
P r o p o r t i o n   [ % ] = ( R e g n e w P c t o t a l ) S p a i n × 100
In order to calculate the proportion of Euro 4 or older passenger cars, all cars currently circulating that were registered before September 2009 should be included in the R e g n e w term of Equation (5), assuming that 67% of the registration for 2009 were carried out before September. On the other hand, the Euro 5 proportion is calculated, taking into account the period from September 2009 to September 2014. Lastly, all cars registered after September 2014 are used to obtain the proportion of Euro 6.
Thus, the information obtained after processing the data about the travels of passenger cars in each of the four kind of roads depicted, as well as the composition by age of the Spanish diesel passenger car fleet, is compiled in Table 7. This table shows the number of driven kilometers per day, split into the regulation that the engine installed follows: Euro 4 or older, Euro 5, and Euro 6.
The current pollutant emissions of diesel engines used in passenger cars can be calculated for each part of the WLTC cycle applying
E m i s s i o n   [ t d ] = K m C I × P c e m i s s i o n 10 6
where K m C I is the total amount of kilometres per day driven by the number of diesel powered passenger cars depicted in Table 7 and P c e m i s s i o n is the emission level in g/km of said passenger cars.
To calculate the emissions of Euro 6 and Euro 5 engines, the P c e m i s s i o n term used in Equation (6) is the emission limit imposed by each regulation (Table 2). However, in the case of the emissions of Euro 4 or older passenger cars, the emission levels used in Equation (6) are the emissions measured in laboratory tests for one Euro 4 representative engine using WLTC and accounting with altitude perspective, which are represented in Figure 13.
Then, the emissions of THC + NOx and CO have been chosen as reference to put into numbers the reduction of pollutant emissions in Spanish roads and cities. These emissions are the main pollutants causing the winter smog, which is harmful to human health, appearing in highly populated cities [25]. CO2 emissions have been also chosen for its GWP. Concerning PM, in Euro 6 vehicles there are other sources of PM emissions more relevant than the exhaust gases because both diesel and petrol are equipped with particulate filters. The new predominant sources of PM are the wear of the brakes against break disc and of the tires against road pavement, which are not related to the combustion engine but to the vehicle mass and driving style [26]. Therefore hybrids, PHEV, and BEV are also highly contributing to PM emissions. Since no studies about these new sources of contribution have been performed here, this pollutant has been kept out of the scope of this section.
Equation (7) is used to obtain the totals emitted by Euro 6, Euro 5, and Euro 4 or older during the four parts of a WLTC cycle. Term E # represents the three Euro regulations whilst E # e m i s s i o n is the result obtained from Equation (6) for each kind of Euro engine in a given part of the WLTC cycle.
T o t a l   E m i s s i o n   [ t d ] = E # E # e m i s s i o n
Lastly, adding up the results from Equation (7) for the different parts of the WLTC cycle (low with medium and high with extra-high), the total emissions for a standard Spanish city and the Spanish roads are obtained for every given altitude, respectively.
The application of Equation (7) provides the actual diesels passenger-car fleet emissions. However, if for the number of Euro 4 or older diesel engines, the Euro 5 emission limits for diesels are used, then an estimate of the emissions is obtained if the Euro 4 diesel passenger car fleet will be renewed.
As a conclusion, the absolute decrease of the emissions caused by diesel passenger cars in Spain only by renovating the older vehicles is calculated following Equation (8). Complementarily, the relative decrease, with respects to the current emissions, is calculated using Equation (9). In Equations (8) and (9), C I c u r r e n t is the current diesel total emissions and C I e s t i m a t e d are the estimated emissions if the Euro 4 passenger cars are renewed by Euro 6d passenger cars with diesel engines.
R e d u c t i o n   [ t / d ] = C I c u r r e n t C I e s t i m a t e d
R e d u c t i o n   [ % ] = C I c u r r e n t C I e s t i m a t e d C I c u r r e n t × 100
Table 8 shows that in Barcelona, as a sea-level representative city, the reduction of THC + NOx would be of 1.3 t/d. In the case of a city as Madrid, which is located at almost 700 m above sea level, the THC + NOx emission would be reduced by 3.2 t/d. These results involves a THC + NOx emissions reduction from diesel passenger cars of 40.1% and 54.9%, respectively. In the case of CO, the reduction in sea level would be 5.7 t/d whilst at higher altitudes, cities like Madrid would reach up to 12.1 t/d. Then, the reduction of CO with respect to the current emissions from diesel passenger cars represents 52.4% and 69.9%, respectively.
The CO2 emissions would be also reduced due to renovating the diesel light duty fleet. In the case of sea level cities like Barcelona in 155.9 t/d, i.e., 10.7% of the current diesel emissions of CO2; and in cities like Madrid in 147.3 t/d, which also represents 10.2% of the current diesel emissions of CO2.
The reduction in emissions through Spanish roads have been calculated following the same procedure as Barcelona and Madrid, but with the additional step of weighting the altitudes tested with the population distribution with altitude shown in Table 4. Therefore, in Spanish roads and highways, THC + NOx emissions would be reduced by 186.3 t/d, CO emissions by 177.6 t/d, and CO2 emissions by 20,624 t/d. These absolute magnitudes represent 72%, 52.2%, and 33.7% of current emission due to diesel passenger cars, respectively.
This procedure, both for cities and roads, can be used to obtain the data shown in Table 8 for any given European country, if the necessary base information (Table 5 and Table 6) is available. In a first stage, the emission results can be extended to the whole EU if the Spanish number of vehicles are replaced by those of the EU countries. For the sake of simplicity, it is assumed that there is the same share between urban, extra-urban, and highways in Spain as in other EU countries. The European countries included in the study are the ones that appear listed in Reference [2], and their emission levels are calculated according to Equation (10),
E U   e m i s s i o n   a t   a   g i v e n   a l t i t u d e   [ t / d ] = E U c o u n t r y C I t o t a l × V e h c o u n t r y V e h S p a i n
where E U c o u n t r y represents the European countries, C I t o t a l are the emission levels calculated with Equation (7) at a given altitude, V e h c o u n t r y are the total number of passenger cars in a particular country, and V e h S p a i n are the total number of passenger cars in Spain. The data used has been obtained from Reference [2]. Then, each pollutant emitted has been reduced to a single number by weighting the four altitudes tested with the distribution of European population by altitude using data from References [18,19] as previously discussed. In summary, THC + NOx emission on European roads and highways could be reduced by 1295.8 t/d, CO emissions could be reduced by 1234.9 t/d, and CO2 emissions by 143,428 t/d. This reduction represents 69.6%, 49.4%, and 31.2% respectively, with respect to the amounts emitted by all diesel passenger cars in Europe.
The percentage reduction in Table 8 have been calculated considering only the diesel part of the passenger cars in Europe. To extend the results obtained to the whole European passenger cars fleet, it is necessary to include in the calculations the passenger cars that use petrol, alternative fuels, hybrids, and electric powertrains. It is worth noting that the total number of hybrid and electric powered passenger cars is around 3% of the EU fleet [2]. Therefore, to calculate the reduction percentage of emission with respect to the total passenger car fleet, only vehicles powered by petrol and diesel engines have been considered.
To calculate the emissions of the petrol engines, it has been assumed that all the European petrol fleet emission levels are equal to the Euro 6d Temp regulation limits (Table 2). This is not far from reality in general terms and simplifies the analysis. In addition, according to SMMT reporting 18% higher CO2 emissions of petrol engines than diesel [22], the expected CO2 emissions of Euro 6d engines have been increased in petrol cases with respect to diesels. Therefore, the total emissions due to petrol passenger cars can be calculated using Equations (6) and (7). Then, if the total emissions of petrol engines are added to those of the diesel engines (2-fold, with the current and renewed Euro 4) the total emissions of the EU passenger car fleet can be obtained. Following, using Equations (8) and (9), the reduction of emissions in a standard European city and country roads referenced to the whole passenger car fleet is calculated.
Thus, the new figures of emissions reduction from passenger cars is depicted in Table 9. Clearly, the reduction in percentage is smaller when considering both petrol and diesel engines, but nonetheless it is still a very significant reduction.
Diesel passenger cars fulfilling Euro 6d regulation have been chosen as an example of replacement due to its contrasted lower CO2 emissions than petrol engines. Therefore, if the replacement were done with petrol engines, the results would be as shown in Table 10 where a slightly higher reduction in THC + NOx emissions is observed with respect to Table 9, but with significantly lower reduction in CO, and even increasing CO2 in cities (negative reduction). Moreover, as already discussed, the THC emitted by petrol engines is significantly composed of methane, which has a GWP of 25. Thus, the normalized GWP value for the greenhouse emissions, i.e., CO2 and MHC, is shown in Table 10. The GWP increases in cities (negative reduction) but not in road trips because the CO2 emissions of a Euro 4 diesel passenger car during city travel (low and medium WLTC phases in Figure 13) is much closer to the Euro 6d emission level used in this work, than during road travel (high and extra-high WLTC phases in Figure 13). The GWP has not been differentiated in Table 9 due to the negligible methane emissions of diesel engines.

7. Summary and Conclusions

The European geography includes numerous massif regions where important population centers are located. Within an area of 50 km around massifs lives 60% of the European population. Therefore, understanding the behavior of passenger-car engines when working in altitude is necessary to accurately quantify the impact of traffic on air pollution.
In this work, a discussion about the performance of a Euro 4 diesel engine tested in altitude has been carried out. An altitude simulator with the WLTC was used for emissions and performance assessment of the old but numerous Euro 4 diesel passenger cars still present in Europe. One must keep in mind that the 71 million Euro 4 diesel engines represent 28.5% of the current passenger-car fleet. This new approach has been proposed as a straightforward, reproducible, and contrastable method for quantifying the great impact that the aged European passenger cars fleet have on the emission of pollutants from this type of transport.
With respects to the AS control of the atmospheric conditions, it has been proved that the control of pressure and temperature is accurate and stable along the whole WLTC, without perturbations in the engine measurements during the engine load and speed dynamics. It arises as an excellent tool to quickly assess important issues related to altitude and road transport vehicles.
The altitude effects on the Euro 4 engine performance cover several aspects. Firstly, the turbo compressor is more prone to reach risky working zones, like surge or over speed, when the altitude increases. Moreover, the closed loop strategy to control p2 with the VGT, increases the backpressure of the cylinders greatly, which could lead to excessive pumping work. Finally, the pollutant emissions are also heavily affected by the altitude at which the Euro 4 diesel engine is working. The EGR valve closing, the exhaust backpressure increase, the air mass flow reduction, and the in-cylinder pressure reduction all lead to an increase in all emitted pollutants.
It has been concluded that the renewal of the Euro 4 or older diesel passenger cars would significantly decrease the traffic air pollution in both roads and cities all around the EU. The replacement options studied in this work have been passenger cars powered by conventional internal combustion engines (diesel and petrol) fulfilling Euro 6d Temp regulation. They have been preferred for a short-term shift due to fully accomplishing some requisites that, with the adequate public policies, could be prone to said short-term change, i.e., technology readiness, technology maturity, affordable prices, and market acceptance.
Hence, if the old diesel passenger cars are replaced by Euro 6d diesel passenger cars, the pollutant emissions in European cities as Barcelona, located at sea level, could be reduced by 6.3% for CO2, and as high as 32% in the case of CO and 28.8% for THC + NOx. Moreover, cities like Madrid, which is located at 670 m above sea level, could have their emission levels also reduced by 5.9% in the case of CO2 and impressive figures like 49.8% and 45.1% for harmful pollutants like CO and THC + NOx, respectively.
The reduction through roads of European countries, like Spain, in the case of THC + NOx would be even greater, by 62.6%. CO emissions would be reduced by 31.8%, and one must bear in mind that CO is indirectly important for the global-warming problem, since it reacts with OH, penalizing atmospheric OH potential to oxidize MHC emissions in atmosphere. With respect to CO2, it would be reduced by an impressive 22.1%, thus very much helping to fulfill the countries’ compromises to reduce passenger cars emissions of GWP gases in the short term. What happens on the roads of the EU is that the reduction of these emissions follows the trend marked by a single country due to the difference between the percentage of diesel passenger cars in a single country and the average for the whole EU. Thus, supposing EU has the same share as in Spain, among the four modes of the WLTC, and adapting the ratio between diesel and petrol to the EU’s average. With these assumptions, the emissions would be reduced in the EU by 52.5% in the case of THC + NOx, 20.9% for CO, and 14.9% for CO2.
On the other hand, if the light-duty fleet is renewed by Euro 6d petrol passenger cars, the reduction of THC + NOx is a slightly better, around 2 percentage points better in cities and 1 percentage point better in roads. However, the CO reduction is substantially worse, and between 15 and 20 percentage points of reduction would be lost. In the case of CO2 and MHC, the joint reduction vanishes in cities and the GWP gases emissions from passenger cars in cities are slightly increased: About +1.4% at sea level and up to +1.8% in cities at massifs. This is, in part, due to the high GWP of the MHC emitted by the petrol engines. In Spain and at EU level, 6 and 4 percentage points of GWP emissions reduction would be lost, respectively. Therefore, the quantification shows that the small benefits in THC + NOx reduction of Euro 6d Temp petrol engines with respect to diesels do not compensate the substantial penalty in CO and CO2 emissions.
In conclusion, the efforts to reduce the pollution in Europe from passenger cars, mainly done through tight regulations, should also focus on the renewal of the fleet by Euro 6d diesel passenger cars. A full sweep would reduce, in the short term, between 29% and 63% of the THC+NOX emission and between 6% and 22% of the GWP gases emission, depending on altitude boundary of the studied locations.

Author Contributions

Conceptualization, J.R.S., S.B., and P.P.; formal analysis, R.T. and J.G.; investigation, J.R.S., P.P., A.A., R.T. and J.G.; project administration, J.R.S. and S.B.; software, R.T., A.A., and J.G.; writing—original draft preparation, J.R.S., R.T. and P.P.; writing—review and editing, J.R.S., R.T., P.P., A.A., and J.G.

Funding

This research has been partially supported by FEDER and the Government of Spain through project TRA2016-79185-R.

Conflicts of Interest

The authors declare no conflict of interest. The funders had no role in the design of the study; in the collection, analyses, or interpretation of data; in the writing of the manuscript, or in the decision to publish the results.

Nomenclature

ASAltitude Simulator
ACEAEuropean Automobile Manufacturers Association
BEVBattery Electric Vehicle
BSFCBrake Specific Fuel Consumption
CIDiesel passenger cars
E#European category of exhaust emissions standard
ECUEngine Control Unit
EGRExhaust Gases Recirculation
EUEuropean Union
DOCDiesel Oxidation Catalyst
DPFDiesel Particulate Filter
GWPGlobal warming potential
MEDASMultifunctional Efficient Dynamic Altitude Simulator
MHCMethane Hydrocarbons
MHMMEDAS Humidity Module
millMillions
MTMMEDAS Temperature Module
PcPassenger cars
PHEVPlug-in Hybrid Electric Vehicle
PMParticulate Matter
RegNumber of passenger cars registered for first time in a given year
RDEReal Driving Emission
SMMTSociety of Motor Manufacturers and Traders
UNEPUnited Nations Environment Program
Veh.Vehicles
VGTVariables Geometry Turbine
WLTCWorldwide Harmonized Light Vehicles Test Cycle
ΔIncrement
dDay
pPressure
tTons
yYear
Π Pressure ratio
Sub index
2Compressor Outlet
3Turbine Inlet
>10Before 2007
CCompressor
newAfter 2007
TTurbine
tp#Road type

References

  1. Kim, J.; Bae, C. Emission reduction through internal and low-pressure loop exhaust gas recirculation configuration with negative valve overlap and late intake valve closing strategy in a compression ignition engine. Int. J. Engine Res. 2017, 18, 973–990. [Google Scholar] [CrossRef]
  2. European Automobile Manufacturers Association (ACEA). Vehicles in Use Europe. 2017. Available online: https://www.acea.be/statistics/article/Report-Vehicles-in-Use (accessed on 1 April 2019).
  3. European Commission. COMMISSION REGULATION (EU) 2017/1151 of 1 June 2017 supplementing Regulation (EC) No 715/2007 of the European Parliament and of the Council on type-approval of motor vehicles with respect to emissions from light passenger and commercial vehicles (Euro 5 and Euro 6) and on access to vehicle repair and maintenance information, amending Directive 2007/46/EC of the European Parliament and of the Council, Commission Regulation (EC) No 692/2008 and Commission Regulation (EU) No 1230/2012 and repealing Commission Regulation (EC) No 692/2008. Off. J. Eur. Union 2017, L 175, 1–643. [Google Scholar]
  4. Ramos, A.; Muñoz, J.; Andrés, F.; Armas, O. NOx emissions from diesel light duty vehicle tested under NEDC and real-word driving conditions. Transp. Res. Part D 2018, 63, 37–48. [Google Scholar] [CrossRef]
  5. Ramos, Á. Emisiones Contaminantes Diésel en Condiciones Transitorias de Motores y Vehículos Empleando Combustibles Alternativos. Ph.D. Thesis, Universidad Castilla-La Mancha, Ciudad Real, Spain, 2016. [Google Scholar]
  6. Bermúdez, V.; Serrano, J.R.; Piqueras, P.; Gomez, J.; Bender, S. Analysis of the role of altitude on diesel engine performance and emissions using an atmosphere simulator. Int. J. Engine Res. 2017, 18, 105–117. [Google Scholar] [CrossRef] [Green Version]
  7. International Organization for Standardization. IOS-2533:1975 Standard Atmosphere; International Organization for Standardization: Geneva, Switzerland, 1975. [Google Scholar]
  8. Zama, Y.; Ochiai, W.; Furuhata, T.; Arai, M. Experimental Study on Spray Angle and Velocity Distribution of Diesel Spray under High Ambient Pressure Conditions. At. Sprays 2011, 21, 989–1007. [Google Scholar] [CrossRef]
  9. Hiroyasu, H.; Arai, M.; Tabata, M. Empirical Equations for the Sauter Mean Diameter of a Diesel Spray; SAE Technical Paper 890464; International Congress and Exposition: Detroit, MI, USA, 1989; pp. 3–5. [Google Scholar] [CrossRef]
  10. Kihm, K.D.; Terracina, D.P.; Caton, J.A. Synchronised droplet size measurements for coal-water slurry sprays generated from high-pressure diesel injection system. J. Inst. Energy 1994, 67, 2–9. [Google Scholar]
  11. Toff, W.D.; Jones, C.I.; Ford, I.; Pearse, R.J.; Watson, H.G.; Watt, S.J.; Ross, J.A.S.; Gradwell, D.P.; Batchellor, A.J.; Abrams, K.R.; et al. Effect of Hypobaric Hypoxia, Simulating Conditions During Long-Haul Air Travel, on Coagulation, Fibrinolysis, Platelet Function, and Endothelial Activation. Am. Med. Assoc. 2006, 295, 2251–2262. [Google Scholar] [CrossRef] [PubMed]
  12. Testa, D. Apparatus and Method for Altimetric Conditioning of Internal Combustion Engines. Patent EP2295950B1, 29 May 2013. [Google Scholar]
  13. Payri, F.; Desantes, J.M.; Galindo, J.; Serrano, J.R. Unit for Simulating the Pressure and Temperature Conditions of the Air Drawn in by a Reciprocating Internal Combustion Engine. Patent WO2012104454A1, 9 August 2012. [Google Scholar]
  14. Galindo, J.; Payri, F.; Piqueras, P.; Serrano, J.R. Device for Atmosphere Conditioning for Testing Combustion Engines, and Associated Method and Use. Patent WO 2015/110683, 30 November 2015. [Google Scholar]
  15. Desantes, J.M.; Galindo, J.; Payri, F.; Piqueras, P.; Serrano, J.R. Device for Conditioning the Atmosphere in Test of Alternative Internal Combustion Engines, Method and Use of Said Device. Patent WO2016116642A1, 28 July 2016. [Google Scholar]
  16. Galindo, J.; Serrano, J.R.; Piqueras, P.; Gómez, J. Description and Performance Analysis of a Flow Test Rig to Simulate Altitude Pressure Variation for Internal Combustion Engines Testing. SAE Int. J. Engines 2014, 7, 1686–1696. [Google Scholar] [CrossRef]
  17. Broatch, A.; Bermúdez, V.; Serrano, J.R.; Tabet, R.; Gómez, J.; Bender, S. Analysis of Passenger Car Turbocharged Diesel Engines Performance When Tested at Altitude and of the Altitude Simulator Device Used. In Proceedings of the ASME 2018 Internal Combustion Engine Division Fall Technical Conference, San Diego, CA, USA, 4–7 November 2018. [Google Scholar] [CrossRef]
  18. Cohen, J.E.; Small, C. Hypsographic demography: The distribution of human population by altitude. Proc. Natl. Acad. Sci. USA 1998, 95, 14009–14014. [Google Scholar] [CrossRef] [PubMed] [Green Version]
  19. UNEP-World Conservation Monitoring Centre. The Delineation of European Mountain Areas. 2000. Available online: https://ec.europa.eu/regional_policy/sources/docgener/studies/pdf/montagne/mount4.pdf (accessed on 1 April 2019).
  20. Bermúdez, V.; Pastor, J.V.; López, J.J.; Campos, D. Experimental correlations for transient soot measurement in diesel exhaust aerosol with light extinction, electrical mobility and diffusion charger sensor techniques. Meas. Sci. Technol. 2014, 25, 065204. [Google Scholar] [CrossRef] [Green Version]
  21. The International Council on Clean Transportation (icct). CO2 Emissions from New Passenger Cars in the EU: Car Manufacturer’s Performance in 2017. 2018. Available online: https://www.theicct.org/sites/default/files/publications/EU_manufacturers_performance_CO2_20180712.pdf (accessed on 1 April 2019).
  22. The Society of Motor Manufacturers and Traders (SMMT). New Car CO2 Report 2018. 2018. Available online: https://www.smmt.co.uk/wp-content/uploads/sites/2/SMMT-New-Car-Co2-Report-2018-artwork.pdf (accessed on 1 April 2019).
  23. Ministerio de Fomento (Ministry of Development), Gobierno de España. El Transporte Urbano y Metropolitano en España. 2016. Available online: https://www.fomento.gob.es/recursos_mfom/transporteurbano.pdf (accessed on 1 April 2019).
  24. Ministerio de Fomento (Ministry of Development), Gobierno de España. Tráfico de mercancías y viajeros por carretera (vehículos-kilómetro) por clase y tipo de vía. 2018. Available online: http://observatoriotransporte.fomento.es/BDOTLE/visorBDpop.aspx?i=418 (accessed on 1 April 2019).
  25. Marilena, E.C. Human health effects of air pollution. Environ Pollut. 2007, 151, 362–367. [Google Scholar] [CrossRef]
  26. Thorpe, A.; Harrison, R.M. Sources and properties of non-exhaust particulate matter from road traffic: A review. Sci. Total Environ. 2008, 400, 270–282. [Google Scholar] [CrossRef] [PubMed]
Figure 1. Number of people as a function of altitude. Elaborated from Reference [18].
Energies 12 01278 g001
Figure 2. Mountains of Europe; (A) massif and (B) massif transition areas, which involves surrounding circulation. Elaborated from Reference [19].
Energies 12 01278 g002
Figure 3. Population distribution in European cities as a function of the altitude.
Energies 12 01278 g003
Figure 4. Engine (left) to altitude simulator (AS) (right) connection elements. Elaborated from Reference [6].
Energies 12 01278 g004
Figure 5. AS control stability during the Worldwide harmonized Light-vehicles Test Cycle (WLTC) at different altitudes.
Energies 12 01278 g005
Figure 6. AS effect on compressor inlet pressure.
Energies 12 01278 g006
Figure 7. Exhaust gases recirculation (EGR) valve opening. (A) At 0 m and 1000 m; (B) at 2000 m and 3000 m.
Energies 12 01278 g007
Figure 8. Turbocharger behavior in altitude. Changes in: (A) Boost pressure; (B) back pressure; (C) compressor pressure ratio; and (D) Turbine pressure ratio.
Energies 12 01278 g008
Figure 9. Turbocharger behavior at altitude: Compressor map operation at studied altitudes.
Energies 12 01278 g009
Figure 10. Evolution of accumulated fresh air deviation.
Energies 12 01278 g010
Figure 11. Evolution of accumulated fuel consumption deviation.
Energies 12 01278 g011
Figure 12. Evolution of accumulated pollutant emissions deviation.
Energies 12 01278 g012
Figure 13. Cumulative pollutants emission compared with Euro 6d sea level and extended limits.
Energies 12 01278 g013
Figure 14. Increase ratio in pollutants emission, considering altitude influence and with respect to diesel Euro 6d, from European diesel passenger car fleet >10 years old, at 1 September 2019.
Energies 12 01278 g014
Figure 15. Increase ratio in pollutants emission, considering altitude influence and with respect to petrol Euro 6d, from European diesel passenger car fleet >10 years old, at 1 September 2019.
Energies 12 01278 g015
Table 1. Specifications of tested Euro IV turbocharged engine.
TypeHSDI Diesel Passenger Car Engine, Euro 4
Displacement1997 cm3
Bore85 mm
Stroke88 mm
Number of cylinders4 in line
Number of valves4 per cylinder
Turbocharger modelVariable Geometry Turbine
Compression ratio15.5:1
Maximum power @ speed120 kW @ 3750 rpm
Maximum torque @ speed340 Nm @ 2000 rpm
Maximum mass flow @ speed640 kg/h @ 4500 rpm & full load
EGR typeCooler, high pressure with intake throttle
AftertreatmentClose coupled DOC, underfloor DOC+DPF
Table 2. Euro 6d emission limits [3].
UnitsTHCCOCO2NOxSootTHC + NOx
DieselSea level [ g k m ] 0.090.5124.520.080.00450.17
Altitude0.09 × 1.50.5124.520.08 × 1.50.0045 × 1.50.17 × 1.5
PetrolSea level0.11146.560.060.00450.16
Altitude0.1 × 1.51146.560.06 × 1.50.0045 × 1.50.16 × 1.5
Table 3. Application period of Euro regulation.
Euro 4Euro 5Euro 6
ApplicationJanuary 2005 September 2009September 2014
Table 4. Global Europe population as a function of altitude.
Sea Level1000 m2000 m3000 m
Percentage of Europe population in 50 km buffer area of massifs [%]40%52%5%3%
Table 5. Passenger cars average travel through Barcelona.
Travels by Passenger Cars a DayAverage Travel Time per Vehicle
Units [ v e h d ] [ m i n v e h ]
Inter urban676,45111.2
Extra urban346,59624.1
Table 6. Vehicles circulating through Spanish roads.
Total km Travel per Spanish Vehicles during a YearPassenger Cars Percentage
Units [ m i l l   k m y   ] [%]
Multi-lane road14,321 92.32
Conventional road88,03191.36
Paid highway21,03786.99
Free highway99,30187.73
Table 7. Diesel passenger cars per kilometer and day in Spain.
WLTC PhasePassenger Cars Driven km per DayPercentage by AgePercentage of DieselDiesel Passenger Cars
Euro 4 or OlderEuro 5Euro 6Euro 4 or OlderEuro 5Euro 6
Units [ m i l l   k m d ] [%][%][%][%] [ m i l l   k m d ] [ m i l l   k m d ] [ m i l l   k m d ]
CityLow6.3177.4216.665.9259.72.920.630.22
Medium11.145.151.110.39
Road & Highway (one country)High256.56118.5825.529.07
Extra-high288.81113.4928.7210.21
Table 8. Decrease of emissions from diesel engine powered passenger cars if the Euro 4 fleet is renewed with Euro 6d diesel engines.
UnitsSea Level City (Barcelona)670 m City (Madrid)Spain Roads & HighwaysEU Roads & Highways
THC + NOx [ t d ] 1.33.2186.31295.8
[%]40.154.972.069.6
CO [ t d ] 5.712.1177.61234.9
[%]52.469.952.249.4
CO2 (GWP) [ t d ] 155.9147.320,624.0143,428.0
[%]10.710.233.731.2
Table 9. Decrease of emissions from passenger cars if the E4 diesel fleet renewal is carried out with E6 diesel engines.
UnitsSea Level City (Barcelona)670 m City (Madrid)Spain Roads & HighwaysEU Roads & Highways
THC + NOx[%]28.845.162.652.5
CO32.049.831.820.9
CO2 (GWP)6.25.922.014.8
Table 10. Decrease of emissions from passenger cars, if the E4 diesel fleet renovation is carried out with E6 petrol engines.
UnitsSea Level City (Barcelona)670 m City (Madrid)Spain Roads & HighwaysEU Roads & Highways
THC + NOx[%]30.746.863.753.5
CO9.533.29.26.1
CO2−0.9−1.216.110.9
GWP−1.4−2.015.510.4

