Pipe Sizing for Novel Heat Distribution Technology


School of Business, Engineering and Science, Halmstad University, P.O. Box 823, SE 30118 Halmstad, Sweden
*
Author to whom correspondence should be addressed.
Energies 2019, 12(7), 1276; https://doi.org/10.3390/en12071276
Submission received: 11 February 2019
/
Revised: 15 March 2019
/
Accepted: 28 March 2019
/
Published: 2 April 2019
Abstract
:This paper assesses pipe sizing aspects for previously proposed, novel, low heat distribution technology with three pipes. Assessment issues include heat loss, pressure loss, and pipe sizing for different typical pipe configurations. This assessment has been provided by the analysis of a case area with single-family houses. Concerning heat loss, the proposed three-pipe solutions have the same magnitude of heat loss as conventional twin pipes, since lower return temperatures compensate for the larger heat loss area from the third pipe. Regarding pressure loss, the main restriction on the size of the third pipe is limited to the pressure loss in the third pipe. Thermostatic valves to manage the flow rate of the third pipe are advocated, since alternative small pumps have not been found to be commercially available. The pipe sizing recommendation is that the third pipe for recirculation purposes can be two to three standard pipe sizes smaller than the corresponding supply and return pipe, if no prosumer is connected in the heat distribution network.
1. Introduction
Utilisation of abundant, renewable and societal excess heat sources to supply a low exergetic heat demand can drive the energy transition towards improved resource efficiency, and provide energy system synergies simultaneously [1]. District heating systems are part of the intermediary technical infrastructure, and connect the supply and demand, enabling beneficial heat recovery [2].
Within the European Union, district heating systems constitute 13% of the heat supply to buildings [3]. Research has found that an expansion of district heating in densely populated areas can increase this number to 60–70%, with only a marginal relative increase of distribution capital cost [4]. Different pathways to obtain a future decarbonised EU energy system have been analysed; one such analysis finds that increased implementation of district heating achieves the cost effective reduction of carbon dioxide emissions [5].
In recent times, the issue of global warming caused by greenhouse gas emissions and the strengthening of improved security of the energy supply results in challenges for the current heat recovery infrastructure. Current district heating systems have been developed with access to readily available, high temperature heat sources, prominently fossil in origin, with high customer heat demands, which allow significant space for inefficiency. This will not be the future case, due to climate change and energy efficiency.
High temperature heat sources are expected to be substituted by low temperature heat sources, originating from renewable and excess heat. The heat demand from new and renovated buildings will decrease with the gradual implementation of energy policy tools, such as the energy performance building directive [6], and the energy efficiency directive [7]. Therefore, the space for system inefficiency will become marginal.
Hence, future changes in supply and demand structures will require an enhanced distribution technology, one that operates at lower temperature levels, eliminates temperature errors to facilitate decreased error margin, and facilitates the implementation of new low temperature heat sources. These changes of future district heating systems have collectively been termed fourth generation district heating (4GDH) [8]. With the current third generation district heating (3GDH) temperature levels, the transition caused by changes in supply and demand structures yields higher costs [9].
A concept of novel heat distribution technology with a corresponding system temperature analysis was published initially in Averfalk and Werner [10]. In essence, the concept contains three technical enhancements of the current heat distribution technology that avoids identified temperature errors in the current 3GDH design. These enhancements are three-pipe heat distribution networks, apartment substations, and an increased thermal length in heat exchangers.
By theoretical modelling, the minimum recirculation flow rate that is required for the third pipe for recirculation in the design conditions was identified to be very small. In the initial analysis, no sizing preferences were considered for the recirculation pipe, as it was considered equal in size to the supply and return pipes. Hence, a comprehensive sizing assessment of the three-pipe heat distribution network is required for further quality assurance of the concept. From a sizing perspective, a number of different parameters are of interest. For instance, what heat loss is expected from the different configurations of the three pipes? What differential pressure might be found on the longest route at the different sizes for the third pipe? According to the standardisation of pipe manufacturing, which sizes for the third pipe could fit inside the casing of the current twin-pipe sizes?
The scope of this paper is to establish a framework for the initial assessment of the sizing of the third pipe regarding network heat and differential pressure loss. The present work is not a final optimisation, but an initial step in the sizing assessment of the third pipe that can serve as a foundation for the further standardisation of the three-pipe configuration, as it is introduced to the market. The scope is based on three research issues:
- What is the assessed specific heat loss for different twin-pipe and triple-pipe configurations?
- What are the assessed differential pressure requirements for different pipe configurations, expressed in terms of pressure head and specific values for the third pipe in the proposed distribution technology?
- What are the feasible design criteria for sizing the third pipe with respect to heat loss, annual pump energy demands, and the space within the casing?
Twin pipes with common casing and insulation are state of the art within the industry, and benchmarking values for determining heat loss are available from manufacturers. Triple pipes, however, are not a well-established product within the industry. Benchmarking values for determining heat loss are therefore not readily available. Hence, a method to assess heat loss for triple-pipe configurations is required.
In the initial analysis, the minimum recirculation flow rate was modelled for the third pipe that is required to maintain sufficient temperature levels in the service pipes connected to customer substations [10]. In that case, no consideration of sizing was incorporated (i.e., the third pipe was the same size as the supply and return pipes, located in a standalone pipe). However, colocation within the same casing is considered beneficial, as heat loss is expected to be kept at a low level. In addition, the required excavation work can be minimised. Colocation of pipes within the same casing is alleviated using a smaller third pipe. However, the third pipe cannot be too small due to the differential pressure loss. In addition, the differential pressure of the third pipe requires pumping power. The quantity of pumping energy and alternative strategies for control of differential pressure within the system require further assessment. With the considered research questions, it is possible to assess the feasible sizing of the third pipe.
2. Methods
The methods utilised in this paper constitute a continuation of the results from the initial analysis, according to [10]. A brief summary of the model prepared in [10] is given in this paragraph. However, in order to fully understand the simulation model, the previous work should be consulted.
2.1. Simulation Model Summary
In our simulation model, each customer is given an equal heat demand situation, and so from this situation; the activity in the substations, together with the chosen supply temperature at the connection point, is assessed. Through an iterative function, the return temperatures from both space heating and domestic hot water heat exchangers are obtained, as well as the mass flow rates of each substation. A minimum mass flow rate is determined on the basis of the temperature drop which is considered acceptable from the service pipe (i.e., the pipe between the substation and distribution pipe). If the mass flow rate of the substation activity is greater than the minimum required, then there is no recirculation flow. However, if the current mass flow rate is less than the minimum, the corresponding difference is separated into the third pipe for recirculation to maintain comfort requirements without temperature contamination. The network is separated into sections to determine the mass flow rate propagation: The distribution in supply pipes, and accumulation in return pipes. To obtain an annual assessment, 20 cases were defined, composed of 10 different time intervals according to the outdoor temperature distribution, including diurnal and nocturnal cycles. The aim of the initial analysis was to establish the novel heat distribution technology concept, and to assess the temperature situation. Regarding heat loss, a simplified method for an analysis of the third pipe was applied, and consisted of a separate pipe in the ground, with equal size.
The analysed case area is a low linear heat density single-family housing area, according to Figure 1. Consisting of 49 single-family houses located in Linköping, each residence is modelled with a floor area of 140 m2 (i.e., 140 square metres), totalling 6860 m2. The total length of the network is 1090 m, while the longest route between the connection point and the last customer is 526 m. The chosen case area constitutes one of the more challenging situations regarding pressure drop in the third pipe for recirculation, since an area with a high heat density and a low proportion of heat loss is expected to generate less need for recirculation flow. The case area is branched, whereas looped systems may alleviate system operation. However, to analyse pressure drop in the third pipe in the most challenging conditions, a branched system with low heat density was chosen.
The dimensions of the pipes in the analysed network are designed for domestic hot water capacities and not space heating capacities. In a small distribution network like the one observed, the heat load diversity for domestic hot water is low. Hence, the designed domestic hot water capacities will determine the minimum dimensions of the pipes.
The differentiation between medium and low temperature operation is divided into the third (3GDH) and fourth (4GDH) generations of district heating technology, as defined by [8]. Implicitly, these terms refer to the distribution technologies without a strategy to avoid temperature contamination between the supply and return during the off-heating season. Specifically, these terms refer to two-pipe systems, and can thus be labelled 3GDH-2P and 4GDH-2P. Hence, by implementing a third pipe in the distribution networks as a strategy to avoid temperature contamination in fourth generation district heating (4GDH), the labelling should read 4GHD-3P, see summary of terminology in Table 1.
2.2. Specific Heat Loss Assessment
This section refers to the first research question about the assessment of specific heat loss for different pipe configurations. If three-pipe systems were to be applied by utilising a standard twin pipe with a single pipe, the hypothetical results would be increased heat loss, and increased demand during construction (excavation). If, on the other hand, the third pipe is integrated with the current standard twin pipes during manufacturing, as depicted in Figure 2, then the hypothetical result is that any heat loss from recirculation can be mitigated, while the excavation is kept constant. Other challenges or requirements in manufacturing or construction may arise; however, such issues are not analysed further in this paper.
To establish a framework for the analysis of the overall heat transfer coefficients, K [W/(m2 K)], a theoretical framework for heat loss is presented in the following paragraphs. Research on steady-state heat loss from insulated pipes by Wallentén (1991) [11] presented approximate formulas for the heat loss from the pipes, considering (i) heat loss from one or two pipes in the ground, (ii) heat loss from two pipes embedded in circular insulation, and (iii) heat loss from two pipes in the ground, embedded in circular insulation.
The approximate formula for heat loss from two pipes embedded in circular insulation is cited in the European Standard EN 15698-1:2009 [12] for calculation of the heat loss coefficient (linear thermal transmittance), λ [W/(m K)]. The preferred method by the standard is to refer to the heat loss by the length of pipe instead of the hot surface area, which is the case of the heat transfer coefficient.
The research presented by Wallentén [11] is derived with the use of the multipole method to compute the conductive heat flows to and between the pipes in a composite cylinder, which was presented by Bennet, Claesson and Hellström in 1987 [13], where the source code for computation also is published. The multipole method analyses the steady-state heat conduction in a two-dimensional circular region perpendicular to the pipes. The defined region is considered homogeneous. For the defined region, the pipes are located within an inner circular region, which is surrounded by an annulus of different thermal conductivity. The multipole method was developed to assess the heat extraction from boreholes and ground heat storage. The method is featured in more recent research [14,15].
The approximate formula presented in [11] considers two pipes. However, the multipole method can be utilised to determine the steady-state, two-dimensional heat loss from district heating pipes with different pipe configurations. In this paper, the multipole method is utilised to determine the specific heat flow rates [W/m] for different standard two-pipe (twin) configurations, and the proposed three-pipe configurations.
Information related to the determination of pipe geometries is presented in the following paragraphs. Information about steel pipe dimensions (DN15-1200) and casing dimensions are specified in the European Standard EN 253:2009+A2:2015 [16], while information about twin-pipe market configurations regarding steel pipes (DN15-250), casing dimeters (insulation series 1–3), and the distance between the steel pipes, is specified in [12]. No specified information regarding the steel pipes in the size range of DN6-10 has been identified. These small pipe sizes will be considered for the recirculation pipe assessment. Hence, the estimated properties for these small pipes have been derived from the European Standard EN 10220:2002 [17].
Data from [12,16,17] are sufficient to establish the geometries to compute heat loss for twin pipes at each respective insulation series. Furthermore, the geometries for a twin-pipe configuration with an additional third recirculation pipe, the three-pipe configuration, can be determined. While varying the coordinates of the third pipes, the supply and return pipes remained fixed in their original position. The centres of the recirculation pipes are fixed in the y-axis of the casing origins and are varied in the x-axis, depending on the number of displacements (see Figure 2), so that the minimum distance from the supply and return pipes is equal to the minimum distance for that of the supply and return pipes, according to [12].
The categorisation for the sizing assessment is arranged according to the ordinary reference twin pipe denoted by a (-), while the recirculation pipe is divided in a number of downward displacements (5) ranging from 0 to 4, where a 0 denotes a recirculation pipe with equal dimensions to the supply and return pipes, a 1 denotes a recirculation pipe with smaller dimensions by one standard size, compared to the supply and return pipes, etc. Thus, as the size of the third pipe decreases, the distance from the supply and return pipes is adjusted to match the standard minimum distance between pipes.
Apart from the coordinates for the pipe geometries, the multipole method requires the numerical values for the radius of the outer circle of analysis and the thermal conductivity for the outer circular region (soil) and the inner circular region (insulation).
According to [11], the radius of the outer circle can be substituted with twice the depth. It is unclear what the depth norm at construction is. Pipes are not required to be laid at a frost-free depth, which corresponds to approximately below 1 m in southern Scandinavia. However, 1 m is the assumed depth for laying pipe [2]. Hence, the numerical value for the diameter of the outer circle is chosen to be 2 m.
According to Ref. [16], thermal conductivity for insulation in unaged conditions should not exceed 0.029 W/(m K). Thermal conductivity increases with temperature. An approximate formula to determine the thermal conductivity of polyurethane foam within a specified temperature interval was presented by Bøhm and Kristjansson in 2005 [18]. The numerical value of thermal conductivity for the insulation material in this analysis is set to 0.026 W/(m K), which is the same as that used by one of the large pipe manufacturing companies in the product catalogue [19]. The thermal conductivity of soil is difficult to estimate due to the variation in moisture content, soil composition, and homogeneity. However, a constant of 1.5 W/(m K) is utilised in the present analysis, corresponding to [18].
The specific heat flow output rate is given as Φ/L [W/m] for each involved pipe. For modelling purposes, the individual values of these pipes are recalculated as heat transfer coefficients, K [W/(m2, K)], which refer to the surface area of the media pipes, rather than the length of pipes. The reason is that the use of heat transfer coefficients is a common practice in fundamental heat transfer theory. Hence, heat transfer coefficients for supply, return and recirculation pipes are determined according to Equation (1):
The parametric outcome is determined with the variation of pipe size (DN20-DN250), insulation level (1–3), number of displacements (0–4), and return temperatures (15–40 °C). The other parameters, the supply temperature and recirculation temperature, remain constant at annual average temperatures, which is 54 °C for the supply pipe, and 50 °C for the recirculation pipe, while the annual average ambient temperature is set to 10 °C. The variation of the return temperature is set to steps of Δt equal to 5 °C, and the integer values in between are generated through interpolation.
2.3. Pressure Loss Assessment
This section refers to the second research question about differential pressure assessment. The design condition for the third pipe occurs at no load situations. In the analysis, this situation is substituted with the case of the highest outdoor temperatures at night time, when no space heating demand nor domestic hot water demand occurs among customers. The design conditions are associated with low flow rates; thus, small pressure head loss is anticipated.
The longest route along the network is also the critical route, constituting the highest pressure head loss, since all other shorter possible routes of the observed case area network should exhibit less total pressure head loss. Thus, the longest route is utilised to display the pressure situation.
The pressure drop Δp [Pa] is determined and summed for each section length of pipe L [m] for the longest route in the case area network (see Figure 1, according to Equation (2) found in [2]). The minimum recirculation flow rate [kg/s] is defined in [10]. In the equation, the friction factor λ = 0.025 [-] and the density ρ = 1000 [kg/m3] are all treated as constants, while the inner pipe diameter di [m] is changed accordingly, depending on pipe configuration. The pressure drop depends on the inner pipe diameter raised to the power of five. Hence, the changes of inner pipe diameter have a major influence on the pressure drop outcome:
A commonly used criterion is that the pressure gradients in the supply flow direction should be consistent with the values of the specific pressure drop that ranges between 50 and 200 Pa/m [2], since further increased pump power has a diminishing return on the increased flow velocity. The corresponding pressure conditions should apply to the recirculation flow direction.
The pumping power Pel [W] for the design conditions is calculated according to Equation (3) found in [2]. In the case of the central control method, the required pressure lift Δppump [Pa] for the recirculation pipe corresponds to the largest pressure drop of the case area, according to Equation (2). The pump efficiency η [-] is considered, and in this case, a flat 0.8 is used:
Thus, at the connection point for the case area, the collective sum of the minimum recirculation flow rate is recalculated as the volume flow rate [m3/s] according to Equation (4):
Regarding the heat distribution and pressure assessment, a common starting point is to observe the main distribution line, and consider the option in order to avoid oversizing the distribution network sections because of an overestimation of the required domestic hot water capacity, which is common due to the uncertainty in the design, and the lack of measurements [20]. The attractiveness of smaller pipes lies with less heat loss [21]. However, in the analysed case area, due to heat loads that are not fully diversified, the piping networks are designed to manage domestic hot water capacity loads. A large proportion of the case area constitutes the service pipe, where the greatest required capacity is determined by domestic hot water preparation, around 35 to 40 kW compared with the design space heating loads at 5 to 10 kW. Hence, pipe dimensions could not be downsized to decrease heat loss, since the area is designed for domestic hot water capacity.
2.4. Sizing of the Third Pipe
This section refers to the third research question about the feasible design criteria for sizing the third pipe with respect to heat loss, annual pump energy demand, and the space within the casing. The design criteria refers to a design that minimises the size of the third pipe without obtaining too high a pressure drop. The methodology in this section is a merger of the methodology in [10] with the results from the two previous research questions. On the basis that current design conditions for the distribution network refer to the domestic hot water demand, there is an option to reduce the size of the third pipe, since the recirculation flow rates should never be the same magnitude of size as the domestic hot water capacity.
3. Results
3.1. Specific Heat Loss Assessment
This section refers to the first research question about the heat loss assessment for different pipe configurations with a third pipe for recirculation. A selection of output regarding 4GDH-2P (twin pipes) is presented in Figure 3. Correspondingly, a selection of output regarding 4GDH-3P (three pipes) is presented in Figure 4. The selection is limited to the pipe sizes of the analysed network (DN20-DN65) in addition to the selective choice of three insulation series for both cases and three downward displacements in the case of 4GDH-3P. Heat loss is separated by each respective pipe at different return temperatures, ranging from 15 °C to 40 °C. At 4GDH operation temperatures, it is observed that the specific heat loss is low, regardless of the pipe configuration.
The results indicate that the total specific heat loss rate is slightly lower for 4GDH-2P, according to Figure 3, compared to 4GDH-3P, according to Figure 4. Regarding the specific heat loss rates, Φ/L [W/m], at a low temperature heat distribution, low values ranging from 3.4 to 8.8 W/m based on the total of the specific heat loss, are observed for both the ordinary twin-pipe and three-pipe configurations within the chosen range of output parameters.
On the basis of the chosen output parameters, ordinary twin pipes (4GDH-2P) display slightly smaller specific heat loss rates at an average (with the corresponding standard deviation) of 5.2 ± 1.0 W/m. The corresponding value for three pipes (4GDH-3P) for 2 displacements is 6.5 ± 1.1 W/m and for 3 displacements is 6.2 ± 1.0 W/m. Hence, a small variation in heat loss between 4GDH-2P and 4GDH-3P pipe configurations is expected.
One of the benefits of the twin pipes is that the heat loss from the return pipes is mitigated since the pipes are located within the temperature field of the supply pipe. This is observed in Figure 3, where the specific heat loss from the return pipes is close to zero for each analysed dimension at around 30 °C. At lower return temperatures, some of the supply pipe heat loss becomes heat gain for the return pipe, through negative heat loss. Negative heat loss is observed for both 4GDH-2P and 4GDH-3P. However, negative heat loss is not an inherently adverse characteristic, since heat loss from warm pipes becomes heat gain for the return pipes, thus maintaining more heat within the system. Such a low temperature level is not expected to occur in 4GDH-2P, because domestic hot water preparation primarily generates such low temperature levels in district heating substations compared to space heating systems, which are assumed to generate slightly higher temperatures (around 30 °C in a good case). However, during summer when the domestic hot water preparation constitutes the dominant portion of heat loads, a significant amount of hot supply water is recirculated in the return pipe, resulting in temperature contamination.
Based on the output, a set of heat transfer coefficients is generated according to the methodology section. Thus, each network section of the simulation has a set of heat transfer coefficients for each respective pipe, which depends on the simulated output regarding the temperature levels for the initial value of each network section.
3.2. Pressure Loss Assessment
This section refers to the second research question about the differential pressure assessment with respect to different pipe configurations for a third pipe to carry out recirculation. The pressure gradient curve displaying the pressure head loss during high-load situations (winter) is presented in Figure 5 with a return pipe pressurisation of 200 kPa, and a minimum differential pressure level of 100 kPa at the outermost customer. The discussion about pressure head loss within district heating systems tends to focus on the high-load situation during winter, since this is when the systems are typically under the most strain, that is, where deficits of differential pressure might occur. However, under high-load situations, no pressure head loss in the third pipe is observed, regardless of the displacement levels. This is because there are no demands for recirculation flow since the flow levels from the substation activities are greater than the minimum flow requirements.
For the design conditions for the third pipe (for summer nights), the pressure gradient curve displays entirely different characteristics, according to Figure 6. During summer nights, no customer heat load is present, and consequently, there is no mass flow rate, yielding only a minor pressure head loss in the supply pipe, corresponding to the flow rates caused by recirculation, and none in the return pipe since the flow rates are effectively zero. In this case, a variation between the different levels of displacement emerges. At 0, the displacement pressure head loss in the third pipe is equal to that of the supply pipe. At downward displacements (1–4), the pressure head loss quickly increases at increased levels of displacement.
At the design conditions for the third pipe, the aggregated minimum mass flow rate for the observed case area is 0.93 kg/s. The data for the system differential pressure at different displacements (0–4) with the corresponding requirements of pumping power [W], according to Equation (3), are presented in Table 2. Hence, the pumping power requirements are low.
The specific pressure loss in the third pipe at the design conditions at different levels of displacement along the longest route, which is separated into each respective section of the network, is presented in Figure 7. The characteristic specific pressure drop that is obtained as the customer flow rate, accumulated backwards in the distribution network, is observed (i.e., the change between DN40 in section n = 26 and DN50 in section n = 25 and between DN50 in section n = 17 and DN65 in section n = 16). Since the dimensions of the third pipe follow the dimensions of the supply and return pipes, the characteristics are transferred to the third pipe. Hence, the weak point comprises the network sections where mass flow rates from multiple pipes combine. Four displacements would yield a specific pressure loss in a majority of the network sections that are above the range of 100–200 Pa/m, which could constitute a feasible target for specific pressure loss, whereas 3 displacements in the majority of the network sections remain within or below a feasible range of specific pressure loss.
Regarding the pressure loss assessment, this analysis identified the design conditions when the greatest requirement for recirculation flow occurs during summer nights, when flow stagnation appears in the ordinary supply and return due to low heat demands. At the design conditions, head loss in the supply pipe is nearly zero, while for return pipes, it is zero, according to Figure 6. A parametric variation of 0 to 4 downward displacements of the recirculation pipe, related to the size of the supply and return pipes, is presented. The results indicate that a recirculation pipe with 0 to 1 downward displacements generate a small pressure head loss, while a downward displacement of 4 generates a large pressure head loss. Hence, the analysis of a fifth displacement is not warranted. Thus, the desirable levels of pressure head loss are found within 2 to 3 downward displacements. For the analysed case area, the average specific pressure head loss with the corresponding standard deviation with 2 displacements is 31 ± 21 Pa/m, while for 3 displacements, it is 76 ± 42 Pa/m. The assessed required pump power for 2 displacements is 22 W and for 3 displacements is 52 W.
3.3. Size of the Third Pipe
This section refers to the third research question about the sizing estimation for the recirculation pipe with respect to annual heat loss, annual pump energy, and the space within the casing. The effect of the thermal length on the heat exchanger has no significant effect for pipe sizing purposes. In addition, the effect of the thermal length regarding heat loss and pumping energy is small. Hence, there is no differentiation between short and long thermal lengths, compared to the previous analysis [10].
In this analysis, a sizing assessment for a third pipe for recirculation in the heat distribution system has been performed. Regarding the sizing of the third pipe, two criteria are of major concern: (1) Smaller pipes yield less annual heat loss, and (2) smaller pipes yield increased annual energy pumping demands. In addition, a set of standard pipe sizes exists. A method to determine heat loss and pressure loss has been established.
A parametric approach was applied, observing the results from the third pipe used for recirculation at an equal size as the supply and return pipes (0 displacement), and downward in size according to the standard pipe sizes (1–4 displacements). The results indicate that the annual heat loss from the novel heat distribution technology is on the same order of magnitude as an ordinary twin-pipe system when the third pipe is displaced 3 to 4 times. Similarly, the results indicate that the additional demand of the annual pumping energy is small as long as the third-pipe displacement does not exceed 2 to 3. Hence, as an initial recommendation, the third pipe should be 2 to 3 standard sizes smaller than the corresponding supply and return pipes, regarding heat loss and pressure loss.
3.3.1. Size of the Third Pipe: Heat Loss
The results regarding the annual heat loss are presented in Figure 8. On an annual basis, heat loss from 4GDH-3P distribution networks is greater, with 0 downward displacement since the third pipe is closer to the casing, resulting in a situation with less insulation surrounding the recirculation pipe. However, at increased downward displacements, it is observed that the annual heat loss is at parity with the annual heat loss level of 4GDH-2P.
When observing the proportion of distribution heat loss for 10 different specific heat demand levels and three different system configurations, the results according to Figure 9 are obtained. The third generation district heating (3GDH) system is configured with the contemporary temperature levels of 86 °C in the supply pipes and 47 °C in the return pipes, corresponding to the average values of Swedish district heating systems [2]. In addition, heat loss coefficients corresponding to the heat distribution with single pipes are utilised.
The benefits between 3GDH and 4GDH-2P are two-fold: Twin pipes generate lower heat loss from return pipes compared to single pipes, and less heat loss is generated at lower temperature levels. However, the major result is that the relative heat loss of 4GDH-3P system configurations is at parity with 4GDH-2P. Hence, heat loss from the three-pipe configuration is expected at the same order of magnitude as for the twin-pipe configuration. However, the benefits of a lower return temperature with the 4GDH-3P compensate for the additional heat loss from the third pipe, compared to the 4GDH-2P. At an annual high specific heat demand, heat loss from 4GDH-3P is somewhat lower than that of the 4GDH-2P solution, whereas the opposite is valid for an annual low specific heat demand. A higher proportion of recirculation flow at a lower specific heat demand can explain this change. At 42 kWh/m2, a the recirculation flow will be in operation for 8590 h, while only 4740 h are required at 121 kWh/m2, a. These additional operation hours generate more heat loss. However, it should be noted that the major benefit of 4GDH-3P is that lower return temperatures are obtainable due to avoiding temperature contamination.
3.3.2. Size of the Third Pipe: Pumping Energy
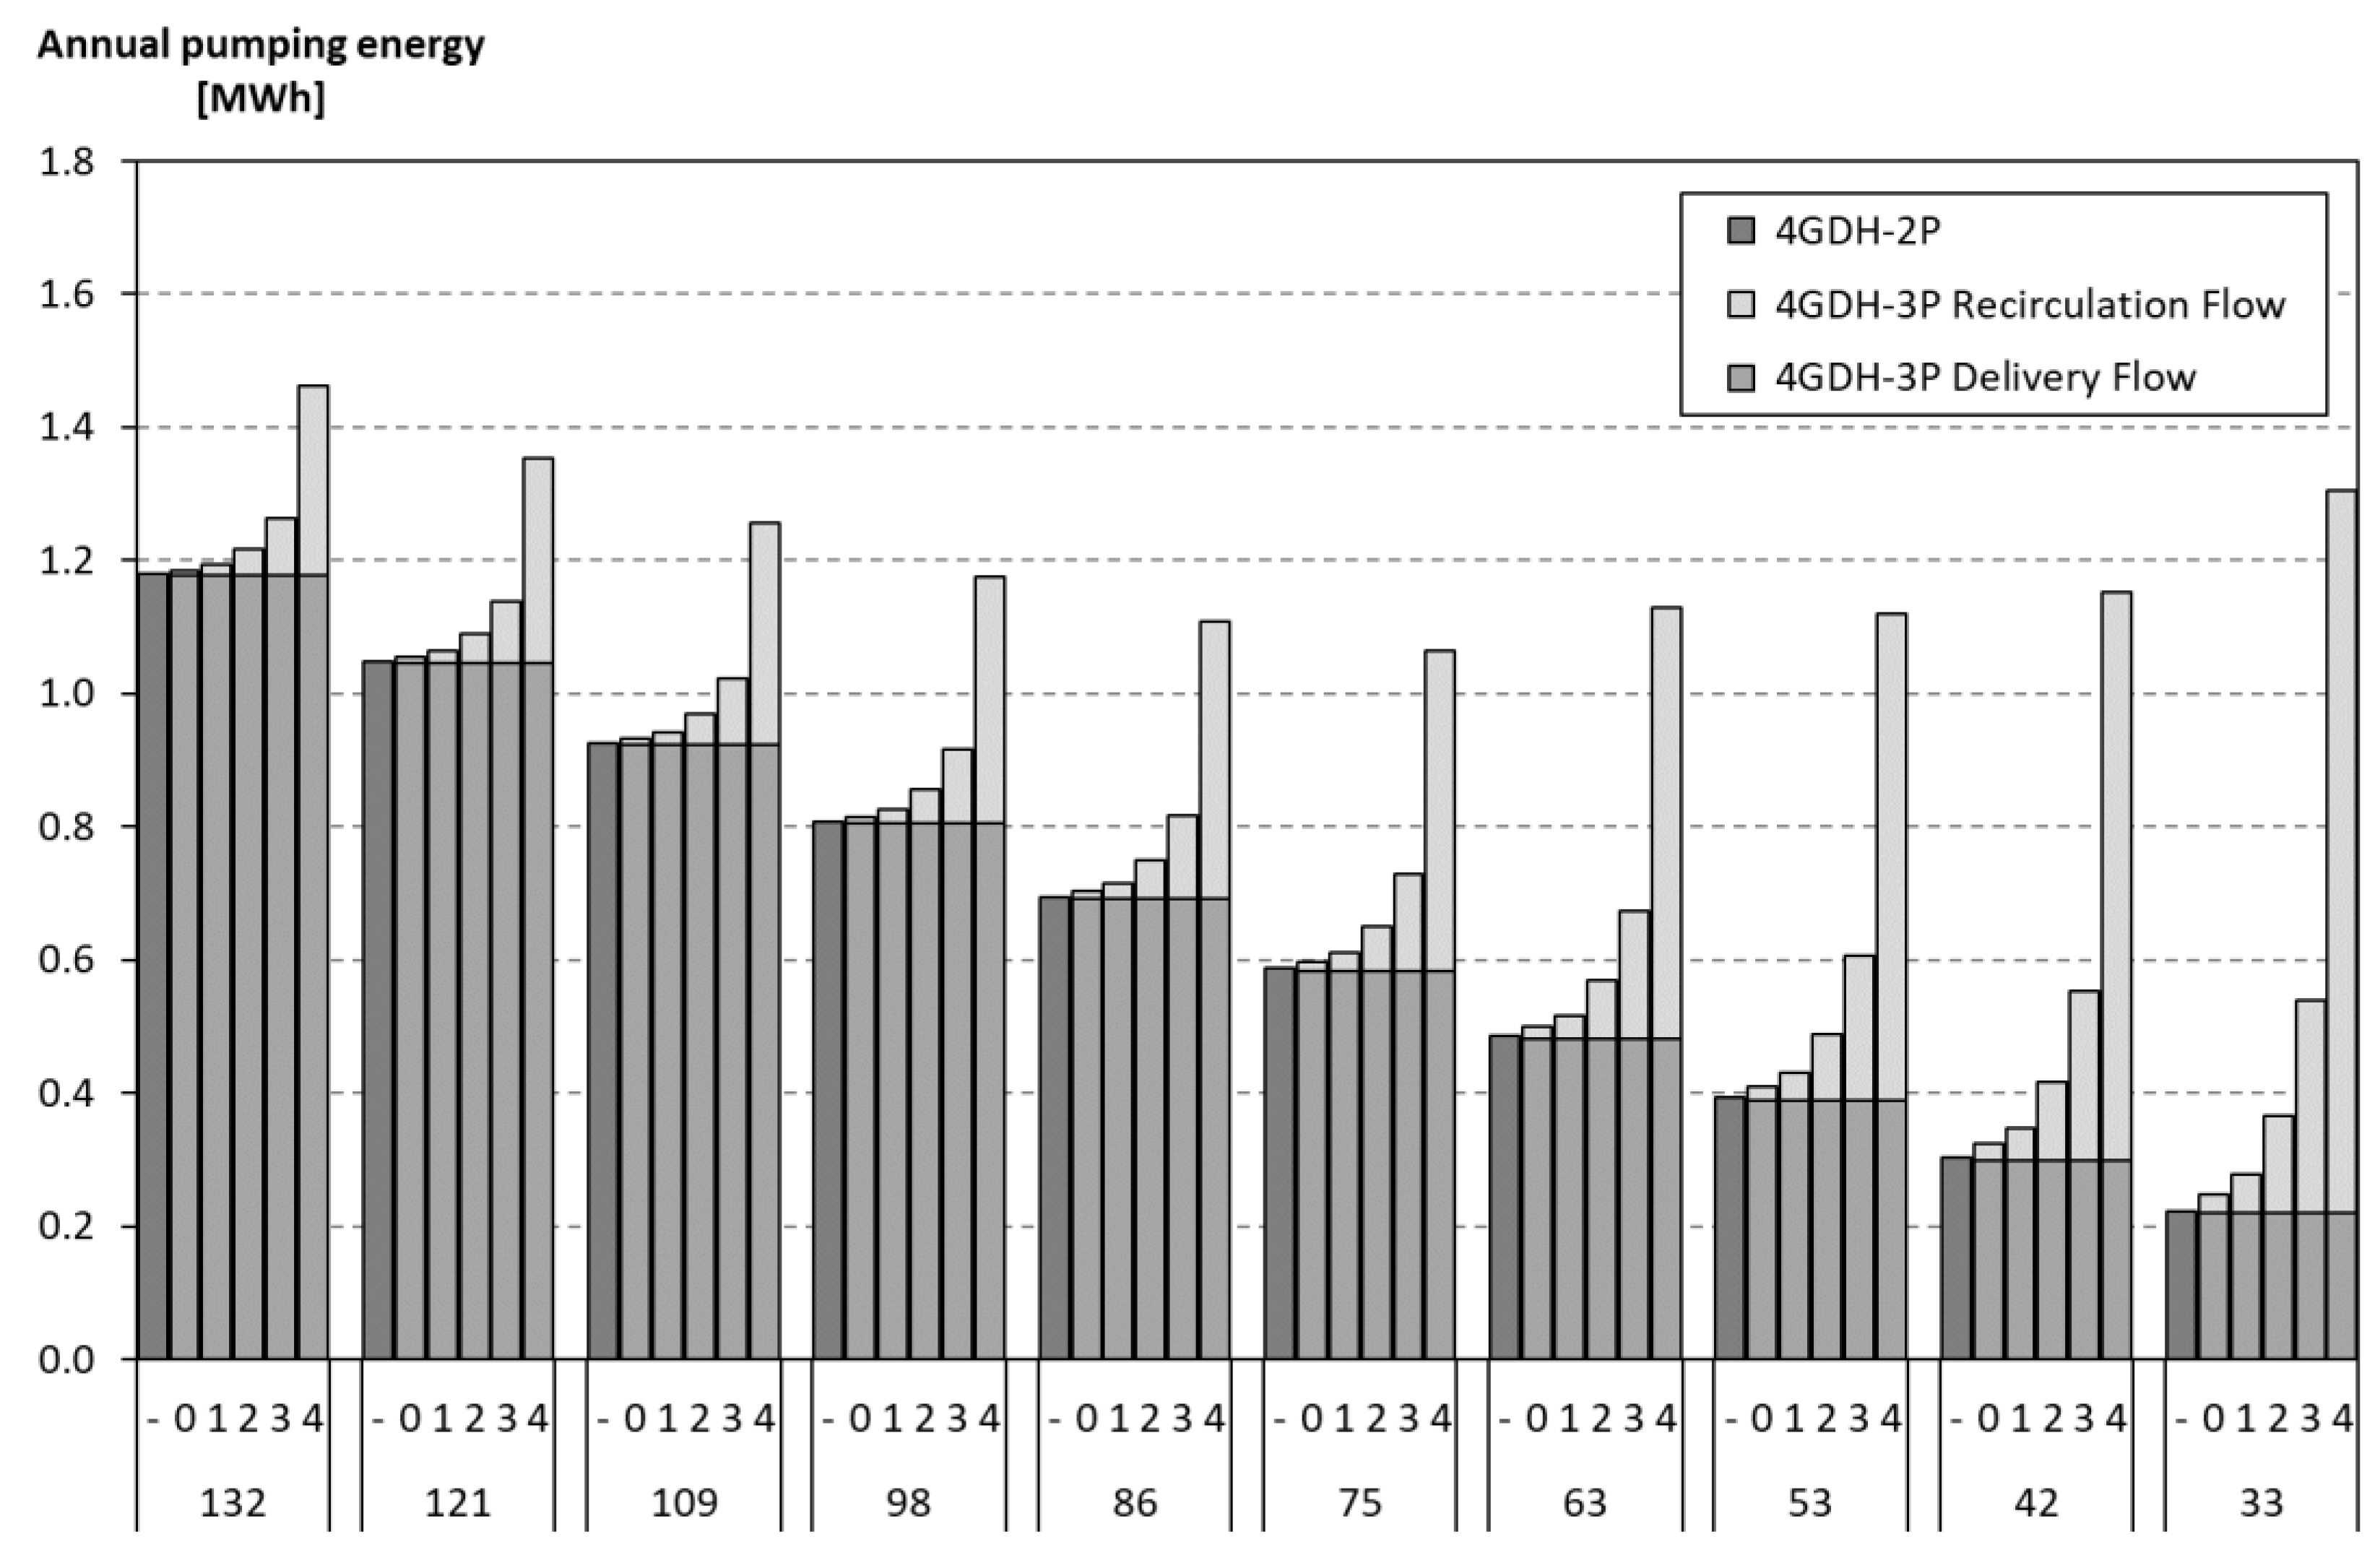
The results regarding the annual demand for pumping energy are presented in Figure 10. The levels of pumping power required for 4GDH-2P and 4GDH-3P system configurations are at close parity when a third pipe with 0 downward displacements is employed. Since the recirculation flow rates occur at a low customer heat demand, the pressure head loss in the system while recirculation flow occurs, is low. Thus, additional annual pumping energy is required when the number of displacements increases. As observed in Figure 10, the increase in the annual pumping energy is proportional to the inner pipe diameter raised to the power of five, according to Equation (2). Hence, downward displacements of the third pipe yield a rapid increase of annual pumping power, even with small mass flow rates. The analysis of downward displacements exceeding 4 would be futile, since the annual pumping power would occur at disproportional levels.
The major result is that the additional pumping energy required to operate 4GDH-3P is not a major hurdle preventing its implementation, since only a moderate marginal increase of annual pumping energy is required for 4GDH-3P compared to 4GDH-2P.
3.3.3. Size of the Third Pipe: Space within Casing
Out of the 180 considered pipe configurations (DN20-DN250, three insulation series, and five levels of displacements); the third pipe extends to the outer casing only in 15 cases, resulting in an impossible case. Twelve of these impossible cases occur at 0 displacement, while the other three occur at 1 displacement. The impossible cases are not considered in the final recommendations, since the results indicate that 2 to 3 downward displacements are recommended to maintain the minimum recirculation flow rate in the recirculation pipe. Hence, a smaller third pipe fits within the standard casings for the current prefabricated twin pipes provided by international manufacturers.
4. Discussion
The proposed technical solution with triple pipes in heat distribution networks results in a controlled recirculation flow, which only occurs when demanded, as opposed to the current system design where the recirculation flow occurs without sufficient control (i.e., by continuous built-in leakage flow from small valves, or by small openings in substations). Distribution areas in district heating systems have different characteristics, so every area is a specific case. Therefore, this analysis has been performed on an area with a low heat density, generating high heat loss and high recirculation flow. Other areas with a higher heat density are expected to have a lower recirculation flow than estimated in this analysis. Hence, this analysis constitutes the worst-case scenario. If implementation is found to be feasible in such areas, the areas with a higher heat density should be able to utilise smaller recirculation pipes.
However, our choice of analysing a case area with low diversity is because areas with a high diversity might not be representative of the current results regarding the number of displacements.
Heat transfer coefficients for the three-pipe configuration consist of an approximation of reality. The parametric variation space constitutes 12 pipe sizes (DN20-DN250), three standard insulation levels (1–3), five levels of displacements (0–4), three values, one for each respective pipe (supply, return, and recirculation), and 41 different return temperature levels (5–45 °C), yielding a total of 22,140 different heat transfer coefficients. More variation could be interesting, primarily a variation of supply and recirculation temperatures. However, the temperature variation in the supply pipe and recirculation pipe is considered of such a magnitude that more detailed information would not increase the accuracy of the conclusions.
The prosumer perspective, as elaborated by Brange et al. [22,23], has not been considered in the present analysis. A prosumer is a customer who can also feed in heat locally into the distribution network. It would be a future possibility to integrate the third pipe with prosumers and thus avoid temperature requirements among prosumers. However, the present study aims to establish the proposed distribution concept regarding the required minimum size of the third pipe that is used for recirculation. Concerning prosumers, a different sizing assessment with wider recirculation pipes would be required, since another mass flow situation is expected.
5. Conclusions
This paper assesses heat and pressure loss from a novel heat distribution technology. Regarding the three research questions, the following four main conclusions can be reached based on the performed analyses. First, heat loss from triple-pipe systems will be at the same order of magnitude as the current twin-pipe systems, since the recirculation pipe can be smaller than the ordinary supply and return pipes. Second, pressure loss from three-pipe systems will yield a marginal increase of pumping power demand to separate recirculation flow into the third pipe. Third, the design criteria for the third pipe can be 2 to 3 standard sizes smaller without compromising system integrity or system operation concerning heat loss, pressure loss, or space within the pipe casing. Fourth, a future possibility is to use the third pipe to collect heat flows from prosumers that can feed in heat locally into low temperature networks, without reaching the prescribed supply temperature. However, the third pipe must then be wider than estimated in this study.
Author Contributions
Conceptualization, H.A. and S.W.; Methodology, H.A. and S.W.; Software, H.A. and F.O.; Validation, H.A., F.O. and S.W.; Formal Analysis, H.A., F.O. and S.W.; Investigation, H.A.; Resources, H.A.; Data Curation, F.O.; Writing-Original Draft Preparation, H.A.; Writing-Review & Editing, H.A., F.O. and S.W.; Visualization, H.A.; Supervision, F.O. and S.W.; Project Administration, H.A. and S.W.; Funding Acquisition, H.A.
Funding
This research was funded by Horizon 2020 Framework Programme grant number 768936.
Acknowledgments
This work has been performed within the context of the TEMPO project, funded by the European Union’s Horizon 2020 programme under grant agreement 768936.
Conflicts of Interest
The authors declare no conflict of interest.
References
- Gong, M.; Werner, S. Exergy analysis of network temperature levels in Swedish and Danish district heating systems. Renew. Energy 2015, 84, 106–113. [Google Scholar]
- Frederiksen, S.; Werner, S. District Heating and Cooling; Studentlitteratur AB: Lund, Sweden, 2013. [Google Scholar]
- Werner, S. International review of district heating and cooling. Energy 2017, 137 (Suppl. C), 617–631. [Google Scholar] [CrossRef]
- Persson, U.; Werner, S. Heat distribution and the future competitiveness of district heating. Appl. Energy 2011, 88, 568–576. [Google Scholar] [CrossRef]
- Connolly, D.; Lund, H.; Mathiesen, B.V.; Werner, S.; Möller, B.; Persson, U.; Boermans, T.; Trier, D.; Østergaard, P.A.; Nielsen, S. Heat Roadmap Europe: Combining district heating with heat savings to decarbonise the EU energy system. Energy Policy 2014, 65, 475–489. [Google Scholar] [CrossRef]
- Directive 2010/31/EU of the European Parliament and of the Council of 19 May 2010 on the Energy Performance of Buildings; [2010] OJ L153/13; European Parliament: Strasbourg, France; Council of the European Union: Brussels, Belgium, 2010.
- Directive 2012/27/EU, Directive 2012/27/EU of the European Parliament and of the Council of 25 October 2012 on Energy Efficiency Amending Directives 2009/125/EC and 2010/30/EU and Repealing Directives 2004/8/EC and 2006/32/EC; [2012] OJ L315/1; European Parliament: Strasbourg, France; Council of the European Union: Brussels, Belgium, 2012.
- Lund, H.; Werner, S.; Wiltshire, R.; Svendsen, S.; Thorsen, J.E.; Hvelplund, F.; Mathiesen, B.V. 4th Generation District Heating (4GDH): Integrating smart thermal grids into future sustainable energy systems. Energy 2014, 68, 1–11. [Google Scholar] [CrossRef]
- Lund, H.; Østergaard, P.A.; Chang, M.; Werner, S.; Svendsen, S.; Sorknæs, P.; Thorsen, J.E.; Hvelplund, F.; Mortensen, B.O.G.; Mathiesen, B.V.; et al. The status of 4th generation district heating: Research and results. Energy 2018, 164, 147–159. [Google Scholar] [CrossRef]
- Averfalk, H.; Werner, S. Novel low temperature heat distribution technology. Energy 2018, 145, 526–539. [Google Scholar] [CrossRef]
- Wallentén, P. Steady-State Heat Loss From Insulated Pipes; Licentiate Thesis, Report TVBH-3017; Dept. of Building Physics, Lund Institute of Technology: Lund, Sweden, 1991. [Google Scholar]
- European Committee for Standardiztion (CEN). District Heating Pipes—Preinsulated Bonded Twin Pipe Systems for Directly Buried Hot Water Networks—Part 1: Twin Pipe Assembly of Steel Service Pipe, Polyurethane Thermal Insulation and Outer Casing of Polyethylene; European Standard EN 15698-1:2009; European Committee for Standardiztion: Brussels, Belgium, 2009. [Google Scholar]
- Bennet, J.; Claesson, J.; Hellström, G. Multipole Method to Compute The Conductive Heat Flows to and between Pipes in a Composite Cylinder; Lund University: Lund, Sweden, 1987. [Google Scholar]
- Claesson, J.; Hellström, G. Multipole method to calculate borehole thermal resistances in a borehole heat exchanger. HVAC R Res. 2011, 17, 895–911. [Google Scholar]
- Javed, S.; Claesson, J. Second-order multipole formulas for thermal resistance of single U-tube borehole heat exchangers. In Proceedings of the IGSHPA Technical/Research Conference and Expo, Denver, CO, USA, 14–16 March 2017. [Google Scholar]
- European Committee for Standardiztion (CEN). District Heating Pipes—Preinsulated Bonded Pipe Systems for Directly Buried Hot Water Networks—Pipe Assembly of Steel Service Pipe, Polyurethane Thermal Insulation and Outer Casing of Polyethylene; European Standard EN 253:2009+A2:2015; European Committee for Standardiztion: Brussels, Belgium, 2015. [Google Scholar]
- European Committee for Standardiztion (CEN). Seamless and Welded Steel Tubes—Dimensions and Masses Per Unit Length; European Standard EN 10220; European Committee for Standardiztion: Brussels, Belgium, 2002. [Google Scholar]
- Bøhm, B.; Kristjansson, H. Single, twin and triple buried heating pipes: On potential savings in heat losses and costs. Int. J. Energy Res. 2005, 29, 1301–1312. [Google Scholar] [CrossRef]
- Powerpipe, Product Catalogue, 2016 ed.; Powerpipe Systems AB: Gothenburg, Sweden, 2016.
- Koiv, T.-A.; Mikola, A.; Palmiste, U. The new dimensioning method of the district heating network. Appl. Therm. Eng. 2014, 71, 78–82. [Google Scholar] [CrossRef]
- Dalla Rosa, A.; Li, H.; Svendsen, S. Method for optimal design of pipes for low-energy district heating, with focus on heat losses. Energy 2011, 36, 2407–2418. [Google Scholar] [CrossRef]
- Brand, L.; Calvén, A.; Englund, J.; Landersjö, H.; Lauenburg, P. Smart district heating networks—A simulation study of prosumers’ impact on technical parameters in distribution networks. Appl. Energy 2014, 129, 39–48. [Google Scholar] [CrossRef]
- Brange, L.; Englund, J.; Lauenburg, P. Prosumers in district heating networks—A Swedish case study. Appl. Energy 2016, 164, 492–500. [Google Scholar] [CrossRef]
Figure 1.
Network layout for the case area with the longest route is denoted with a thicker line. The connection point to the feeding distribution network is to the left.
Figure 1.
Network layout for the case area with the longest route is denoted with a thicker line. The connection point to the feeding distribution network is to the left.
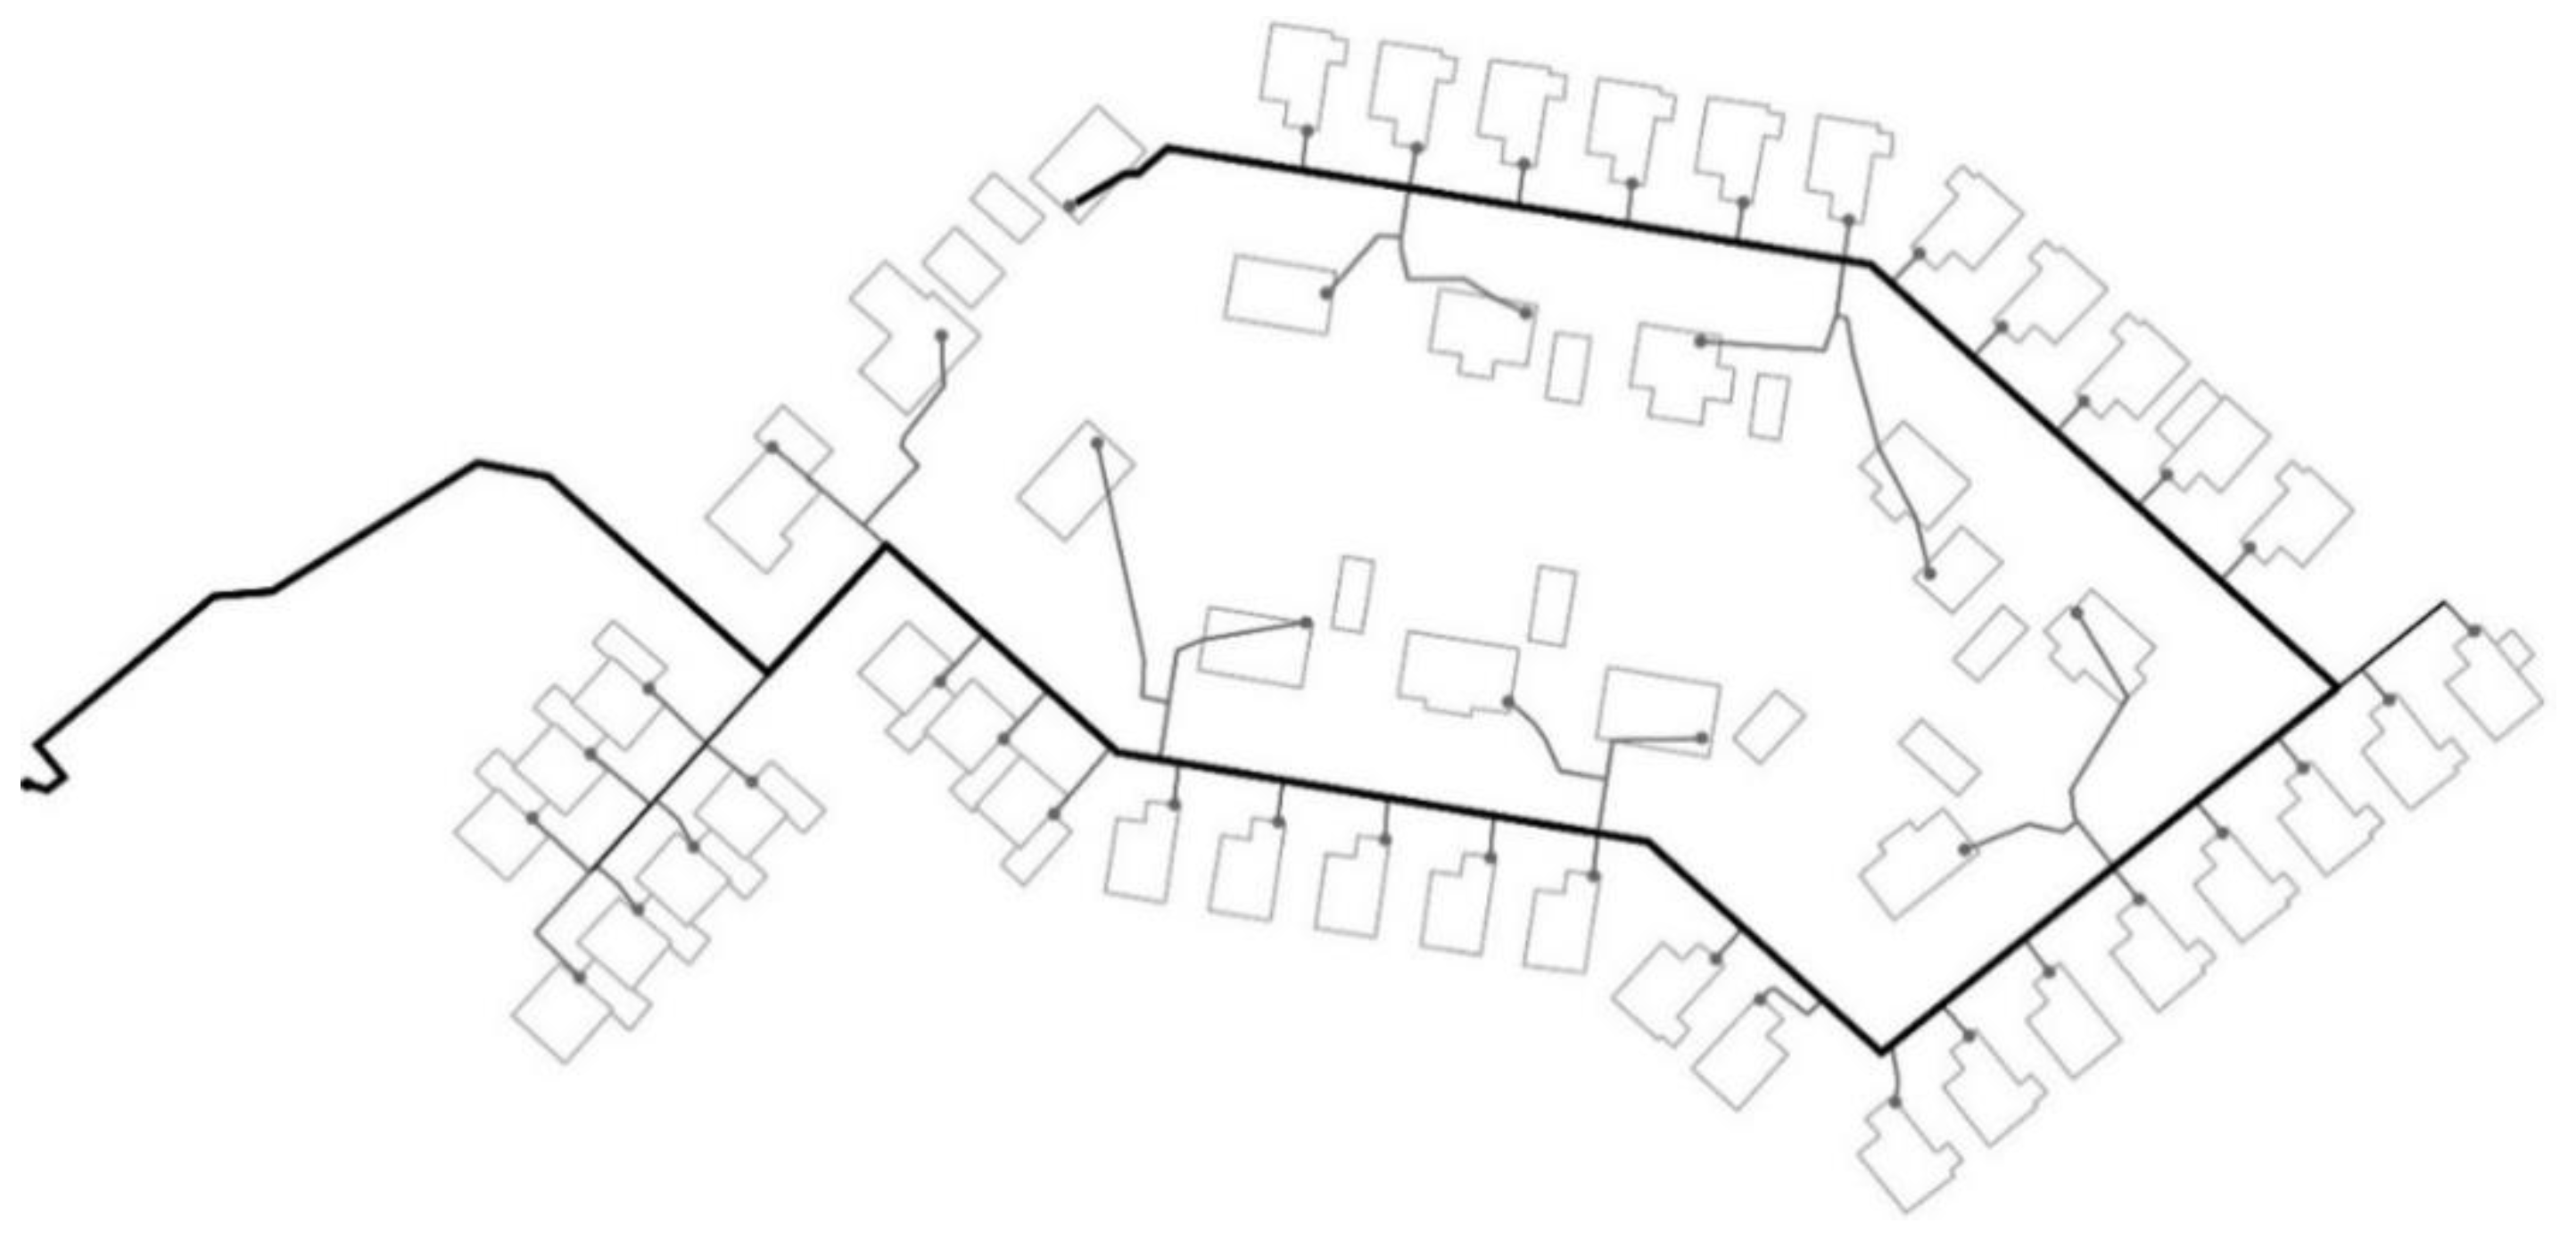
Figure 2.
Visual representation of the current twin-pipe configuration (4GDH-2P) compared to the potential 4GDH-3P pipe configuration for DN65, with three insulation standards in geometry and for temperatures according to [10]. The third pipe in 4GDH-3P is displaced three sizes downward (i.e., a DN32 pipe is utilised).
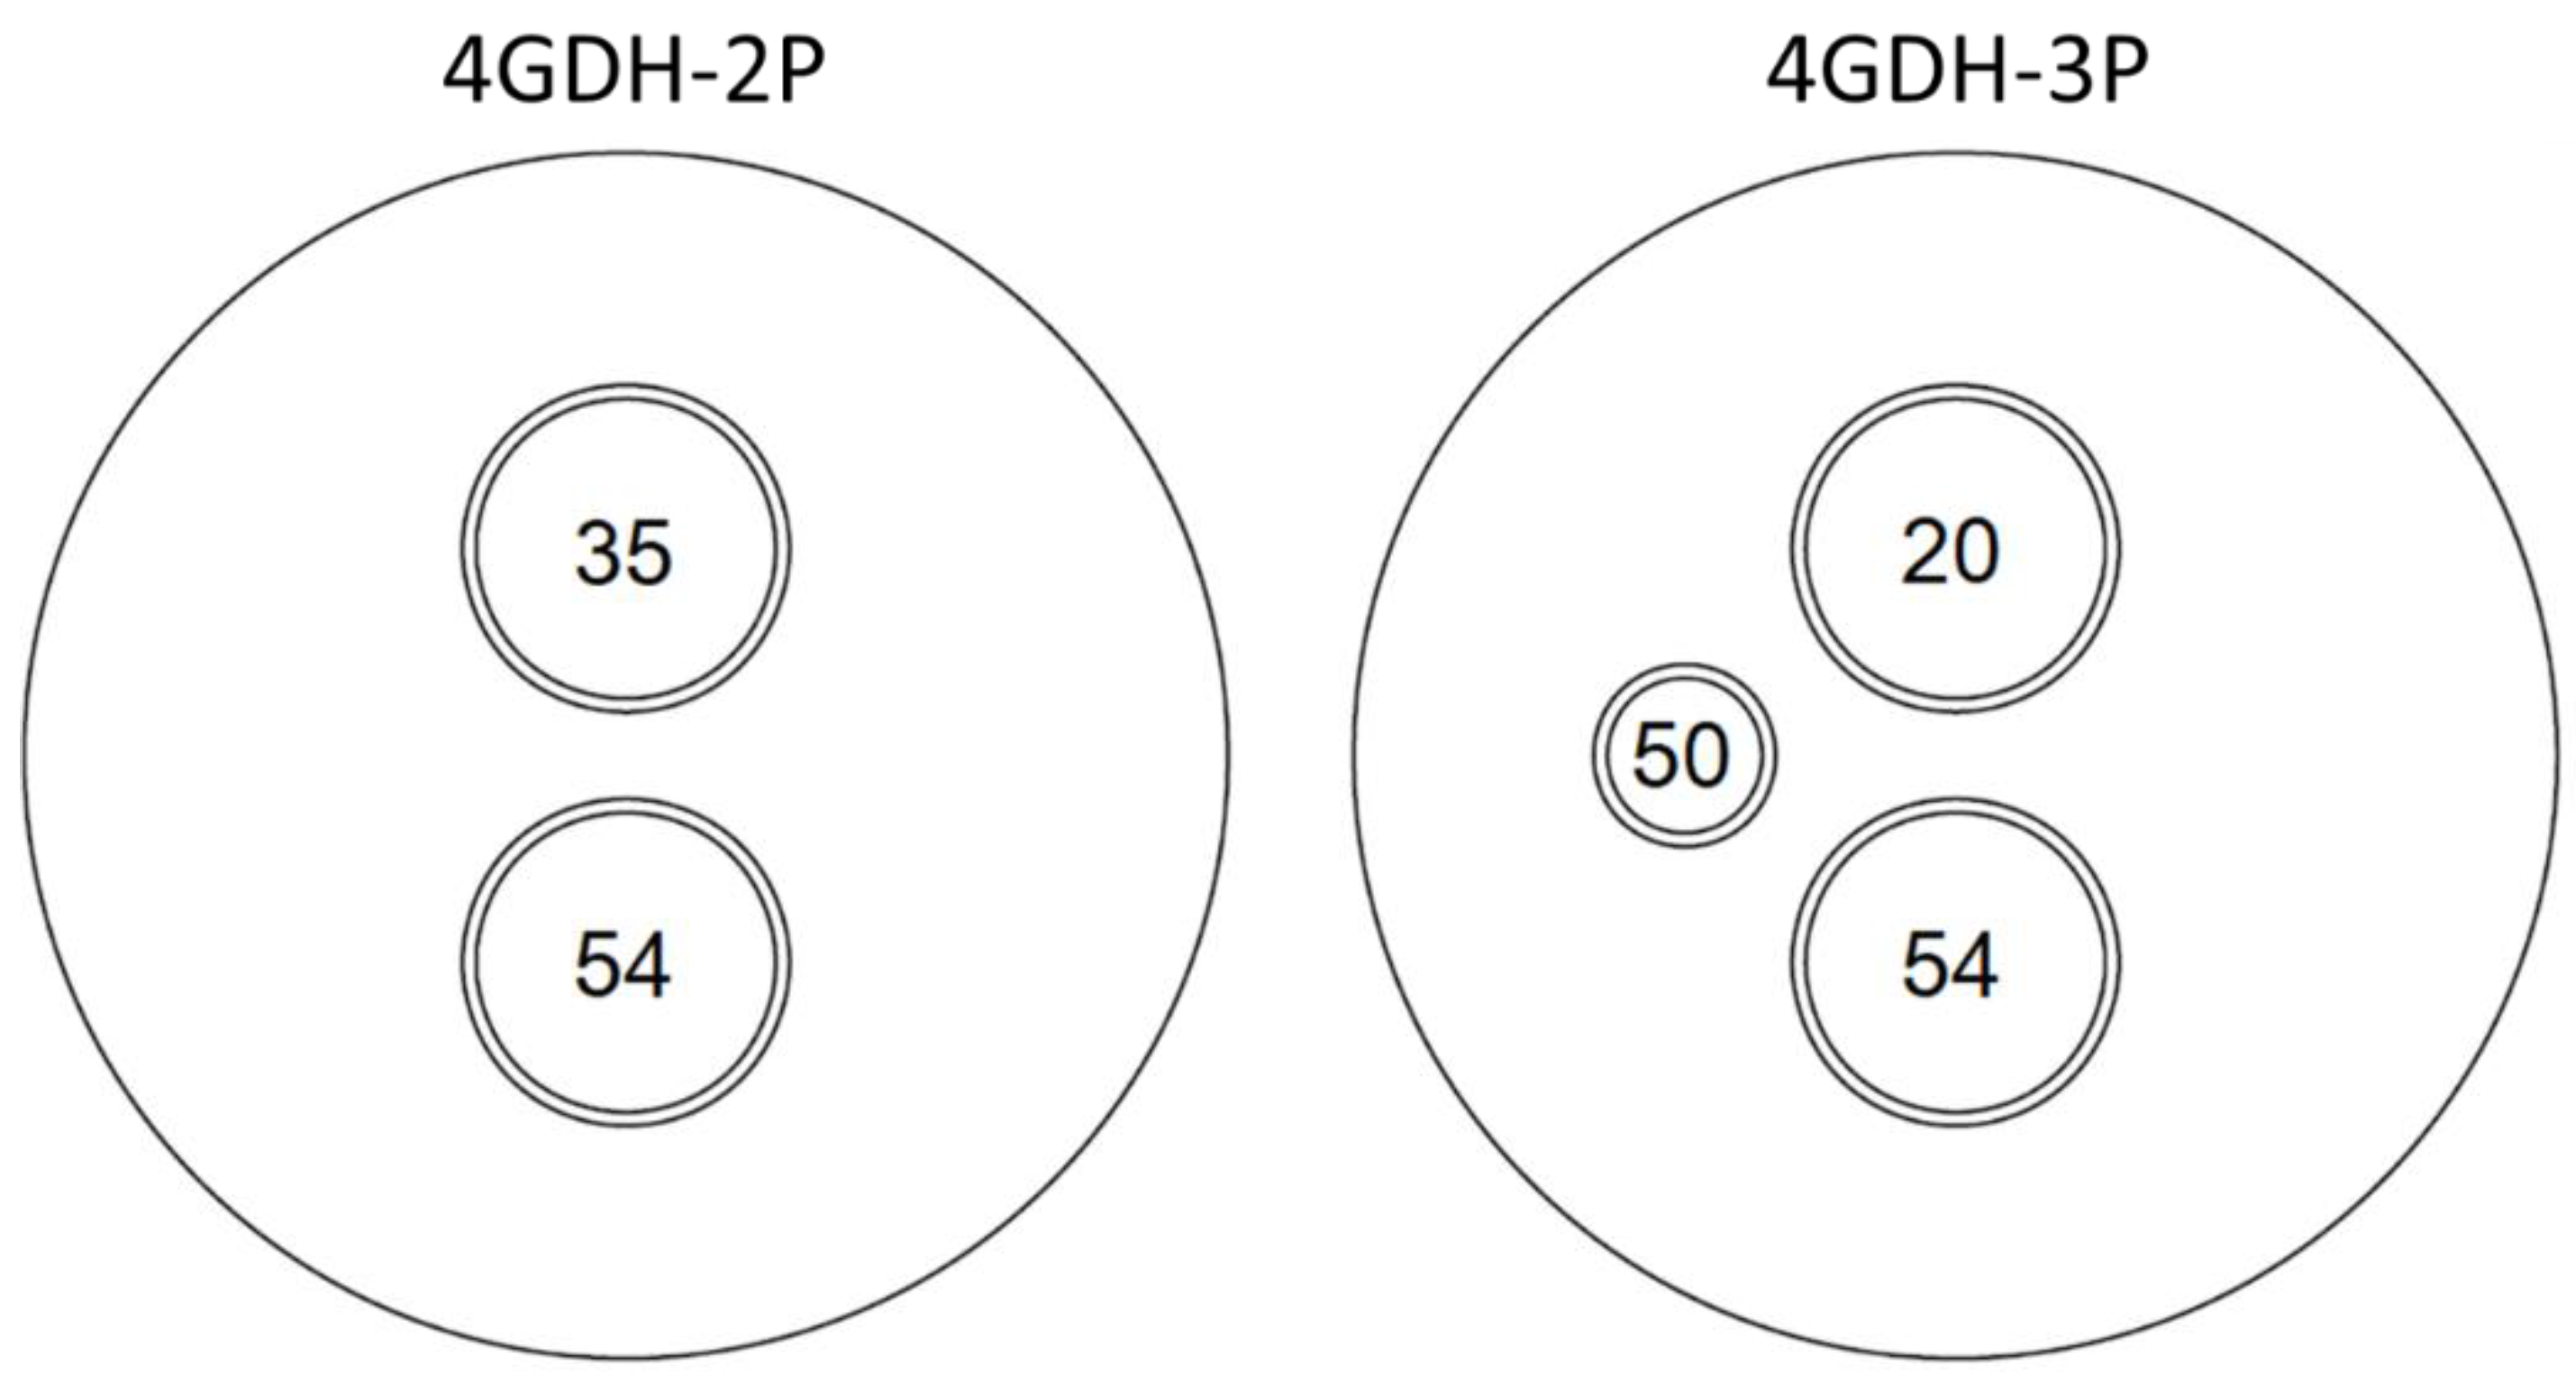
Figure 3.
Specific heat loss rates [W/m] of supply (54 °C) and return (15–40 °C) at different pipe dimensions (DN20-DN65) for three insulation series, according to [17].
Figure 3.
Specific heat loss rates [W/m] of supply (54 °C) and return (15–40 °C) at different pipe dimensions (DN20-DN65) for three insulation series, according to [17].
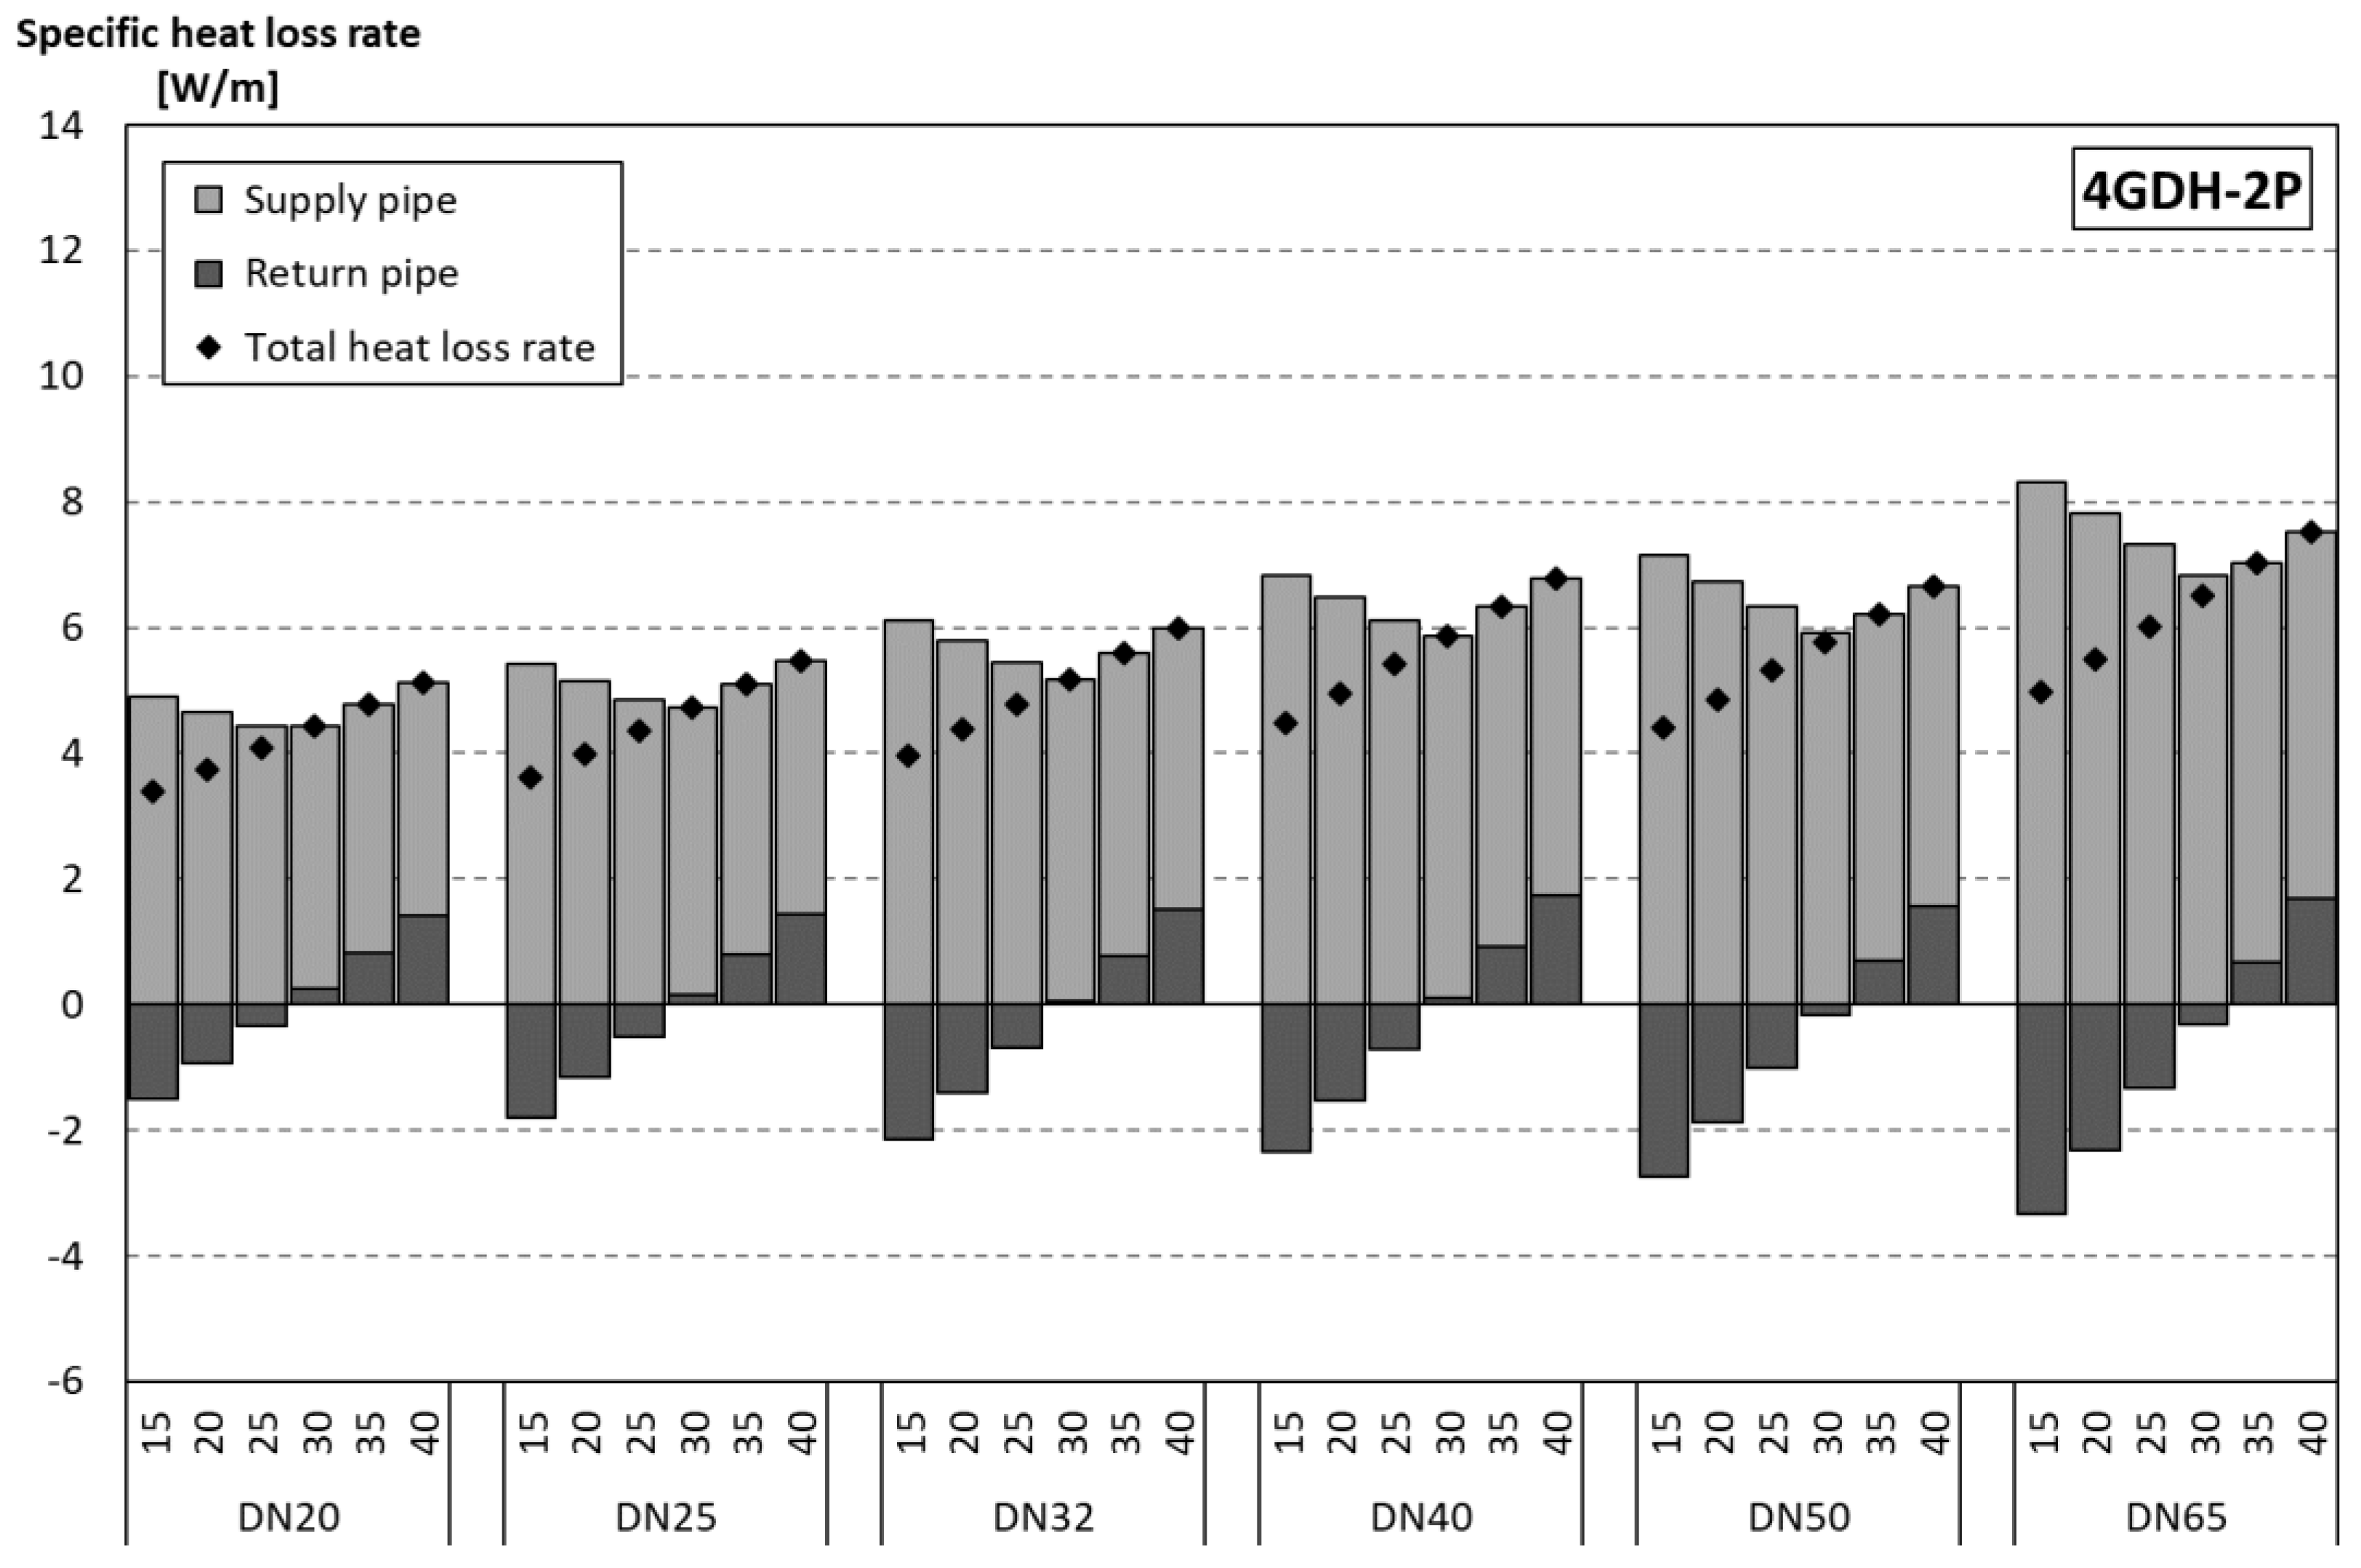
Figure 4.
Specific heat loss rates [W/m] of supply (54 °C), return (15–40 °C), and recirculation (50 °C) pipes at different pipe dimensions (DN20-DN65) for three insulation series, according to [17], and 3 downward displacements.
Figure 4.
Specific heat loss rates [W/m] of supply (54 °C), return (15–40 °C), and recirculation (50 °C) pipes at different pipe dimensions (DN20-DN65) for three insulation series, according to [17], and 3 downward displacements.
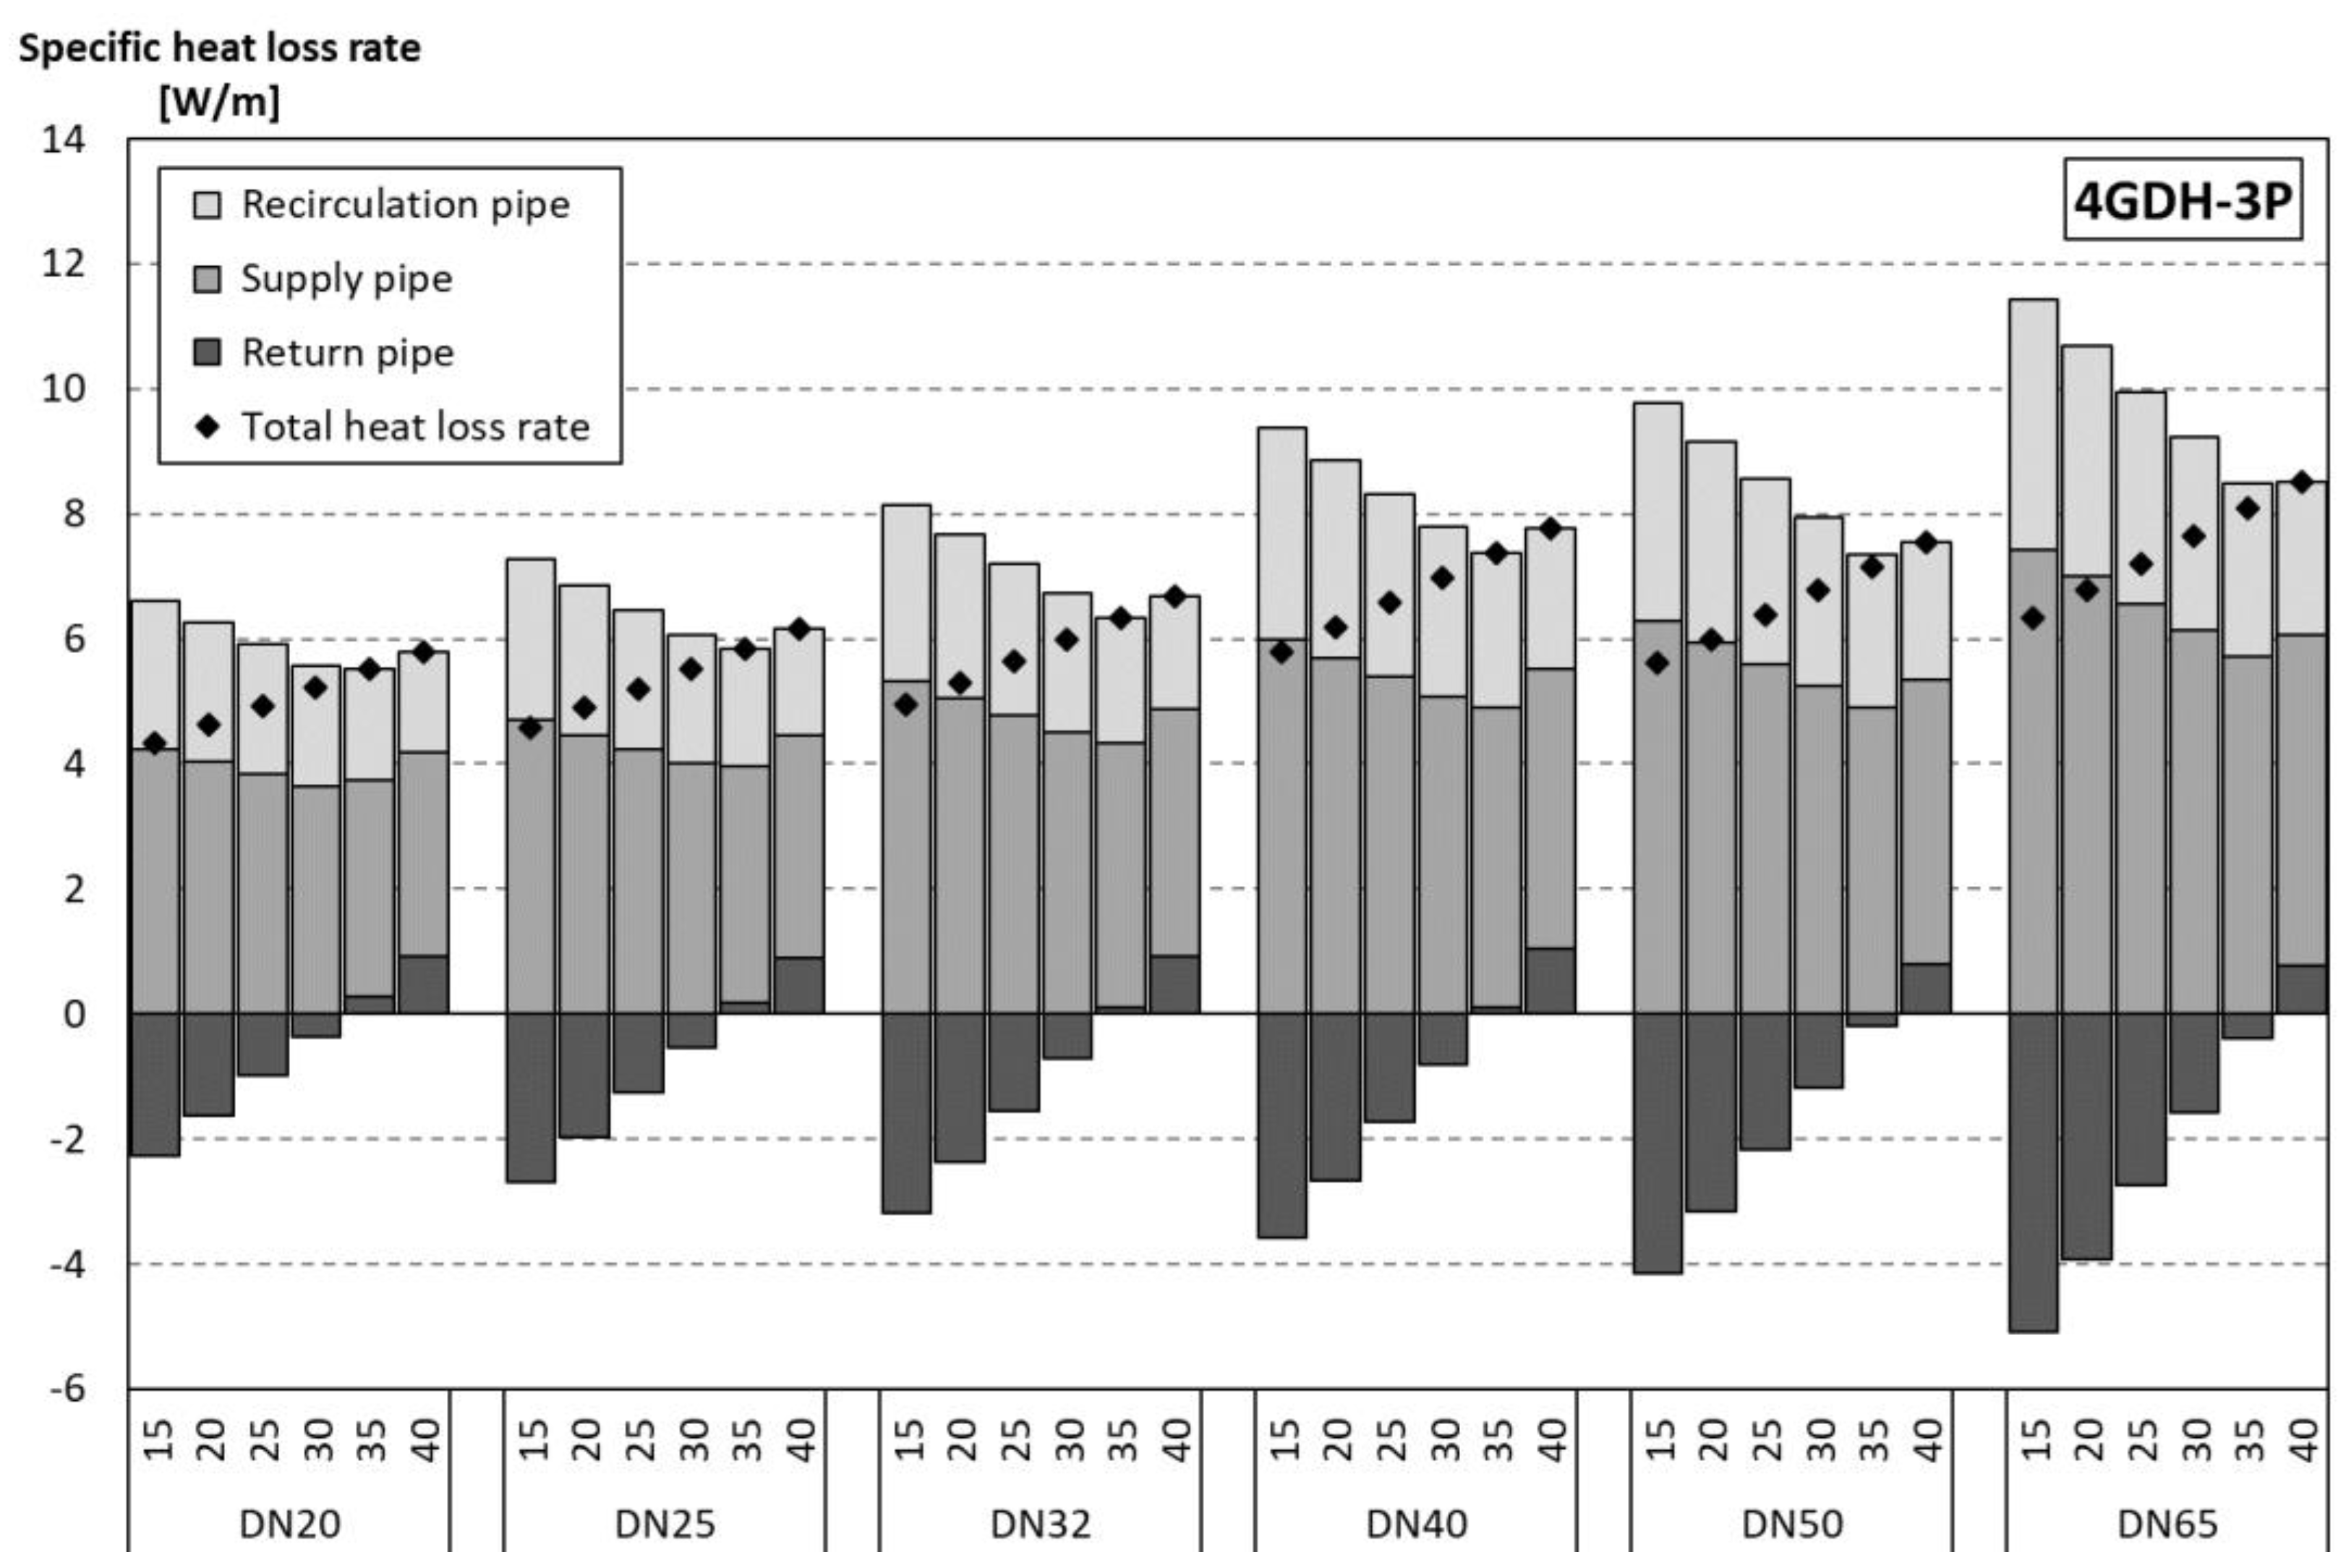
Figure 5.
Pressure gradient curve in traditional design conditions (winter days) for the longest route in the case area, which is maintained fully by central pumps. Aggregated mass flow rate of 1.33 kg/s. Mass flow rate of recirculation pipe is zero.
Figure 5.
Pressure gradient curve in traditional design conditions (winter days) for the longest route in the case area, which is maintained fully by central pumps. Aggregated mass flow rate of 1.33 kg/s. Mass flow rate of recirculation pipe is zero.
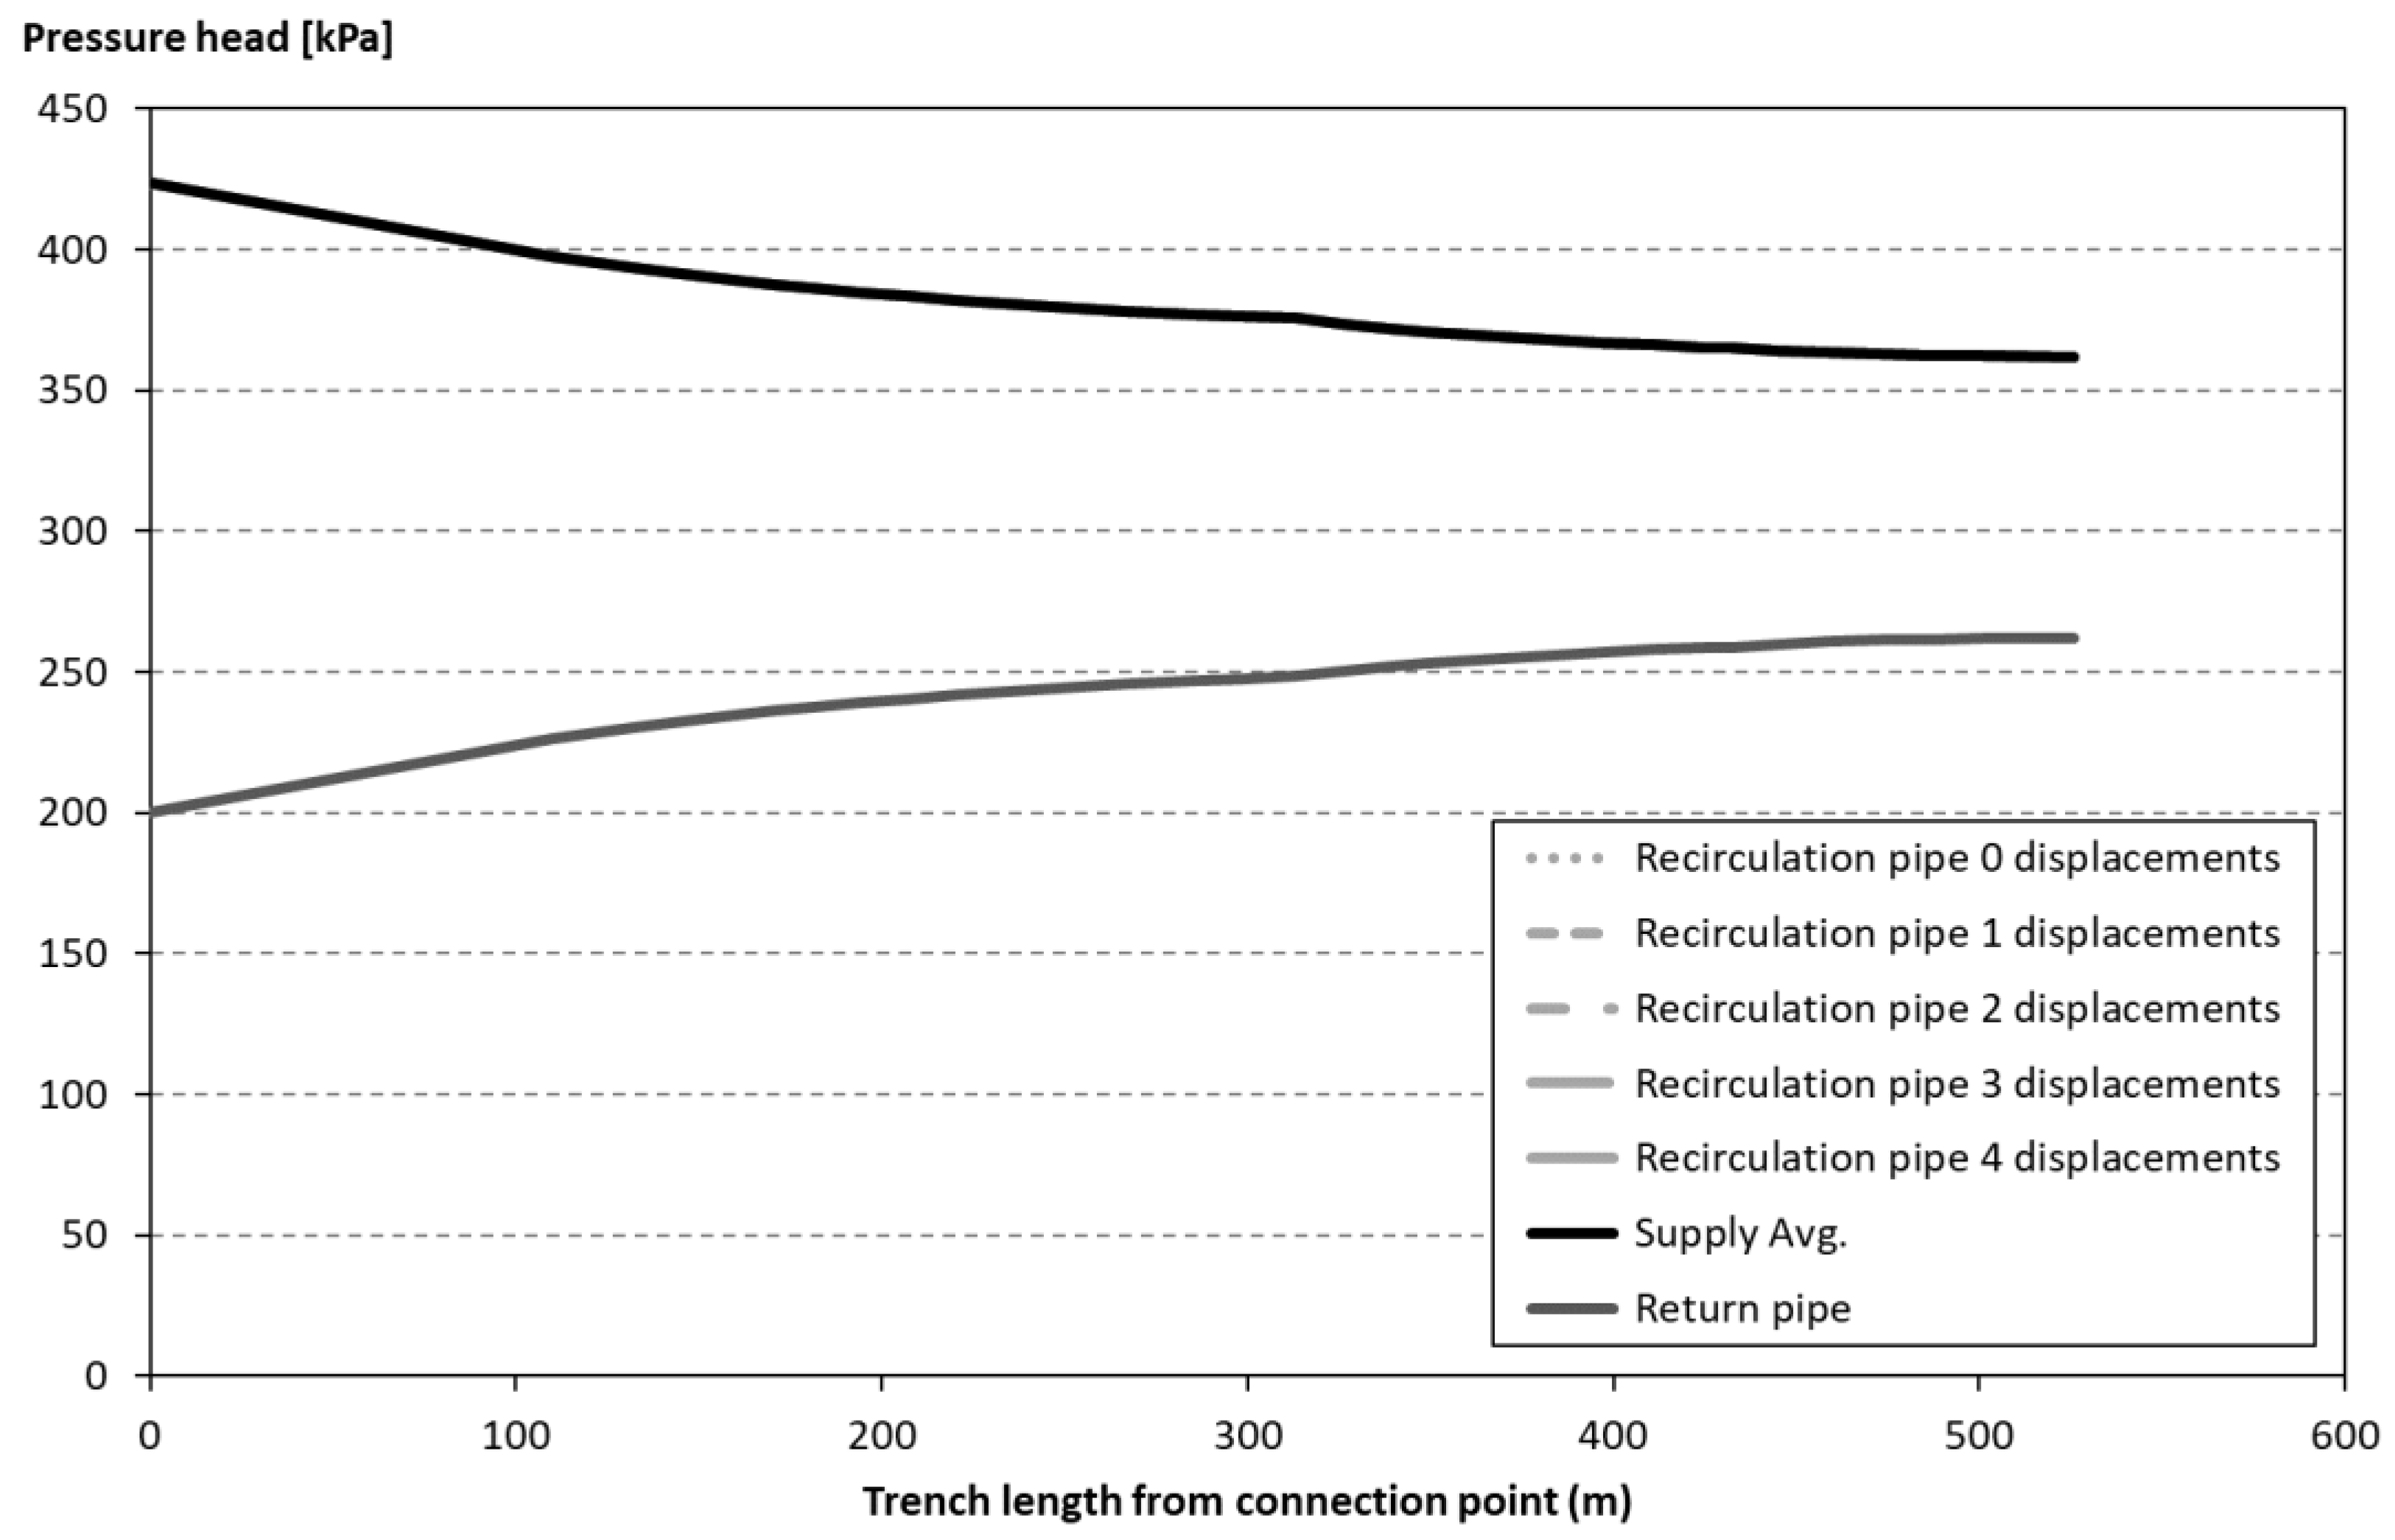
Figure 6.
Pressure gradient curve for design conditions (during summer nights) for the longest route in the case area, which is maintained fully by central pumps. Aggregated mass flow rate of 0.93 kg/s. Mass flow rate of return pipe is zero.
Figure 6.
Pressure gradient curve for design conditions (during summer nights) for the longest route in the case area, which is maintained fully by central pumps. Aggregated mass flow rate of 0.93 kg/s. Mass flow rate of return pipe is zero.
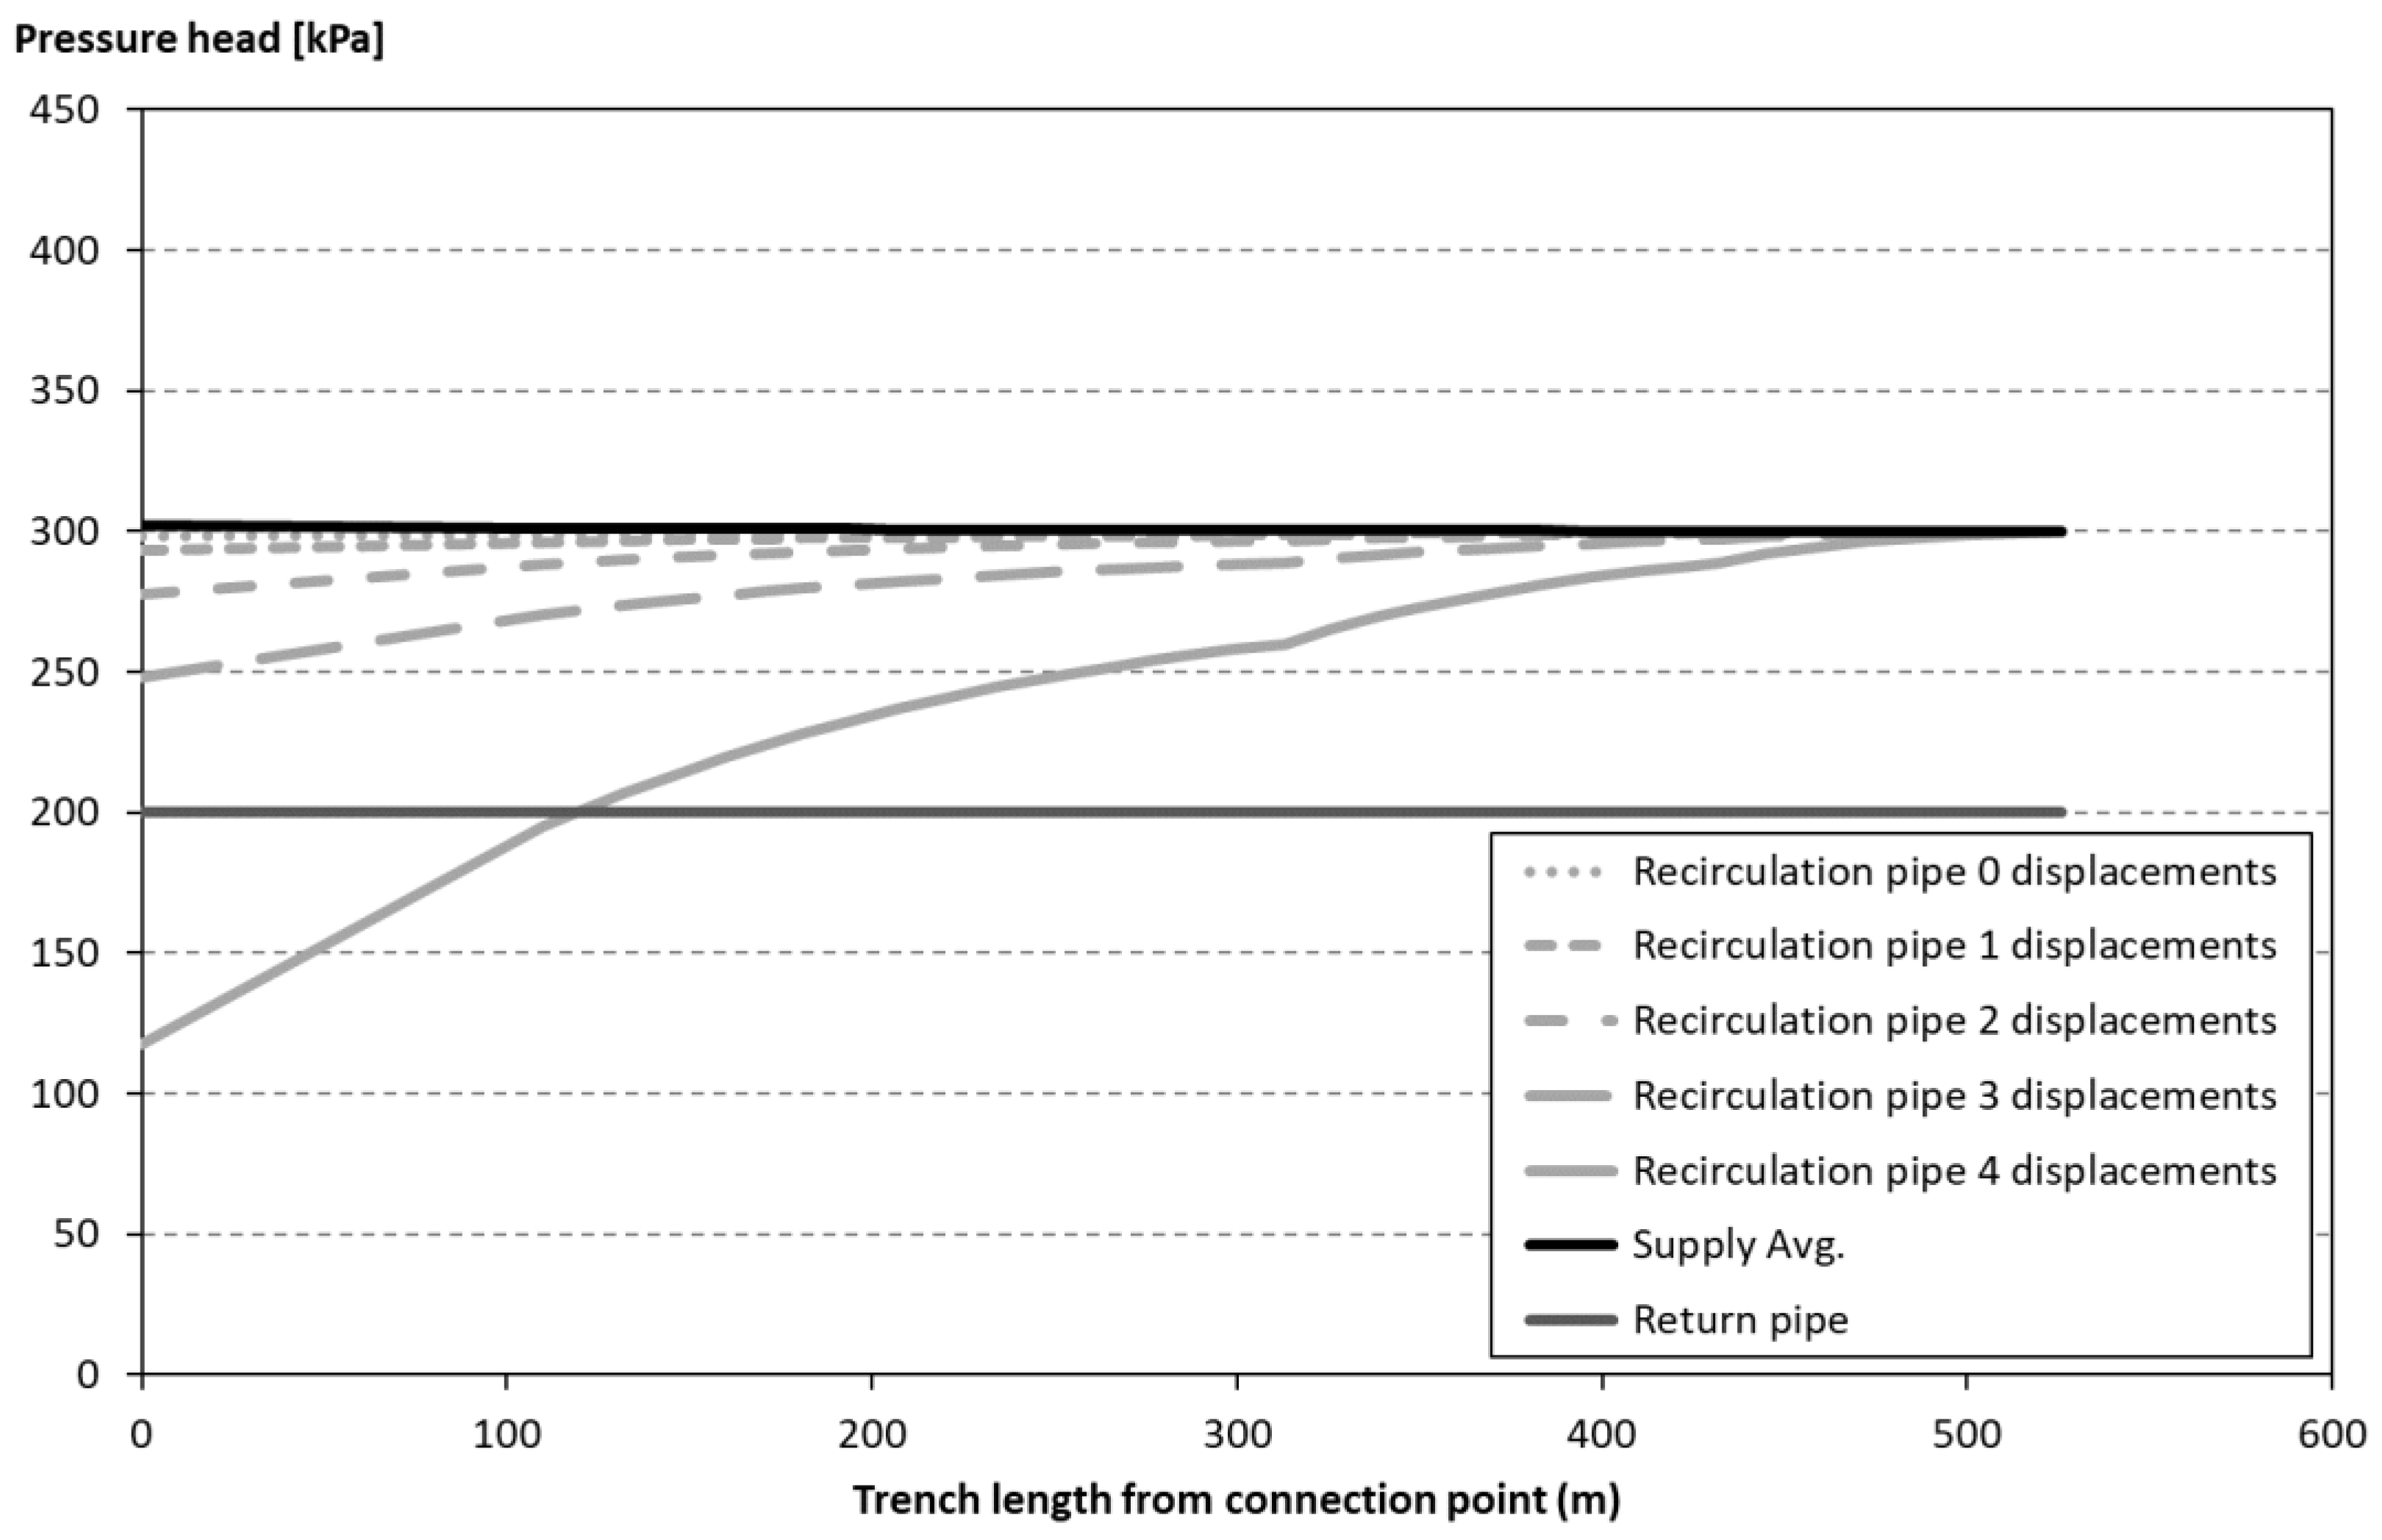
Figure 7.
Specific pressure drops [Pa/m] for five different sizes of the recirculation pipe along the sections of the longest route in the assessed distribution network during design conditions (summer night) with different series for each respective displacement level of the third pipe (0–4).
Figure 7.
Specific pressure drops [Pa/m] for five different sizes of the recirculation pipe along the sections of the longest route in the assessed distribution network during design conditions (summer night) with different series for each respective displacement level of the third pipe (0–4).
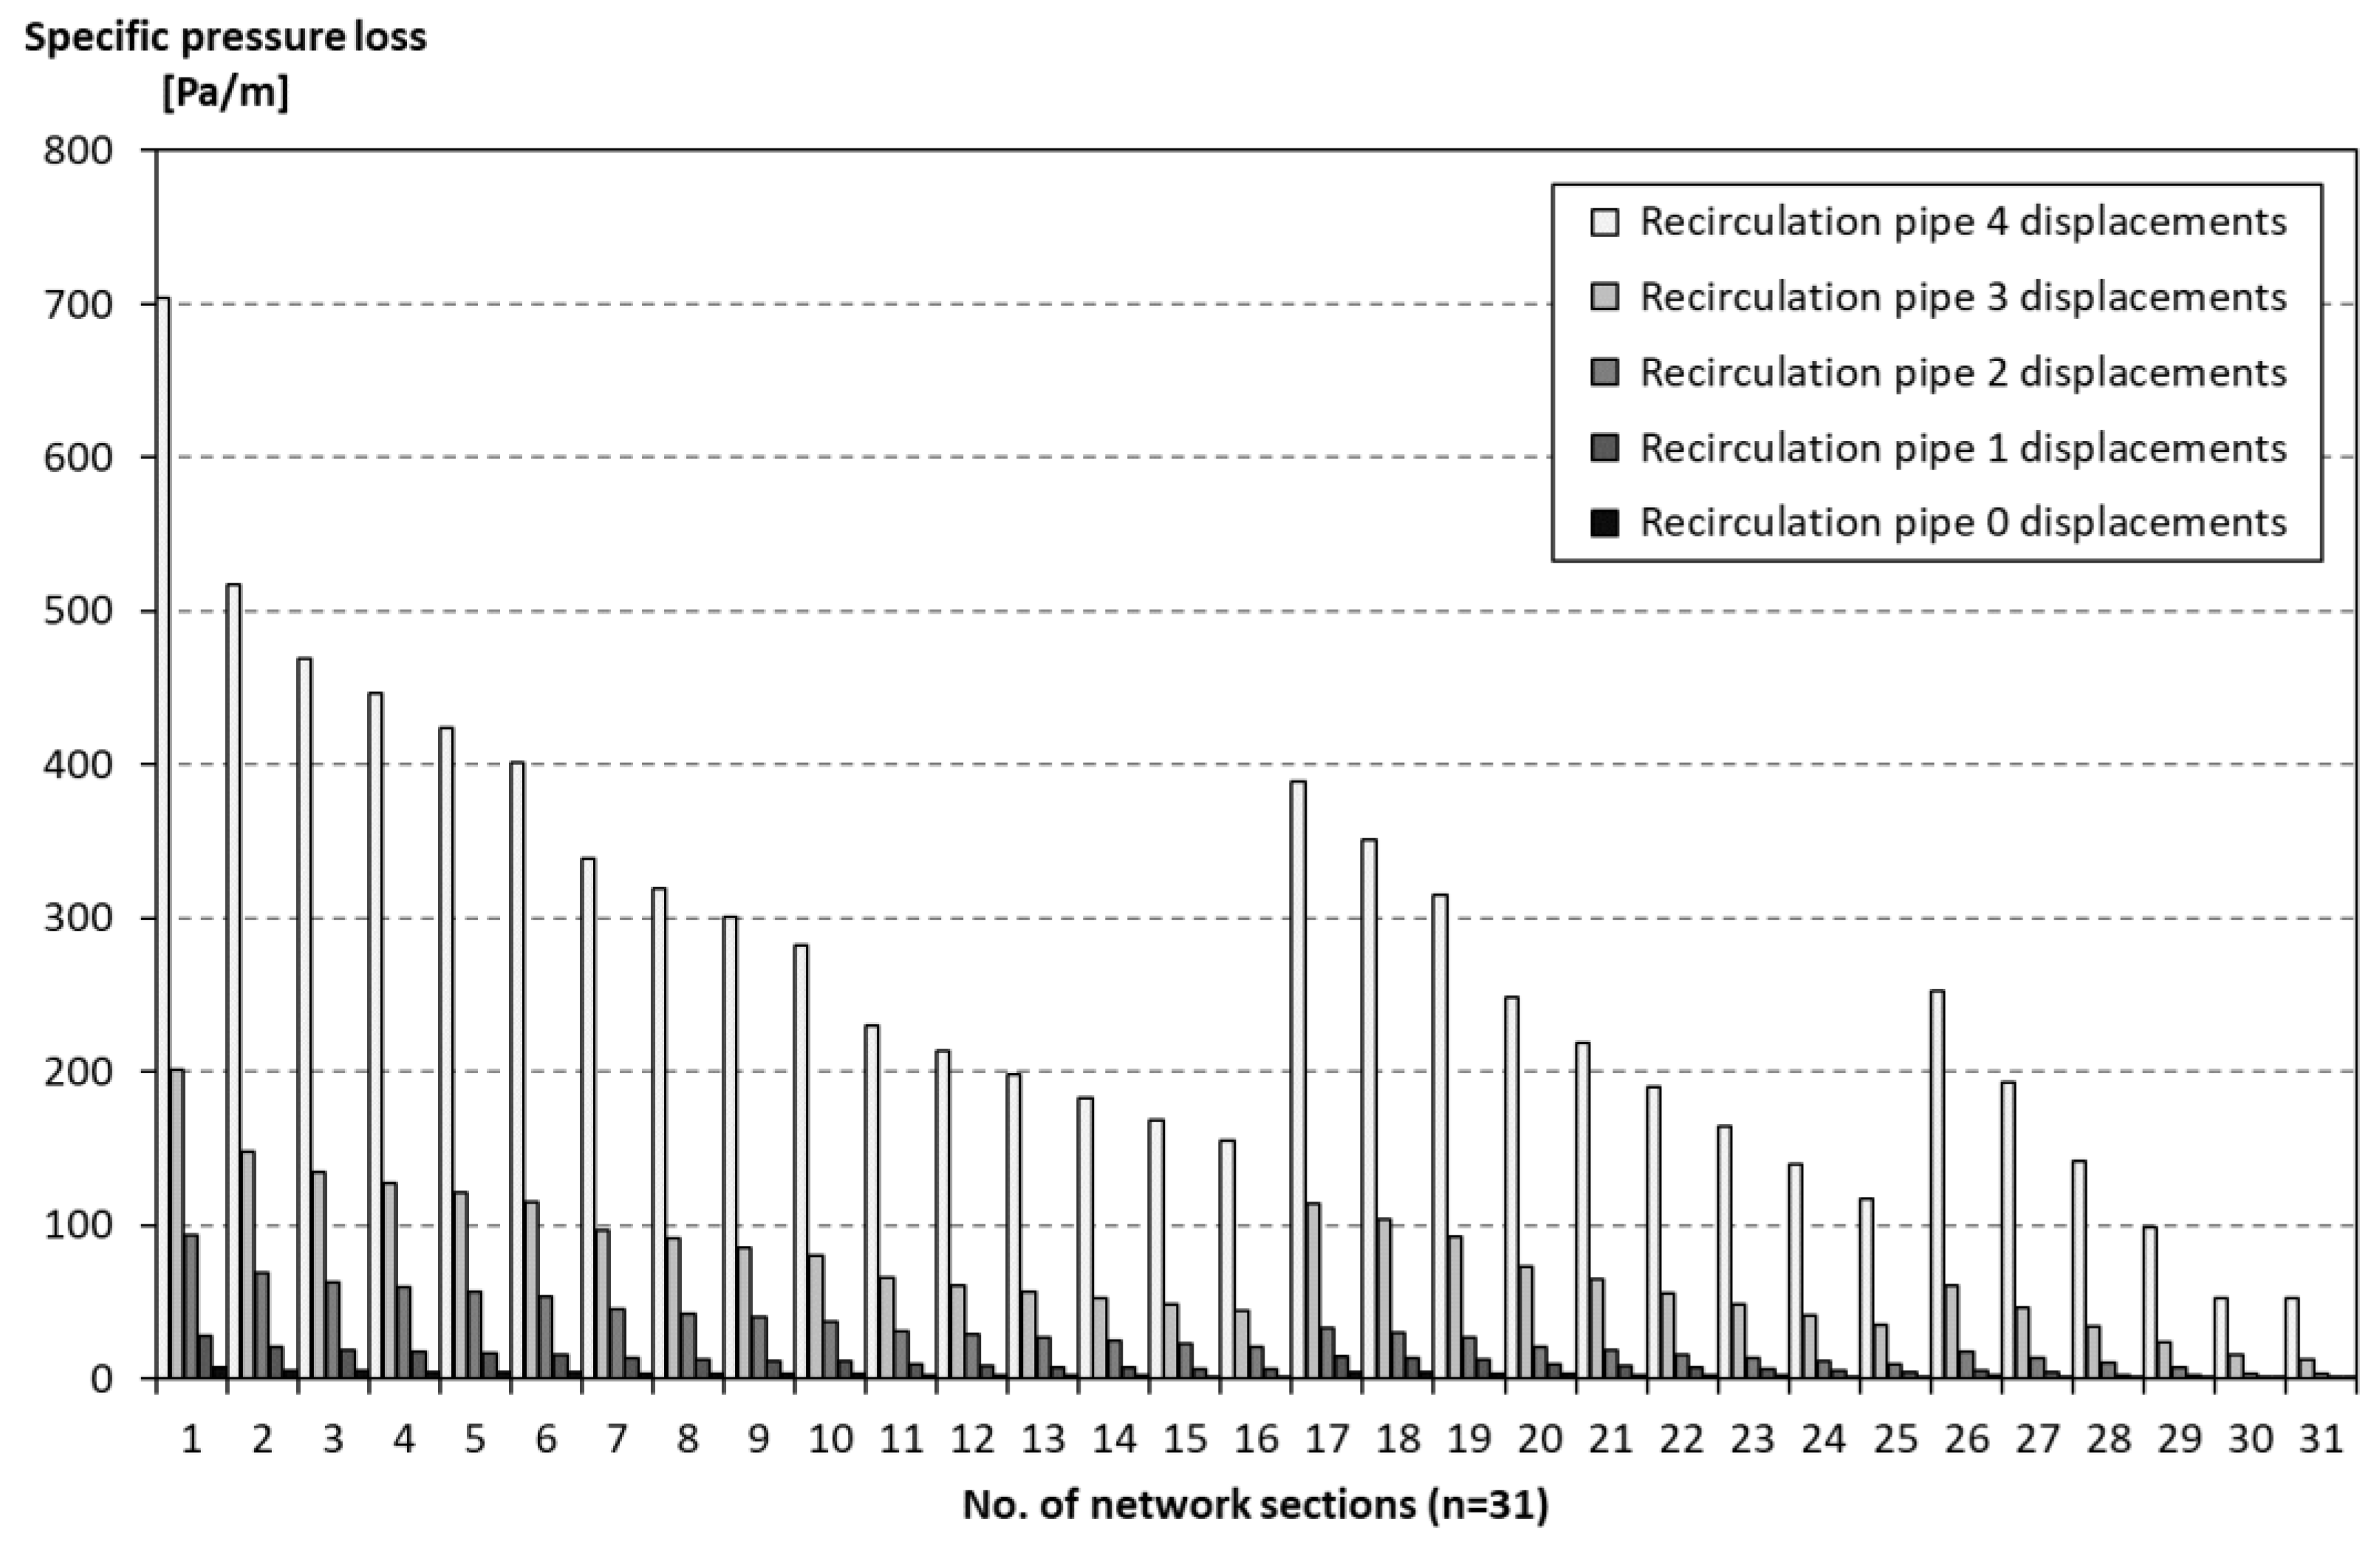
Figure 8.
Annual heat loss for the case area at NTU (8/1) for heat exchangers in substations and radiators for ten different annual specific heat demands (132–33) [kWh/m2, a]. The dash (-) denotes performance with the current two-pipe distribution (4GDH-2P), while 0–4 denote the three-pipe distributions with the corresponding downward displacement of standard sizes for the third pipe. Figure data are valid for pipes with three insulation series, according to [17].

Figure 9.
Relative heat loss for the analysed case area, separated into three different system configurations: Third generation district heating (3GDH), 4GDH-2P, and 4GDH-3P.
Figure 9.
Relative heat loss for the analysed case area, separated into three different system configurations: Third generation district heating (3GDH), 4GDH-2P, and 4GDH-3P.
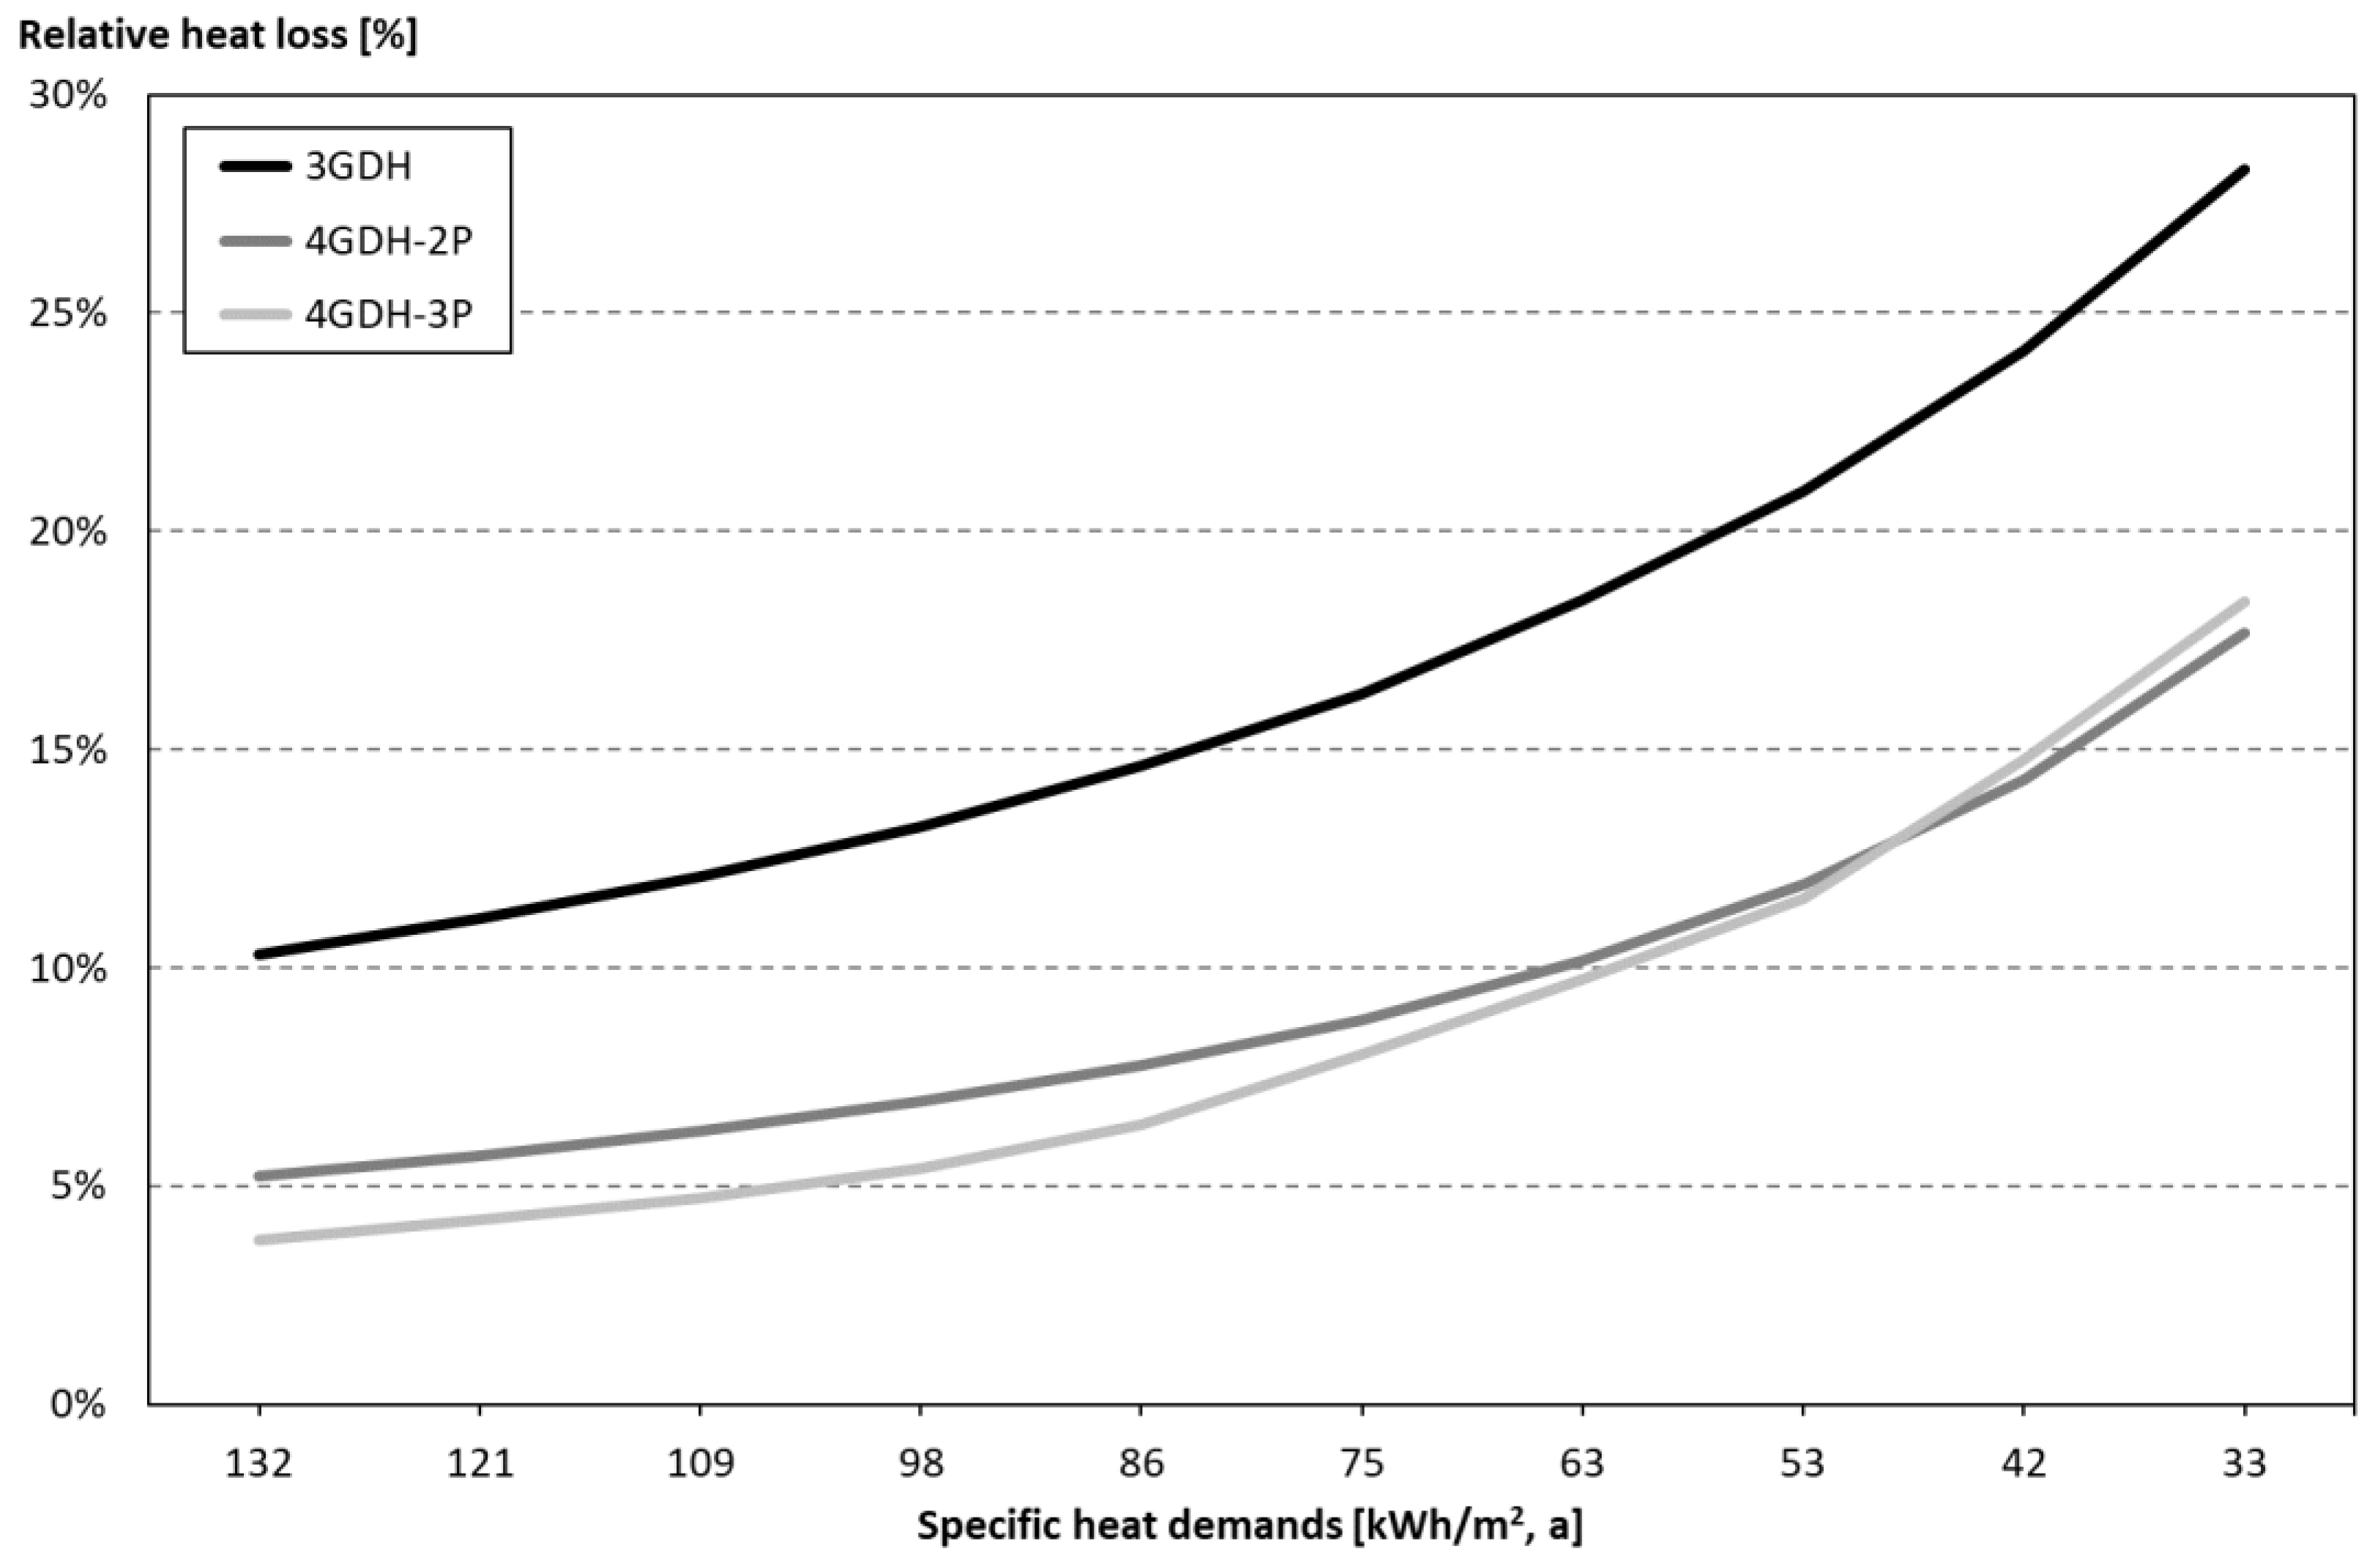
Figure 10.
Annual pumping energy for the case area at NTU (8/1) for heat exchangers in substations and radiators for 10 different annual specific heat demands (132–33) [kWh/m2, a]. The dash (-) denotes the performance for the current two-pipe distribution (4GDH-2P), while 0–4 denote the three-pipe distributions with the corresponding downward displacement of the standard sizes for the third pipe. Figure data are valid for pipes with three insulation series, according to [17].

Table 1.
Definitions of terminology used for the two versions of fourth generation district heating (4GDH).
Table 1.
Definitions of terminology used for the two versions of fourth generation district heating (4GDH).
| Pipe | 4GDH-2P | 4GDH-3P |
|---|---|---|
| Flow Rates | Flow Rates | |
| Supply (first pipe) | Delivery and recirculation flows (combined) | Delivery and recirculation flows (combined) |
| Return (second pipe) | Delivery and recirculation flows (combined) | Delivery flow (separated) |
| Third (third pipe) | No third pipe | Recirculation flow (separated) |
Table 2.
Conditions for the third pipe at different downward displacements under the design conditions, according to Figure 6.
Table 2.
Conditions for the third pipe at different downward displacements under the design conditions, according to Figure 6.
| Label | Unit | 0 | 1 | 2 | 3 | 4 |
|---|---|---|---|---|---|---|
| Differential pressure, Δp | kPa | 2 | 7 | 22 | 52 | 182 |
| Pumping power | W | 2 | 8 | 26 | 60 | 212 |
© 2019 by the authors. Licensee MDPI, Basel, Switzerland. This article is an open access article distributed under the terms and conditions of the Creative Commons Attribution (CC BY) license (http://creativecommons.org/licenses/by/4.0/).
Share and Cite
MDPI and ACS Style
Averfalk, H.; Ottermo, F.; Werner, S. Pipe Sizing for Novel Heat Distribution Technology. Energies 2019, 12, 1276. https://doi.org/10.3390/en12071276
AMA Style
Averfalk H, Ottermo F, Werner S. Pipe Sizing for Novel Heat Distribution Technology. Energies. 2019; 12(7):1276. https://doi.org/10.3390/en12071276
Chicago/Turabian StyleAverfalk, Helge, Fredric Ottermo, and Sven Werner. 2019. "Pipe Sizing for Novel Heat Distribution Technology" Energies 12, no. 7: 1276. https://doi.org/10.3390/en12071276
Note that from the first issue of 2016, this journal uses article numbers instead of page numbers. See further details here.