1. Introduction
The internal combustion engine accounts for about 66% of the oil consumption [
1,
2,
3]. It can only convert 1/3 of the total energy of fuel combustion into power output when it works, and most of the energy is removed by the exhaust and coolant systems [
4]. The coolant radiator fan also consumes about 10% of the output power of the internal combustion engine [
5]. Studies by the U.S. Department of Energy and Environmental Protection Agency indicate that the engine fuel consumption will increase by 20% when the air conditioning system is running [
6,
7,
8]. Internal combustion engine waste heat utilization and vehicle accessory system therefore offer a great energy saving potential.
In order to adapt to the waste heat characteristics of internal combustion engines, CO
2 power cycles can be used to recover the residual heat. There has been some research on the cross-critical CO
2 power cycle in vehicle waste heat recovery. Chen [
9] in Sweden used a CO
2 power cycle for waste heat utilization of internal combustion engines, and 20% of the exhaust energy was converted into output power. The EPS Company in America pointed out that the suitable heat source temperature is between 300 °C and 600 °C [
10]. Mahmood recovered the waste heat of a 1.7l natural gas engine with a maximum power of 18 kW [
11]. Shu at Tianjin University carried out an exploration of CO
2 power cycles [
12] and found that the net power recoverable by using the waste heat recovery system was 9.1 kW. The supercritical CO
2 Brayton cycle has low requirements for cooling conditions and is suitable for utilization in mobile internal combustion engines [
13]. Feher [
14], Chacartegui [
15] and Ahn [
16] compared the Brayton cycles of various structures and found that the recompression form had the highest efficiency. Most of the existing cycles only consider high-temperature exhaust heat sources, but neither the recycling and utilization of low-temperature jacket water heat sources, nor the influence of the environmental temperature on system performance, cooling and heat dissipation.
In terms of thermal management, many scholars have studied control modes and component performance. Choi [
17] at Hanyang University in South Korea applied an independent cooling circuit to EGR to reduce emissions by 5%. VALEO’s new cooling system reduces engine fuel consumption by an average of 6% [
18,
19,
20,
21]. Ehlers in Cummins proposed that a multi-purpose heat exchanger could reduce the mass by 5% and improve the thermal performance [
22]. However, few scholars have integrated and optimized the thermal management system as a whole system, failing to integrate waste heat recovery technology, air conditioning systems, engines and coolant systems.
Aiming at the problems in the existing research, this paper adopts the method of combining simulation calculations and an experimental study, considering the comprehensive utilization of low temperature coolant waste heat and high temperature gas waste heat in the waste heat recovery system, and furthermore, coupling waste heat recovery system, air conditioning system, and engine and coolant system to build a thermal management system. The paper regards a Yuchai type YC6L330-42 diesel engine and vehicle as the research object, and sets up different structure forms of coupled thermal management systems which consist of these three subsystems and the integrated optimization of the system as a whole. We also consider the operation of the vehicle under actual conditions, analyzing the net power under different power component speeds, environmental temperatures and the working conditions of the diesel engine and optimizing the structures, thus improving the vehicle operating efficiency under actual conditions.
2. System Description and Modeling
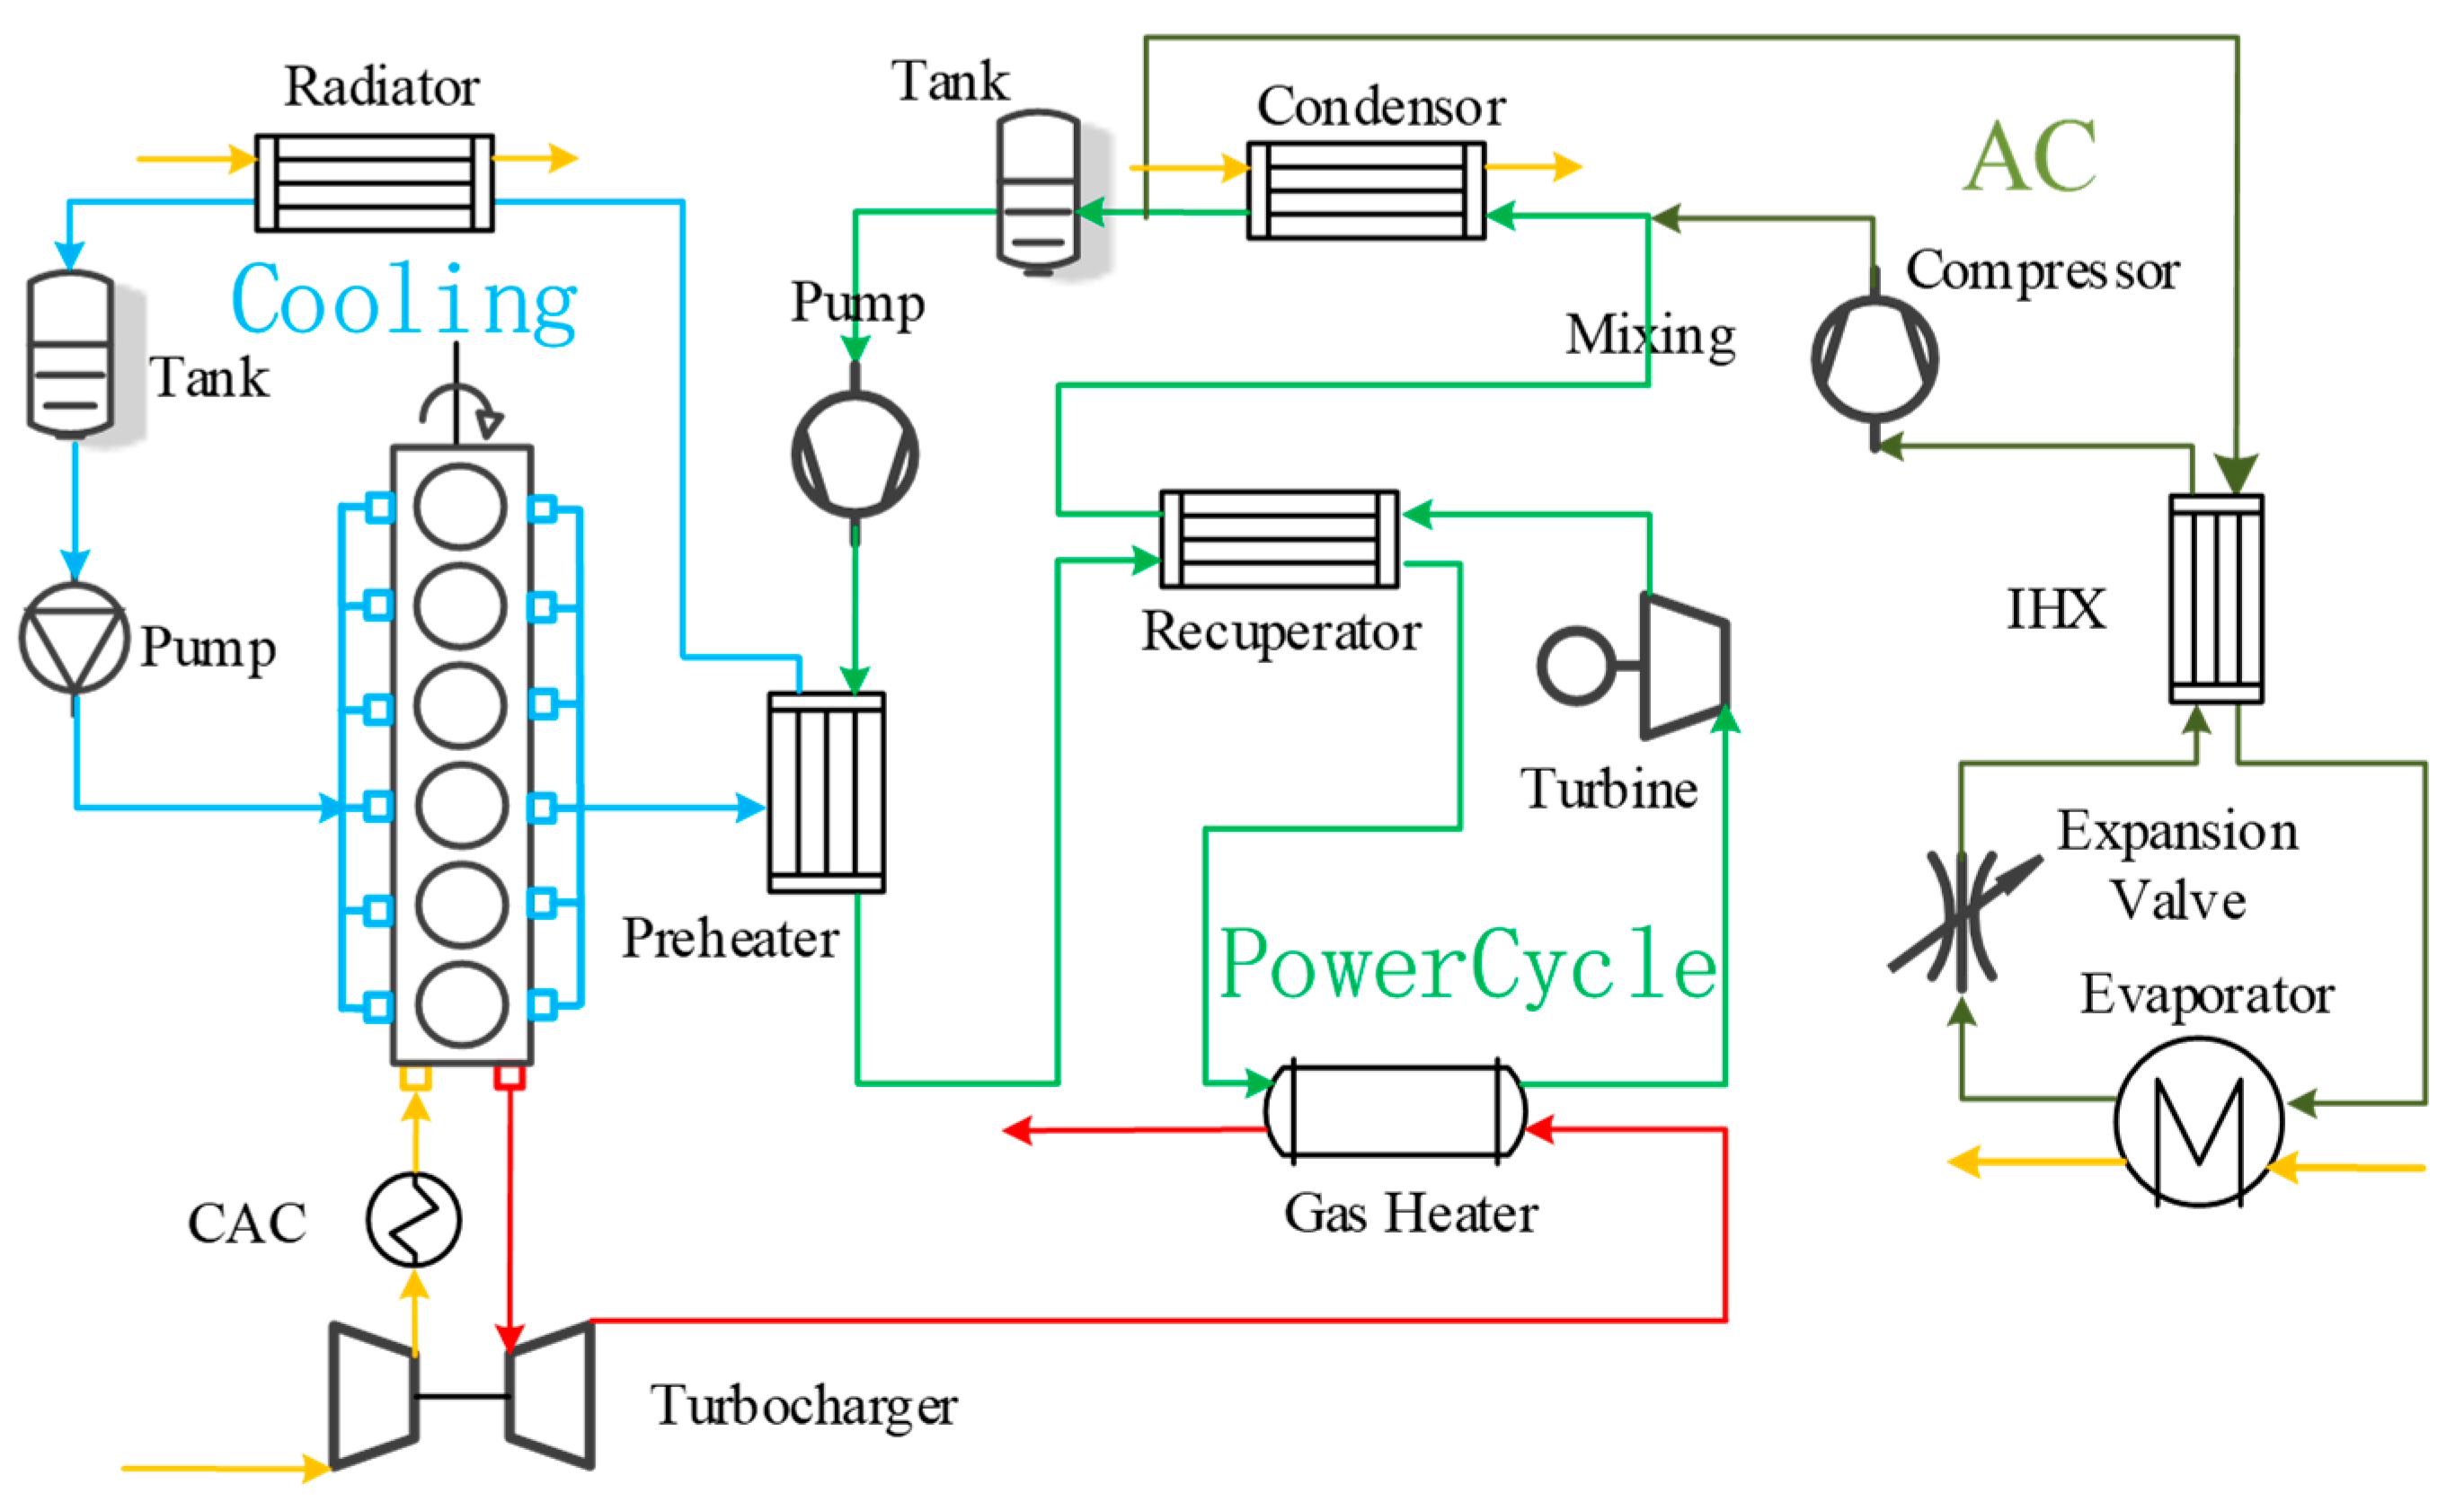
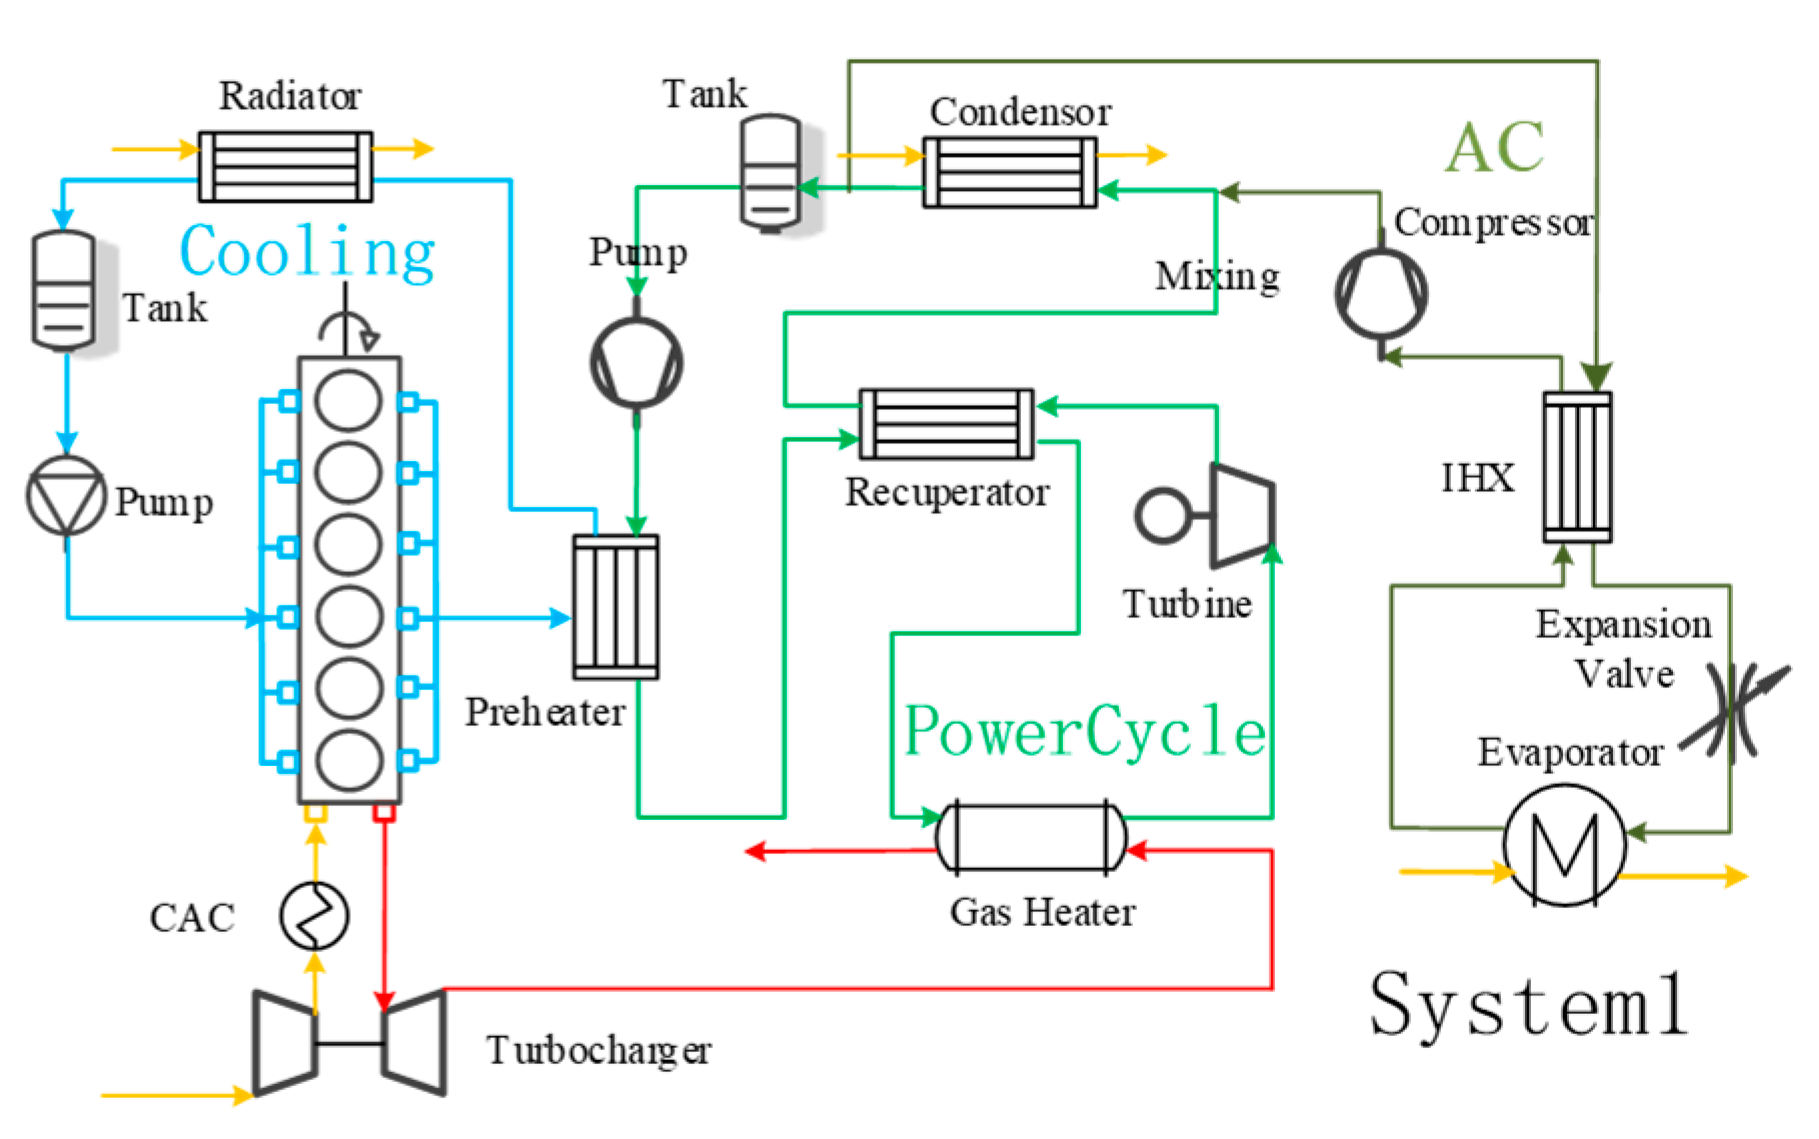
Figure 1 is a schematic diagram of a relatively simple co-cooling single-pressure heat management system, and the names of various parts of the system are shown in the figure. In this system, the coolant system uses the vehicle coolant as the circulating working fluid, which is cooled by the preheater and radiator.
The working substance of the waste heat recovery subsystem is compressed by the pump to recover the waste heat of the coolant in the preheater. After being compressed by the expander, it is combined with the working substance of the air conditioning subsystem to use the condenser for cooling. After that, it is divided into two paths. One path enters the air conditioning cycle, and the other path returns to the pump for waste heat recovery cycle. In order to model the thermal management system, it is necessary to build the three subsystems separately. The thermodynamics and simulation models of the three subsystems will be established in the following sections.
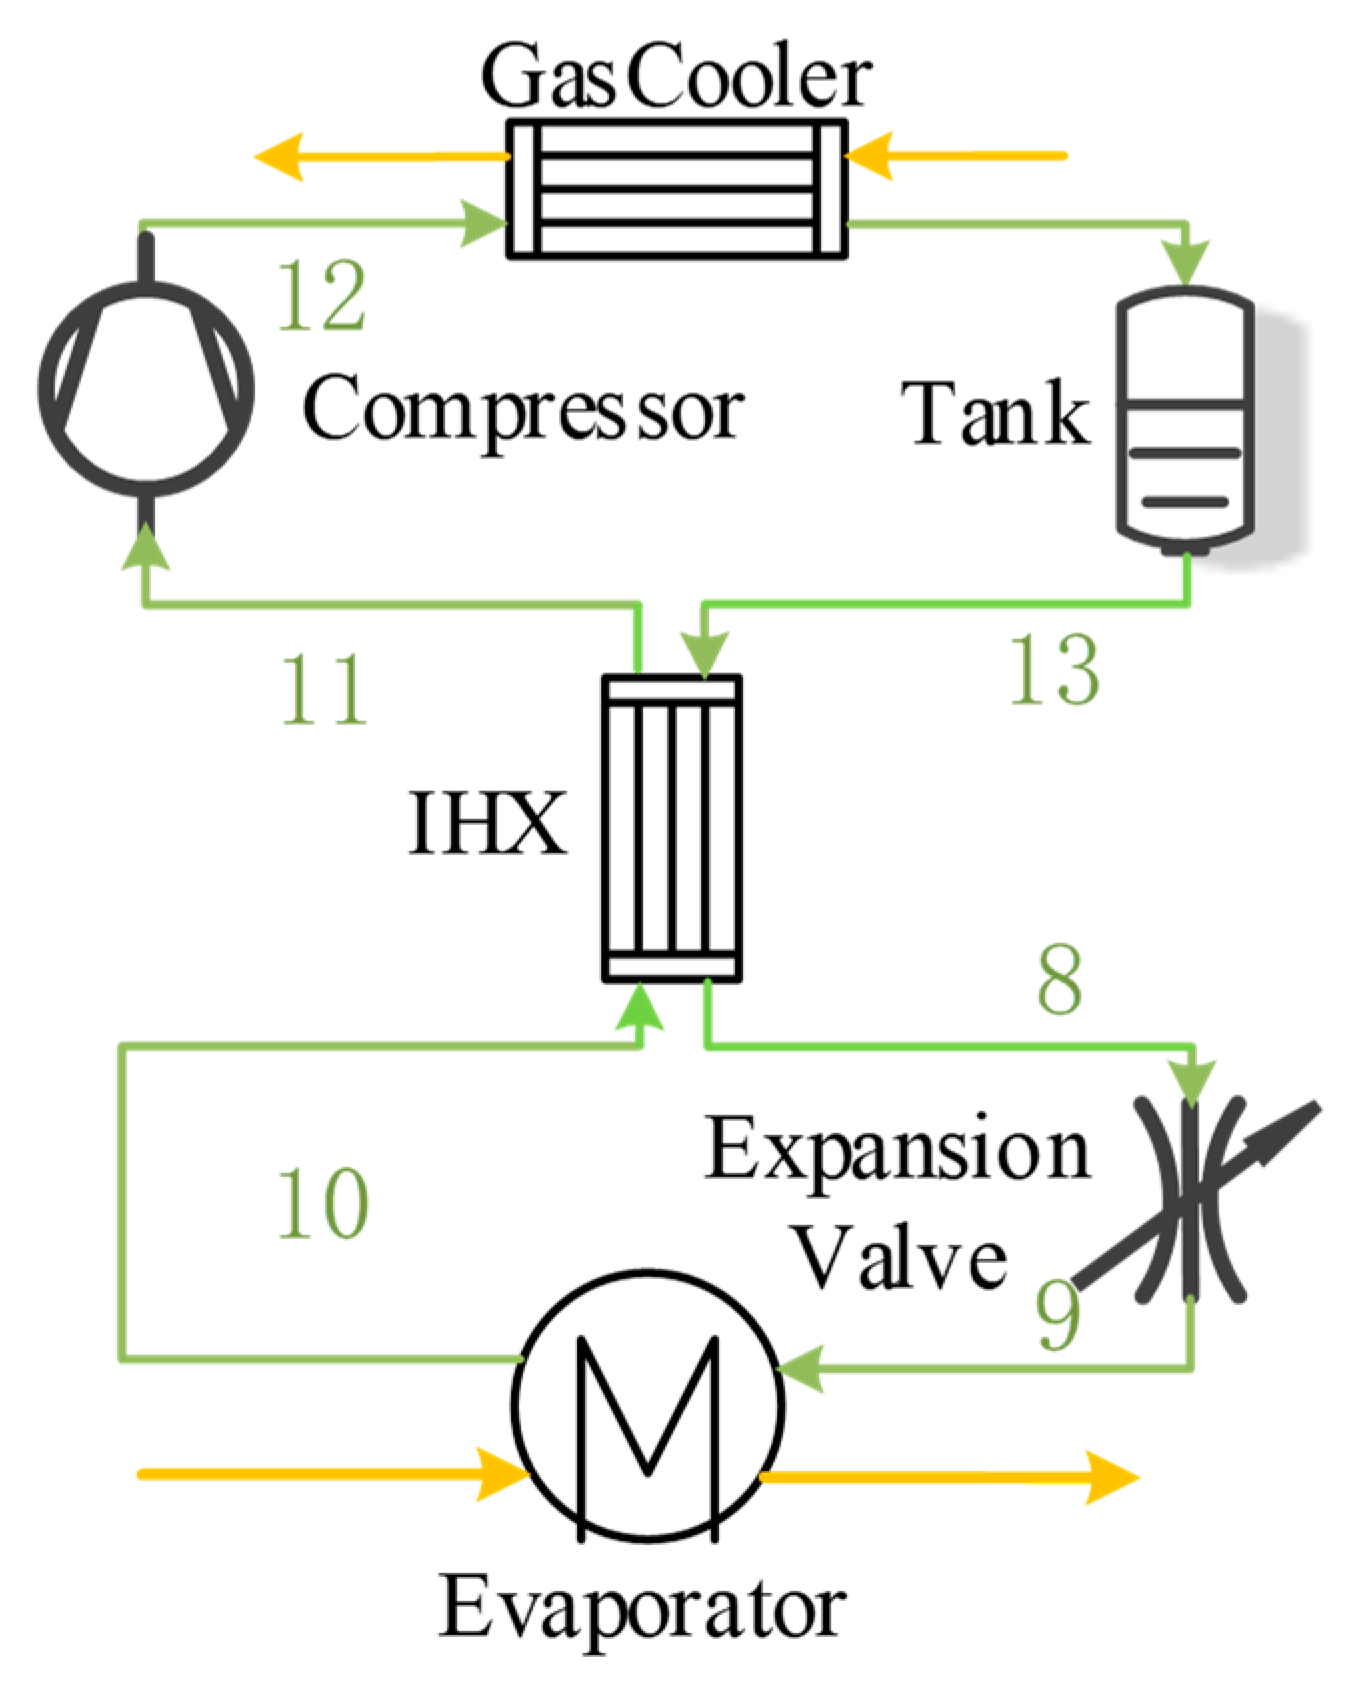
2.1. Air Conditioning System
Because of the absence of air conditioning equipment, we get the parameters by thermomechanical analysis. The air conditioning system uses a carbon dioxide transcritical cycle, and the principle is shown in
Figure 2. The inlet superheat of the compressor is 10 K, the pinch point temperature difference between the working fluid in the air cooler and the cooling air is 8 K, and the compressor efficiency is 70%.
Assume that the expansion valve is isenthalpic expansion, then:
The working fluid flow rate in the air conditioning system is:
The cooling load of the air cooler is:
The power consumption of the air conditioning compressor is:
The air conditioning system efficiency is:
According to the thermodynamic parameters of each state point of the system, and according to thermodynamic calculations and heat transfer correlation solutions, the structural parameters of each air-conditioning component are obtained, and the component design is carried out. Then GT-Power was used for the simulation calculations. For each heat exchanger, we have . Among them, A is the heat transfer area, K is the total heat transfer coefficient of the heat exchanger, Δt is the logarithmic mean temperature difference between hot and cold fluid.
On the working fluid side, different heat transfer correlations are adopted according to different CO
2 states. In the single-phase region, the correlation formula proposed by Petukhov [
23] is used:
In the supercritical region, we use the correlation proposed by Krasnoshchekov—Protopopov [
24]:
The heat transfer coefficient is:
The angular labels ‘wall’ and ‘bulk’ represent the wall temperature and average temperature, respectively. In the two-phase region, the correlation formula proposed by Wambsganss [
25] is used:
The heat transfer coefficient is:
The parameters of each statement match the results of other studies well [
26].
2.2. Engine and Coolant System
In this paper, the thermal management system is combined with a 243 kW four-stroke diesel engine.
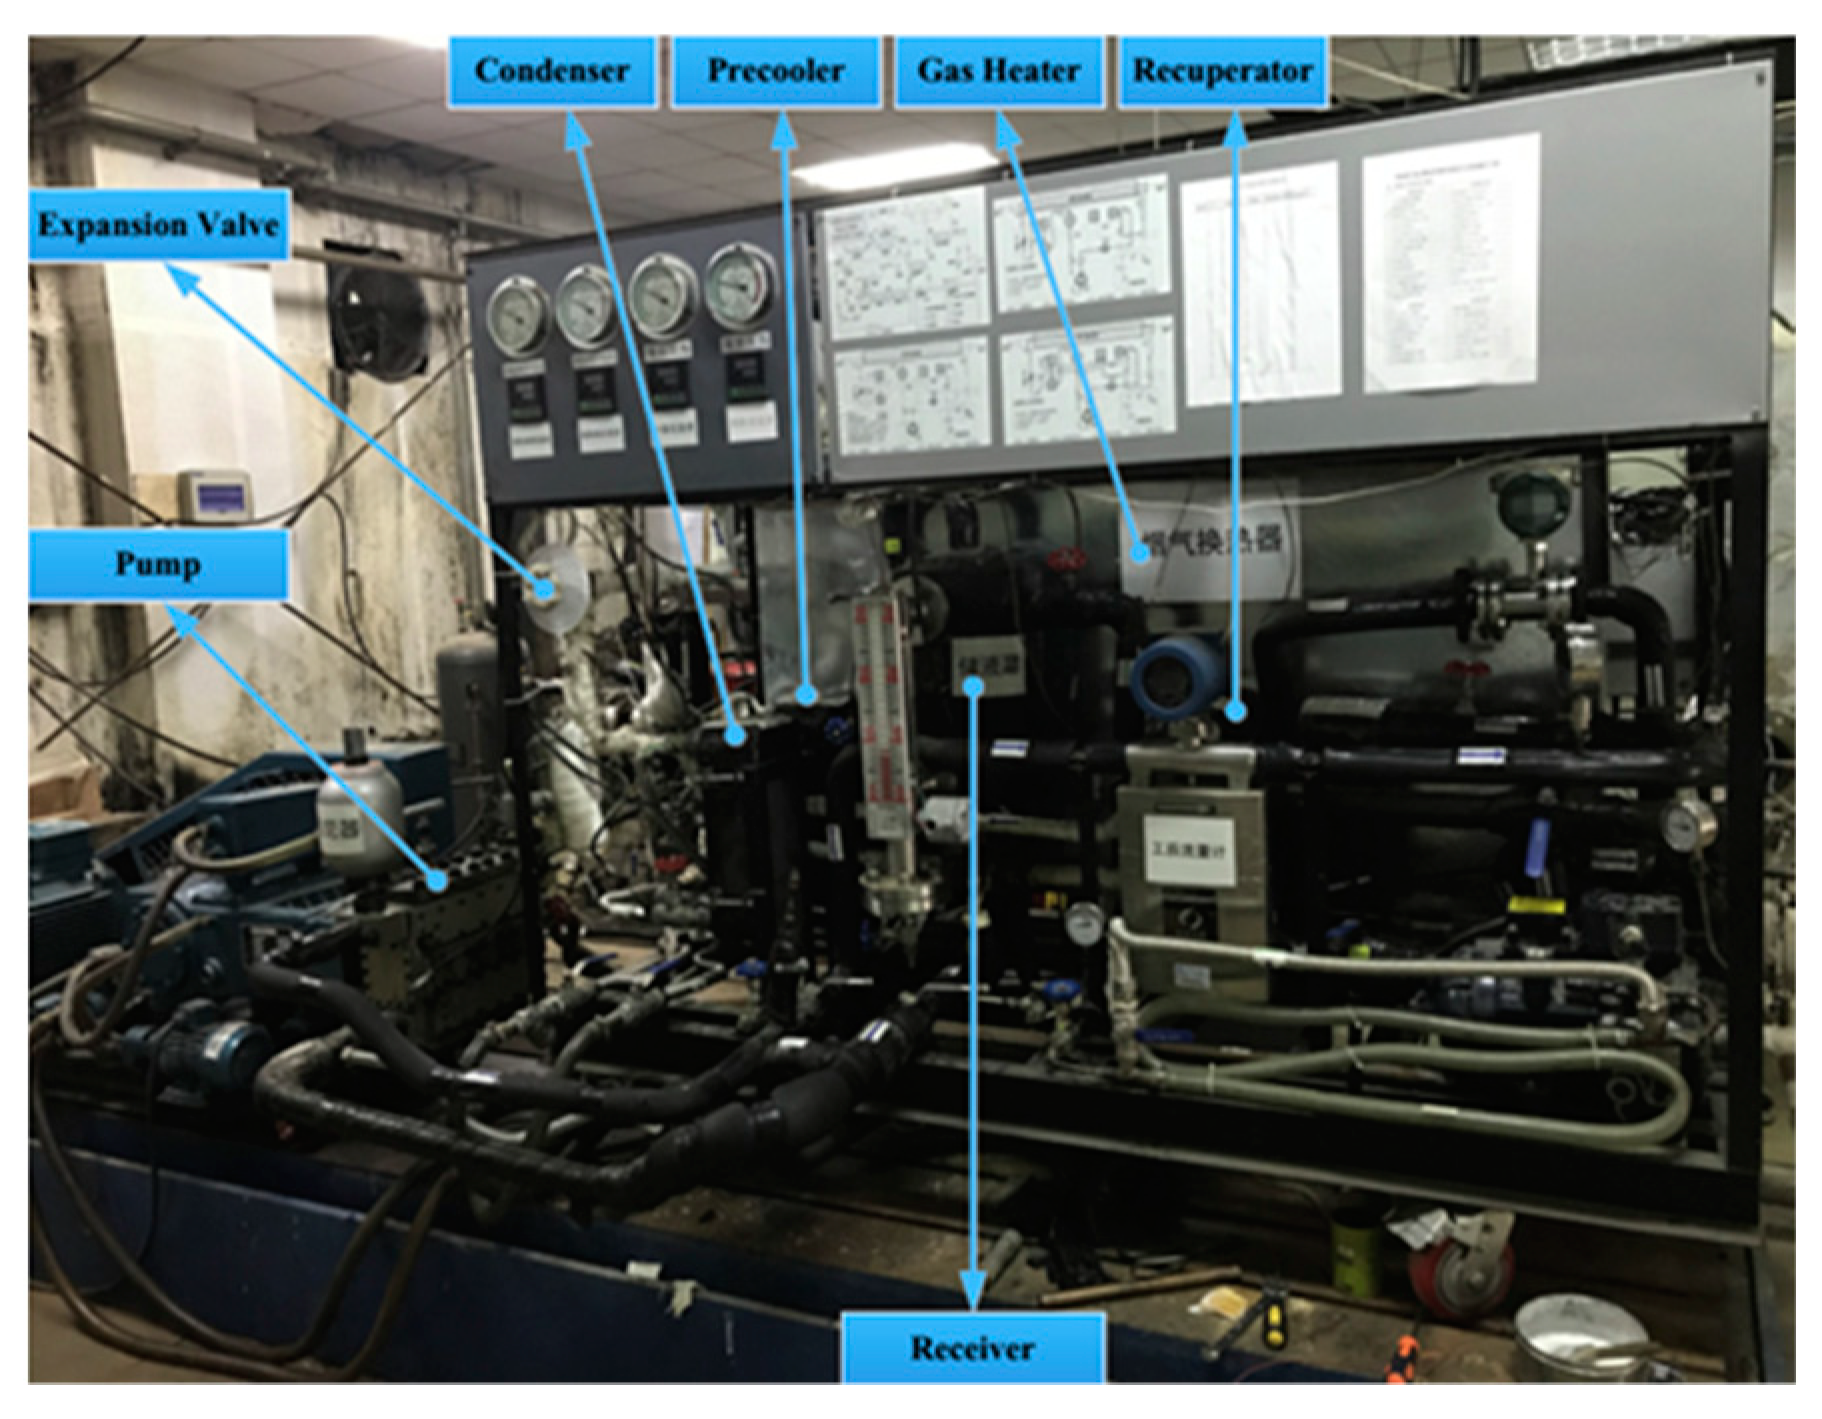
Table 1 lists the main parameters of the diesel engine and its supporting coolant system under rated conditions. The diesel engine and waste heat recovery equipment used in this experiment are shown in
Figure 3.
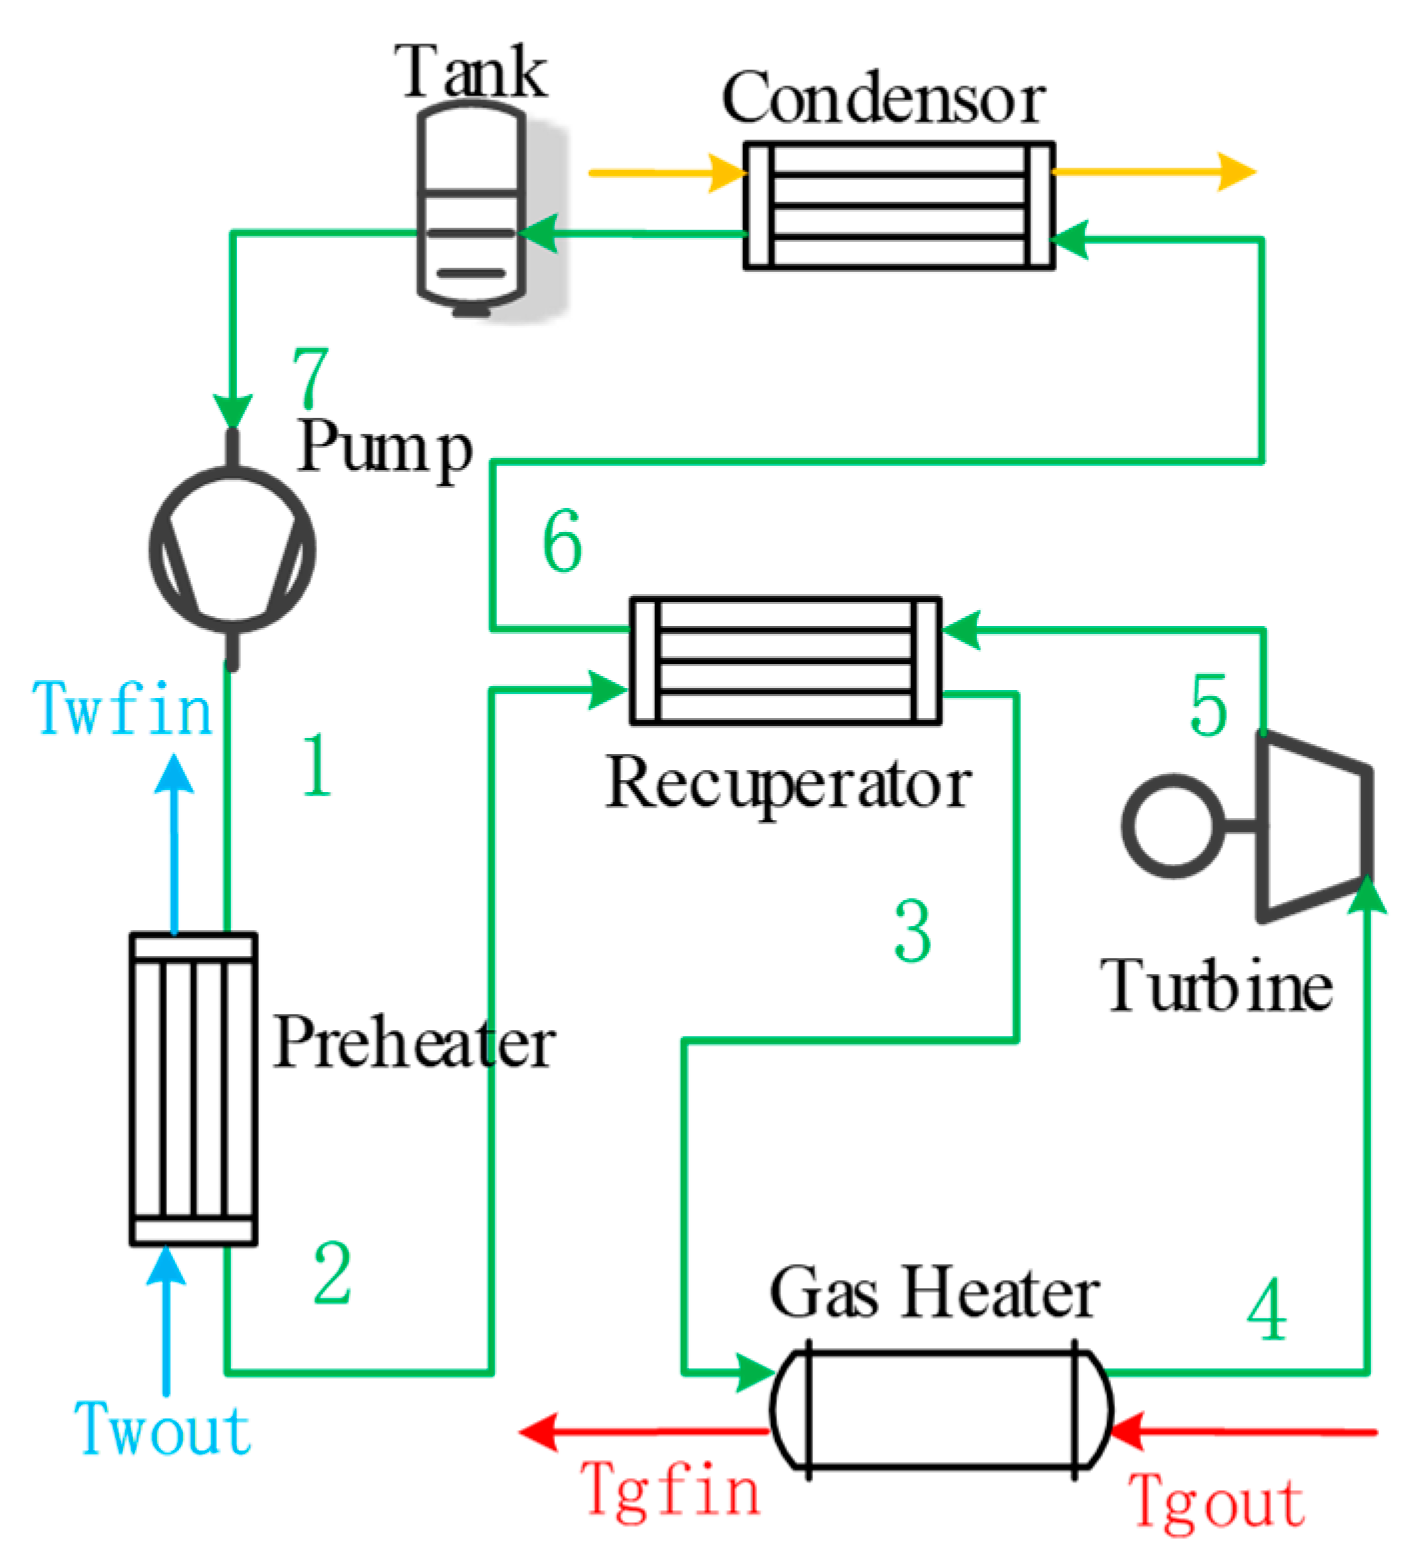
2.3. Waste Heat Recovery System
A simplified model of the CO
2 power cycle used in this study as follows: (1) the system is in a stable state, and the pressure drop and heat loss in the connecting pipeline are ignored; (2) the isentropic efficiency of the expander is constant at 0.6, and the isentropic efficiency of the working fluid pump is constant at 0.7. In the structure form, a dynamic cycle with preheater and regenerator is adopted.
Figure 4 is the schematic diagram of the system. The experimental equipment uses coolant for cooling, the temperature difference at the pinch point of the regenerator is 10 K and temperature difference at the pinch point of the flue gas heat exchanger is 10 K.
In the whole cycle, the first and second laws of thermodynamics are calculated as follows:
Working fluid pump power consumption is:
Heat transfer rate of preheater is:
Heat transfer rate of regenerator is:
Heat transfer rate of flue gas heat exchanger is:
The expander does work given by:
Heat transfer rate of condenser is:
Circulated thermal efficiency is:
Considering that the condition of this cycle is for vehicle use and the lack of low-temperature coolant, air cooling is adopted. According to the cooling load and CO
2 heat transfer formula adopted in the previous section, a 6-row 2-pass finned tube air cooled condenser is designed. The instruments used to obtain each measurement are given in
Table 2.
2.4. GT-Power Model
In this paper, the “Cooling Systems and Thermal Management” and “Air Conditioning/Waste Heat Recovery” modules in GT-SUITE are used for modeling. In the calculation process, the following simplifications are made: (1) only axial flow of the working fluid along the pipeline is considered, while the radial flow is not considered; (2) keep the isentropic efficiency of the pump and compressor at 70% and the isentropic efficiency of the expander at 60%.
In this paper, the waste heat recovery system uses piston pump, its flow rate is mainly controlled by the speed:
In the formula,
Vp represents the pump volume,
ρp represents the working mass density at the pump inlet,
χp represents the volumetric efficiency of the pump, and
np represents the pump speed. The errors between the GT-Power model and the experimental data are shown in
Table 3. The errors between some components and GT-Power model are shown in
Table 4.
2.5. Working Conditions
This paper chooses eight kinds of working conditions, studies the performance of coupled thermal management system in different working conditions under the environmental temperature of 15 °C, 25 °C and 35 °C, optimizes each system under various conditions and environmental temperatures, and then compares the optimizations. The working conditions are shown in
Table 5.
3. Theoretical Results and Discussion
Basing on the established system model and the corresponding GT-Power model, a simulation calculation is carried out. There are many subsystems and components in the coupled heat management system, and the structure is complex, so the analysis of subsystem performance can provide the foundation for coupling subsystems and designing a comprehensive thermal management system. This section analyzes the thermodynamic parameters such as working fluid temperature and pressure in the system, as well as the actual operating parameters such as the rotating speed of power components, environmental temperature and diesel engine working conditions. Then, this section optimizes the rotating speed of each power component of the system to maximize the net power of each system under this working condition, and performs comparisons and optimizations.
Other scholars have carried out detailed research on the air conditioning system, so this paper does not study the performance of the air conditioning subsystem alone, but rather focuses on analyzing it in the coupled heat management system. The waste heat recovery system and the engine and coolant system are analyzed below.
3.1. Performance Analysis of Waste Heat Recovery System
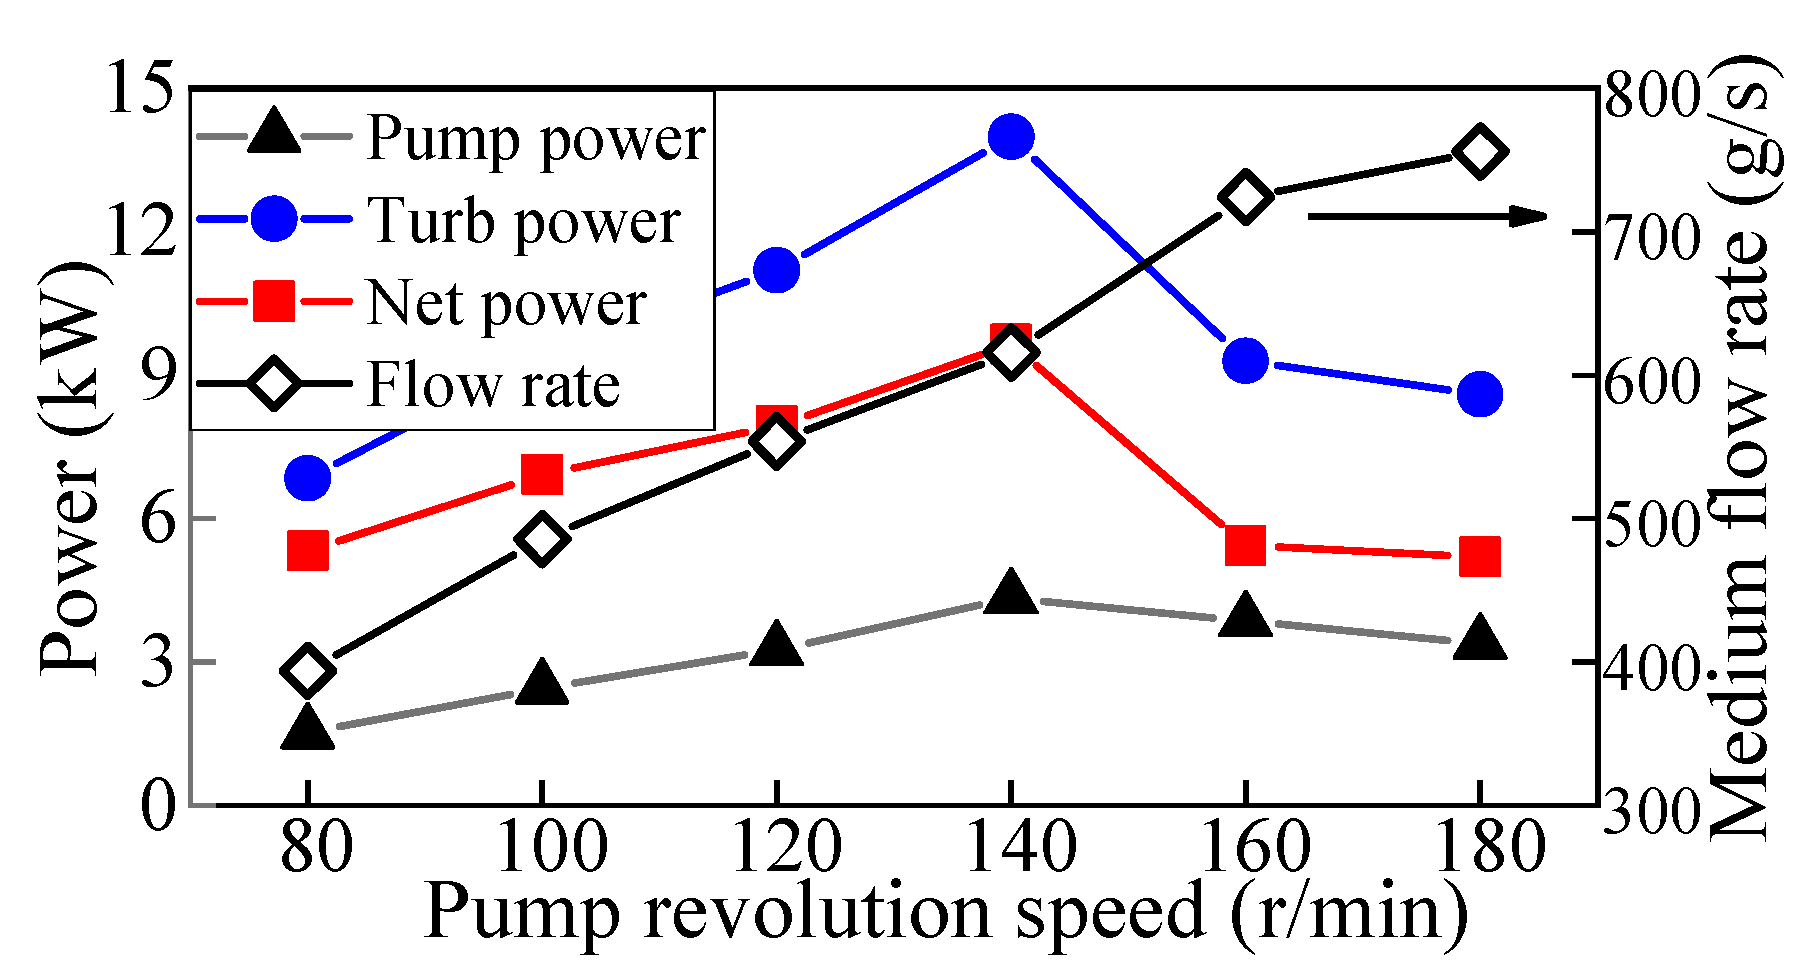
Because the turbine speed has little effect on the net power compared with other parameters under different ambient temperature and engine working conditions, the turbine speed is maintained constant. At 25 °C environmental temperature, the working fluid pump speed changes. As can be seen from
Figure 5, the net power of the system first increases and then decreases with the increase of the pump speed. There is a certain pump speed that maximizes the net power, indicating that the system has reached the optimal working pressure. It can be seen from thermodynamic calculations that, within the pressure range of 10–20 MPa, the net power of the system will continue to increase with the increase of pressure, but in an actual system, the interaction of various structures of the system will restrict the optimal pressure value. This conclusion is valid for different environmental temperatures and working conditions. The optimal pump speed increases with the increase of environmental temperature and the decrease of engine load.
3.2. Performance Analysis of Engine and Coolant System
In a general engine, coolant is needed for cooling the engine to ensure its normal operation, and the heat of the coolant is dispersed by the radiator. The radiator fan consumes a lot of energy and the fan power increases rapidly with the increase of diesel engine load and environmental temperature. The energy consumption accessories of the vehicle and system mainly include the air conditioning compressor, radiator fan and condenser fan. For this diesel engine, the power consumptions of the original engine accessories under different working conditions are shown in
Table 6.
Since the work done by the waste heat recovery system and the power consumed by the vehicle accessories are considered in this paper, the net power of the system is defined as the net output power minus the power consumed by the vehicle accessories:
where,
Wf-rad and
Wf-cond respectively represent the power consumption of the radiator fan and condenser fan. Coupling the coolant system with the waste heat recovery system, the coolant is cooled by the preheater first, which reduces the cooling load of the radiator and also absorb and utilize the waste heat of the coolant, thus increasing the energy utilization rate. The utilization rate of coolant can be indicated as follows:
where,
ηw is the utilization rate of coolant utilization,
Qprep is heat transfer rate of preheater shown as in equation (18),
cw and
mw respectively represent the specific heat capacity and mass flow rate of the coolant,
tout and
tback respectively represent the initial temperature and reflux temperature of the coolant.
However, in the waste heat recovery system, the working fluid needs to be cooled by the condenser, during which the condenser fan also needs to consume additional work. The power consumption of radiator fan and condenser fan reduces the net power of the system. By adjusting the work of the two fans, the total power consumption of two fans is minimized, and the net power of the system can be increased.
3.3. Coupled Analysis of Waste Heat Recovery System and Coolant System
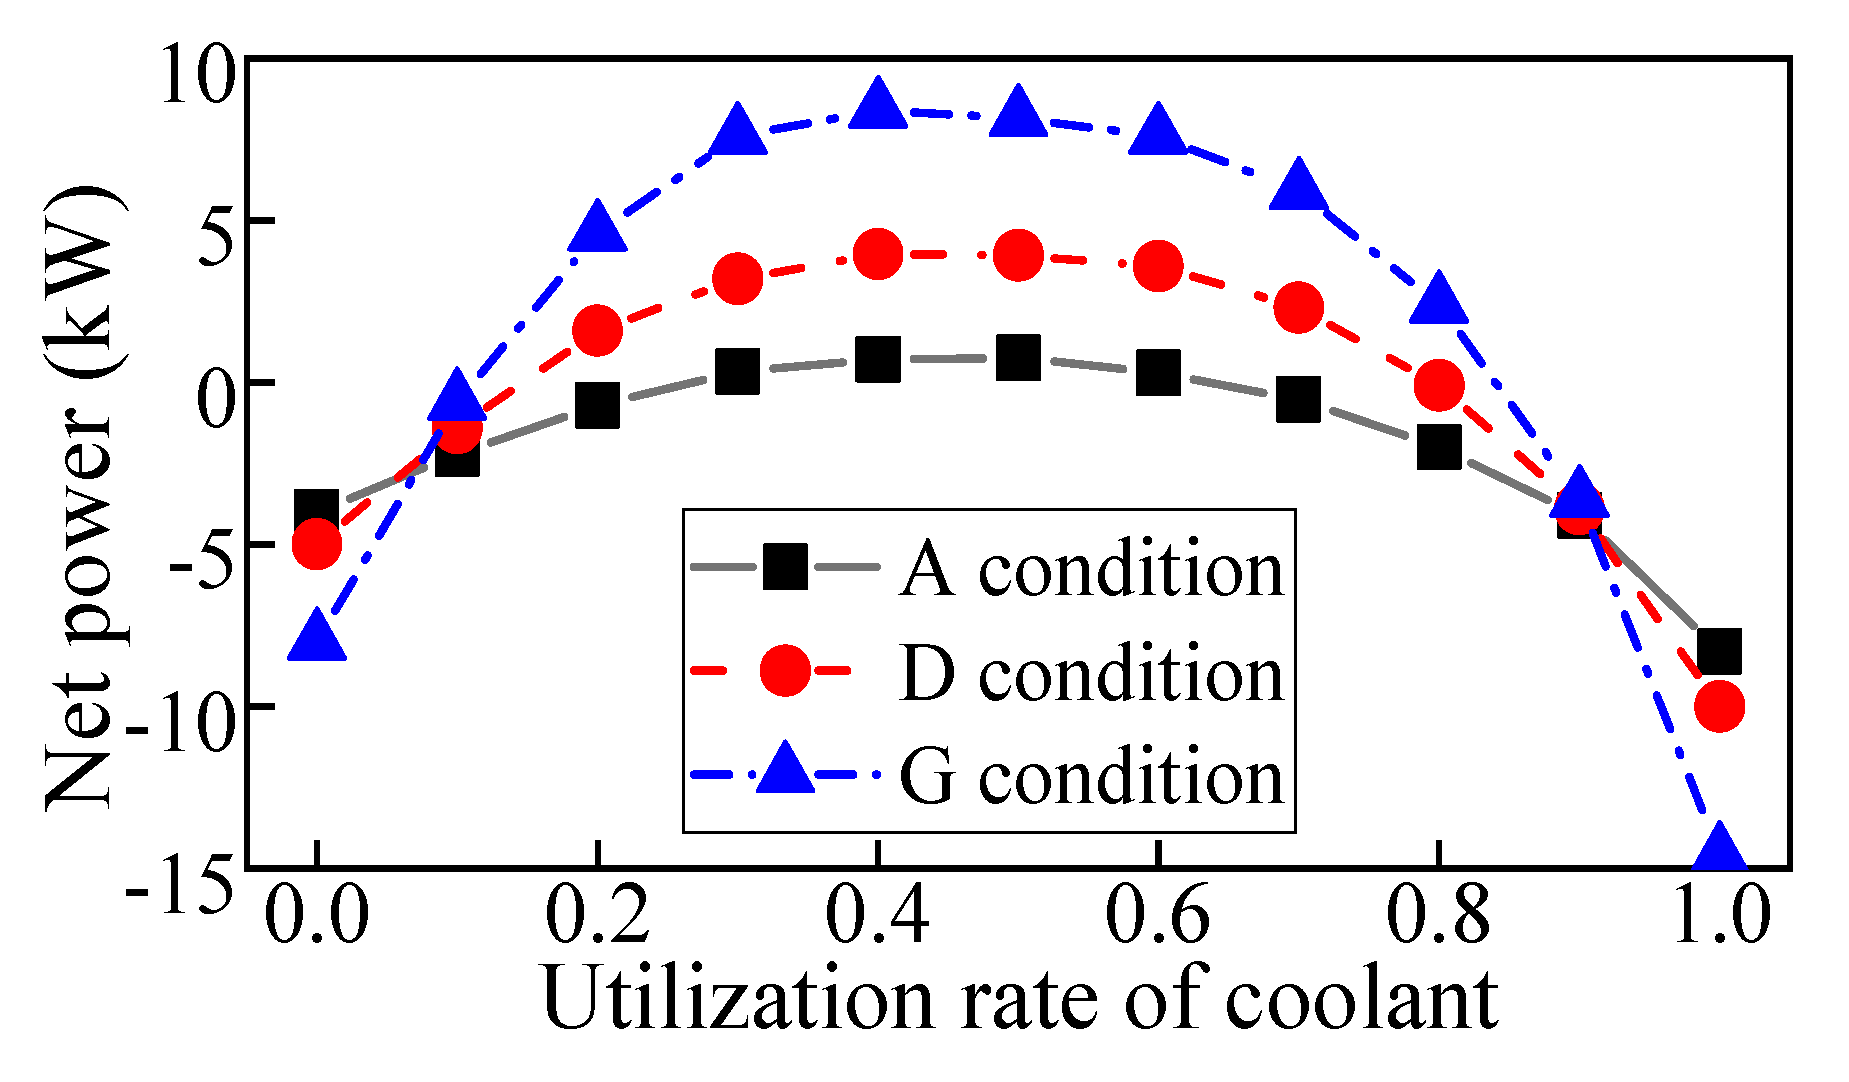
Figure 6 shows that under 25 °C environmental temperature, with the diesel engine working in three conditions of A, D and G, there is a variation of the system’s net power with the change of coolant utilization. When the heat of coolant is partially utilized, the system has the maximum net power. Under all working conditions, the system has the maximum net power when coolant utilization rate is between 38% and 52%. The optimal coolant utilization rate decreases with the increase of engine load.
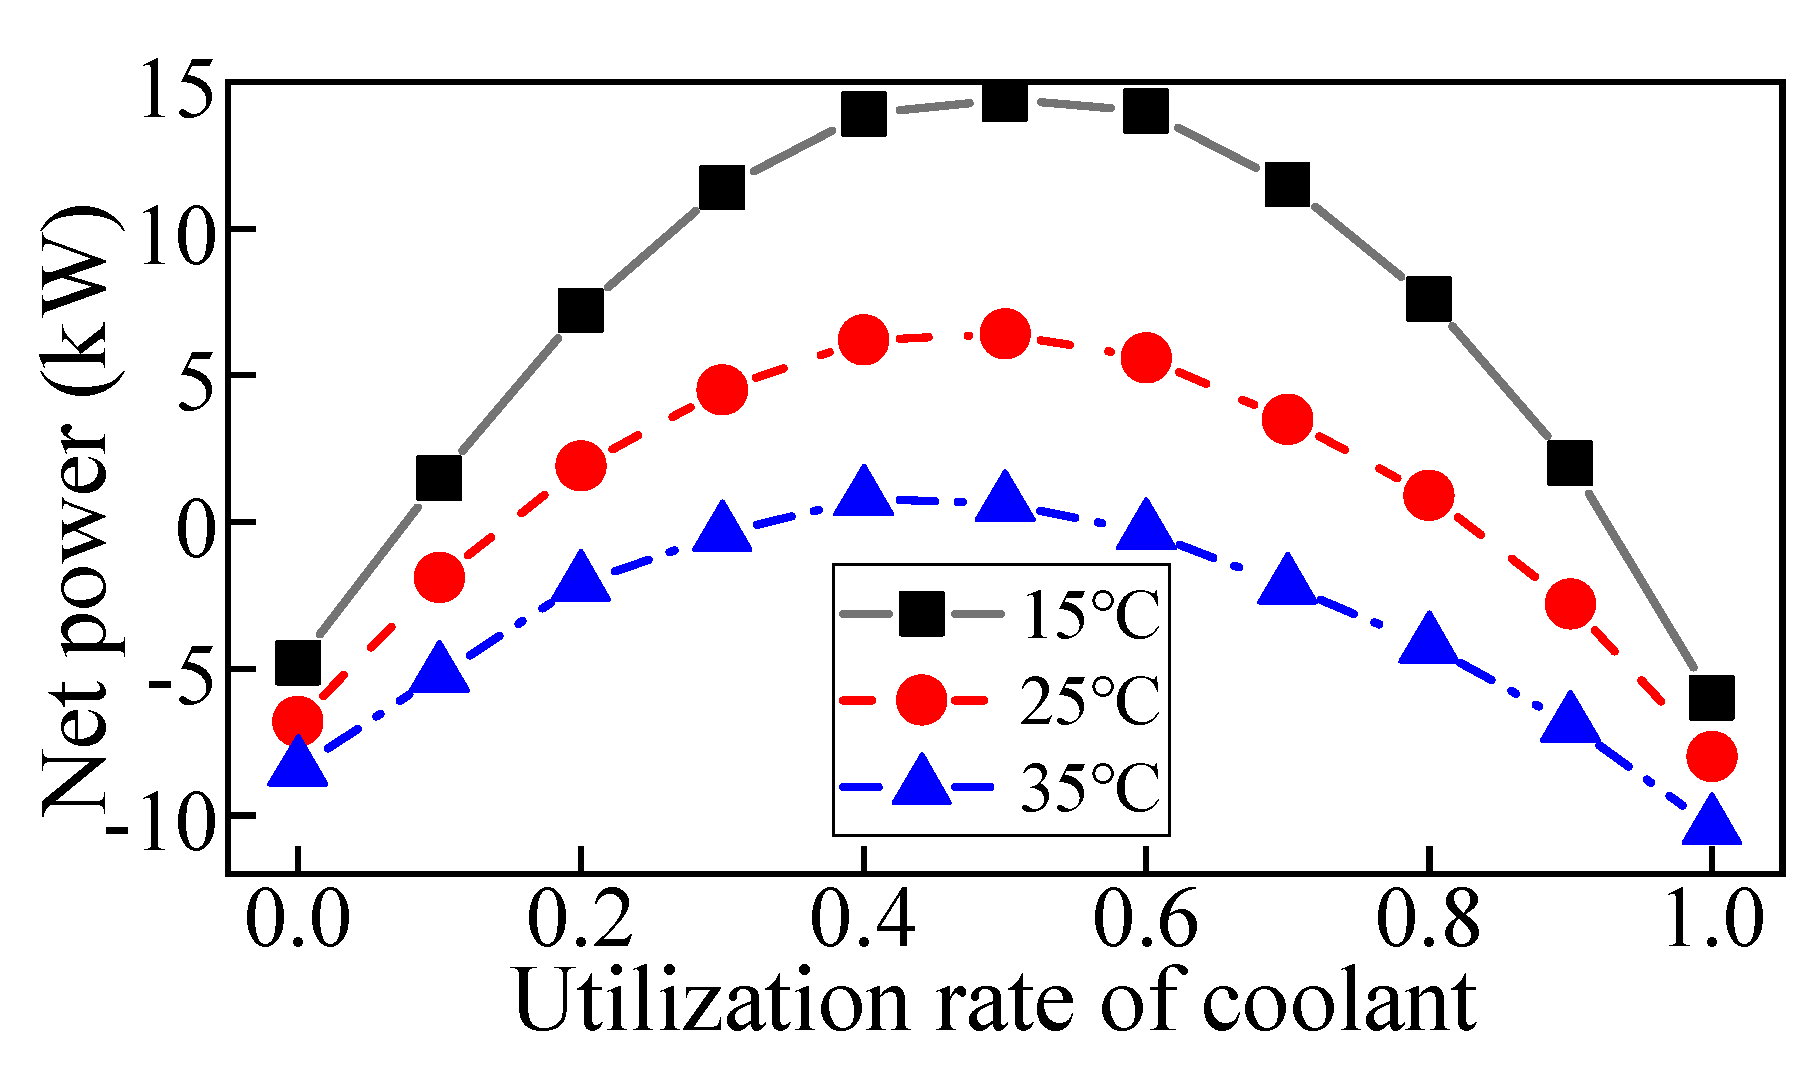
Figure 7 shows that under environmental temperature of 15 °C, 25 °C and 35 °C, the net power of the system varies with the utilization rate of coolant under F working condition.
As the environmental temperature increases, the fan power consumption increases, and the net power of the system decreases. Under all working conditions, the system has the maximum power when the coolant utilization rates is between 40% and 50%. The optimal coolant utilization rate decreases slightly with the increase of environmental temperature.
4. Performance Analysis and Optimization of Coupled Heat Management System
According to the analysis of the performance of each subsystem in the previous sections, combined with the characteristics of each subsystem, this paper designs thermal management systems with different structure forms, and discusses the performance of each thermal management system under various working conditions and environmental temperatures. In this paper, six coupled heat management systems are proposed according to the situation that the waste heat recovery system and air conditioning system share the compressed parts and cooling parts in the main road, the arrangement order of the compressed parts and cooling parts used in the main road after the mixing point of working fluid, and the secondary compression and cooling situation of the waste heat recovery system branch.
4.1. Coupled Heat Management System Model
The first group of systems are the thermal management systems that share the cooling components. As shown in
Figure 8, system 1 is a co-cooling single compression system, consisting of two compression parts and one cooling part, in which the condenser is shared by the two subsystems. As shown in
Figure 9, system 2 is a co-cooling secondary cooling system, consisting of two compression parts and two cooling parts, in which the air cooler is shared by the two subsystems. Based on system 1, part of the working fluid after the shunt passes through the condenser for secondary cooling before entering the power cycle. As shown in
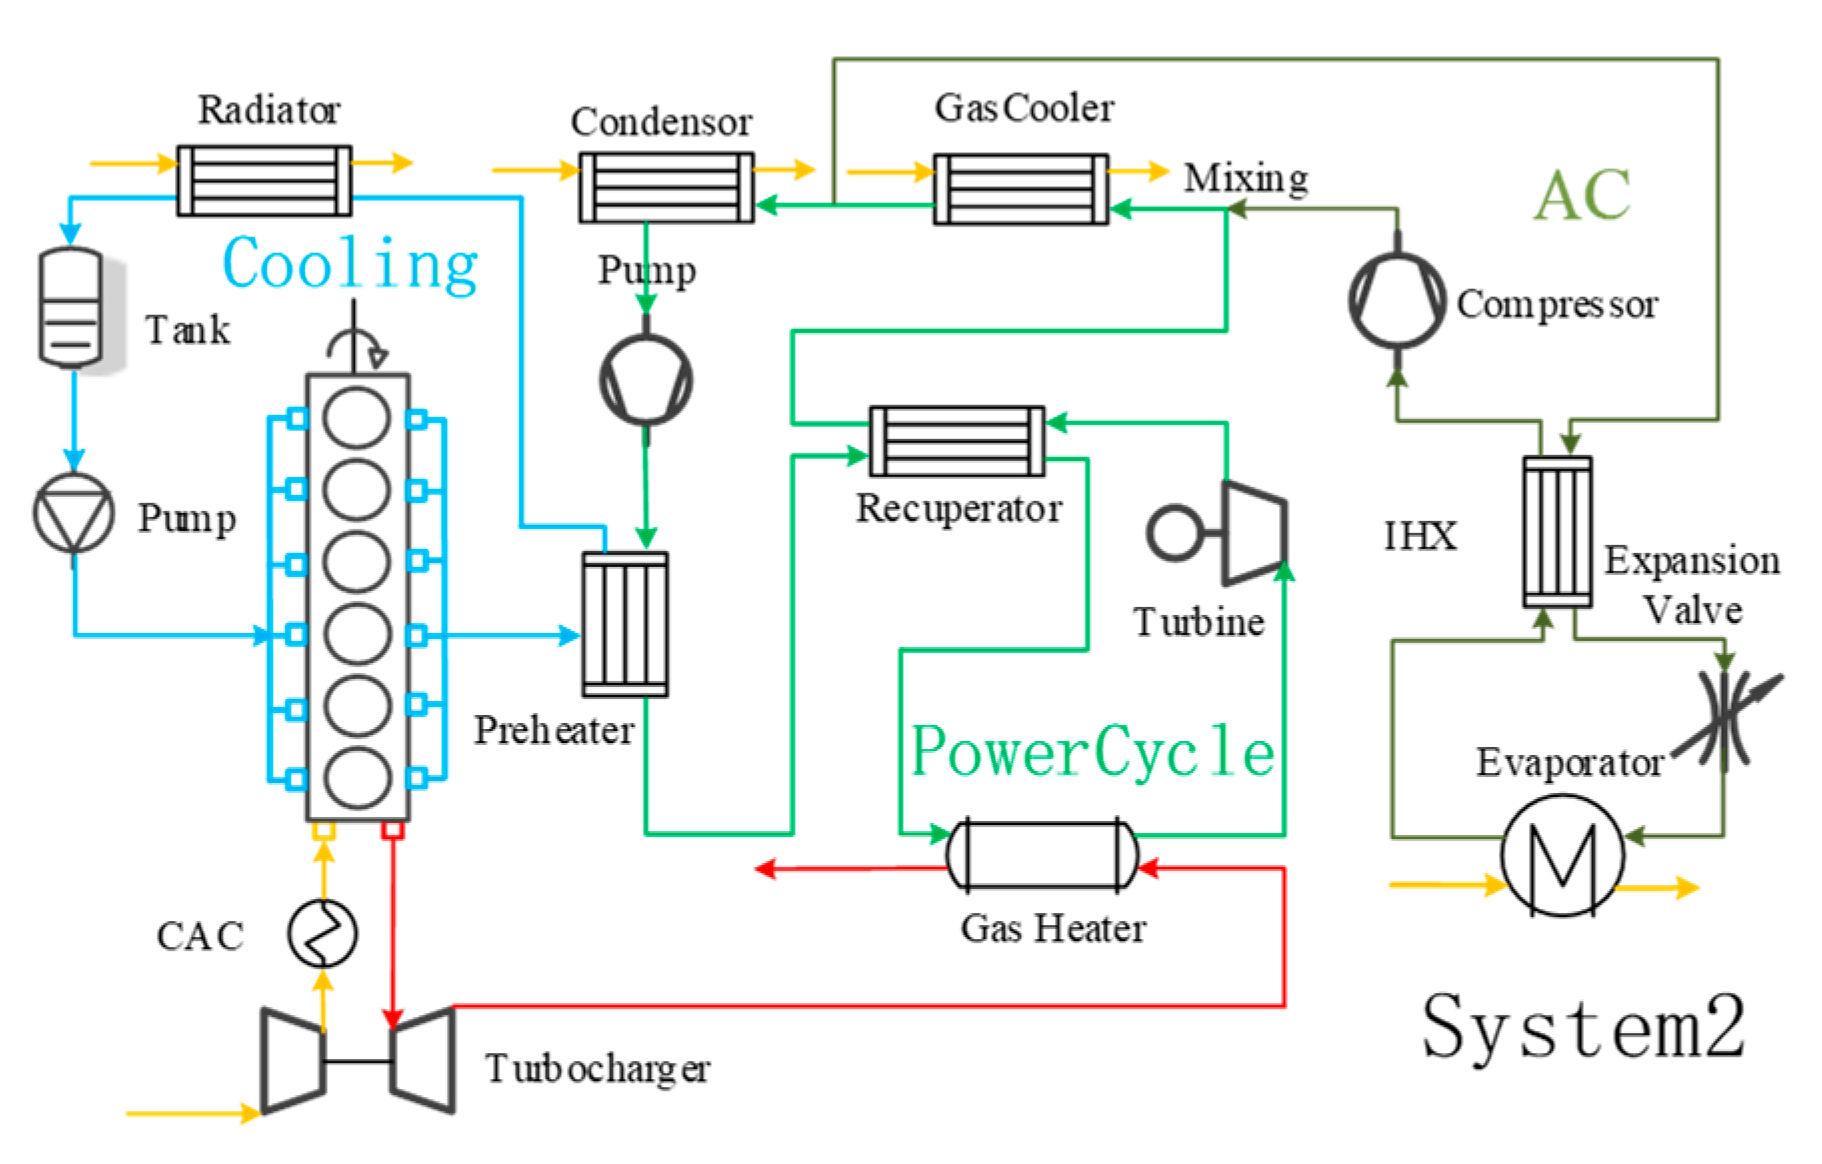
Figure 10, system 3 is a co-cooling secondary compression secondary cooling system, consisting of three compression parts and two cooling parts, in which the air cooler is shared by the two subsystems.
Basing on system 2, after the working fluid is separated, some of the working fluid is firstly compressed by the compressor and then compressed again after secondary cooling by the condenser, so as to realize the double-pressure cycle of the power cycle.
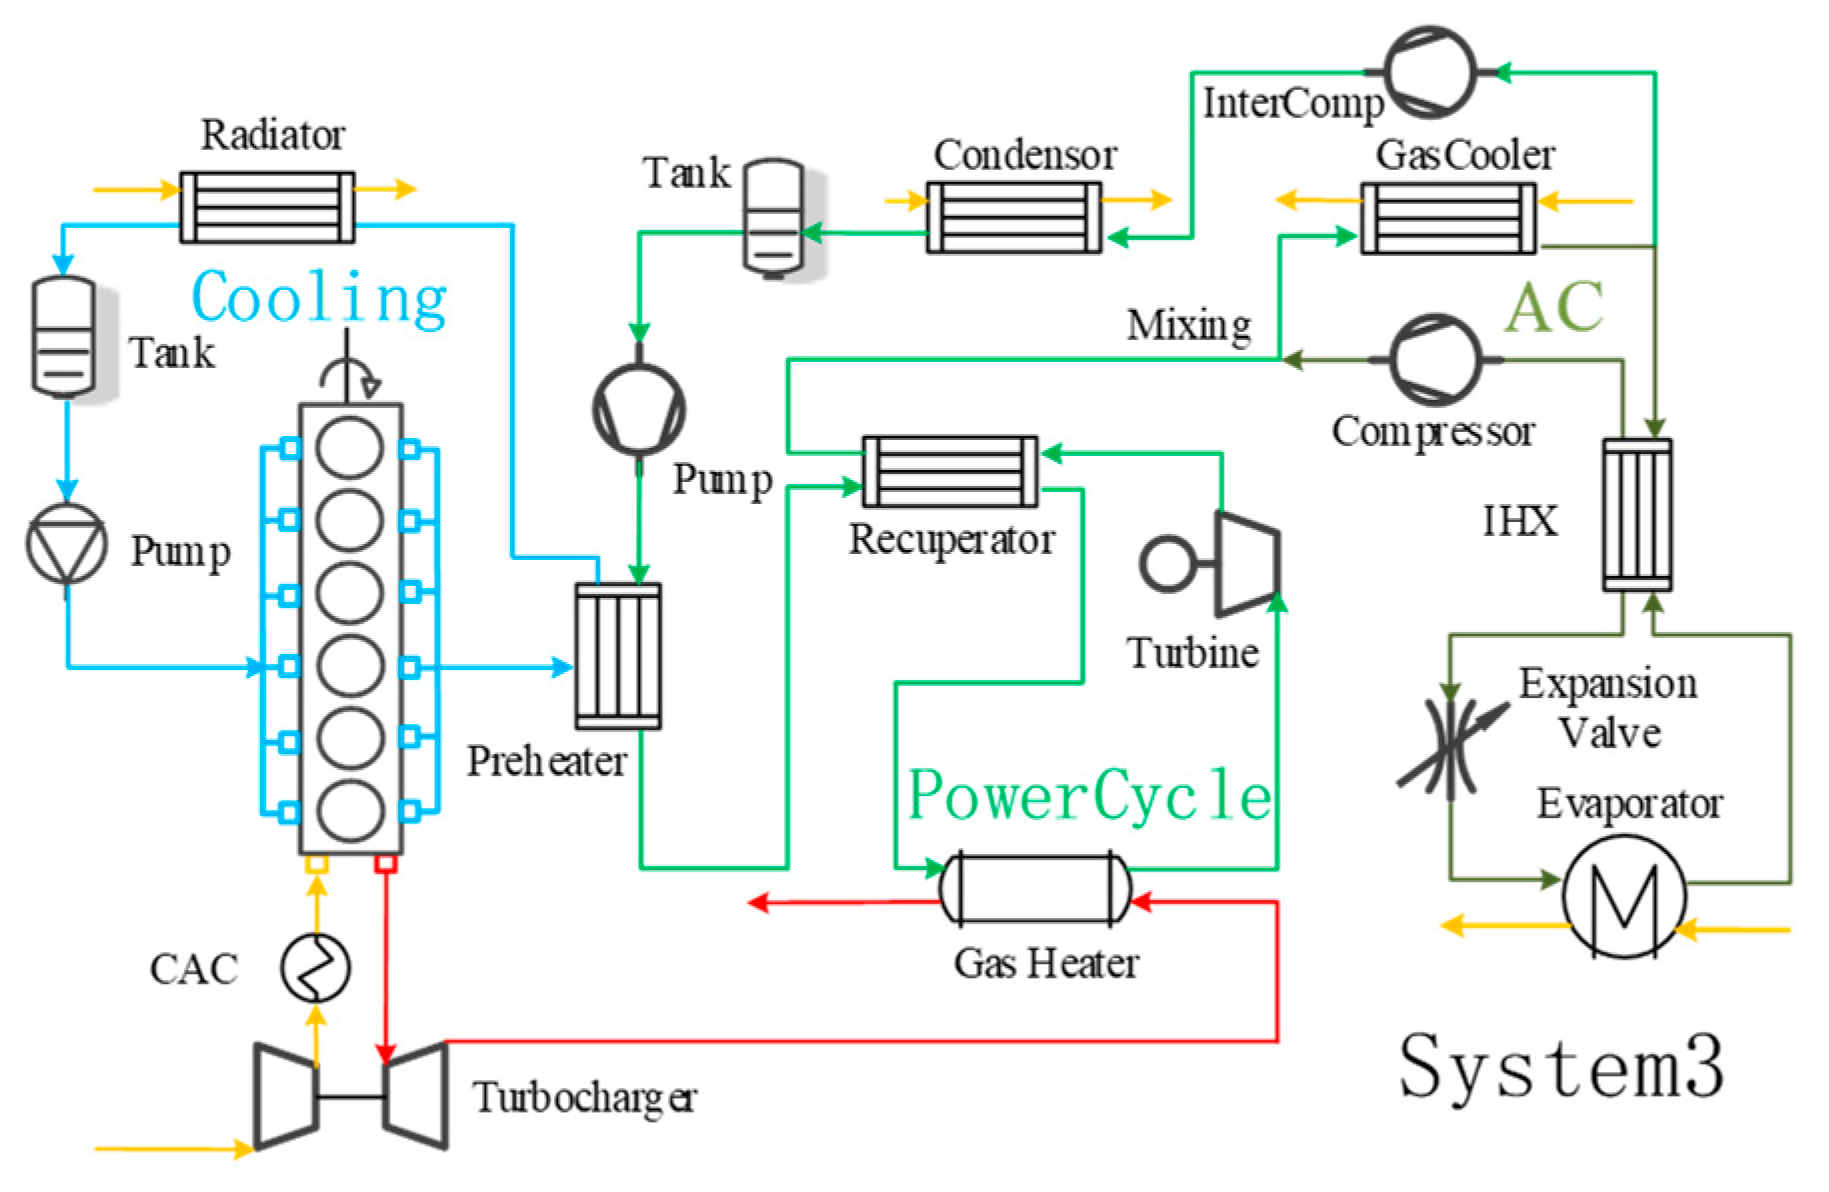
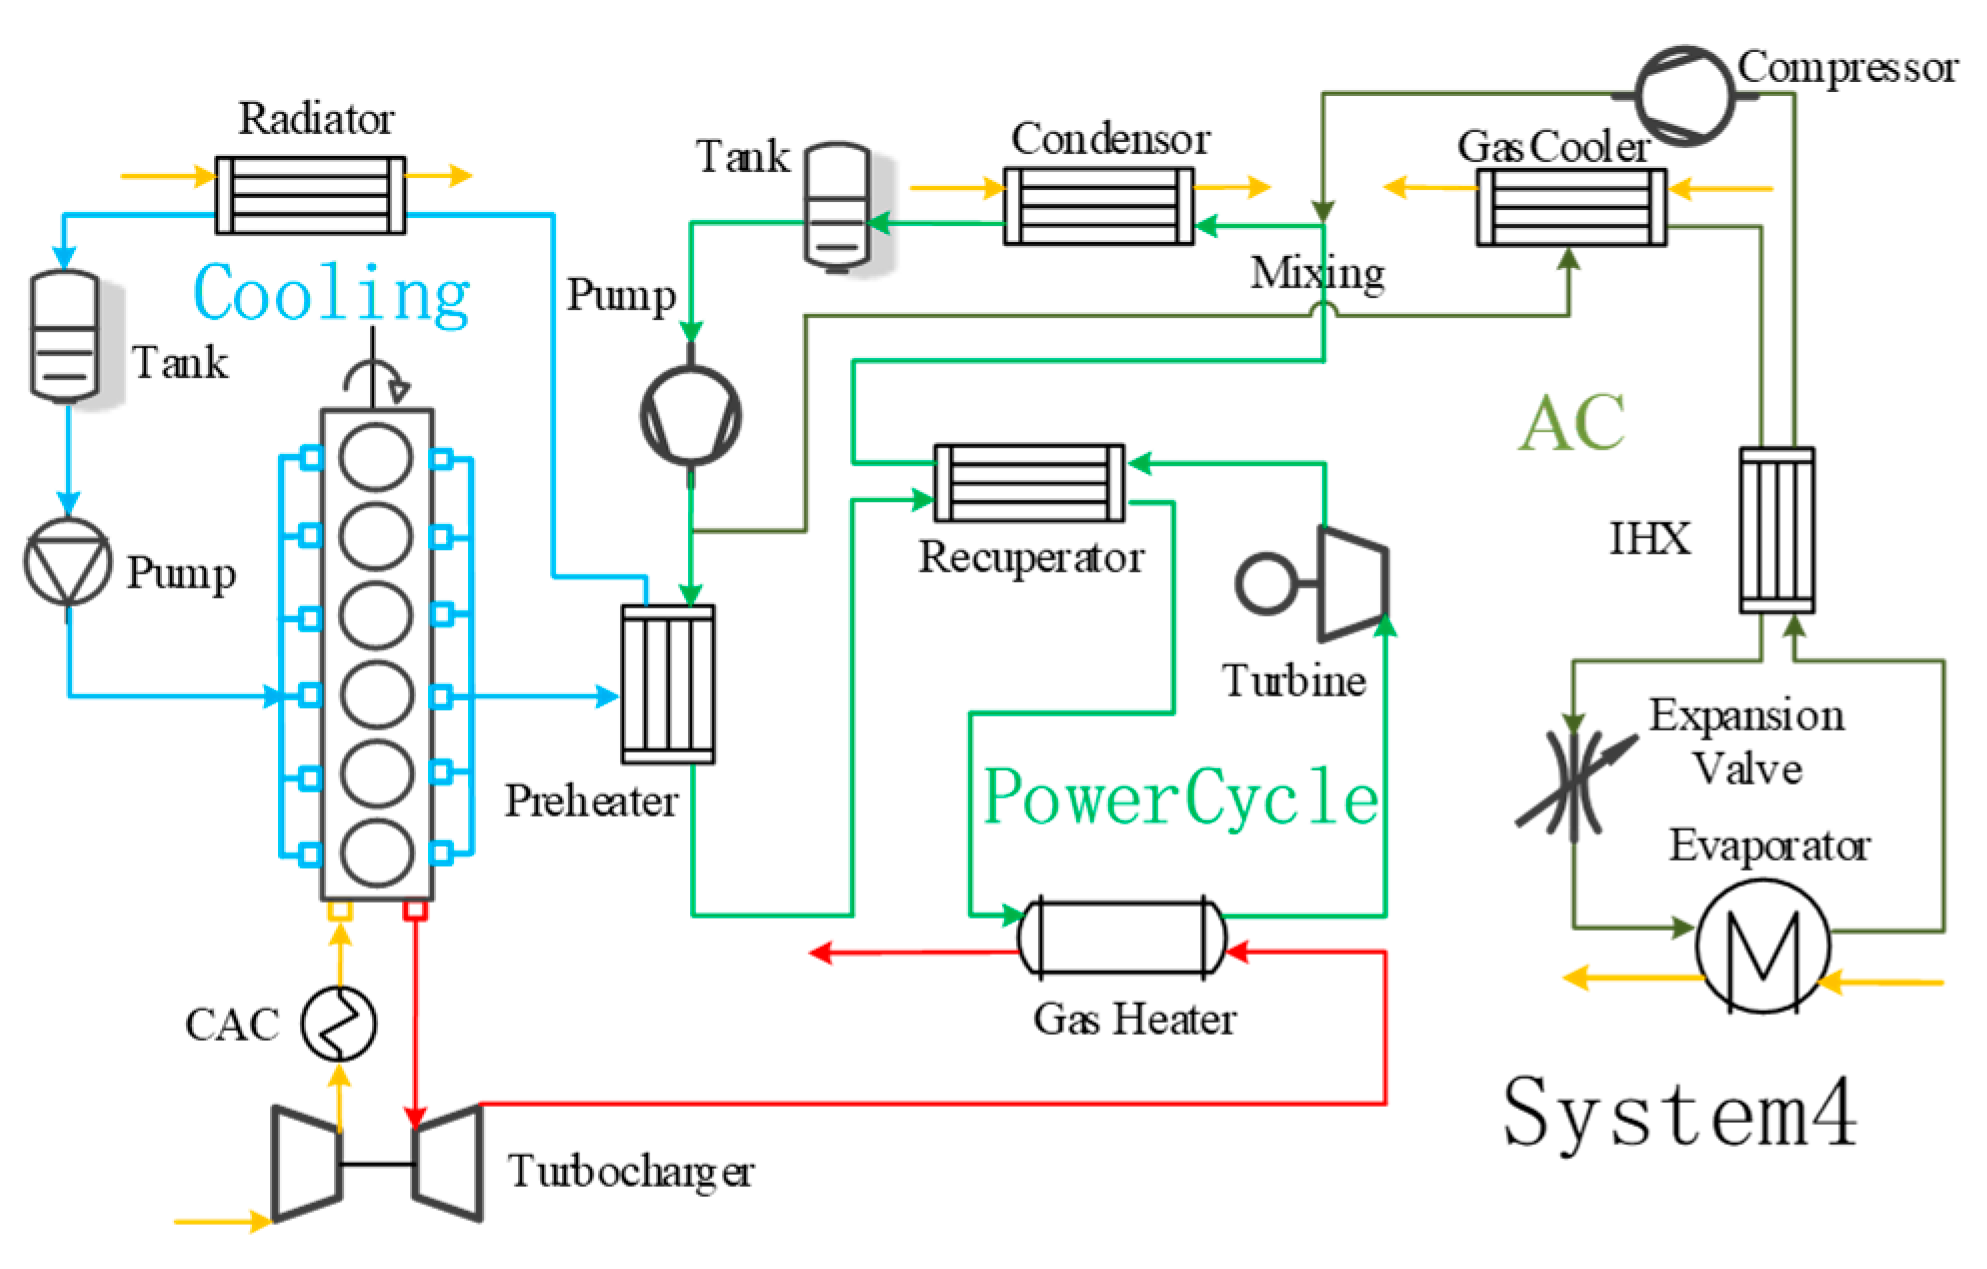
The second group of systems are the thermal management systems that share the power components. The respective schematic diagrams are shown from
Figure 11,
Figure 12 and
Figure 13. As shown in
Figure 11, system 4 is a co-cooling and co-compressing system, including two condensing parts and two compression parts. The working fluid pump is shared by two subsystems. As shown in
Figure 12, system 5 is a co-cooling co-compressing secondary compression system, including two condensing parts and three compression parts. The intermediate compressor is shared by two subsystems. Basing on system 4, the working fluid of the main road is compressed and distributed by the intermediate compressor, and part of the working fluid is compressed by the working fluid pump. As shown in
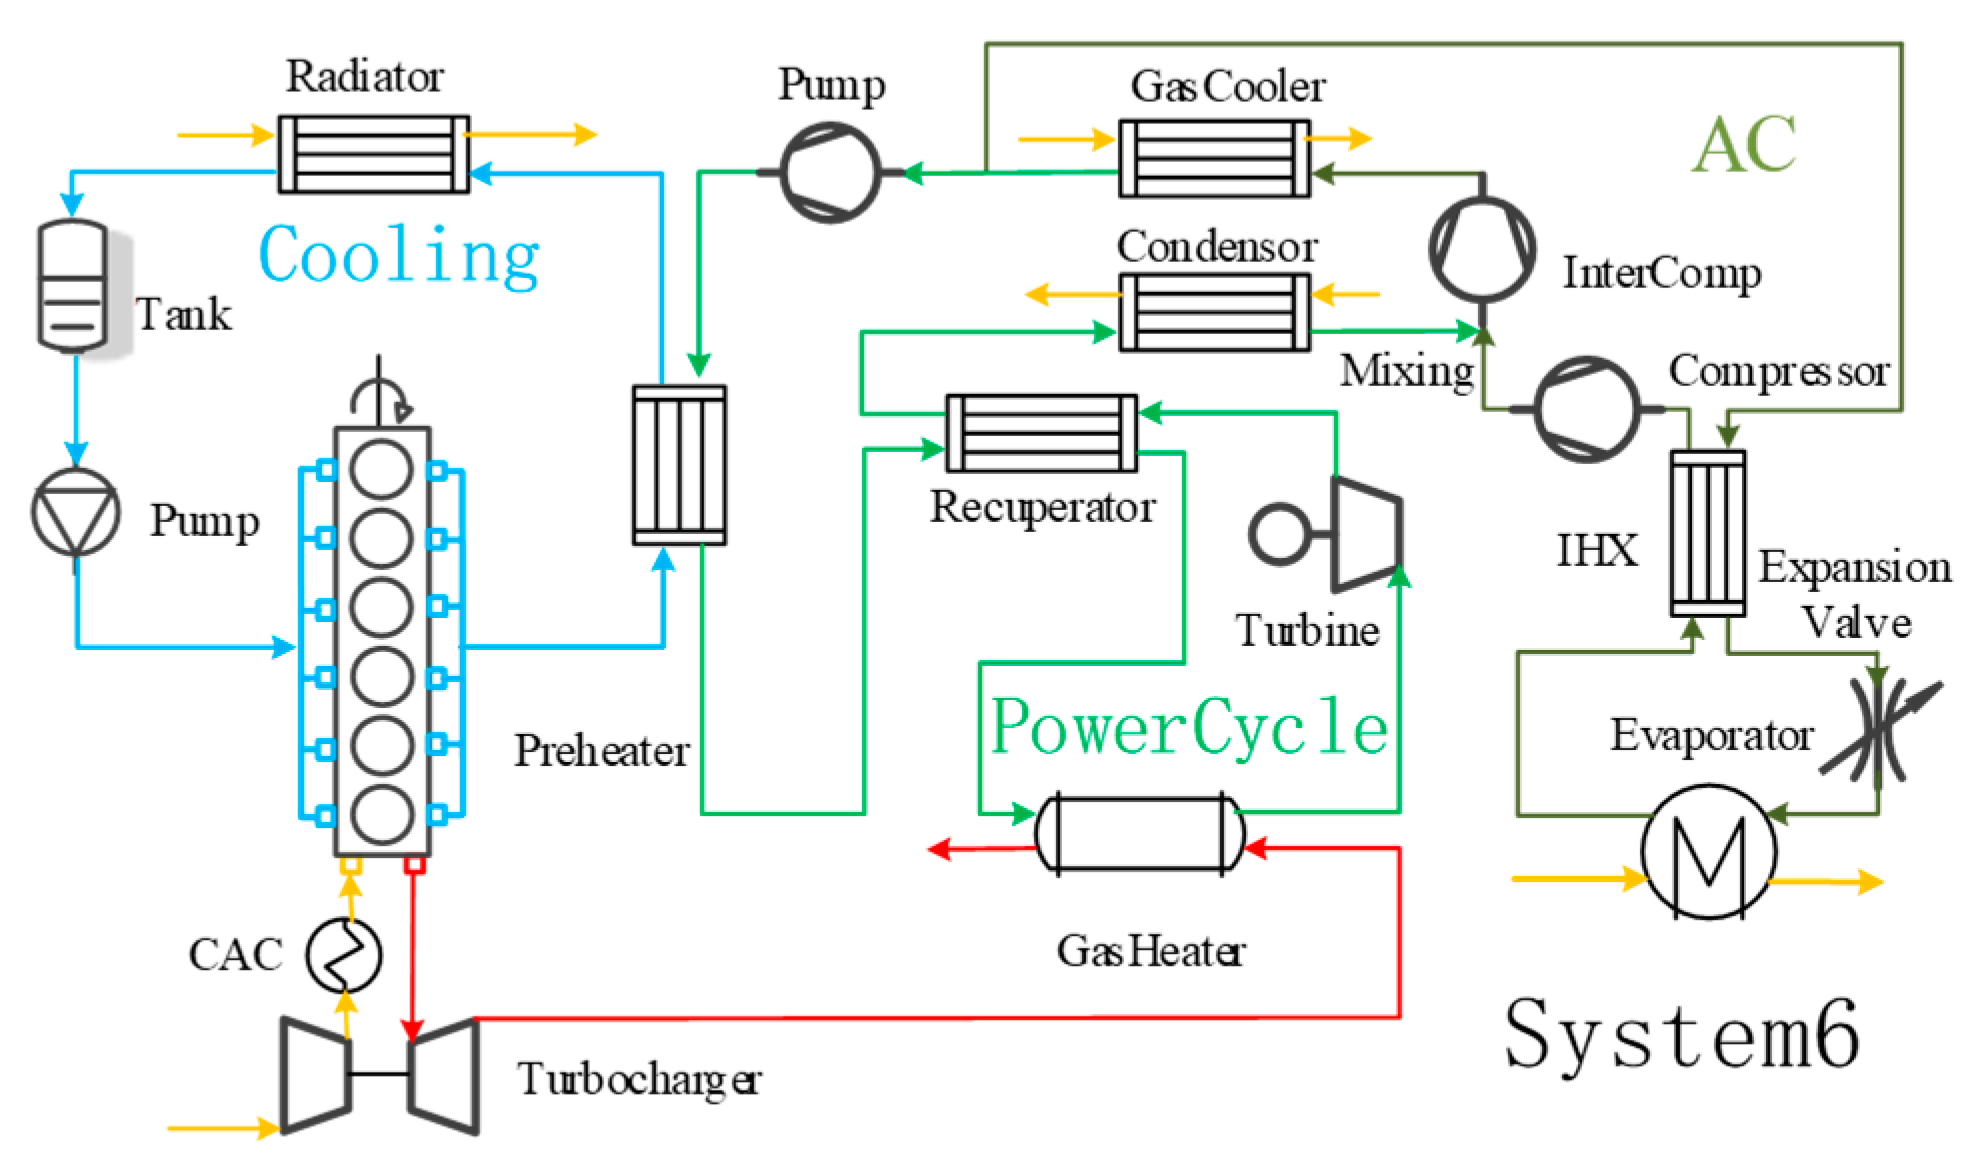
Figure 13, system 6 is a co-compressing and co-cooling secondary compression system. The main difference between system 5 and system 6 is that the sequence of intermediate compression process and condensation process is opposite.
4.2. Coupled Thermal Management System Performance
The working conditions of each system under the optimal utilization rate of coolant are discussed below.
Figure 14,
Figure 15 and
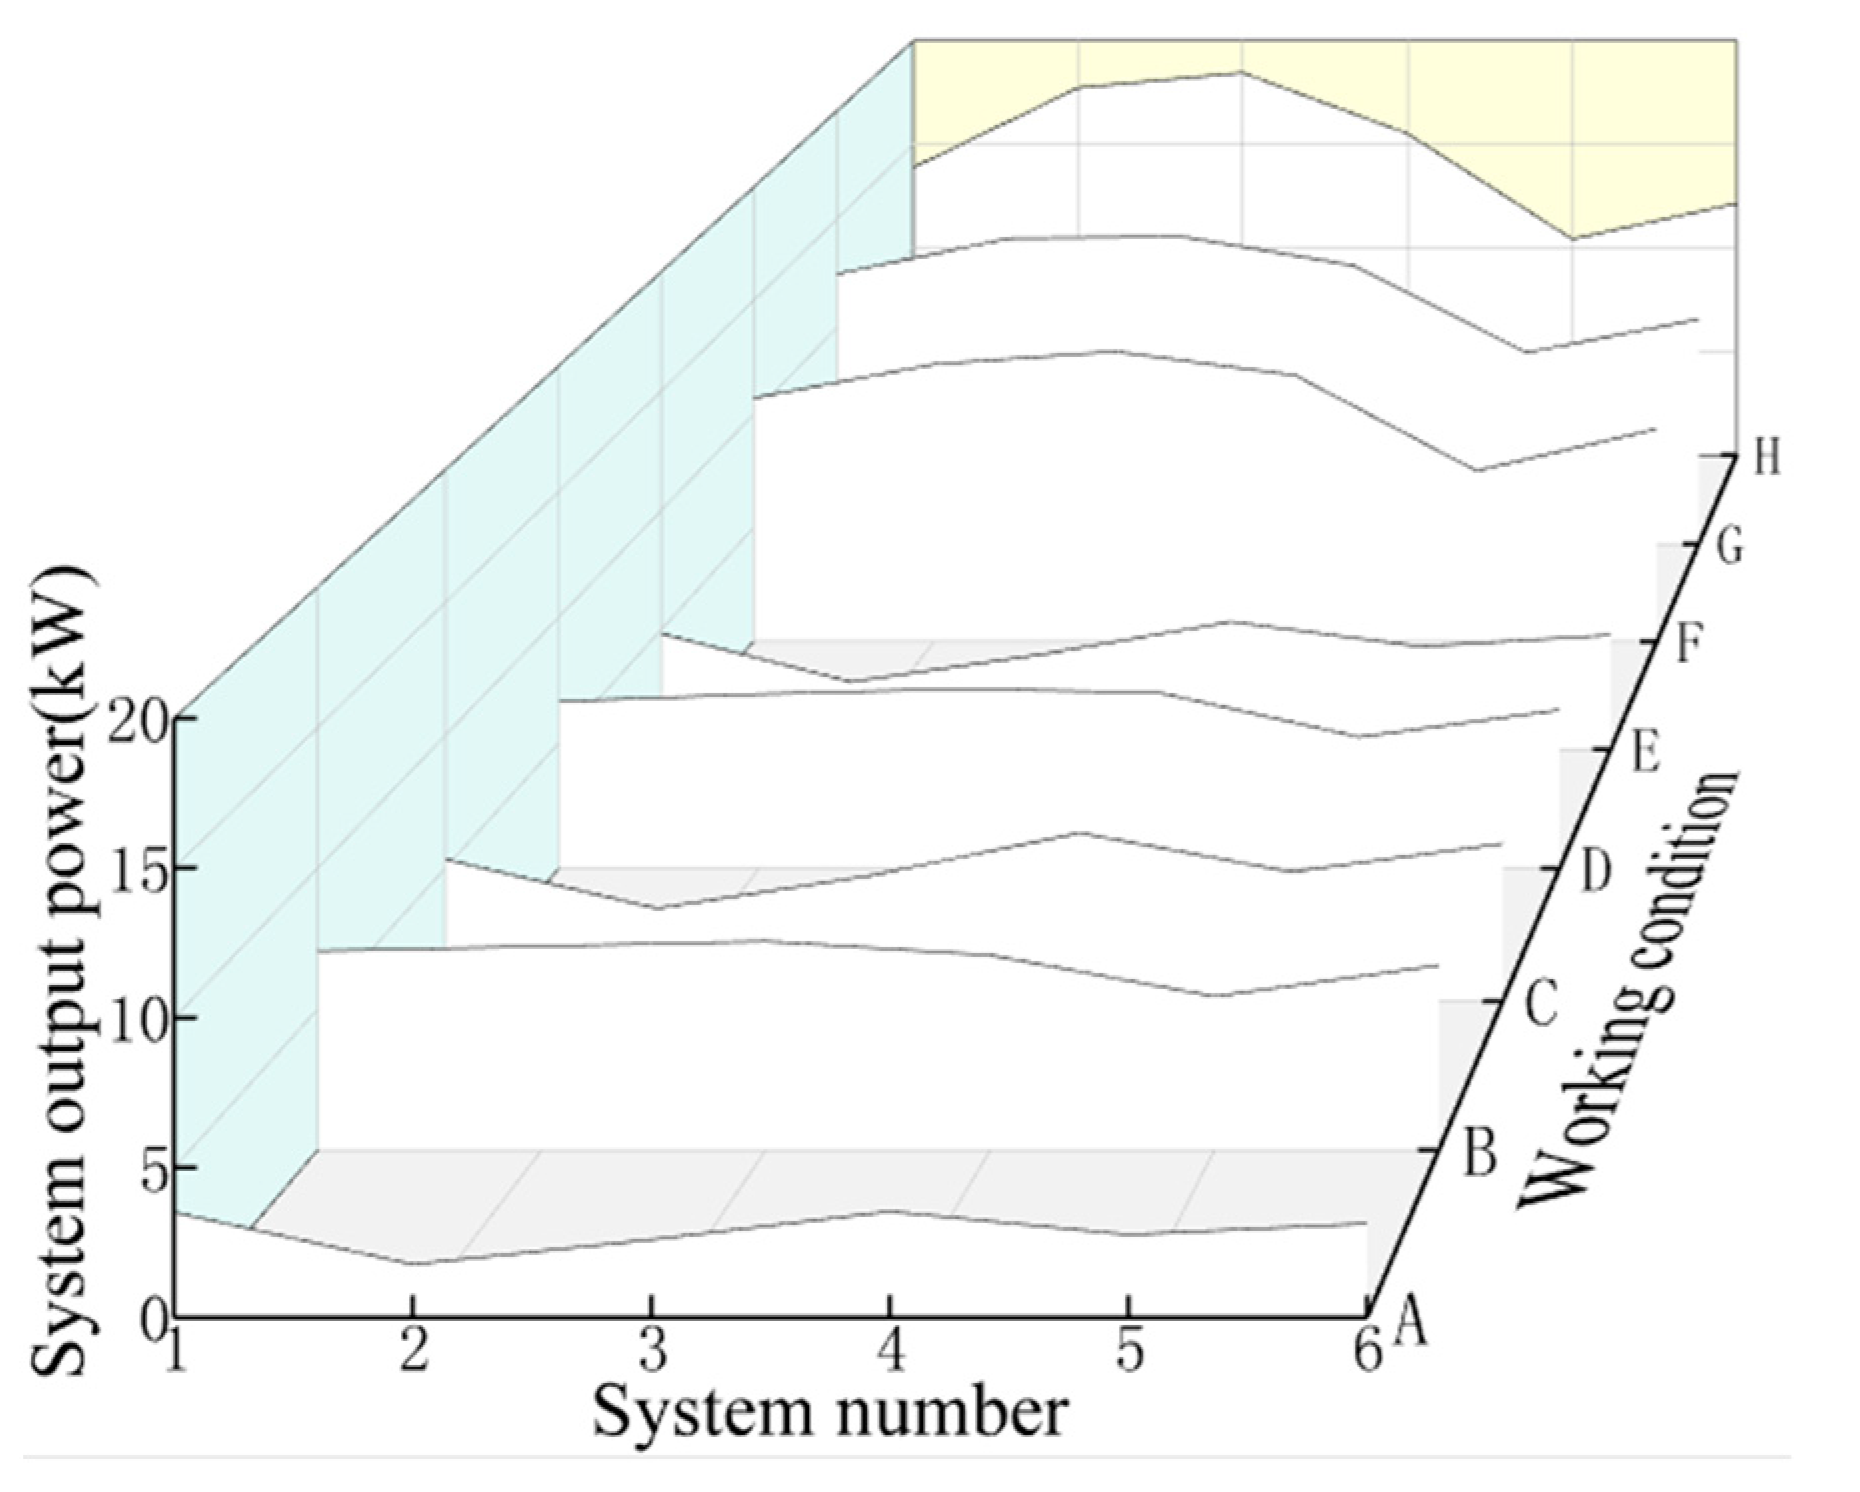
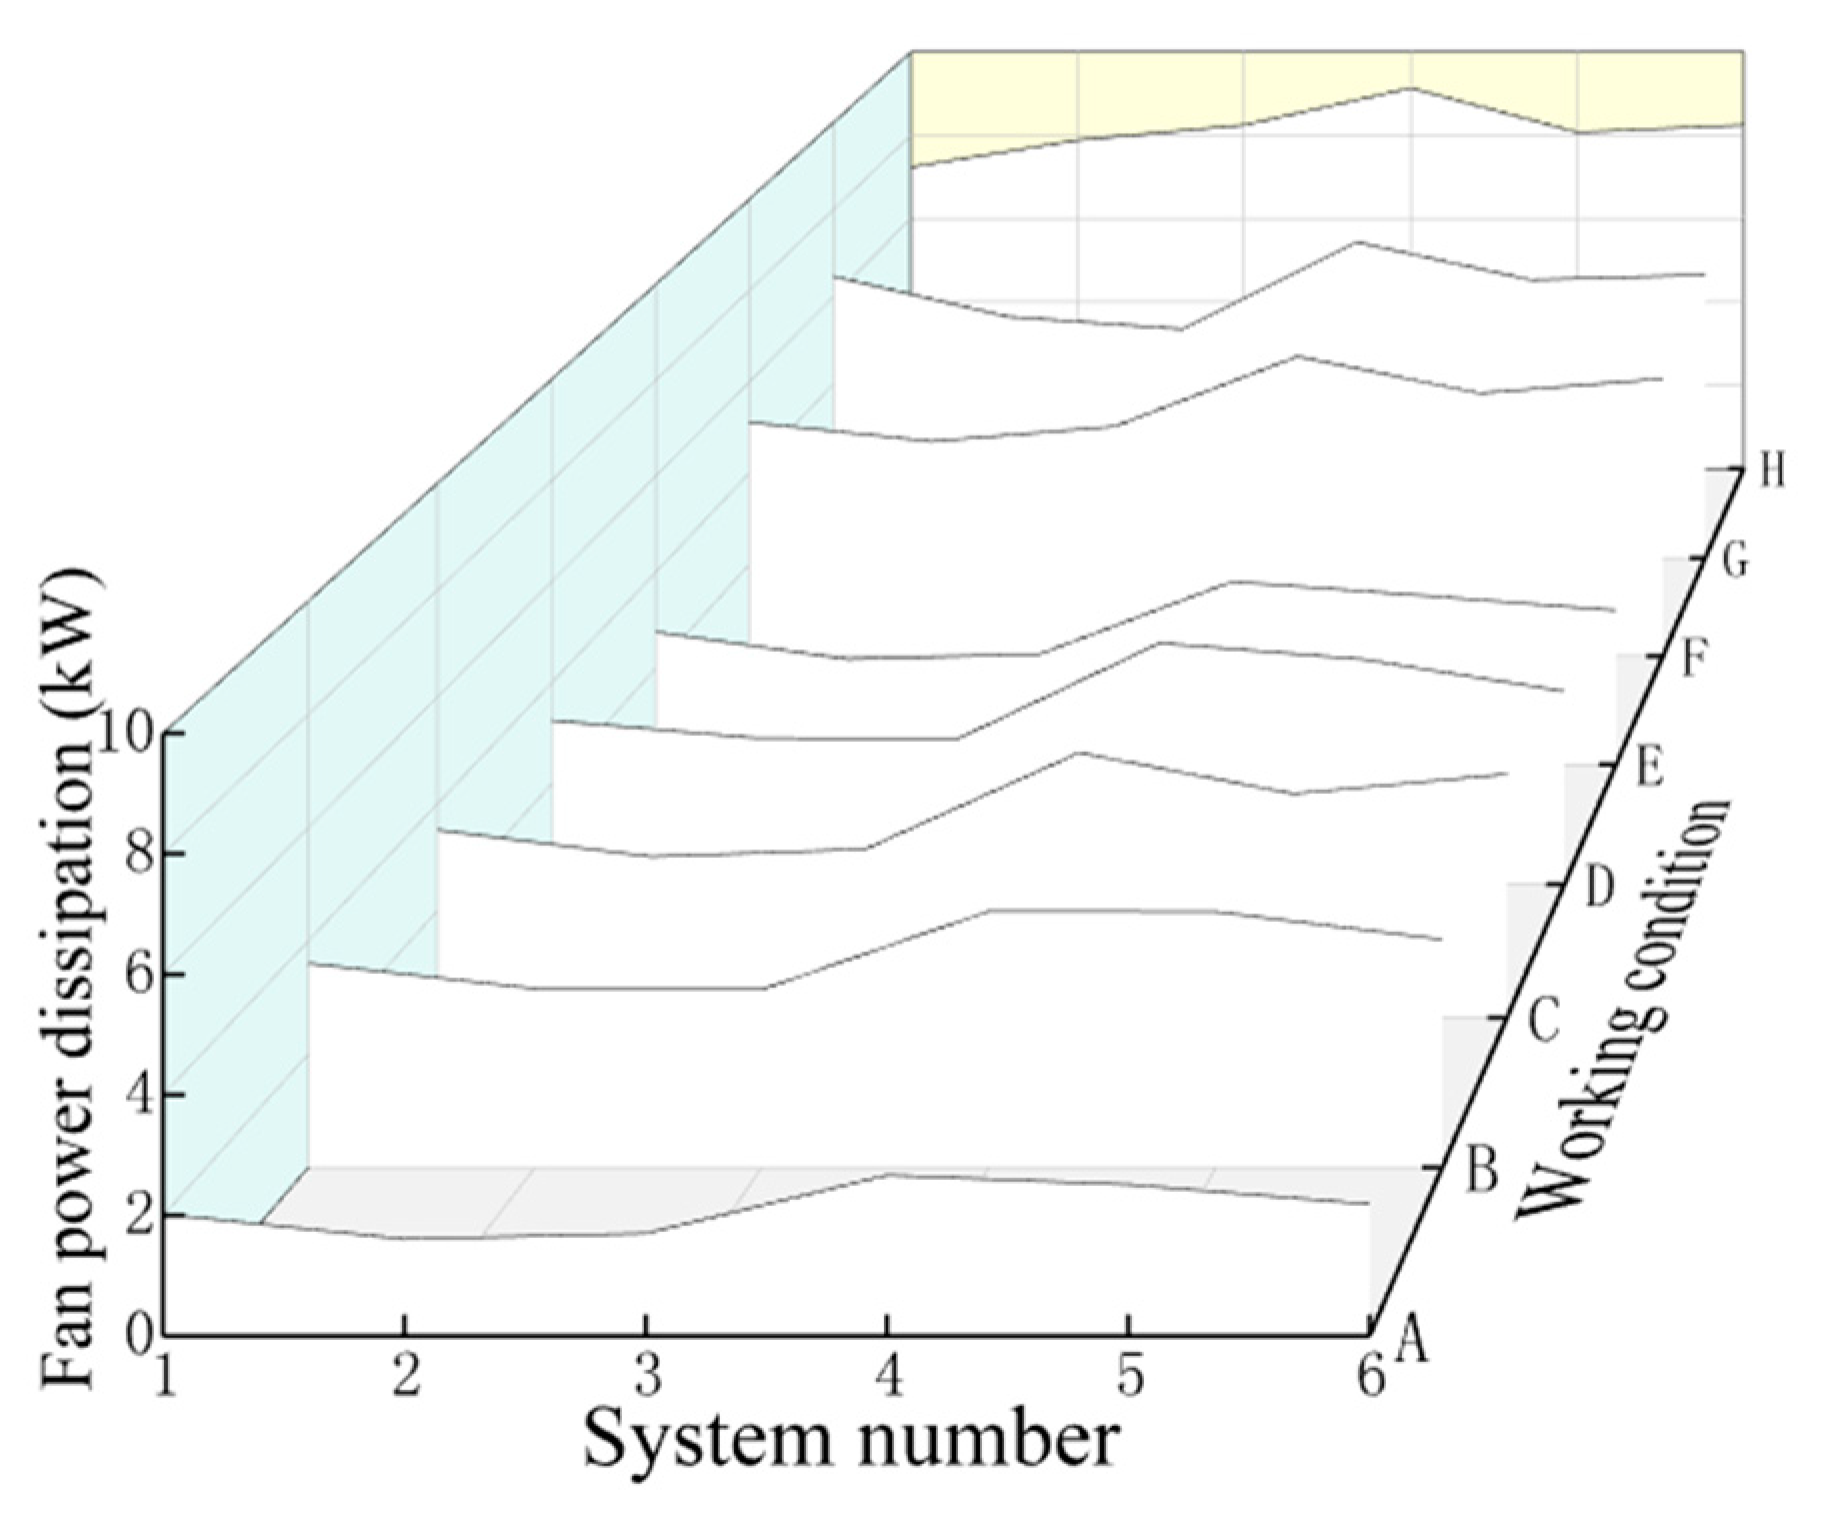
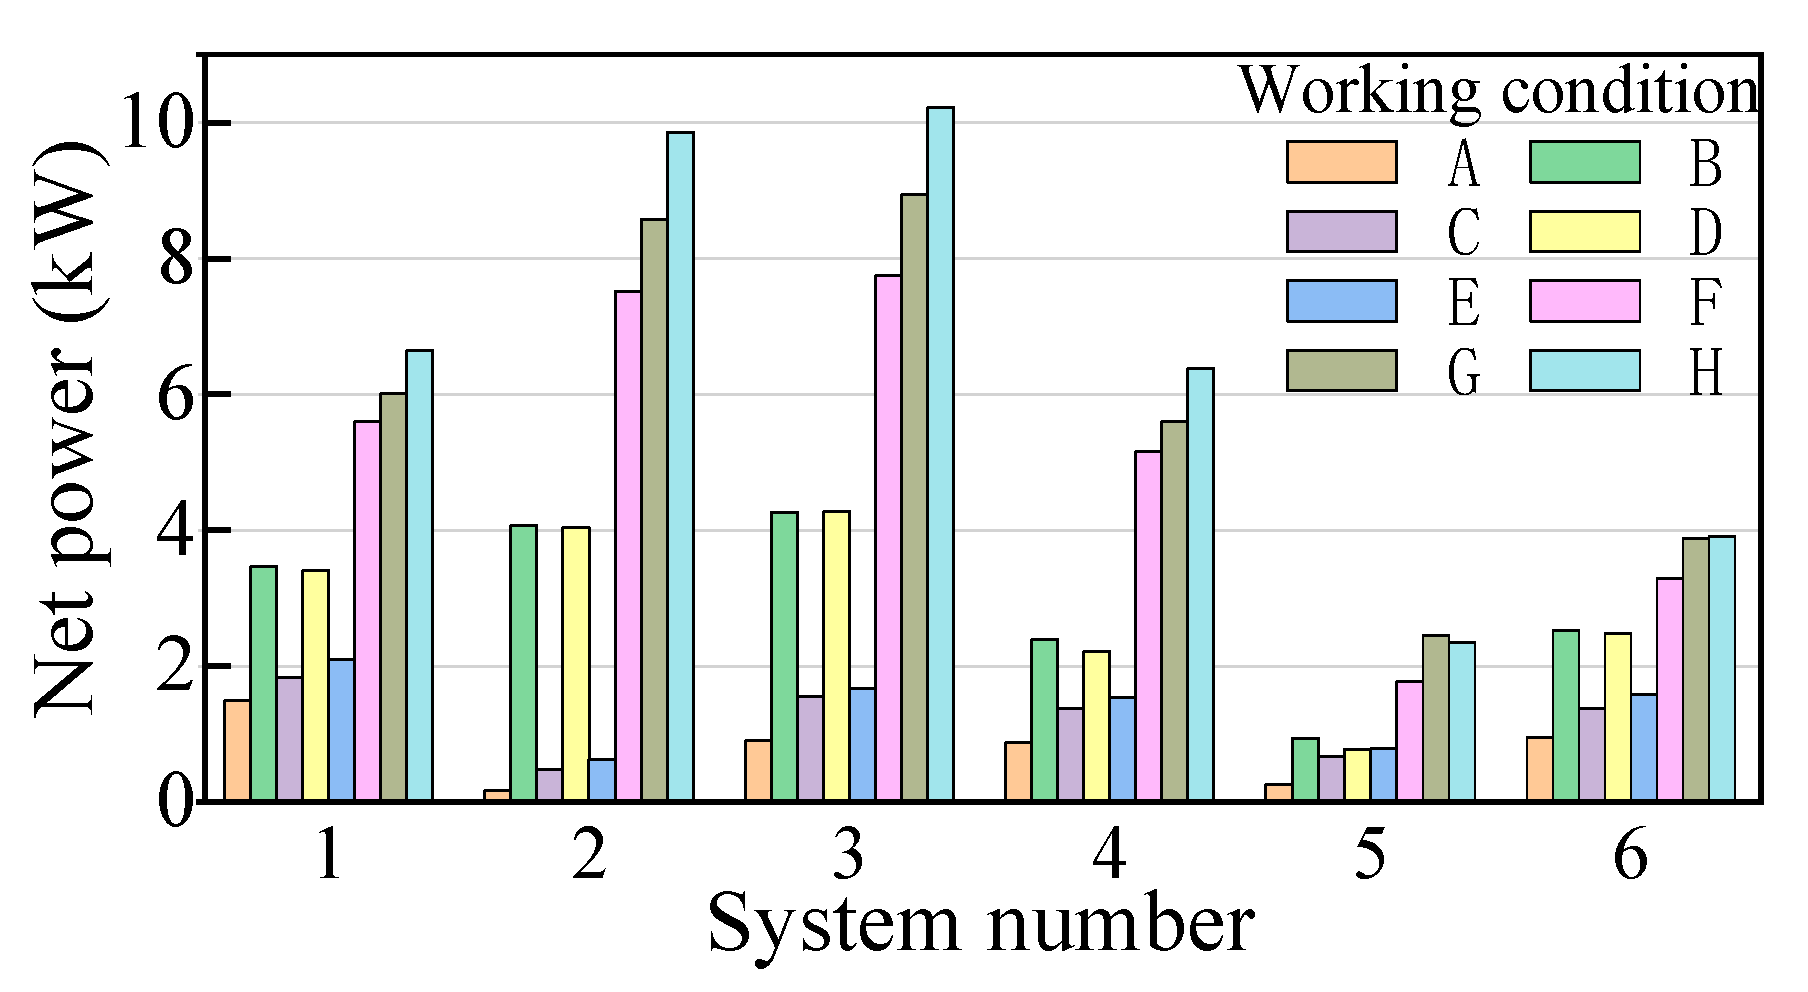
Figure 16 show respectively that when the environment temperature of 15 °C, under the optimal utilization rate of the coolant, net output power, fan consumption power and net power of system 1 to 6 under eight kinds of working conditions A–H (in the net power diagram, working conditions 1–8 correspond to working conditions A–H, respectively).
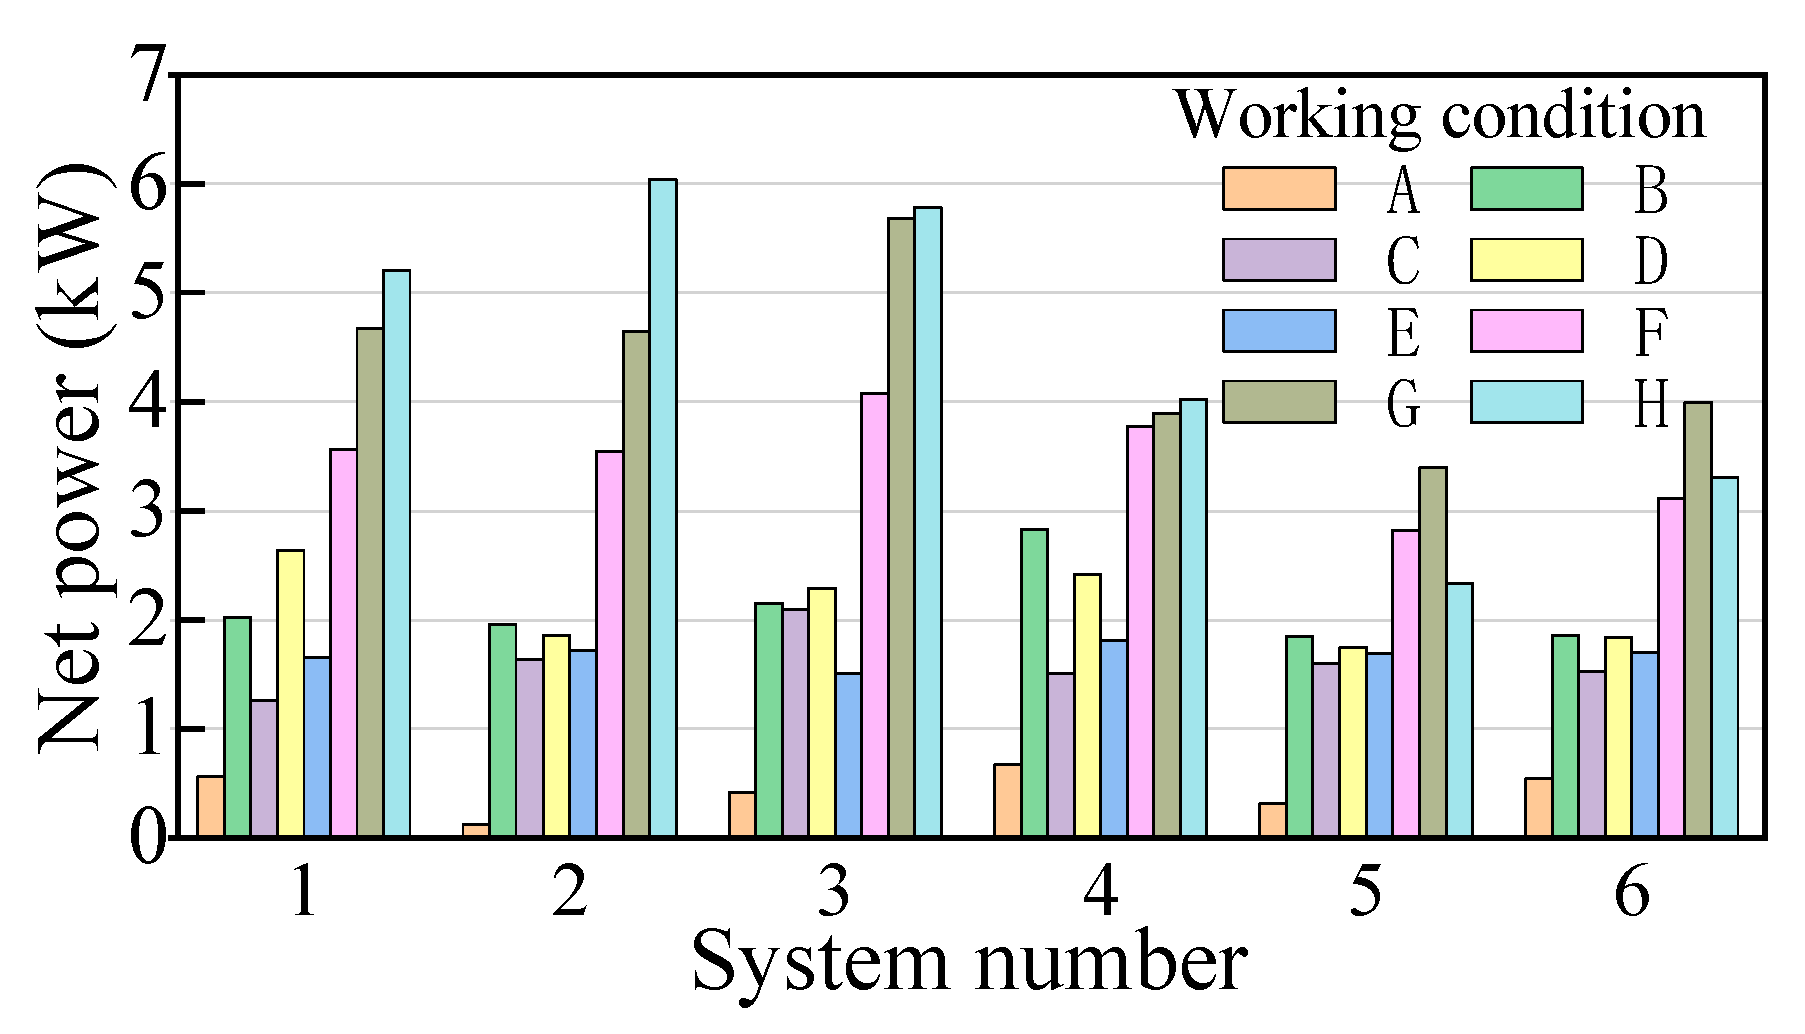
As can be seen from
Figure 14, when the diesel engine load is high, systems 2 and 3 have larger net output power compared with other systems. This is because the working fluid in system 2 undergoes secondary condensation before compression, and the working fluid temperature is lower, which is not only easy to compress, but also has a higher specific heat value, and a better heat absorption effect on low-temperature coolant. After the working fluid is heated by the regenerator, it has a high degree of thermal compatibility with high temperature flue gas and a high heat utilization rate.
As can be seen from
Figure 15 and
Figure 16, systems 5 and 6 have great disadvantages in terms of net output power and fan power consumption. The intermediate compressors of these two systems compress the mixed working fluid. The purpose of this form is to increase the pressure difference of the waste heat recovery system while maintaining the air conditioning system pressure in the optimal range. However, the intermediate compressors compress more working fluid in the main road, consume more power than the working fluid pumps, and reduce the net output power of the system. In addition, CO
2 in system 5 is compressed immediately by the intermediate compressor for secondary compression, with poor compressibility and high working fluid temperature, which reduces the heat absorption efficiency of coolant. Therefore, the vehicle thermal management system is not suitable for the use of three compressors for multi-stage compression.
The difference between system 4 and other systems is that the air conditioning compressor and the working fluid pump are shared. The use of an air conditioning compressor is reduced under the condition of maintaining the normal pressure of the air conditioning system. The pressure of the subsystem can be adjusted without consuming huge compression work. However, the waste heat recovery system still cannot work under the optimal pressure, and the net output power is lower than system 2 and system 3. The structure of system 1 is the simplest, but there are problems such as low pressure difference between high pressure and low pressure of waste heat recovery subsystem and poor power capacity of expander.
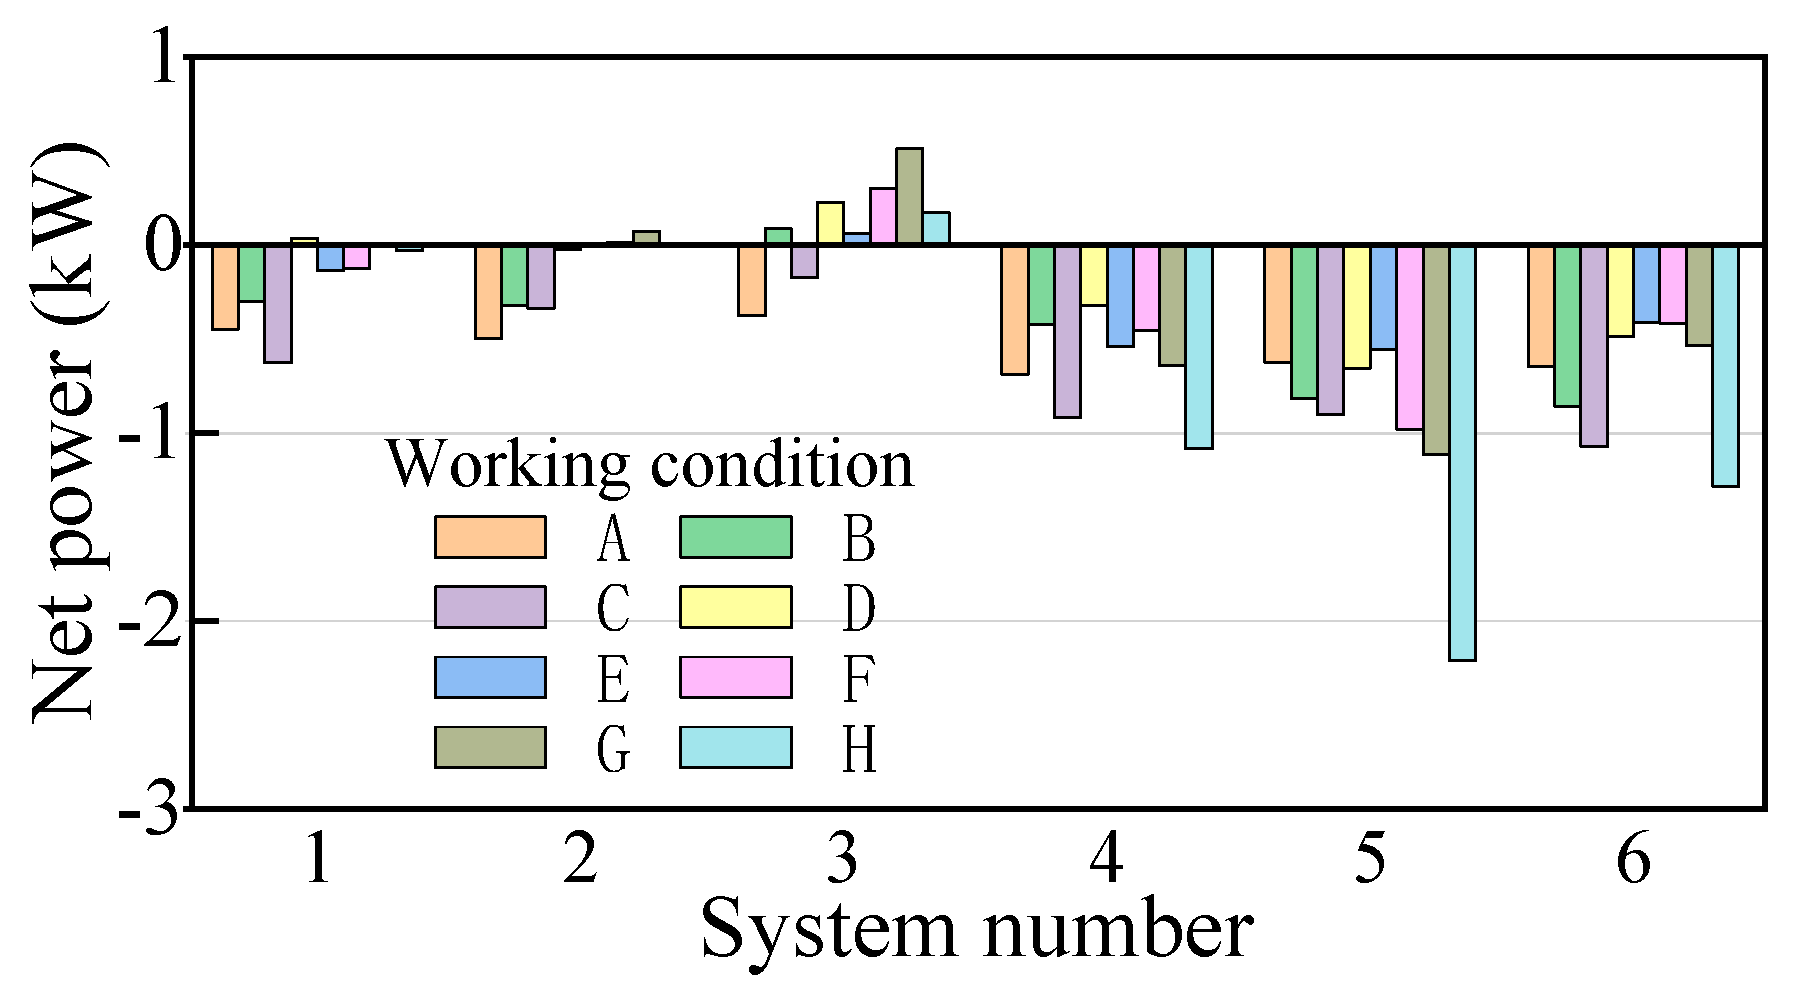
Under the environment temperatures of 25 °C and 35 °C, the net powers of six systems under various working conditions are shown in
Figure 17 and
Figure 18. As can be seen, with the increase of environmental temperature, the deterioration of cooling conditions, the increase of fan power consumption, and the net power of each system is significantly reduced compared with
Figure 16.
System 5 uses secondary condensing components, and the net output power is basically unchanged with the change of environmental temperature. However, the increase of condensing load and the increase of fan power consumption is not suitable for the use in high temperature environment. System 4 reduces the use of air conditioning compressors, resulting in excessive fan power consumption and uneconomic performance. In the case of vehicle use, air conditioning compressor and waste heat recovery should not be considered to share the working fluid pump. System 6 has the maximum fan power consumption and the minimum net output power at all working conditions and environmental temperatures, indicating that the vehicle system is not suitable for the use of complex thermal management system.
It can be seen by comparing systems 1, 2 and 3 with
Figure 14,
Figure 15,
Figure 16,
Figure 17 and
Figure 18, that system 1 is more suitable for recycling coolant waste heat under small working conditions, system 2 is more suitable for flue gas waste heat recycling for large working systems, and system 3 makes more balanced use of flue gas and coolant. System 2 has the highest requirement for cooling temperature, and is greatly affected by the environmental temperature, while system 1 is less affected by the environmental temperature.
4.3. System Performance under Actual Conditions
Considering that each system is suitable for different working conditions, this paper analyzes the performance according to the actual working conditions of vehicles.
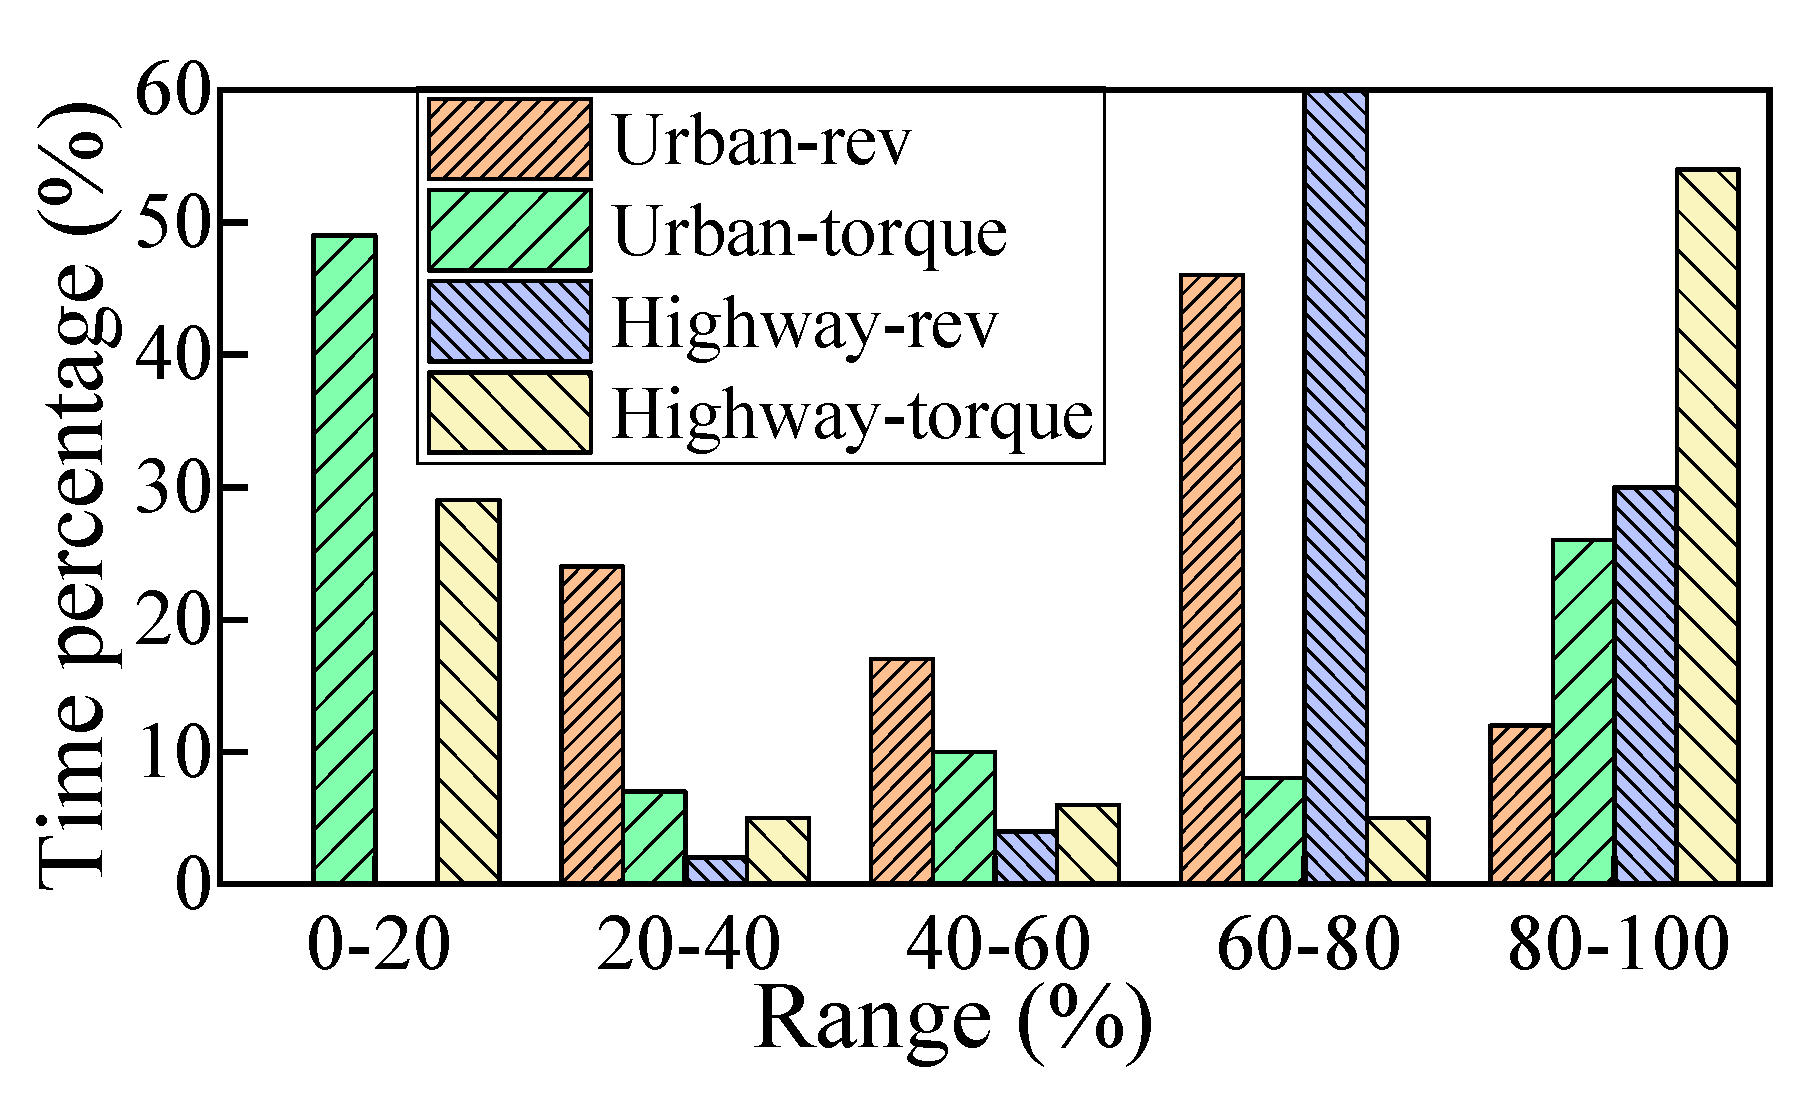
Figure 19 shows that the time percentage of engine speed and torque in different ranges when the vehicle is running in cities and highways [
27]. Combined with the net power of three systems under different working conditions, the comprehensive net power of each system under different environmental temperatures under urban and high-speed working conditions can be obtained, as shown in
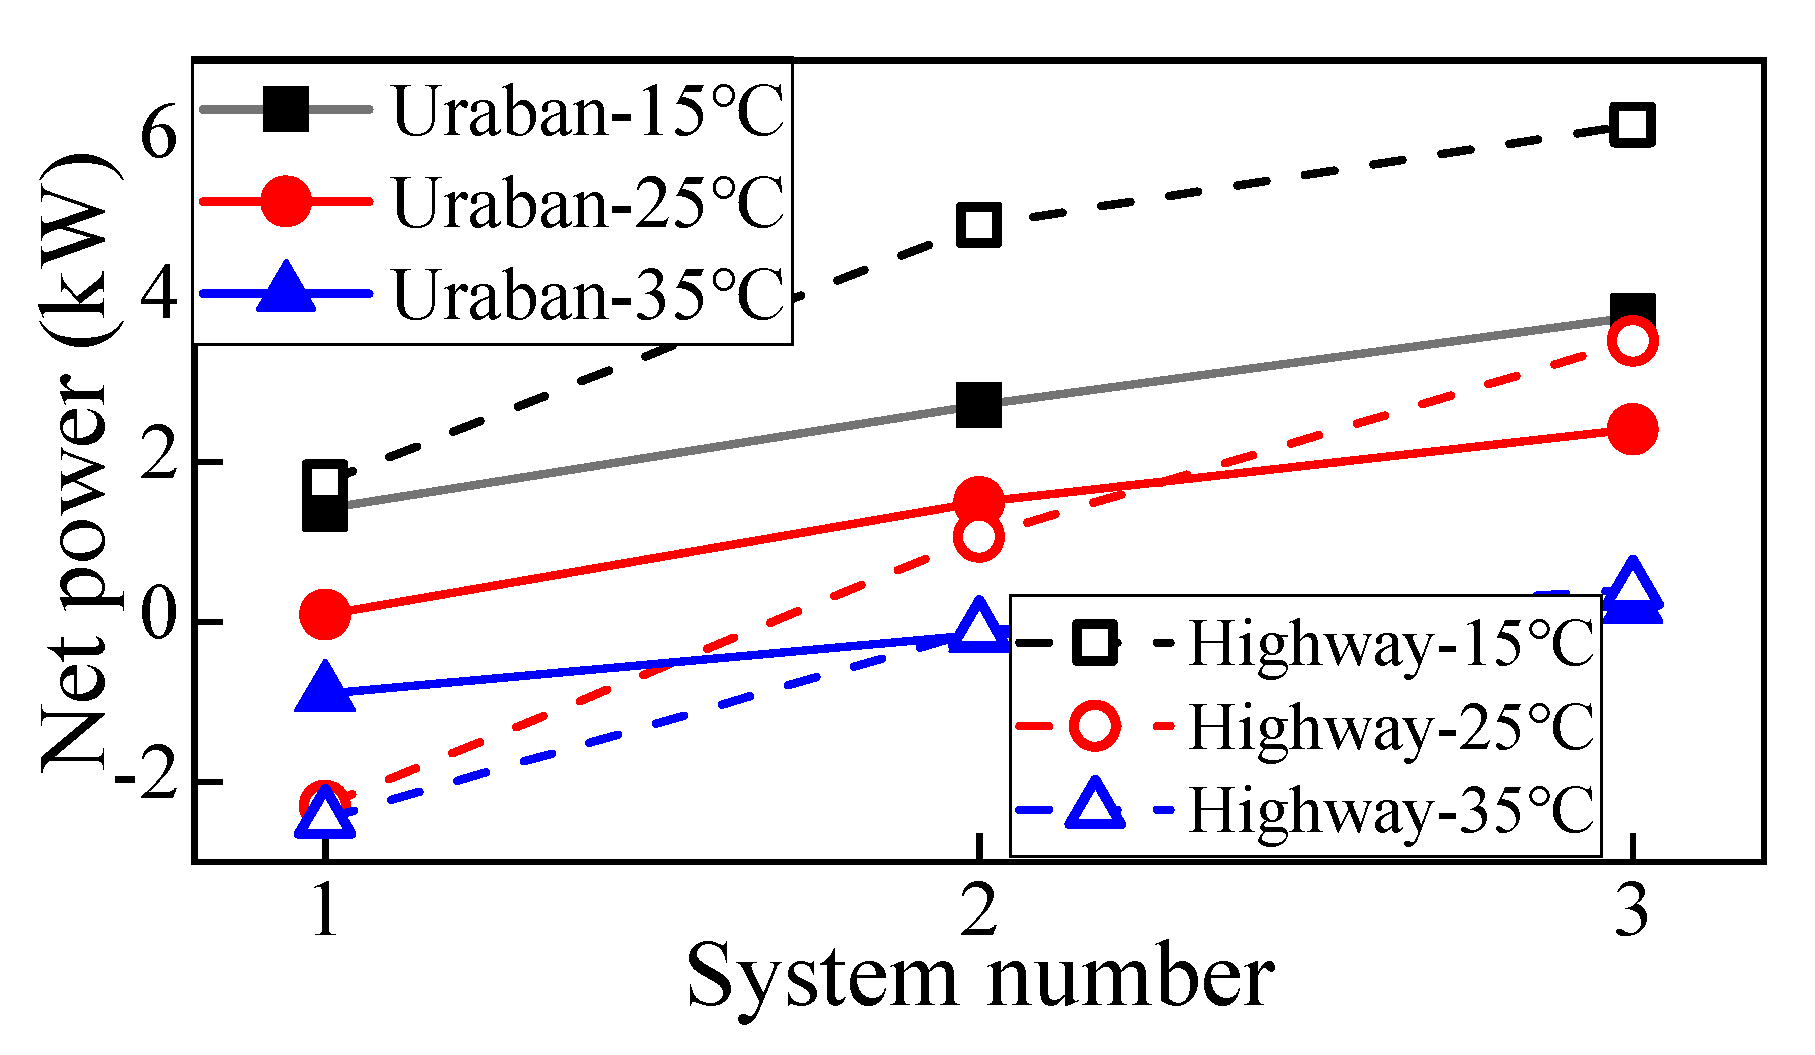
Figure 20. System 3 has a large net power under different working conditions and different environmental temperatures.
Assuming that the vehicle runs evenly throughout the year in the North China region, according to the weather conditions in the region, during the time period for the whole year, the periods that the average temperature is around and below 15 °C account for 58% of the total, the periods when the average temperature is around 25 °C account for 25%, and the periods that the average temperature is around 35 °C account for 17%. Suppose that the mileage and speed of vehicles in cities account for 20% and 80%, respectively. On this basis, the average net power of the engine is 126.7 kW, and the average total combustion heat value is 352.9 kW. If the power consumption of the original fan and other vehicle accessories are not taken into consideration, the equivalent net power of the co-cooling secondary compression secondary cooling system proposed in this paper can reach 10.8 kW, and the fuel economy can be effectively improved by 3.1%. Considering the power consumption of the vehicle accessories, the net power of the system is 4.2 kW, which can improve the fuel economy by 1.2%.
5. Conclusions
(1) Under actual working conditions, there is a certain working fluid pump speed and system pressure that maximize the net power of the system. The optimal working fluid pump speed increases with the increase of environmental temperature and the decrease of engine load, and the net power of the system decreases with the increase of environmental temperature.
(2) The overall system has the maximum net power when the coolant utilization rate is between 38% and 52%, and the optimal utilization rate decreases with the increase of environmental temperature and diesel load.
(3) The components of the vehicle thermal management system will affect each other, so multi-stage compression should not be used. Although the system with simple structure is simple, its dynamic performance may be poor, so it should be considered comprehensively in the design process.
(4) The co-cooling secondary compression secondary cooling thermal management system proposed and optimized in this paper has a relatively simple structure. Considering the working performance of vehicles under actual conditions, the equivalent net power of the system can reach 10.8kw, and the equivalent fuel economy can be improved by 3.1%.
Author Contributions
All authors have worked on this manuscript together and all authors have read and approved the final manuscript. Conceptualization, G.S., C.H. and H.T.; Data curation, C.H. and X.L.; Formal analysis, C.H. and Z.Y.; Funding acquisition, G.S. and H.T.; Investigation, C.H. and X.L.; Methodology, C.H. and X.L.; Resources, G.S. and H.T.; Software, C.H.; Writing—original draft, C.H.; Writing—review & editing, C.H. and M.W.
Funding
This research was funded by [National Key R&D Program of China] grant number [2017YFE0102800]. And The APC was funded by [National Key R&D Program of China (2017YFE0102800)].
Conflicts of Interest
The authors declare no conflict of interest.
Abbreviations
| Nu, Pr, Re | Nusselt number, Prandtl number, Reynolds number, respectively |
| di | Internal diameter of pipe (m) |
| α | Thermal diffusion coefficient (m2/s) |
| η | Isentropic efficiency of components |
| μ | Coefficient of kinetic viscosity (Pa∙s) |
| ν | Kinematic coefficient of viscosity (m2/s) |
| Subscript | |
| c, p | Air conditioning cycle, waste heat recovery cycle respectively |
| comp, gc, gh | Compressor, gas cooler, gas heater respectively |
| prep, r, p, t | Preheater, regenerator, pump, turbine respectively |
| f | Working fluid of waste heat recovery cycle |
References
- Wang, T.; Zhang, Y.; Zhang, J.; Peng, Z.; Shu, G. Comparisons of system benefits and thermo-economics for exhaust energy recovery applied on a heavy-duty diesel engine and a light-duty vehicle gasoline engine. Energy Convers. Manag. 2014, 84, 97–107. [Google Scholar] [CrossRef]
- Benato, A.; Macor, A. Biogas engine waste heat recovery using organic Rankine cycle. Energies 2017, 10, 327. [Google Scholar] [CrossRef]
- Han, Z.; Du, Y.; Wand, Z. Medium selection of organic Rankine cycle (ORC) in low temperature waste heat. Chem. Ind. Eng. Prog. 2014, 33, 2279–2285. [Google Scholar]
- Morgan, R.; Dong, G.; Panesar, A. A comparative study between a Rankine cycle and a novel intra-cycle based waste heat recovery concepts applied to an internal combustion engine. App. Energy 2016, 174, 108–117. [Google Scholar] [CrossRef]
- Yao, B.; Yang, F.; Zhang, H.; Wang, E.; Yang, K. Analyzing the performance of a dual loop organic rankine cycle system for waste heat recovery of a heavy-duty compressed natural gas engine. Energies 2014, 7, 7794–7815. [Google Scholar] [CrossRef]
- Kim, H.J.; Kim, C.J. A numerical analysis for the cooling module related to automobile air-conditioning system. Appl. Eng. 2008, 28, 1896–1905. [Google Scholar] [CrossRef]
- Chaney, L.; Chidambaram, K.; Abbi, S.; Anderson, Y. Fuel savings and emission reductions from next-generation mobile air conditioning technology in India: Preprint. Chem. Pap. Slovak Acad. Sci. 2007, 63, 15–25. [Google Scholar]
- Bharathan, D.; Farrington, R. An overview of vehicle test and analysis from NREL’s A/C fuel use reduction research. Indian J. Pathol. Microbiol. 2007, 21, 434. [Google Scholar]
- Chen, Y.; Lundqvist, P.; Platell, P. Theoretical research of carbon dioxide power cycle application in automobile industry to reduce vehicle’s fuel consumption. Appl. Therm. Eng. 2005, 25, 2041–2053. [Google Scholar] [CrossRef]
- Fleming, D.; Holschuh, T.; Conboy, T. Scaling Considerations for a Multi-Megawatt Class Supercritical CO2 Brayton Cycle and Commercialization. Available online: https://prod-ng.sandia.gov/techlib-noauth/access-control.cgi/2013/139106.pdf (accessed on 26 March 2019).
- Usman, M.; Imran, M.; Yang, Y. Impact of organic Rankine cycle system installation on light duty vehicle considering both positive and negative aspects. Energy Convers. Manag. 2016, 112, 382–394. [Google Scholar] [CrossRef]
- Shu, G.; Shi, L.; Tian, H. ConFigure urations selection maps of CO2-based transcritical Rankine cycle (CTRC) for thermal energy management of engine waste heat. Appl. Energy 2017, 186, 423–435. [Google Scholar] [CrossRef]
- Sarkar, J. Review and future trends of supercritical CO2 Rankine cycle for low-grade heat conversion. Renew. Sustain. Energy Rev. 2015, 48, 434–451. [Google Scholar] [CrossRef]
- Feher, E. The supercritical thermodynamic power cycle. Energy Convers. 1967, 8, 85–90. [Google Scholar] [CrossRef]
- Chacartegui, R.; Escalona, J.; Sánchez, D. Alternative cycles based on carbon dioxide for central receiver solar power plants. Appl. Therm. Eng. 2011, 31, 872–879. [Google Scholar] [CrossRef]
- Ahn, Y.; Bae, S.; Kim, M. Review of supercritical CO2 power cycle technology and current status of research and development. Nucl. Eng. Technol. 2015, 47, 647–661. [Google Scholar] [CrossRef]
- Choi, W.; Moon, H.; Kim, B. A Novel EGR System to Improve Engine Performance of A Diesel Engine. Available online: https://www.researchgate.net/publication/290579554_A_novel_EGR_system_to_improve_engine_performance_of_a_diesel_engine/stats (accessed on 26 March 2019).
- Wang, T.; Wagner, J. Advanced automotive thermal management—Nonlinear radiator fan matrix control. Control Eng. Pract. 2015, 41, 113–123. [Google Scholar] [CrossRef]
- Di Battista, D.; Cipollone, R. Improving engine oil warm up through waste heat recovery. Energies 2018, 11, 10. [Google Scholar] [CrossRef]
- Khaled, M.; Mangi, F.; El, H. Fan air flow analysis and heat transfer enhancement of vehicle underhood cooling system—Towards a new control approach for fuel consumption reduction. Appl. Energy 2012, 91, 439–450. [Google Scholar] [CrossRef]
- Chang, Y.J.; Hsu, K.C.; Lin, Y.T.; Wang, C.C. A generalized friction correlation for louver fin geometry. Heat Mass Transf. 2000, 43, 2237–2243. [Google Scholar] [CrossRef]
- Shi, L.; Shu, G.; Tian, H. Ideal point design and operation of CO2-based transcritical Rankine cycle (CTRC) system based on high utilization of engine’s waste heats. Energies 2017, 10, 1692. [Google Scholar] [CrossRef]
- Pioro, I.L.; Khartabil, H.F.; Duffey, R.B. Heat transfer to supercritical fluids flowing in channels-empirical correlations (survey). Nucl. Eng. Des. 2004, 230, 69–91. [Google Scholar] [CrossRef]
- Yu, W.; France, D.; Wambsganss, M. Two-phase pressure drop, boiling heat transfer, and critical heat flux to water in a small-diameter horizontal tube. Int. J. Multiph. Flow 2002, 28, 927–941. [Google Scholar] [CrossRef]
- Han, S.; Choi, Y.; Shin, J. Turbulent heat transfer of supercritical carbon dioxide in square cross-sectional duct flow. J. Mech. Sci. Technol. 2008, 22, 2563–2577. [Google Scholar] [CrossRef]
- Cavallini, A.; Zilio, C. Carbon dioxide as a natural refrigerant. Int. J. Low-Carbon Technol. 2007, 2, 225–249. [Google Scholar] [CrossRef]
- Zhang, J.; Xu, Z.; Lin, J.; Lin, Z.; Wang, J.; Xu, T. Thermal characteristics investigation of the internal combustion engine cooling-combustion system using thermal boundary dynamic coupling method and experimental verification. Energies 2018, 11, 2127. [Google Scholar] [CrossRef]
Figure 1.
Schematic diagram of the thermal management system.
Figure 1.
Schematic diagram of the thermal management system.
Figure 2.
Schematic diagram of the air conditioning system.
Figure 2.
Schematic diagram of the air conditioning system.
Figure 3.
Experimental diesel engine and waste heat recovery system.
Figure 3.
Experimental diesel engine and waste heat recovery system.
Figure 4.
Schematic diagram of the waste heat recovery system.
Figure 4.
Schematic diagram of the waste heat recovery system.
Figure 5.
Changes of net power of the system with pump speed.
Figure 5.
Changes of net power of the system with pump speed.
Figure 6.
Changes of system net power with coolant utilization rate under conditions A, D, G.
Figure 6.
Changes of system net power with coolant utilization rate under conditions A, D, G.
Figure 7.
Under 15 °C, 25 °C and 35 °C system power changes with the utilization rate of coolant under F working condition.
Figure 7.
Under 15 °C, 25 °C and 35 °C system power changes with the utilization rate of coolant under F working condition.
Figure 8.
Co-cooling single compression system.
Figure 8.
Co-cooling single compression system.
Figure 9.
Co-cooling secondary cooling system.
Figure 9.
Co-cooling secondary cooling system.
Figure 10.
Co-cooling secondary compression secondary cooling system.
Figure 10.
Co-cooling secondary compression secondary cooling system.
Figure 11.
Co-cooling and co-compressing system.
Figure 11.
Co-cooling and co-compressing system.
Figure 12.
Co-cooling co-compressing secondary compression system.
Figure 12.
Co-cooling co-compressing secondary compression system.
Figure 13.
Co-compressing co-cooling secondary compression system.
Figure 13.
Co-compressing co-cooling secondary compression system.
Figure 14.
Under 15 °C net output power of each system under different working conditions.
Figure 14.
Under 15 °C net output power of each system under different working conditions.
Figure 15.
Under 15 °C total fan power consumption of each system under different working conditions.
Figure 15.
Under 15 °C total fan power consumption of each system under different working conditions.
Figure 16.
Under 15 °C net power of each system under different working conditions.
Figure 16.
Under 15 °C net power of each system under different working conditions.
Figure 17.
Net power of each system under 25 °C.
Figure 17.
Net power of each system under 25 °C.
Figure 18.
Net power of each system under 35 °C.
Figure 18.
Net power of each system under 35 °C.
Figure 19.
Time percentage of each speed and torque of vehicles under urban and expressway conditions.
Figure 19.
Time percentage of each speed and torque of vehicles under urban and expressway conditions.
Figure 20.
Net power of systems under urban and expressway conditions at different environmental temperatures.
Figure 20.
Net power of systems under urban and expressway conditions at different environmental temperatures.
Table 1.
Main parameters of rated condition of the diesel engine.
Table 1.
Main parameters of rated condition of the diesel engine.
| Parameter | Unit | Value |
|---|
| Fuel type | - | Diesel |
| Displacement | L | 8.424 |
| Compression ratio | - | 17.5 |
| Rated power | kW | 243 |
| Rated speed | rpm | 2200 |
| Maximum torque | N∙m | 1280 |
| Exhaust temperature after turbine | °C | 503 |
| Extraction flow | kg/h | 1106 |
Table 2.
Measuring instruments and accuracy of the main parameters.
Table 2.
Measuring instruments and accuracy of the main parameters.
| Parameter | Sensor | Scale | Accuracy |
|---|
| Temperature | | | |
| Exhaust side | sheathed thermocouple sensors with first-class precision | −60–650 °C | ±1% |
| Other places | sheathed Pt100 thermo-resistive type with A-class precision | −200–500 °C | ±0.15% |
| Pressure | | | |
| High pressure side of CO2 | pressure transmitters | 0–14 MPa | ±0.065% |
| Low pressure side of CO2 | pressure transmitters | 0–12 MPa | ±0.065% |
| Exhaust side | pressure transmitters | 0–0.5MPa | ±0.065% |
| Cooling water side | pressure transmitters | 0–0.5MPa | ±0.065% |
| Flow rate | | | |
| CO2 side | Coriolis mass flowmeter | 0–1080 kg/h | ±0.2% |
| Air intake of engine | air flow meter | 0–1350 kg/h | ±0.5% |
| Fuel consumption | fuel consumption meter | 5–2000 kg/h | ±0.8% |
| Cooling water side | turbine flowmeter | 0–12 m3/h | ±1% |
Table 3.
Errors between GT-Power model and experiment data.
Table 3.
Errors between GT-Power model and experiment data.
| State Point | Temperature (Experiment) (°C) | Temperature (Model) (°C) | Error (%) | Pressure (Experiment) (MPa) | Pressure (Model) (MPa) | Error (%) |
|---|
| 1 | 34.9 | 35.8 | 2.5 | 9.99 | 10.1 | 1.3 |
| 2 | 71.0 | 72.2 | 1.7 | 9.90 | 10 | 1.2 |
| 3 | 144 | 142 | 1.4 | 9.85 | 9.54 | 3.1 |
| 4 | 267 | 265 | 0.7 | 9.81 | 9.93 | 1.2 |
| 5 | 200 | 204 | 2.0 | 6.73 | 6.86 | 2.0 |
| 6 | 90.8 | 88.3 | 2.7 | 6.64 | 6.54 | 1.5 |
| 7 | 26.1 | 27 | 3.6 | 6.59 | 6.44 | 2.3 |
Table 4.
Structure of some components and errors of GT-Power model.
Table 4.
Structure of some components and errors of GT-Power model.
| Component | Structure | Error (%) |
|---|
| Gas Cooler | 5-rows 7-passes finned tube | 0.9 |
| Evaporator | 2-rows 4-passes finned tube | 1.2 |
| IHX | 12-pipes 6-passes tube and shell | 1.5 |
| Condenser | 6-rows 2-passes finned tube | 1.8 |
| Pump | Piston pump | 2.2 |
Table 5.
Performance of diesel engine under various working conditions.
Table 5.
Performance of diesel engine under various working conditions.
| Working Condition Number | A | B | C | D | E | F | G | H |
|---|
| Total energy of combustion (KW) | 191 | 322 | 242 | 391 | 277 | 460 | 592 | 609 |
| Output power (kW) | 69 | 138 | 104 | 173 | 121 | 200 | 243 | 241 |
| Speed (rpm) | 1100 | 1100 | 1300 | 1300 | 1500 | 1500 | 1900 | 2200 |
| Torque (N·m) | 603 | 1201 | 763 | 1270 | 770 | 1280 | 1227 | 1048 |
| Load (%) | 50 | 100 | 60 | 100 | 60 | 100 | 100 | 100 |
| Fuel consumption rate (g/kW/h) | 217 | 198 | 198 | 192 | 195 | 195 | 206 | 214 |
| Exhaust gas temperature (°C) | 465 | 533 | 406 | 469 | 371 | 453 | 486 | 462 |
| Energy of exhaust gas (kW) | 47 | 73 | 51 | 85 | 57 | 101 | 140 | 149 |
| Energy of coolant (kW) | 83 | 103 | 104 | 101 | 93 | 122 | 127 | 159 |
Table 6.
Power consumption of the original machine at various environmental temperatures.
Table 6.
Power consumption of the original machine at various environmental temperatures.
| Working Condition | A | B | C | D | E | F | G | H |
|---|
| Environment Temperature (°C) | Output Power (kW) | 69 | 138 | 104 | 173 | 121 | 200 | 243 | 241 |
|---|
| 15 | Total power consumed by accessories (kW) | 2.2 | 3.4 | 3.4 | 3.2 | 2.8 | 4.8 | 5.3 | 8.9 |
| 15 | 3.4 | 4.9 | 5.0 | 4.7 | 4.1 | 6.8 | 7.4 | 12. |
| 35 | 4.5 | 6.2 | 6.3 | 6.0 | 5.3 | 8.4 | 9.1 | 14. |
© 2019 by the authors. Licensee MDPI, Basel, Switzerland. This article is an open access article distributed under the terms and conditions of the Creative Commons Attribution (CC BY) license (http://creativecommons.org/licenses/by/4.0/).


