1. Introduction
The need for increasing turbine performance and efficiency has motivated the study of flow fields in turbomachinery. It is of great significance to figure out the complicated mechanism of the unsteady three-dimensional flow in inter-stage, which may improve the performance, promote the efficiency and reliability and even reduce the fuel consumption [
1]. Flow structures in a turbine inter-stage mainly contain the secondary flow and purge flow. A detailed understanding of the complex flow field influenced by guide vane, rotor blade and purge flow is necessary. However, CFD (Computational Fluid Dynamics) simulations of the complex flow in the annulus are expensive and time consuming [
2]. Experimental investigations of the secondary flow and purge flow interaction in the inter-stage offer realistic and intuitional results of the flow filed.
In early study, Phadke et al. [
3] investigated influences of nonaxisymmetric external flow in order to acquire the effect of annulus flow ingress in the rotor-stator rig. Dominy et al. [
4] studied the upstream blade wakes and found the two-dimensional wakes extending from hub to the casing. Patinios et al. [
5] modeled main annulus flow experimentally on a highly versatile, 1.5-stage axial-turbine research facility. The ingress stream tubes in main annulus were described by Cho et al. [
6] and Mear et al. [
7]. Guida et al. [
8] studied the secondary flow structures in inter-stage within a cavity by pressure probes. Their results demonstrated the effects on the flow path near wall due to the behavior of cavity-main flow interaction. Gaetani et al. [
9] studied the hot streak injection with respect to the stator blade. Measurements conducted upstream and downstream of the stage showed a severe attenuation of the streaks within the stator cascade and an enhancement of the rotor secondary flows by the streaks.
Green et al. [
10] concluded that the rotor blades may affect the external flow downstream of vanes to be more axisymmetric. The results showed that the inclusion of the blades caused a reduction in ingress rather than an increase. Their rig was adapted from that used by Chew et al. [
11] with the addition of 32 rotor blades. Bhavnani et al. [
12] verified the model established by Bayley et al. [
13] and drew the conclusion that rotor rotating effect and seal clearance between rotor and stator would affect turbine sealing.
Phadke et al. [
14] studied the rim seal geometries of a rotating-disk system and found the purge flow was forced by the rotor boundary layer and threw radially outward to preserve the angular momentum. This phenomenon was called the disk pumping effect [
15,
16]. Purge flow used to seal the rotor-stator cavity could adequately prevent hot main flow from invading the disk cavity and overheating the rotating components. Purge flow affects the development of the boundary layer at the turbine hub with significant effects on secondary flow structures. McLean et al. [
17] investigated the injection effect of purge flow on the aerodynamic performance in a turbine, which found that velocity profile modification was related to the purge flow. Schrewe et al. [
18] performed an efficiency measurement and found an efficiency drop with the increase of rim seal mass flow rate in a two-stage low-pressure turbine. Zerobin et al. [
19,
20] investigated the influence of four individual purge flows on the aerodynamic performance of turbine center frames with a 1.5-stage turbine test setup. Purge flow injection intensified secondary flow structures in main annulus flow and increased pressure fluctuations on the platform.
Due to the complex geometrical structure of the turbine, measurement in the flow field in inter-stage is limited. Traditional measurement techniques, such as hot wire and pressure probe, may introduce additional interference to the original flow field in the narrow space of inter-stage. The laser Doppler velocimetry (LDV) technique, which belongs to a non-contact measurement, is a better choice. Bohn et al. [
21] performed an experiment using an unsteady 2D LDV system to obtain velocity distributions inside the rim seal. Li et al. [
22,
23] employed a LDV system to investigate the influence of the shedding vortex of blade on the flow field around blade.
However LDV is a single point measurement, it is more appropriate to acquire planar information simultaneously during the flow field investigation in the turbine inter-stage. In order to achieve this goal, an instantaneous planar velocimetry technique, the particle image velocimetry (PIV) technique is employed in the investigations of turbine flow field [
24,
25,
26]. Gallier et al. [
27,
28] captured instantaneous velocity fields in the rim seal region between the guide vane and rotor using a PIV system. The results demonstrated a large participatory role of the purge flow in main annulus flow structure and in the secondary flow structure upstream of the blade. Zhou et al. [
29] employed a PIV system to obtain the velocity fields in a single-stage turbine disk cavity. The tangential velocity component in the measurement result was employed to mark the multiple regions of ingress and egress in the disk cavity. Balasubramanian et al. [
30] mapped the instantaneous velocity fields in the seal gap using PIV measurements. The outflow trajectory of purge flow was found to depend on the rim seal geometry, the purge flow and the main flow rate, as well as the circumferential positions within a vane pitch.
PIV measurement generates huge amounts of data. In order to process the massive data, a proper orthogonal decomposition (POD) method is employed [
31]. Lumley [
32] was the first researcher to introduce the POD method for turbulent flow study, which was widely accepted by other researchers. Then Bakewell et al. [
33] utilized POD method to study the boundary layer. Payne et al. [
34] investigated wake flow using POD method. In order to identify coherent structures in the flow field, Lumley [
35] analyzed spatial velocity correlation function in terms of orthogonal decomposition. Coherent structures in the jet mixing layer was investigated by Glauser et al. [
36]. Moin [
37] applied POD method to large eddy simulation data. With the development of PIV, the spatial correlation matrix in POD method becomes too tremendous to solve. To solve the problem, an improved snapshot POD method was proposed by Sirovich [
38] to process the massive experimental data.
Combining the PIV measurement and POD method, Lengani et al. [
39,
40] characterized the dynamics of coherent structures (the generation, propagation and breakdown of coherent structures) on a turbine blade suction side boundary layer. POD method was adopted to filter the instantaneous flow maps allowing a better visualization of the structures involved in the transition process of the boundary layer. El-Adawy et al. [
41] conducted experiments on a four-valve, pent-roof gasoline direct injection (GDI) engine head at different valve lifts using PIV. The POD technique was applied to characterize the flow structures at various valve lifts. Canepa et al. [
42] surveyed the leakage flow in low-speed fans with rotating shroud to explain the noise generation. The periodic large-scale flow structures were obtained from ensemble average results from LDV and PIV. While, non-periodic structures were extracted by POD method. POD method could also be used on CFD data. Guo et al. [
43] analyzed the interrelations among impeller blade geometry, flow field fluctuation intensity and impeller-induced hydrodynamic noise of jet centrifugal pump. A POD method was proposed to reconstruct and predict the unsteady flow field fluctuation intensity and flow-induced noise in impeller region.
In the present study, a further investigation of turbine inter-stage flow structure is necessary, especially with detailed information of the flow field. With the application of PIV technique and POD method, it is possible to achieve the detailed and analytic profiles to the inter-stage flow. However, to the best of the present author’s knowledge, no publication studies the detailed flow structure by PIV in a main annulus of turbine inter-stage with the consideration of the impact of rotor blade and purge flow.
In this paper, a quasi-three dimensional perspective of time-averaged velocity field in the inter-stage and detailed coherent structure in the measurement plane downstream of vane trailing edge are presented and analyzed. Velocity fields in seven meridional measurement planes, circumferentially arranged, are obtained by a 2D PIV system. A phase-locking technique is employed to investigate the impact of rotor blade on the upstream flow field. Time-averaged velocity fields show the flow structures in the inter-stage and evaluate the blade influence and purge flow impact. Coherent structures extracted by POD method reveal the detailed information in the first order mode, which are related to the major flow structure. Analysis of the coherent structures achieves a clear view of the influence factors to the inter-stage flow field. Results in the investigation show detailed flow structure in the turbine inter-stage, which could promote a better understanding of the flow mechanism in the turbine inter-stage and help to improve the design of turbomachinery and the CFD verification.
2. Experimental Apparatus
The experimental investigation is performed on the test section of a research turbine using a PIV measurement system in the National Key Laboratory of Science and Technology on Aero-Engines Aero-thermodynamics of Beihang University.
The experiment system, shown in
Figure 1, is composed of a research turbine, a PIV measurement system, a pressure measurement system, two sets of air source and auxiliary systems, such as the particle spreading device for PIV. Main flow in the turbine annulus is driven by an axial suction fan downstream of the test section, which is controlled by a frequency converter. The purge flow in rotor-stator disk cavity is forced from a delivery pipe connected with a Roots blower. The research turbine is a low-speed turbine [
44] with a maximum rotating speed of 1250 rpm. In this paper, the nondimensional flow rate in main annulus is
(the definition of nondimensional flow rate is according to Phadk et al. [
3]) and the rotational Reynolds number of rotor is
. Two cases in
Table 1 with different purge flow rates, which are a zero purge flow rate and a rate of 9.4% of main annulus flow rate, are discussed in this paper.
A 2D PIV system, developed by MicroVec Incorporation, is employed to measure two velocity components (axial and radial) simultaneously. A double-pulse Nd:YAG (Neodymium-doped Yttrium Aluminium Garnet; Nd:Y
3Al
5O
12) laser generator is used to generate laser light with a maximum repetition rate of 15 Hz. The laser light with a wavelength of 532 nm and a pulse energy of 200 mJ is utilized. The resolution of CCD (Charge-Coupled Device) camera is 2048 × 2048 (4M) pixels. The accuracy and uncertainty of the PIV system could refer to paper [
45,
46]. Micro DEHS (Diisooctyl sebacate, C26H50O4) liquid drops are used as tracer particles, which are spread in the turbine main annulus during the measurement. The liquid drops, which are about 1 μm in diameter, produced by Laskin nozzles in a particle generator, are small enough to track the flow without introducing disturbance and large enough to scatter sufficient light to be captured by the CCD camera. A spreading net located upstream of the turbine inlet broadcasts the liquid drops into the flow uniformly.
Design geometry of the axial research turbine is shown in
Table 2. The casing diameter is 0.5 m and the hub/tip ratio is 0.826.
Figure 2 demonstrates a structural diagram of the turbine in meridian plane and the PIV measurement region in the chordwise plane. A typical turbine stage with axial rim seal configuration and wheel-space is utilized in the research turbine. Measurement region is located above the rim seal gap and between the inlet guide vane row and the rotor blade row. Seven meridional measurement planes downstream of the vane passage exit are arranged circumferentially. The arrangements in a chordwise view downstream of guide vanes are shown in
Figure 2.
3. Measurement Arrangements
The arrangement of equipment and the location of measurement sections are shown in
Figure 3a. The laser light optics is installed above the test section to illuminate a meridional plane in the flow field. A CCD camera is positioned close to the measurement section for image recording. For each measurement plane, 1000 instantaneous velocity fields are acquired in one single shot.
The detailed positions of measurement planes between inlet guide vane row and rotor blade row are presented in
Figure 3b. Measurement planes aligned with IGV, red highlight in
Figure 3b, span a vane passage spacing with an equiangular interval of 3° circumferentially, shown in
Figure 2. Each measurement plane lasts from guide vane row to blade row in axial direction and spans the full height of main annulus in radial. MP7 (measurement plane 7) and MP1 are located downstream of the vane trailing edge (due to periodicity, MP1 also corresponds to MP7). MP4 is located in the middle of the vane passage exit.
The influence of the rotor is taken into consideration and a phase-locking technique is used to capture the flow field at different blade positions for each measurement plane. Five trigger positions from A to E (due to periodicity, position E also corresponds to position A), blue highlight in
Figure 3b, are arranged and aligned with the entrance of blade passage. These positions correspond to five time instants within a blade passing period ΔT: t/ΔT = 0, 0.25, 0.5, 0.75, 1 (from position A to E). Instantaneous images of flow field are captured by PIV at position A, when the rotor blade leading edge is aligned to the measuring plane exactly. Position C is a trigger for the middle of blade passage inlet, which is located circumferentially furthest from the blade leading edge. In order to evaluate the time-averaged blade influence, data on two radial lines are extracted from PIV measurement results. These two lines, in MP7 and MP4 respectively, are located downstream of the seal clearance and in the middle of the rotor platform (x/R = 0.11). In
Figure 3b, two monitor points marked with X are the projections of the two lines on rotor platform.
4. Results and Discussion
Each time-averaged result with axial and radial velocity components of the measurement plane is calculated from 1000 instantaneous results. Velocity fields in different measurement planes are combined together to show a quasi-three dimensional perspective of the inter-stage flow structure. Coherent structures extracted by POD are presented in this section and the influences of rotor blade and purge flow are also discussed.
In the results, and are shown in the measurement plane. stands for the axial component of velocity, which affects the fundamental flow direction in the turbine. The variation of will change the triangle of velocities. is the radial velocity, which is directly related to the heat transfer in the inter-stage, especially on the rotor.
4.1. Inter-Stage Flow Structure
Figure 4 demonstrates the flow structure in Case 1. The research turbine operates with zero purge flow rate. Velocity fields along the rotor rotation, from MP7 to MP1, reveal the flow structure in the measurement region. Rotor blades are not displayed in
Figure 4. Periodic rotor blade influence is averaged in the investigation of the whole flow structure in the inter-stage. The phase-locked measurement results with blade are shown in the next section.
In
Figure 4a,
, the major velocity component, is positive in the measurement planes. The magnitude of
varies with different measurement planes. There are two parts of areas with high positive
in the inter-stage, which are caused by secondary flow. One part is next to the guide vane exit. In this part, areas with high
expand from MP4 to MP1 gradually. The other part is close to the rotor blade, which shrinks from MP7 to MP4. Considering the periodicity, these two parts could join together in two adjacent measurement domain (MP4 to MP1+MP7 to MP4). Combination of the areas with high positive
shows a slant ellipsoid structure, like a spindle. MP7 or MP1 is located in the middle of the ellipsoid with maximum area of high positive
. In the inter-stage, the ellipsoid structure lasts from vane passage exit to blade row in axial direction, from the top of the annulus to the bottom in radial and from the middle of the vane passage exit (MP4) to MP4 in the adjacent vane passage exit in circumferential direction.
Areas with lower
(areas colored with green) expand from MP6 to MP4, and then shrink to MP2. Areas with lower
reach maximum scale in MP4. These areas contribute to a deficit domain between the two parts with high
mentioned above. According to the dot dash line in
Figure 3b, the deficit domain represents the influence of wake flow caused by the right guide vane in
Figure 4a. The shape of deficit domain in inter-stage is a small ellipsoid between two big ellipsoids with high
. In MP4, area with high
close to rotor blade side is very small compared to the same area in MP5. It demonstrates that vane wake flow enters into rotor passage from MP4, which is more obvious in MP3.
In
Figure 4b, magnitude of
is smaller than that of
. The maximum of positive
is less than one fourth of
.
shows both positive and negative value in the measurement planes, which is different with all positive in
. The positive
reveals the upward flow in the direction from hub to casing and negative is for downward. Area with negative
is obvious in
Figure 4b. Considering the periodicity, areas with negative
starts from MP2 to MP1, and then develops from MP7 to MP3. This downward migration of negative
reflects the influence of the leakage flow from guide vane. Areas with high positive
are shown in MP6 and MP1, which reveals the outflow from disk cavity on account of disk pumping effect.
Flow structures in axial and radial are different. The axial flow demonstrates alternate ellipsoid structures with high and lower in the inter-stage. The negative shows the scale and trajectory of secondary flow influence. The high positive indicates the location downstream of vane trailing edge for easy egress of purge flow.
4.2. Rotor Blade Influence
In order to investigate the rotor blade impact on the inter-stage flow field, five rotor positions from position A to E are employed by a phase-locking technique in the measurement, shown in
Figure 3b. Results of phase-locked measurement reflect the detailed blade impact on upstream flow field in a blade passing period ΔT. As discussed above, MP7 and MP4 are two representative planes. Data on two radial lines in MP7 and MP4 are extracted and presented in this section.
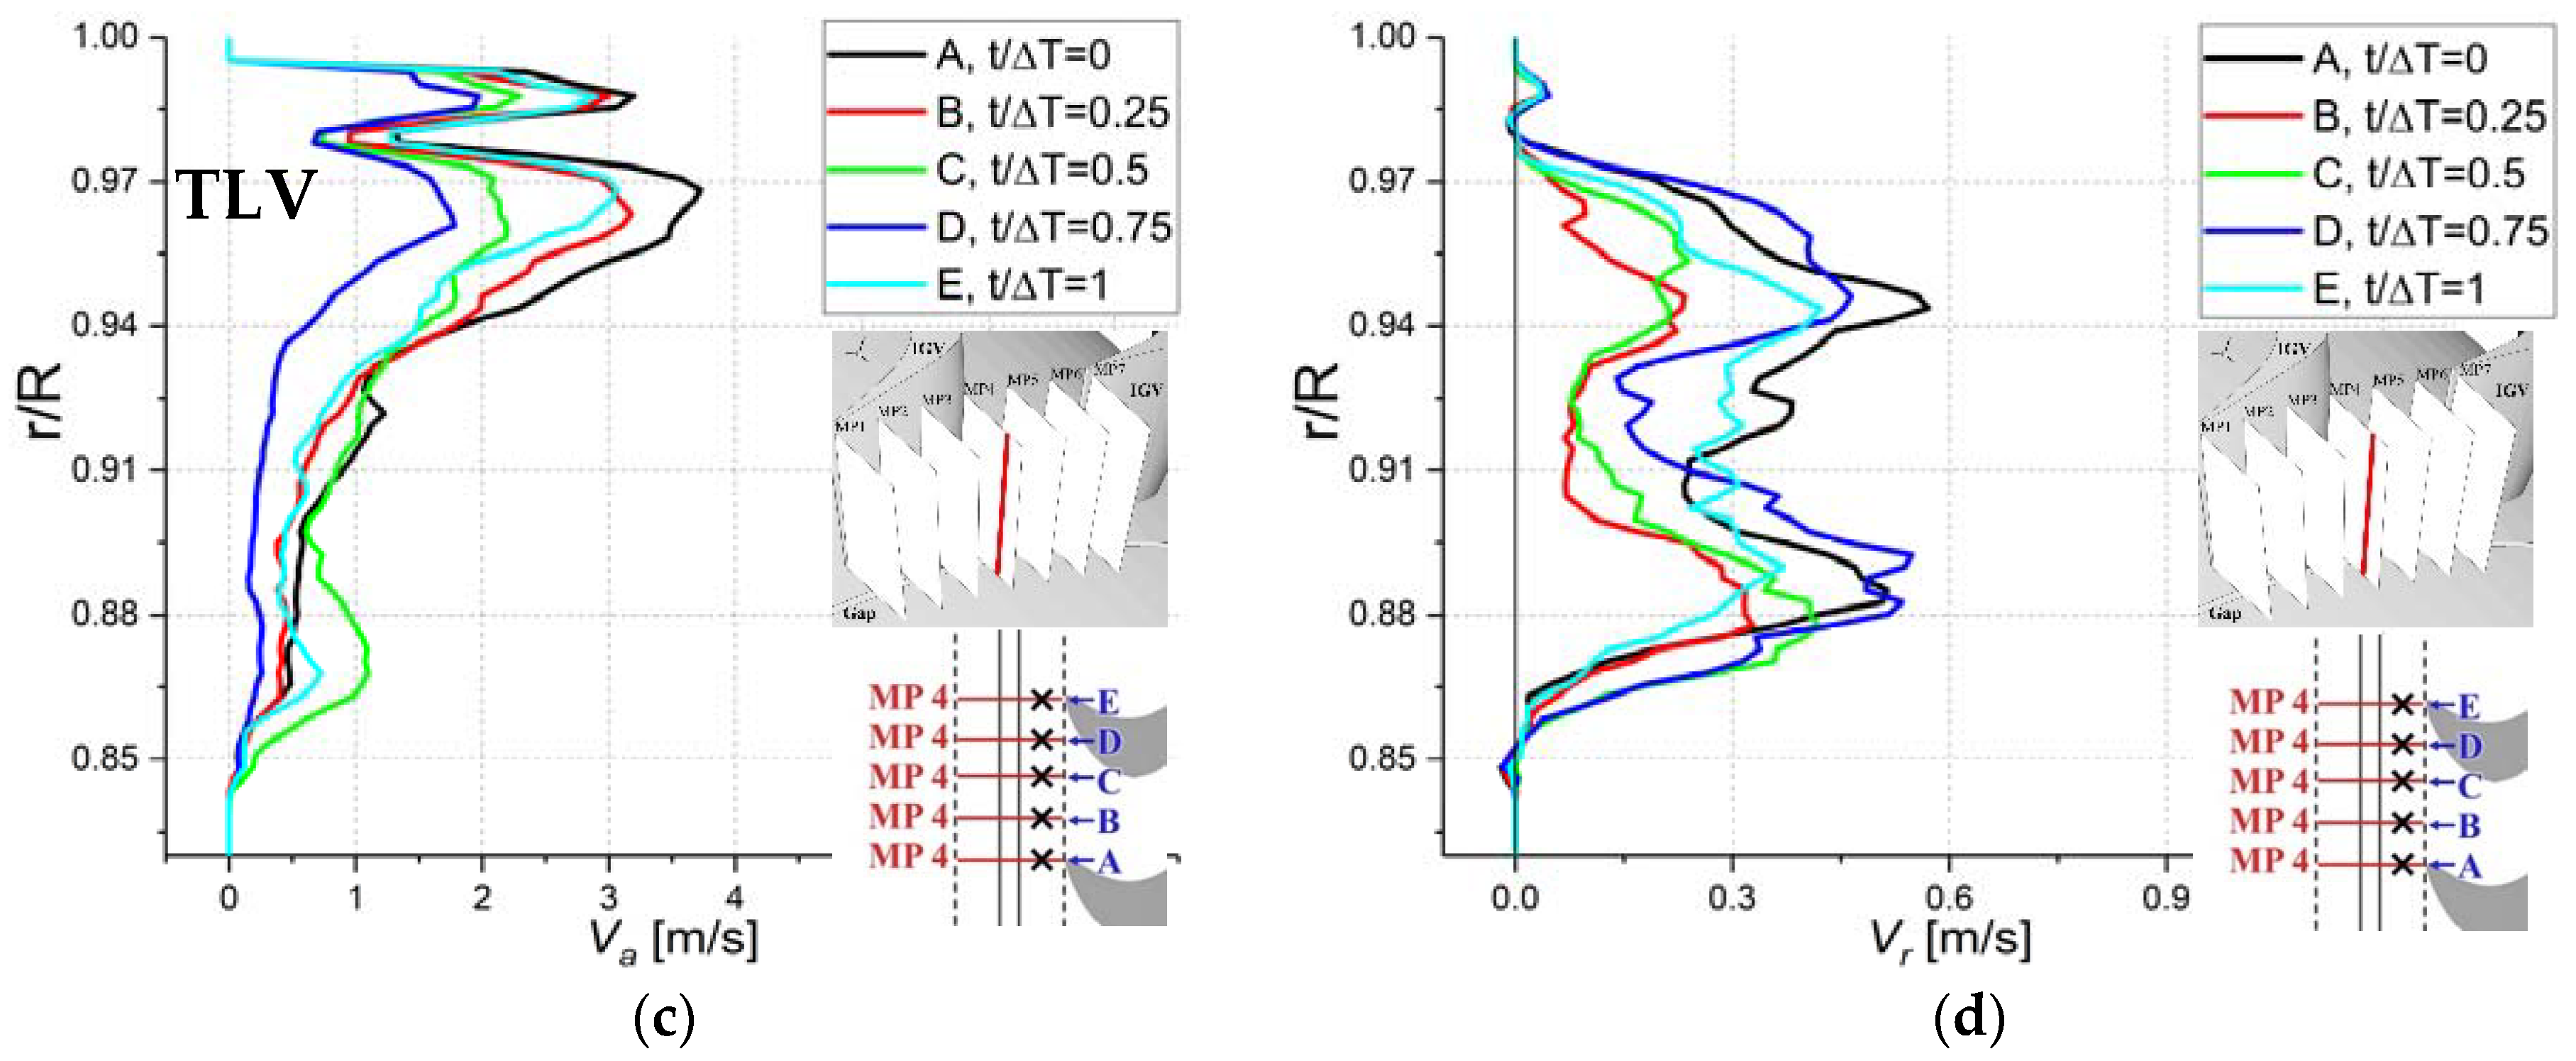
Figure 5 shows the velocity distributions at different rotor positions on these two lines along the annulus height from hub to casing in Case 1 with zero purge flow.
In
Figure 5, distribution of
in MP7 is different from that in MP4. The axial velocity losses are caused by tip leakage vortex (TLV) at r/R = 0.95 in
Figure 5a and at r/R = 0.98 in
Figure 5c. The rotor blade influence mainly acts on the region out of TLV. Influence rules to the inter-stage flow in these two planes are similar. With rotor blade passing by,
increases from position A to position B, then drops to position C and finally reaches position D. Minimum
is at position D (blue line), which is close to the suction side of rotor blade. Maximum
is at position B (red line), which is close to the pressure side of blade.
In the measurement plane, positive
stands for flow migration from hub to casing and negative
is for the opposite. Variations of
are different in two measurement planes. However, an upward migration of fluid is caused after the rotor blade passing by. In
Figure 5b,
at position B & C keeps positive below r/R = 0.95 (out of TLV).
becomes negative at other positions below r/R = 0.9. The fluid in lower half of MP7 moves upward after blade passing by (at position B & C) and turns to downward before the approaching of next blade leading edge (at position D & E/A). The upward flow caused by blade leads to a reduction in main annulus flow ingress [
10] and improves the heat transfer on rotor components. In MP4, the influence is unique at position C. The green line in
Figure 5d moves to the right between r/R = 0.86 & 0.89 (scaled 17% of annulus height). In this range, positive
at position C is largest and negative is smallest compared with other positions. This illustrates that position C promotes the upward migration, which increases the positive
and decreases the negative.
Blade influence focuses on lower-half of the measurement plane and the patterns in axial and radial are different. reaches minimum with blade leading edge approaching (at position D) and increases to maximum after blade passing by (at position B). The general trend of is increasing-decreasing-increasing in a blade passing period ΔT. In radial direction, the upward flow appears after blade passing by, which leads to an increase of positive and a decrease of negative.
4.3. Impact of Purge Flow
In this section, the influence of purge flow is discussed.
Figure 6 shows the combined velocity fields in Case 2 with purge flow rate,
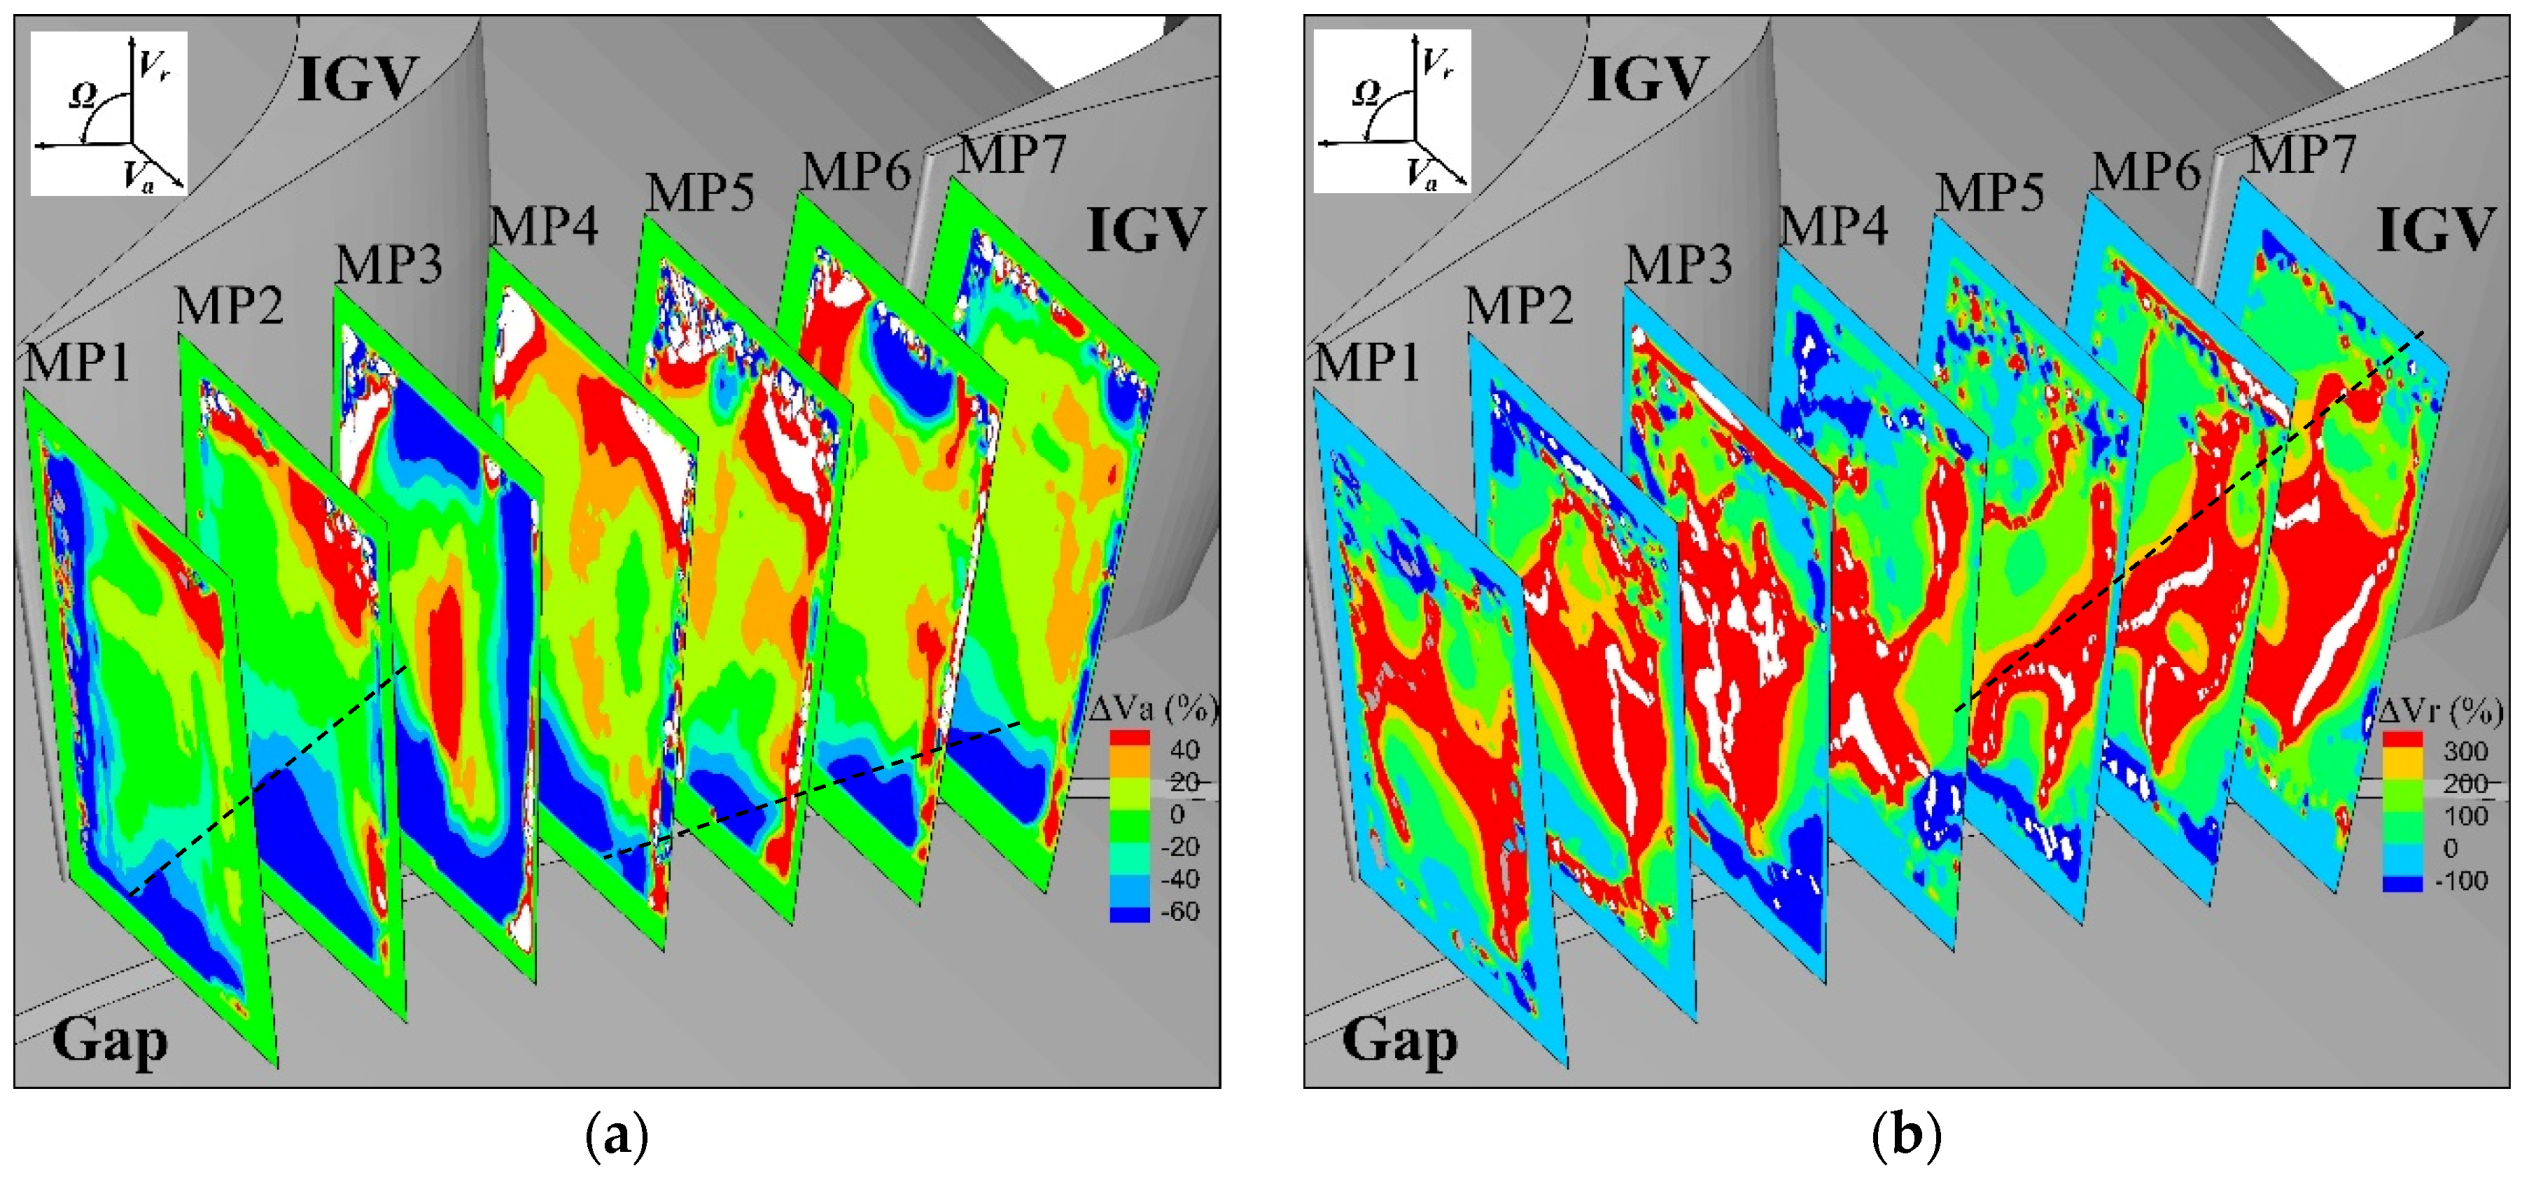
. Compared with Case 1, the variation rate of velocity with purge flow intervention, calculated according to Equation (1), is shown in
Figure 7. The positive rate stands for velocity increase and negative for decrease. White areas in
Figure 7 stand for mathematical invalid data points with zero or an extremely small denominator (approximate to zero) during the calculation.
where
and
are velocities in Case 2 (with purge flow intervention) and in Case 1 (with zero purge flow rate).
Impact of purge flow on main annulus flow structure is shown in
Figure 6. The ellipsoid structure with high
in axial flow structure in
Figure 6a, is affected by purge flow. Areas with high positive
decrease near the hub in each measurement plane. Egress of purge flow blocks the axial flow near the hub. Velocity decrease is reflected in
Figure 7a with negative variation rate (areas colored with blue). Areas near the hub (less than 25% annulus height) show a decrease rate (negative
) over 60%. From MP4 to MP1, areas with high negative
decrease gradually in the circumferential direction, especially on the stator hub. From MP7 to MP5, blue areas located on the rotor hub keep on decreasing. The blockage caused by purge flow moves from the stator hub in MP4 to the rotor hub in MP5 of adjacent vane passage exit.
In
Figure 6b, the radial velocity distribution is completely different with flow field under zero purge flow condition. Areas with positive
are located above the hub in most regions of each measurement plane. The high positive areas in the measurement planes expand gradually from MP4 to MP1 and shrinks from MP7 to MP5. It is easier for purge flow to enter main annulus through the seal clearance at MP7, MP6 and MP5. Due to the secondary flow, outflow from cavity in MP4 is minimum.
In
Figure 7b, positive grow rates are extremely high. Purge flow promotes the fluid migration from hub to casing in the whole measurement domain. From MP7 to MP5, areas with high positive
are located close to the blade side, which is due to the secondary flow influence. The trend line in
Figure 7b shows the dramatic increase from MP7 to MP5 which corresponds to the trend line in
Figure 4b determined by the radial flow structure. Red areas in MP3 and MP2 show high positive values, which is on account of the small denominator from
shown in
Figure 4b.
Figure 8 shows the velocity distribution at different rotor positions in Case 2. In
Figure 8a, the
loss shown in MP7 corresponds to the same position in
Figure 5a. Intervention of purge flow decreases
below r/R = 0.91, which occupies half annulus height. The rotor blade influence pattern is similar to the pattern at zero purge flow. In MP4,
is almost unaffected by the increase of purge flow rate. The maximum
appears at position A and the minimum is still at position D.
in two measurement planes increases sharply in Case 2. Almost all
are positive on the lines in two measurement planes. Negative
is observed in few points. The maximum
is located at r/R = 0.91 in
Figure 8b, which is in the same position in
. The impact of position A on
is the greatest. Influences caused by other positions show little difference. In
Figure 8d,
increases in full annulus height compared with the distribution in Case 1. The growth in the lower-half of the measurement plane is larger than in the upper-half. However, the magnitude of
is still smaller than in
Figure 8b. The impact of blade positions on
in MP4 is inconspicuous with the purge flow.
Egress of the purge flow decreases the by 60% below 25% annulus height and increases the upward flow migration in the whole measurement domain. Variation of in circumferential direction shows the positions for easy egress of purge flow downstream of vane trailing edge. On monitor lines, decreasing the area of reached 50% annulus height. While, increasing of is throughout the full annulus height.
4.4. Coherent Structures Analysis
Time-averaged velocity field, calculated from instantaneous results, could be considered as a superposition of coherent structures, which could be extracted by the POD method. These coherent structures could be identified as major structures in the flow field.
Instantaneous velocity fields could be treated as an original function. The principle of POD method is to decompose the original function into a sum of orthogonal basis functions
, which are optimal in the least squares sense. (The construction of basis functions could rebuilt the original flow field.) The basis functions
are also called POD modes, which are sorted in a descending order of the eigenvalues
.
represents the kinetic energy contained in the corresponding POD mode. The kinetic energy in each POD mode is unique. This property is treated as a characteristic to identify the structures with different levels of energy in the velocity field. Lower-order modes are related to the coherent structures (large-scale flow structures), especially the first order POD mode. While, higher-order modes contain random structures (small-scale structures). The principle equations of POD method are listed in the
Appendix and detailed principles could also refer to paper [
47,
48].
In the following sections, coherent structure in the first order POD mode is extracted, which is the major structure in the inter-stage flow field. Analysis to the first order mode could reflect the characteristic of detailed energy dominated structure in the flow field, which is cover by higher-order modes in the time-averaged flow field.
The contribution of the first order POD mode to the total energy in the measurement plane is normalized by energy fraction,
/
. Fraction variation among different measurement planes is reflected in
Figure 9. Energy fractions of
and
in MP7 are largest in all measurement planes. Coherent structure in MP7 is less affected by the small-scaled random structures.
4.4.1. First Order POD Mode vs. Time-Averaged Velocity Field
Figure 10 shows the normalized POD eigenvalues
of the top 20 order POD modes of MP7 in Case 1. The bars reflect the contribution of each POD mode to the total kinetic energy of the flow field. The 1st-order mode of
and
contains 84.2% and 22.6% of the total energy, which are much larger than other higher-order modes respectively. Coherent structure in the first order mode represents the main flow structure with maximum kinetic energy in the measurement plane. Energy fraction of
in first order mode is three times over
, which explains a less turbulent flow in axial direction and a higher velocity fluctuation in radial.
Coherent structure contained in the first order POD mode reveals the detail of main flow structure, which is covered in the time-averaged velocity field by adding higher-order modes with turbulence.
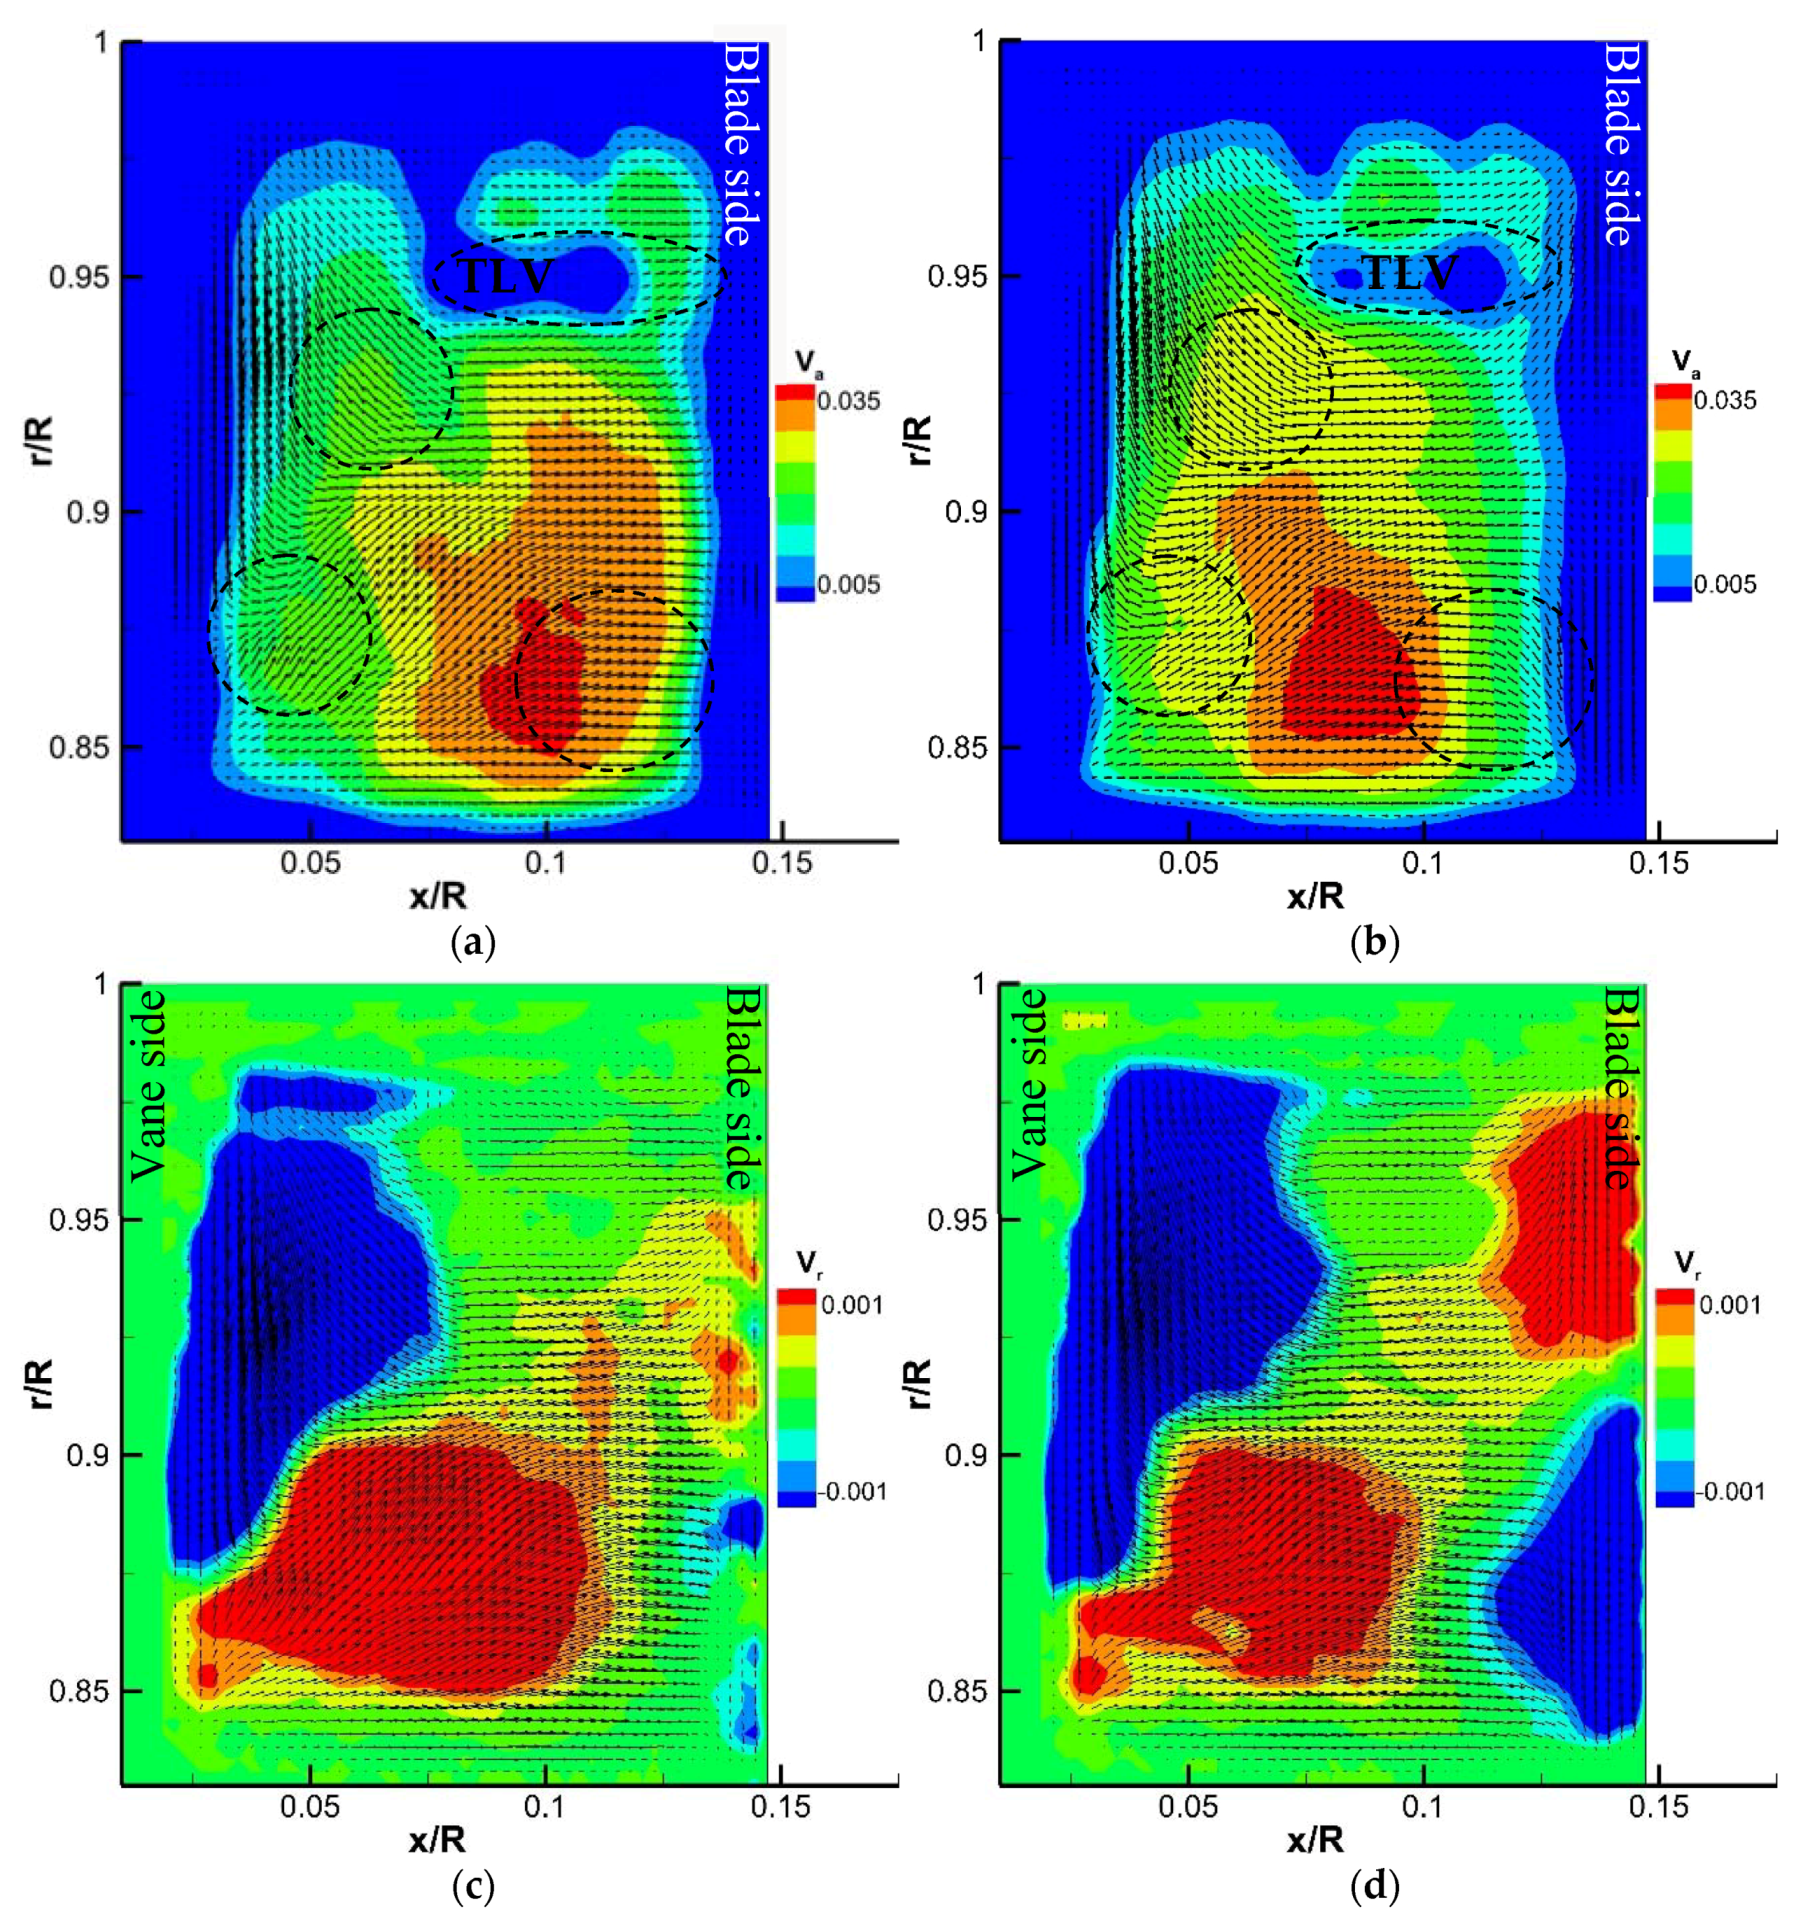
Figure 11 shows the vector field of MP7 with vorticity contour plots. The comparison in the vector map between the first order POD mode (
Figure 11a) and time-averaged velocity field (
Figure 11b) shows four different areas. Area α & β show the secondary flow influence extended from guide vane passage. Area γ is the outflow from the rotor-stator cavity caused by disk pumping effect. Area δ is due to the rotor blade passing, which leads to the obvious radial migration upstream of the blade. These four coherent structures are recognized by POD method rather than time-averaging. Differences between two vector maps are on account of the radial component, due to the
with small energy fraction.
Vorticity contour plots in the two subplots of
Figure 11 are similar and could not reflect the structures showing in vector maps. This is also reflected in quantities composed by the velocity components, such as overall velocity and turbulence. The composed quantities could not reveal the detailed coherent structure, which may be ascribed to the large differences between
and
.
4.4.2. First Order POD Mode under Blade Influence
In
Section 4.2, velocity distributions at rotor position B and D are most affected by blade. Energy fraction of first order mode in these two position are much close (0.845 and 0.831 in
, 0.218 and 0.231 in
), which means the blade impact on the flow field is limited. The flow structures in the first order POD mode at these two positions are shown in
Figure 12. Vector fields show the differences in the measurement. However, it is easy to understand in the contour plots of
and
.
In
Figure 12a, the core of area with high
is located around x/R = 0.1 at position B (after the blade leading edge passes). While, the core migrates upstream to x/R = 0.08 at position D (before the blade leading edge approaches). The influence spreads to areas close to the vane side in
Figure 12a. Area affected by TLV moves towards the blade side from position B to D.
In the radial direction, areas with high positive and negative appear at position D and the red area near hub is pressed. The approaching of rotor blade enhances both upward and downward fluid migration in radial and the influence could transmit forwards to x/R = 0.1.
4.4.3. POD Analysis of Purge Flow Impact
Purge flow egress leads to a greater impact in radial than in axial direction. In
Figure 13, intervention of purge flow reduces the energy fraction of
in first order mode and decreases the energy accumulation rate (black line vs green line). On the contrary, energy fraction of
in first order mode increases sharply and the energy accumulation accelerates with purge flow accessing (red line vs blue line).
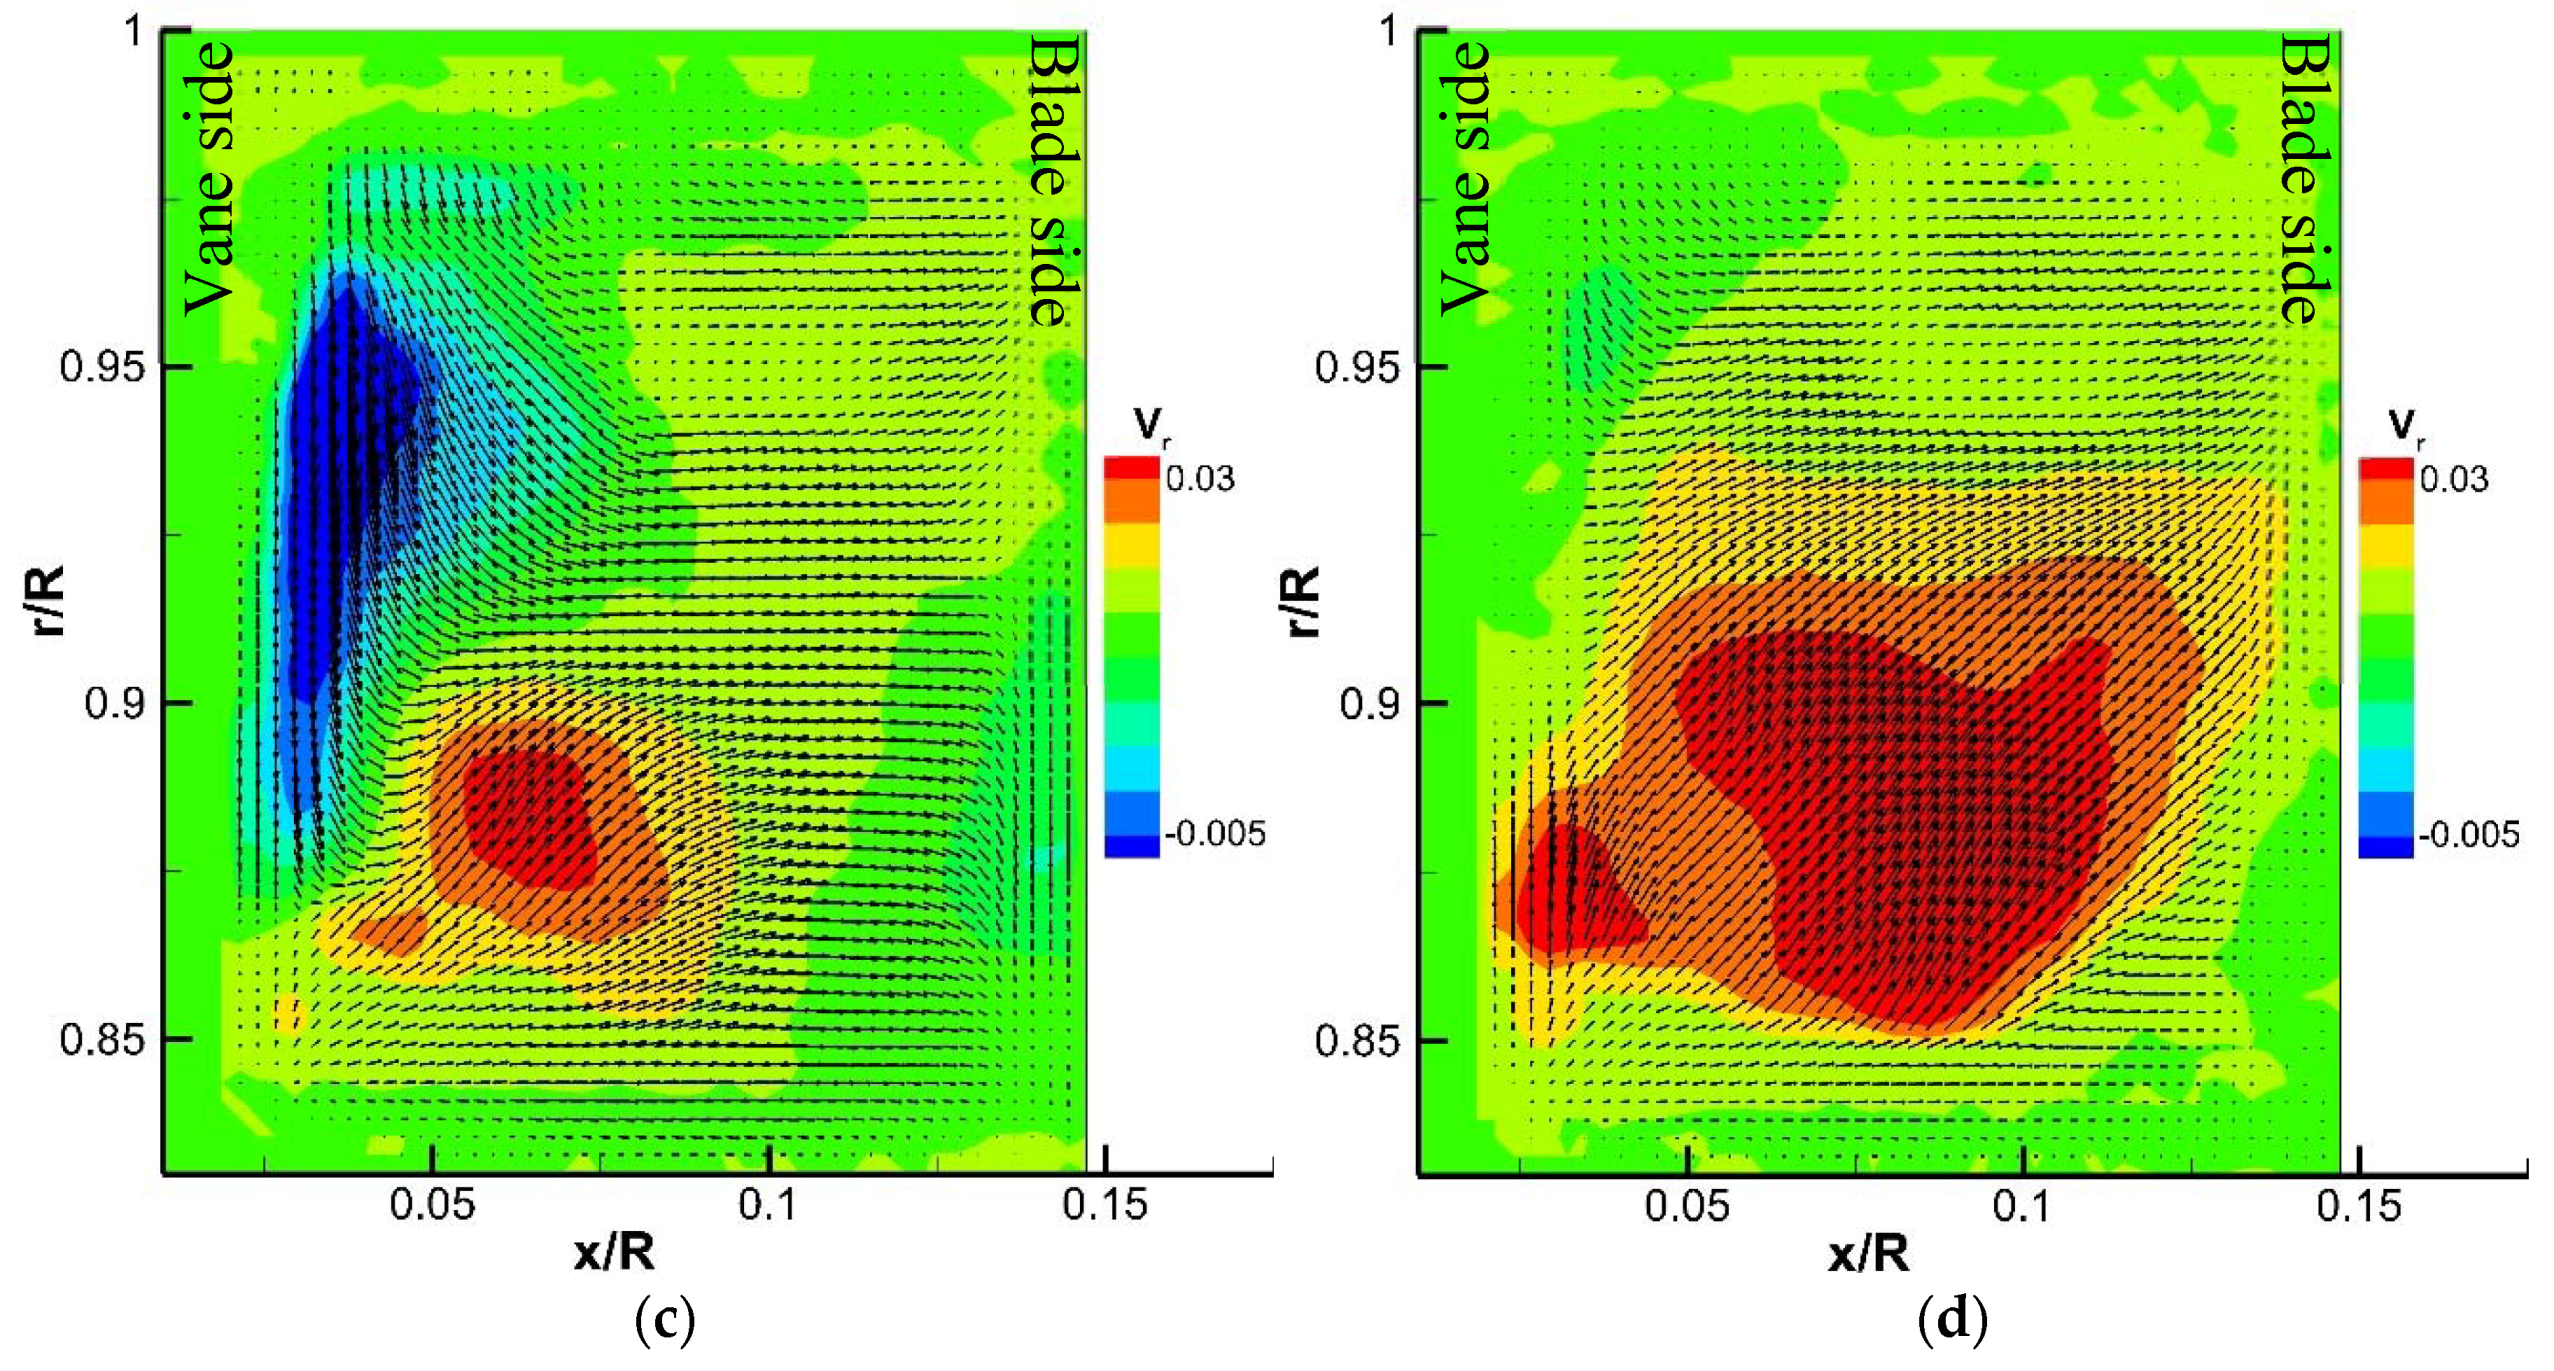
Figure 14 shows the influence of purge flow on the main flow structure. The seal clearance stretches from x/R = 0.065 to 0.081.The whole vector field is affected by the purge flow. The addition of purge flow with extra kinetic energy expands the core of area with high
and lifts the core in radial direction, which results in the area with lower
downstream of the seal gap on rotor platform. Area with lower
caused by TLV is reduced at position D.
The impacts in radial are much more distinct than in axial. Without purge flow in Case 1, downward structure at vane trailing edge and upward structure above hub are shown in
Figure 14c. In Case 2, the area with high positive
occupies almost fully the lower-half measurement plane and negative area is eliminated. Egress of purge flow increases the upward stream. The purge flow impacts are spread not only to the downstream of the seal gap but also to the upstream, which reaches the guide vane trailing edge.
POD method could be employed to evaluate the scale of coherent structure through energy fractions. Coherent structure extracted from the first order mode of MP7 plotted with a vector field shows detailed information in axial and radial, which is different from the contour map plotted with composed quantities. Rotor blade approaching leads to upstream movement of core by Δx/R = 0.02 and intensifies both the upward and downward migration in the radial direction at blade leading edge. Purge flow improves the flow in the whole plane. The impact could reach the vane side upstream and spread full annulus height in radial.
5. Conclusions
This paper conducts an experimental investigation of flow field in a turbine inter-stage. A 2-D PIV with phase-locking technique is employed to provide a quasi-three dimensional perspective of the flow structures. The influences of rotor blade and purge flow are obtained and analyzed by using POD method.
Main flow structure in inter-stage is determined by the secondary flow from guide vane passage. Alternate ellipsoid structures with higher and lower are distributed in the inter-stage. Negative reflects the secondary flow trajectory and positive marks the positions for easy egress of purge flow downstream of vane trailing edge.
Impact of rotor blade mainly focuses on the flow field at lower half of the main annulus, which is below the reach of TLV. After the rotor blade leading edge passes by, increases to maximum at t/ΔT = 0.25 and drops to minimum at t/ΔT = 0.75. In radial flow, the upward migration appears after the blade passing by and leads to an increase of positive and a decrease of negative.
Intervene of purge flow (9.4% of main flow rate) decreases the by 60% below 25% annulus height and the growth of exceeds by three times in most areas of the measurement domain, compared with zero purge flow rate. On monitor lines, influence of blade on is similar between two cases. Decreasing area of reached 50% annulus height. While, increasing of is throughout the full annulus height.
Application of POD method identifies the coherent structure by energy fraction. Energy fraction of the first order POD mode in MP7 is largest in the measurement domain. Coherent structure in MP7 plotted with vector field shows detailed information of the flow field affected by the secondary flow, the purge flow and the rotor blade, which could not be achieved by the contour map plotted with composed quantities. Approaching of the rotor blade leads to upstream movement of core by Δx/R = 0.02 in axial and reduces near rotor hub. Both upward and downward migrations in radial at blade leading edge are intensified by the rotor blade approaching. Purge flow extends the area with high and promotes the upward migration in the whole measurement plane. The impacts are transmitted to the vane side in axial and the full annulus height in radial.


