1. Introduction
The use of distributed generation with the increasing number of renewable energy systems that directly deliver DC power such as PV systems, wind generation, or battery storage, combined with the advance in DC technology enables a direct, more efficient and sustainable use of the energy, eliminating losses associated with energy conversion. The growing use of DC distribution systems in data centers, residential buildings, lighting, transportation, and other applications [
1,
2,
3,
4,
5,
6,
7,
8], has prompted the need for definition and standardization of the supplied voltage and the power quality requirements to enable the reliable operation of equipment in DC networks, as well as in AC public distribution systems.
Low-voltage DC distribution networks (LVDCs) are regulated in the European Union by the Directive 2006/95/EC [
9]. This directive enables DC voltage to be used in electricity distribution systems up to 1500 V.
Table 1 shows some of the most common DC nominal voltages used and examples of their main applications [
10].
During recent years, a number of IEC international standards have been developed for LVDC systems, including electricity generation, transmission, distribution, storage and applications such as lighting, household appliances, and electric equipment for transportation, among others. The most comprehensive overview of the IEC related work in LVDC can be seen in [
10].
In spite of being power quality an important issue in the design of DC distribution networks, at present there is no standard norm for power quality in this type of distribution network.
Independent of the future development of LVDC systems, there is a need for definition and measurement of power quality indices in LVDC networks. In this sense, the international committees in charge of maintenance of European Standard EN 50160 “Voltage characteristics of electricity supplied by public electricity networks” [
11] and of the IEC 61000-4-30 “Power quality measurement methods” [
12] have started some preliminary studies in order to extend the scope of these two standards to low-voltage and medium-voltage DC public distribution networks in their future revisions.
At present, there are only a few proposals in the technical literature for definition and measurement of indices for relevant power quality disturbances in DC networks. Some of the first attempts in this subject have defined indices for harmonic/interharmonic distortion and for ripple evaluation [
13,
14]. Power quality indices in the time and frequency domains, such as average, median, and percentile variations of DC components, as well as peak-to-peak and r.m.s. variations, and low frequency distortion indices, have been defined for assessing power quality in DC microgrids [
15]. Finally, other important power quality concerns in DC networks, such as fault currents, inrush currents and grounding, are considered in [
3].
This paper presents an overview of power quality in LVDC distribution networks, studying the power quality phenomena in AC distribution networks that also apply to DC networks, as well as disturbances specific to DC networks, proposing some indices for their characterization.
Section 2 reviews the different types of DC generation and DC voltage shapes and their characterization method. Voltage dips, voltage supply interruptions, rapid voltage changes, and voltage ripple in DC voltage are considered in
Section 3 as some of the main types of power quality disturbances in LVDC networks, defining indices for their assessment.
Section 4 reports some results obtained in different laboratory tests in the detection and assessment of these power quality disturbances, using different DC voltage shapes delivered by different DC power source types.
Section 5 presents a summary of the power quality indices defined, and finally,
Section 6 presents the conclusions.
3. Power Quality Disturbances in DC Networks
The key question concerning power quality in DC networks is whether power quality is relevant for DC networks. If so, which disturbances should be considered to define DC power quality and which indices should be defined for its accurate characterization?
As is the case with low-voltage and medium-voltage AC distribution networks, power quality is an important factor to ensure the correct performance of DC distribution networks, as well as a key factor for the correct and efficient integration of the new distributed energy resources into the network. A poor power quality in DC voltage supply can produce a malfunction or damage electrical and electronic equipment, affecting process operations with important economic and technical impacts.
Most of the power quality disturbances in AC power distribution networks apply to DC networks too. According to the preliminary work developed by the international standardization committees in charge of standards EN 50160 and IEC 61000-4-30, the power quality phenomena that should be assessed for LVDC distribution networks are:
Supply voltage deviations
Voltage unbalance
Ripple/harmonics
Voltage swells and voltage dips
Voltage supply interruptions
Rapid voltage changes and flicker
This section defines indices for the assessment of most of these power quality disturbances, that is, voltage swells and voltage dips, voltage supply interruptions, rapid voltage changes, and ripple/harmonics, taking as reference those previously defined in AC networks.
3.1. Voltage Dips, Voltage Swells and Voltage Supply Interruptions
As in the case of AC networks, voltage dips, voltage swells, and voltage supply interruptions are basically caused in LVDC networks by faults, sudden load changes, or by load switching. It is important to point out that these types of voltage event can be more detrimental in DC networks than in AC ones because of the lack of the reactive part of the impedance, which in the case of AC grids smooths these voltage events.
There are no standard requirements defined for tolerance of equipment to voltage dips, voltage supply interruptions, or voltage swells in LVDC networks, with the exception of the electrical and electronic equipment used in railway, aircraft and telecommunication applications [
17,
18,
19].
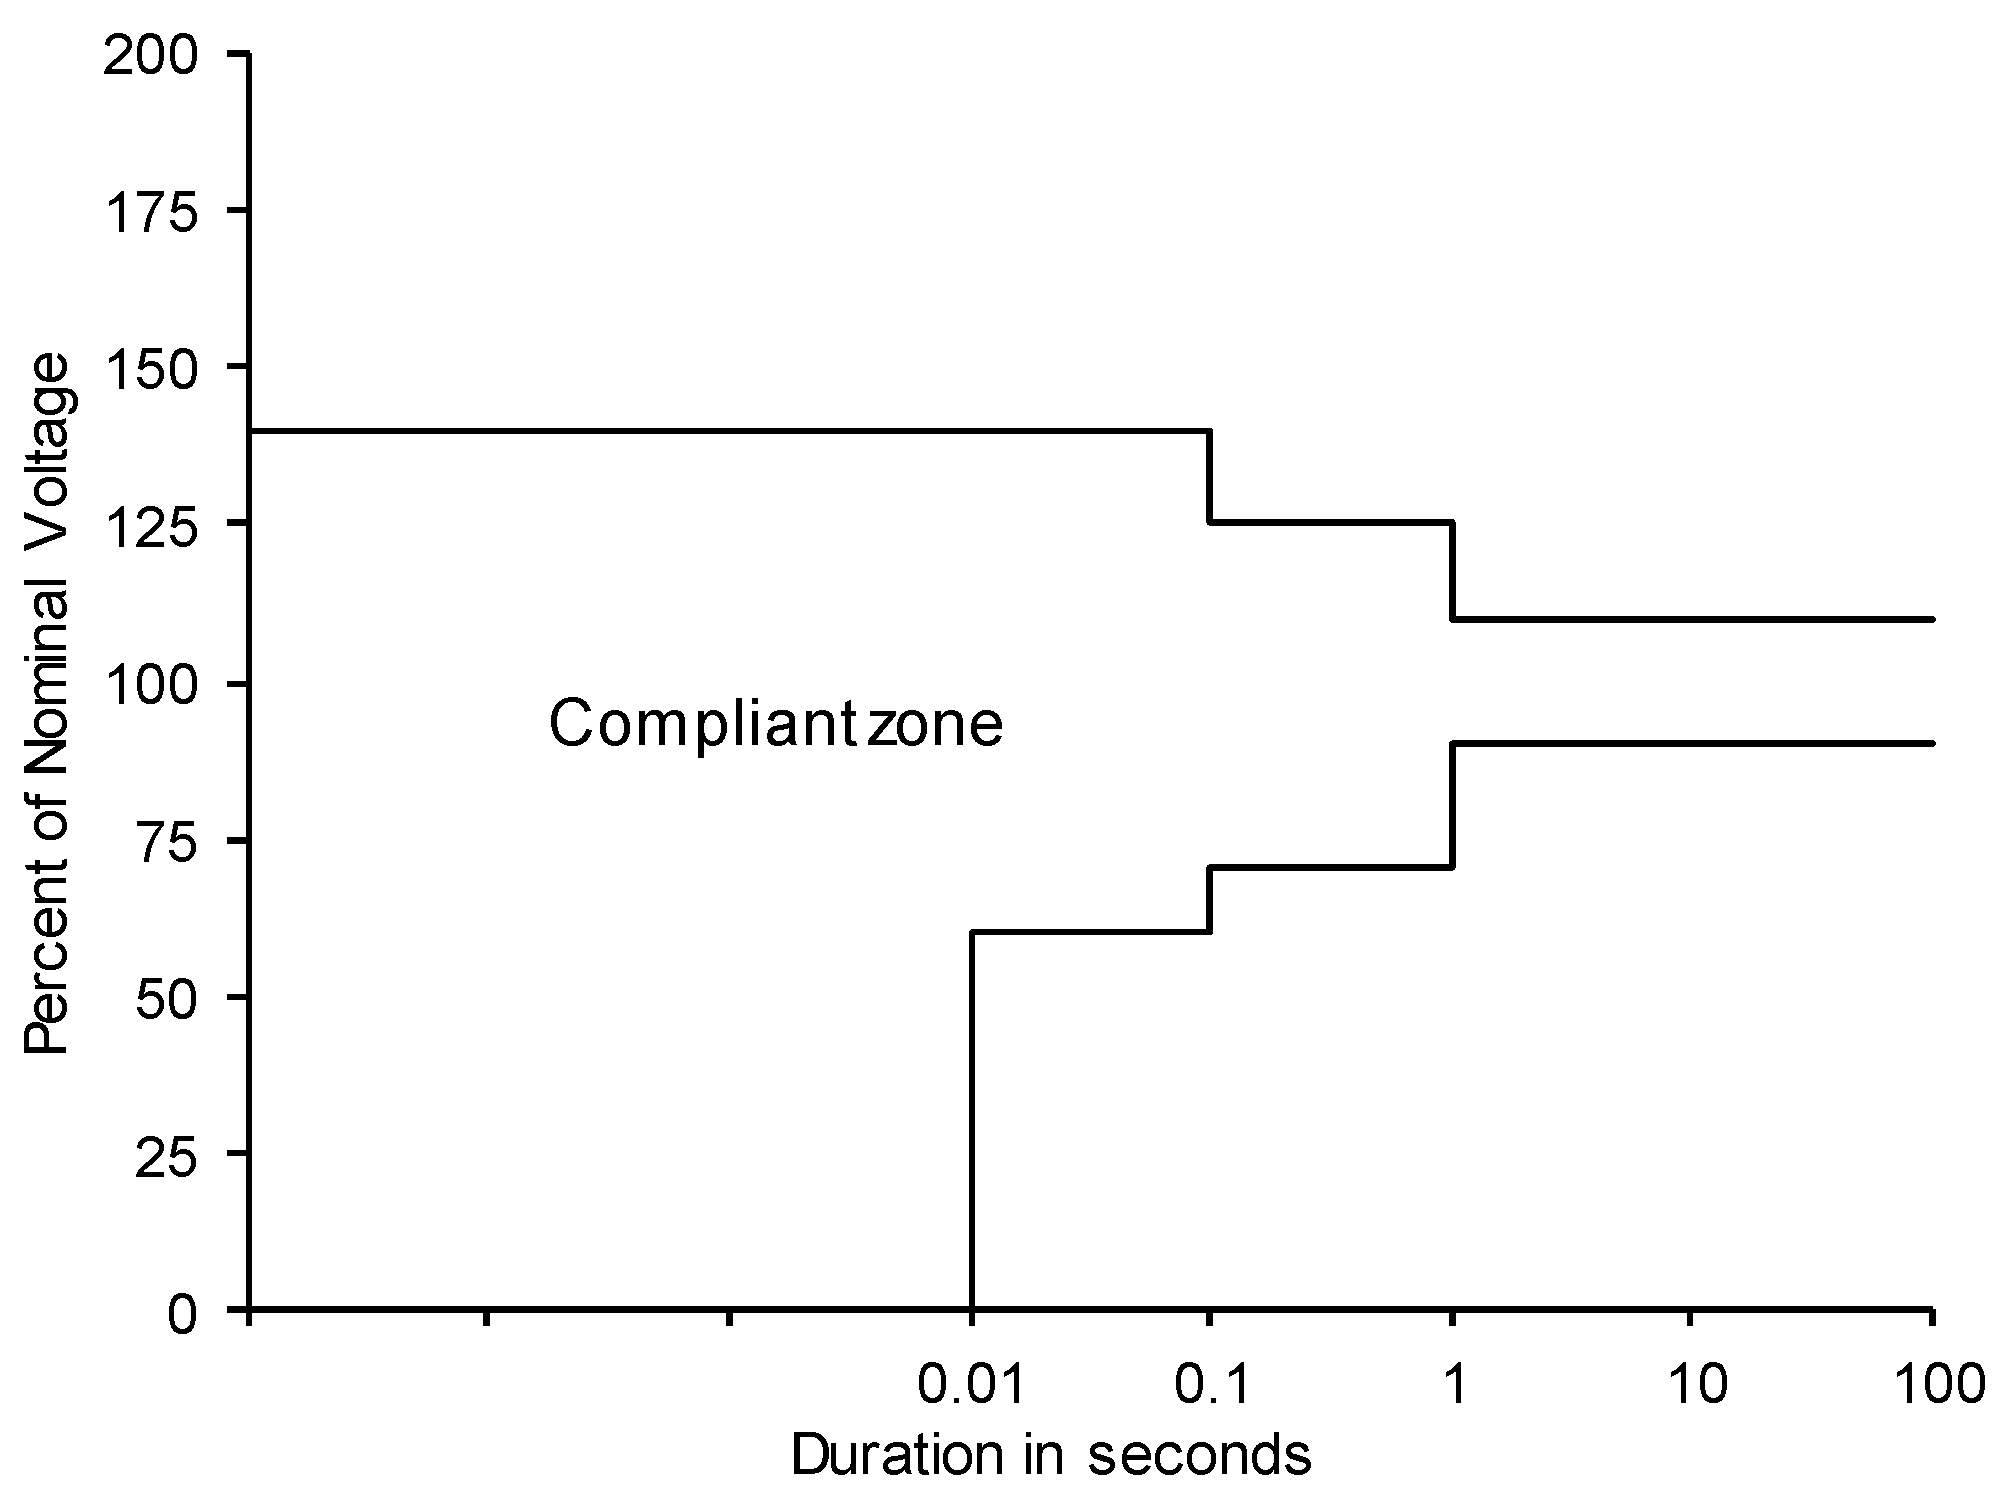
According to European Standard EN 50155 electrical and electronic equipment is expected to operate reliably in the range 0.7–1.25 U
N (U
N: Nominal voltage) during a time t < 1 s, in the range 0.6–1.4 U
N during a time t < 0.1 s, and up to 10 milliseconds during a voltage interruption [
17]. This time-dependent characteristic is shown in the voltage tolerance curve in
Figure 2. No voltages within the compliant zone produce malfunctions of equipment.
Other standards, such as IEC 61000-4-29 [
20], define test methods for immunity to voltage dips, short interruptions, and voltage variations on the DC input power port of electrical or electronic equipment. This standard is applicable to low voltage DC power ports of equipment supplied by external DC networks.
Voltage dips/swells and voltage supply interruptions are characterized by two parameters in IEC 61000-4-30 for AC public distribution networks [
12]: The residual voltage or the depth (or the maximum voltage in the case of a voltage swell) and the duration. The magnitude and duration of these voltage events can be computed in a similar way in LVDC networks, simply replacing the U
rms(1/2) value defined in IEC 61000-4-30 (r.m.s. voltage computed over one cycle and refreshed each half-cycle) for their detection and evaluation by an equivalent DC magnitude. To this end, and solely for the purpose of detection and characterization of these voltage events, we propose the use of a DC voltage computed as the arithmetic mean value of the instantaneous DC voltages in a 20 millisecond sliding window (U
DC,20ms), computing a new DC mean value with each new voltage sample acquired. When this DC voltage magnitude is below/above a defined detection threshold, a voltage dip/swell is detected.
3.2. Rapid Voltage Changes
A rapid voltage change (RVC) is defined in AC networks as “an abrupt transition between two r.m.s. steady-state voltages and during which the r.m.s. voltage does not exceed the dip/swell thresholds” [
12]. RVCs are a type of power quality disturbance that is also prevalent in DC networks.
RVCs can be produced in DC networks by switching operations in equipment, such as motor starting, generation units, fluctuating loads or load shedding, and they can affect the performance of electrical and electronic equipment, potentially even producing flicker. In the case of PV generation, and as previously reported [
21], fast changes in solar irradiance could cause instantaneous variations in PV power output resulting in rapid voltage changes.
In AC public distribution networks and according to previous work [
12], an RVC event begins when U
rms(1/2) values corresponding to the previous 100/120 values (1 s) are over the RVC threshold of the arithmetic mean of these values, and ends when the U
rms(1/2) values return to a new stationary-state condition. The RVC threshold should be set by the user, typically in the range from 1% to 6% of the nominal or declared voltage.
Two indices have been defined [
12] for RVC characterization in AC networks: Magnitude and duration. The RVC magnitude ΔU
max is defined as the maximum voltage variation of the U
rms(1/2) value during the event, and ΔU
SS is the absolute difference between the U
rms(1/2) values between the two steady-states. In order to classify an event as a RVC, its magnitude ΔU
max should be less than ±10% of the nominal voltage or the declared input voltage; otherwise, the event should be classified as a voltage dip or as a voltage swell.
In the case of DC networks, two equivalent indices can be used for RVC event detection and characterization: Magnitude and duration. An RVC event is detected when the UDC,20ms value corresponding to the last second is over the RVC threshold and ends when the UDC,20ms value returns to a new stationary-state condition. The RVC magnitude in a DC network, ΔUDC, can be defined as the maximum voltage variation of the UDC,20ms value during the event. Similar to the case of AC networks, if the magnitude of ΔUDC is less than ±10% of the nominal voltage, the event should be classified as a voltage dip or as a voltage swell.
3.3. Voltage Ripple
Voltage ripple is a superimposed alternating voltage on a DC voltage that is defined in IEV 161-02-25 [
22] as “the quantity derived by removing the direct component from a pulsating quantity.”
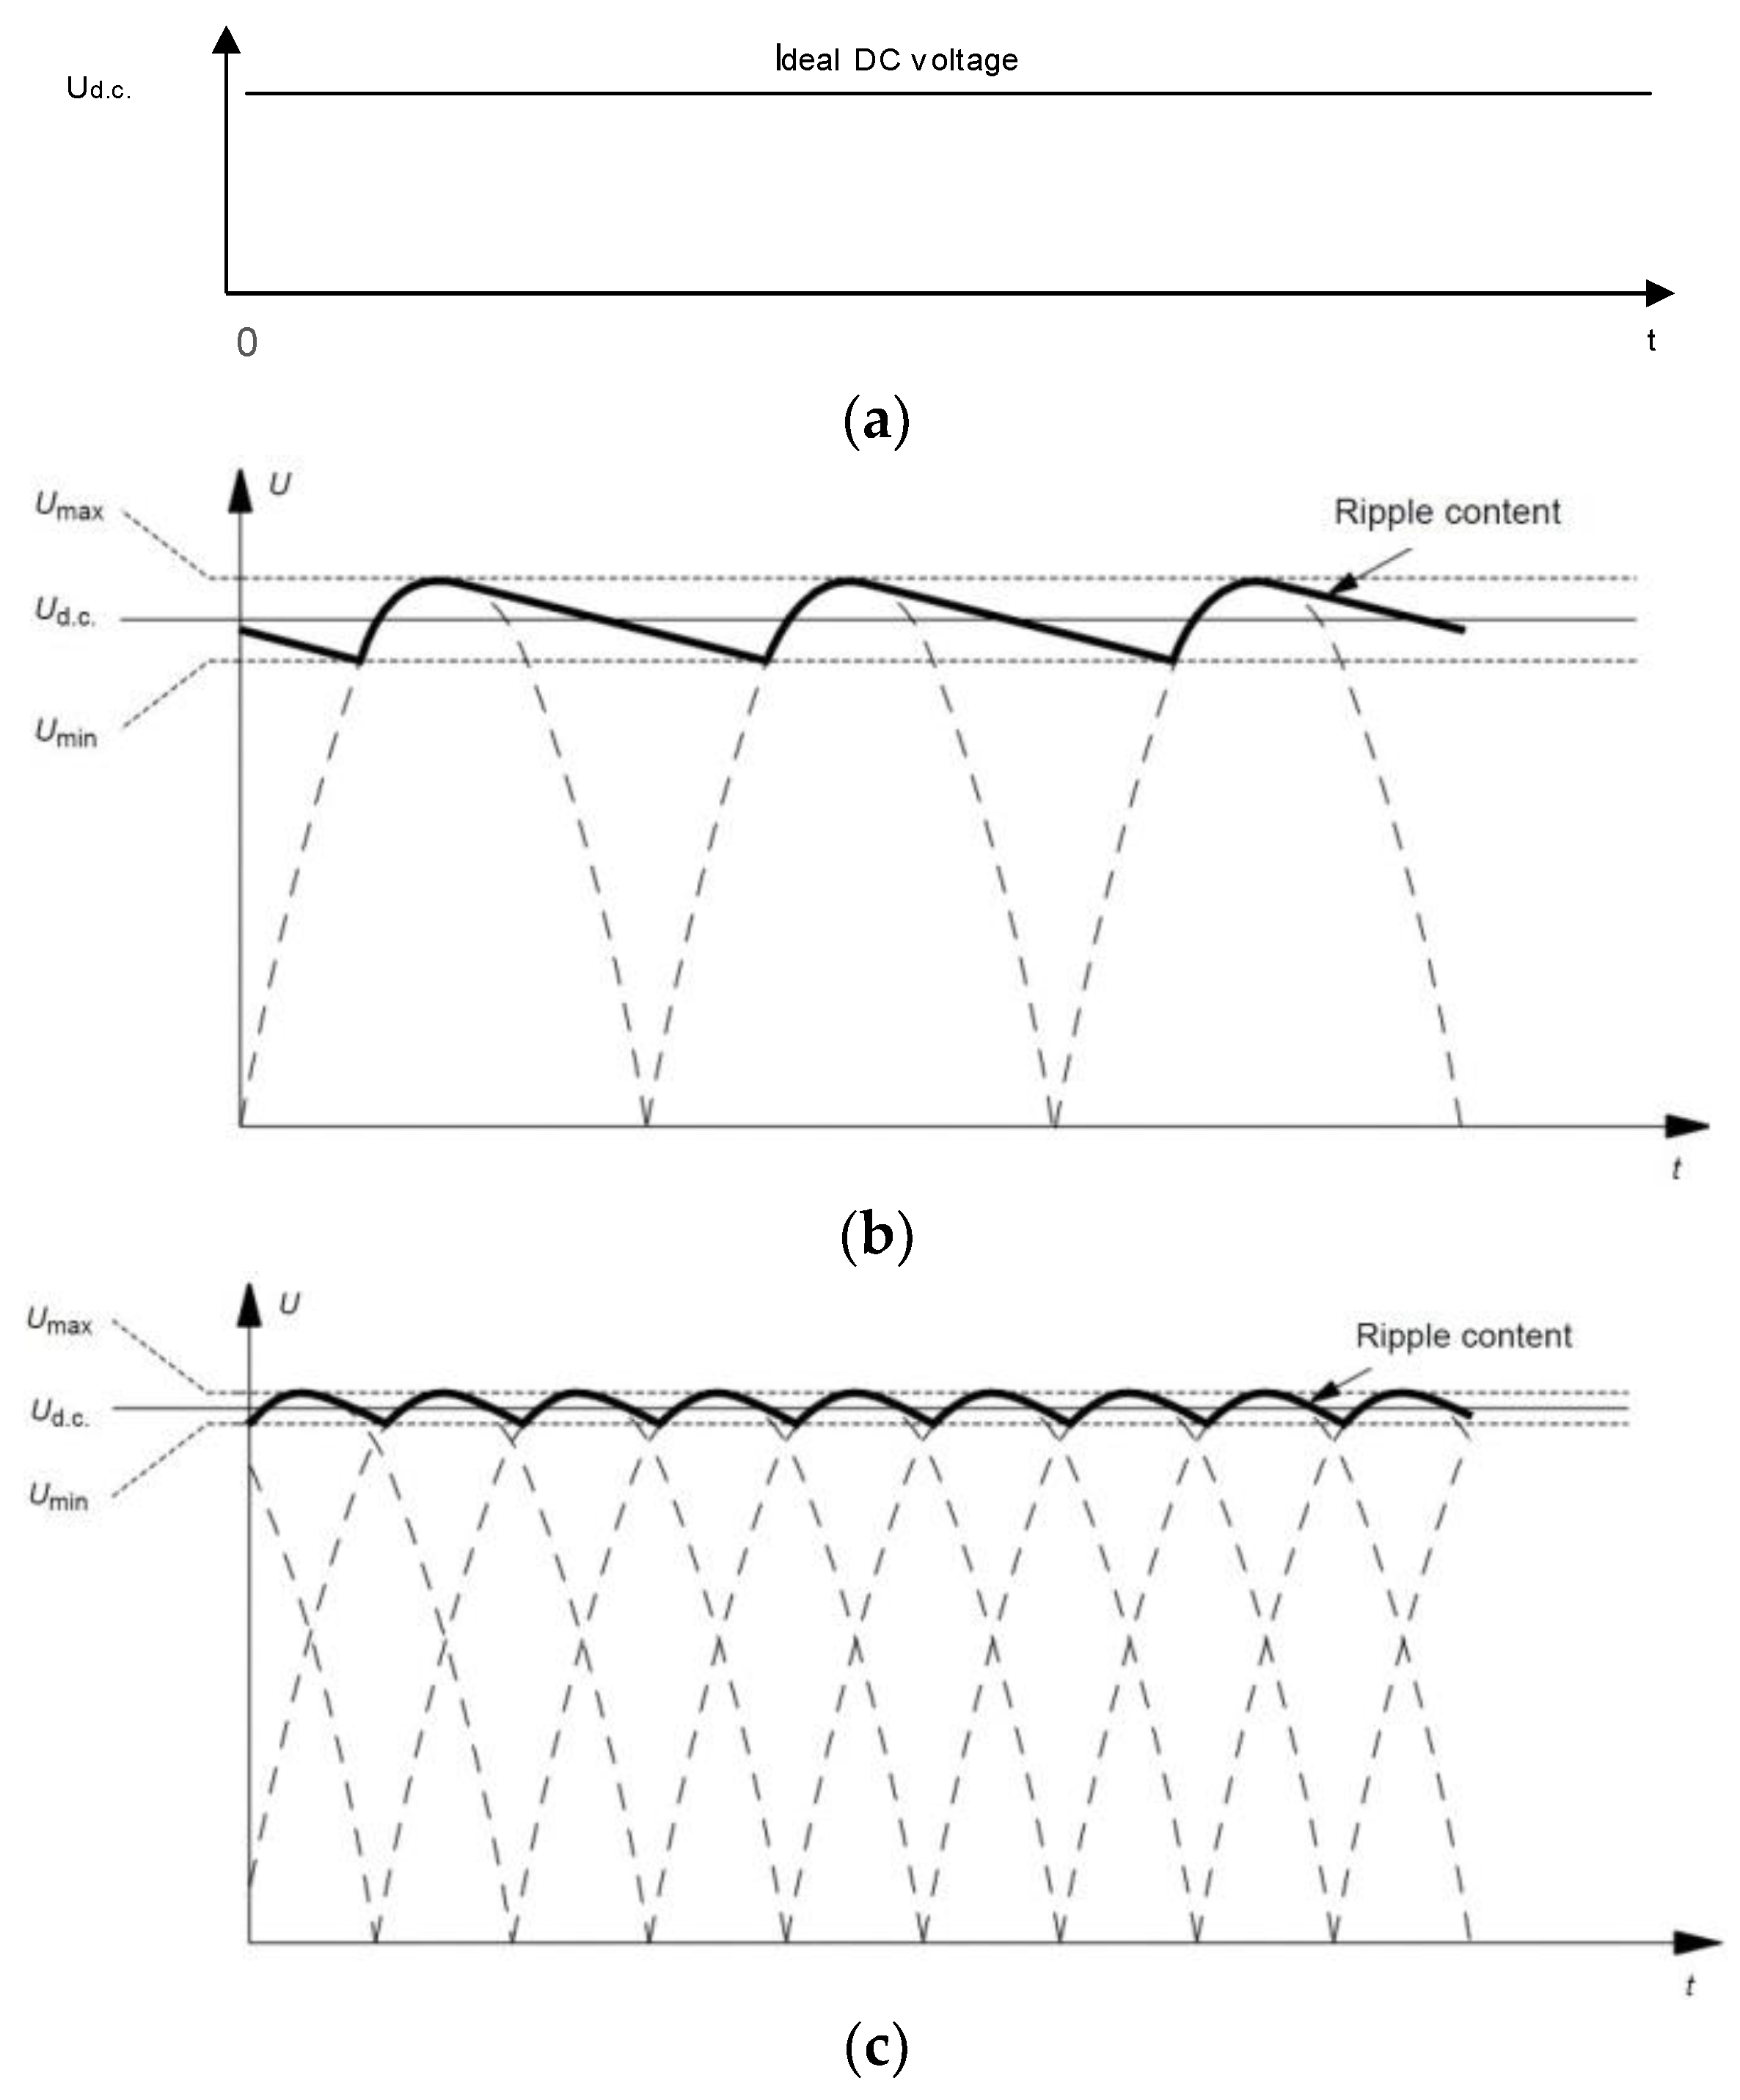
The main sources of voltage ripple in DC networks are ripple produced by AC/DC conversion, ripple produced by battery charging, and ripple generated from equipment absorbing pulsating currents [
16]. In the case of the ripple generated by AC/DC conversion, voltage ripple can be considered a continuous phenomenon with its magnitude decreasing and its frequency increasing with the number of rectifier units, as is shown in
Figure 1. According to Standard IEC 61000-4-17 [
16] “the frequency of the ripple is the power frequency or its multiple 2, 3 or 6,” but other types of AC/DC converters produce different and more complex ripple spectra [
14].
The ripple in a DC voltage should be estimated and limited in order to prevent malfunctions of electrical and electronic equipment connected to the networks. Voltage ripple can produce additional heating and increase losses and audible noise in audio circuits because its frequency and its harmonics are within the audio band; it can also interfere with TV displays.
Up to now, there are no clear limits for ripple magnitude, with up to ±15% of the nominal voltage in railway applications [
17], or up to ±10% in DC power systems on ships [
23], and no limits defined for the ripple frequency distortion. Standard IEC 61000-4-17 defines “test methods for immunity to voltage ripple at the DC input port of electrical and electronic equipment” [
16].
Two main parameters are used in international standards for ripple characterization: Magnitude and frequency. In the case of ripple magnitude, two indices are used for its assessment: The “peak-ripple factor” and the “r.m.s.-ripple factor”.
The “peak-ripple factor” is defined as “the ratio of the peak-to-valley value of the ripple content to the absolute value of the direct component of a pulsating quantity” [
24]:
On the other hand, the “r.m.s.-ripple factor” is defined as “the ratio of the r.m.s. value of the ripple content to the absolute value of the direct component of a pulsating quantity” [
25]:
An index similar to the total harmonic distortion (THD), used for harmonic distortion characterization in AC power system networks [
26], can be defined in order to characterize the spectral components of the voltage ripple of a DC signal, the “ripple distortion factor” (RDF).
We define the RDF index as the square root of the sum of the ratio of the squares of all of the harmonic components of the ripple content G
n obtained using DFT analysis, up to a specific order in the range 2–3.6 kHz (to cover the frequency range defined by harmonic distortion related standards), with respect to the DC component G
0 as:
Other distortion factors, such as the “low-frequency sinusoidal distortion index” [
11], can also be used, considering in this case all the frequency components provided by the DFT analysis with the selected frequency resolution, instead of using only the fundamental and the predominant harmonic components of the ripple content.
Another possible alternative is the use of different frequency ranges depending on the type and switching frequency of the power converters used for AC/DC generation, for a more accurate evaluation of the ripple, as has been proposed previously [
13].
4. Experimental Results
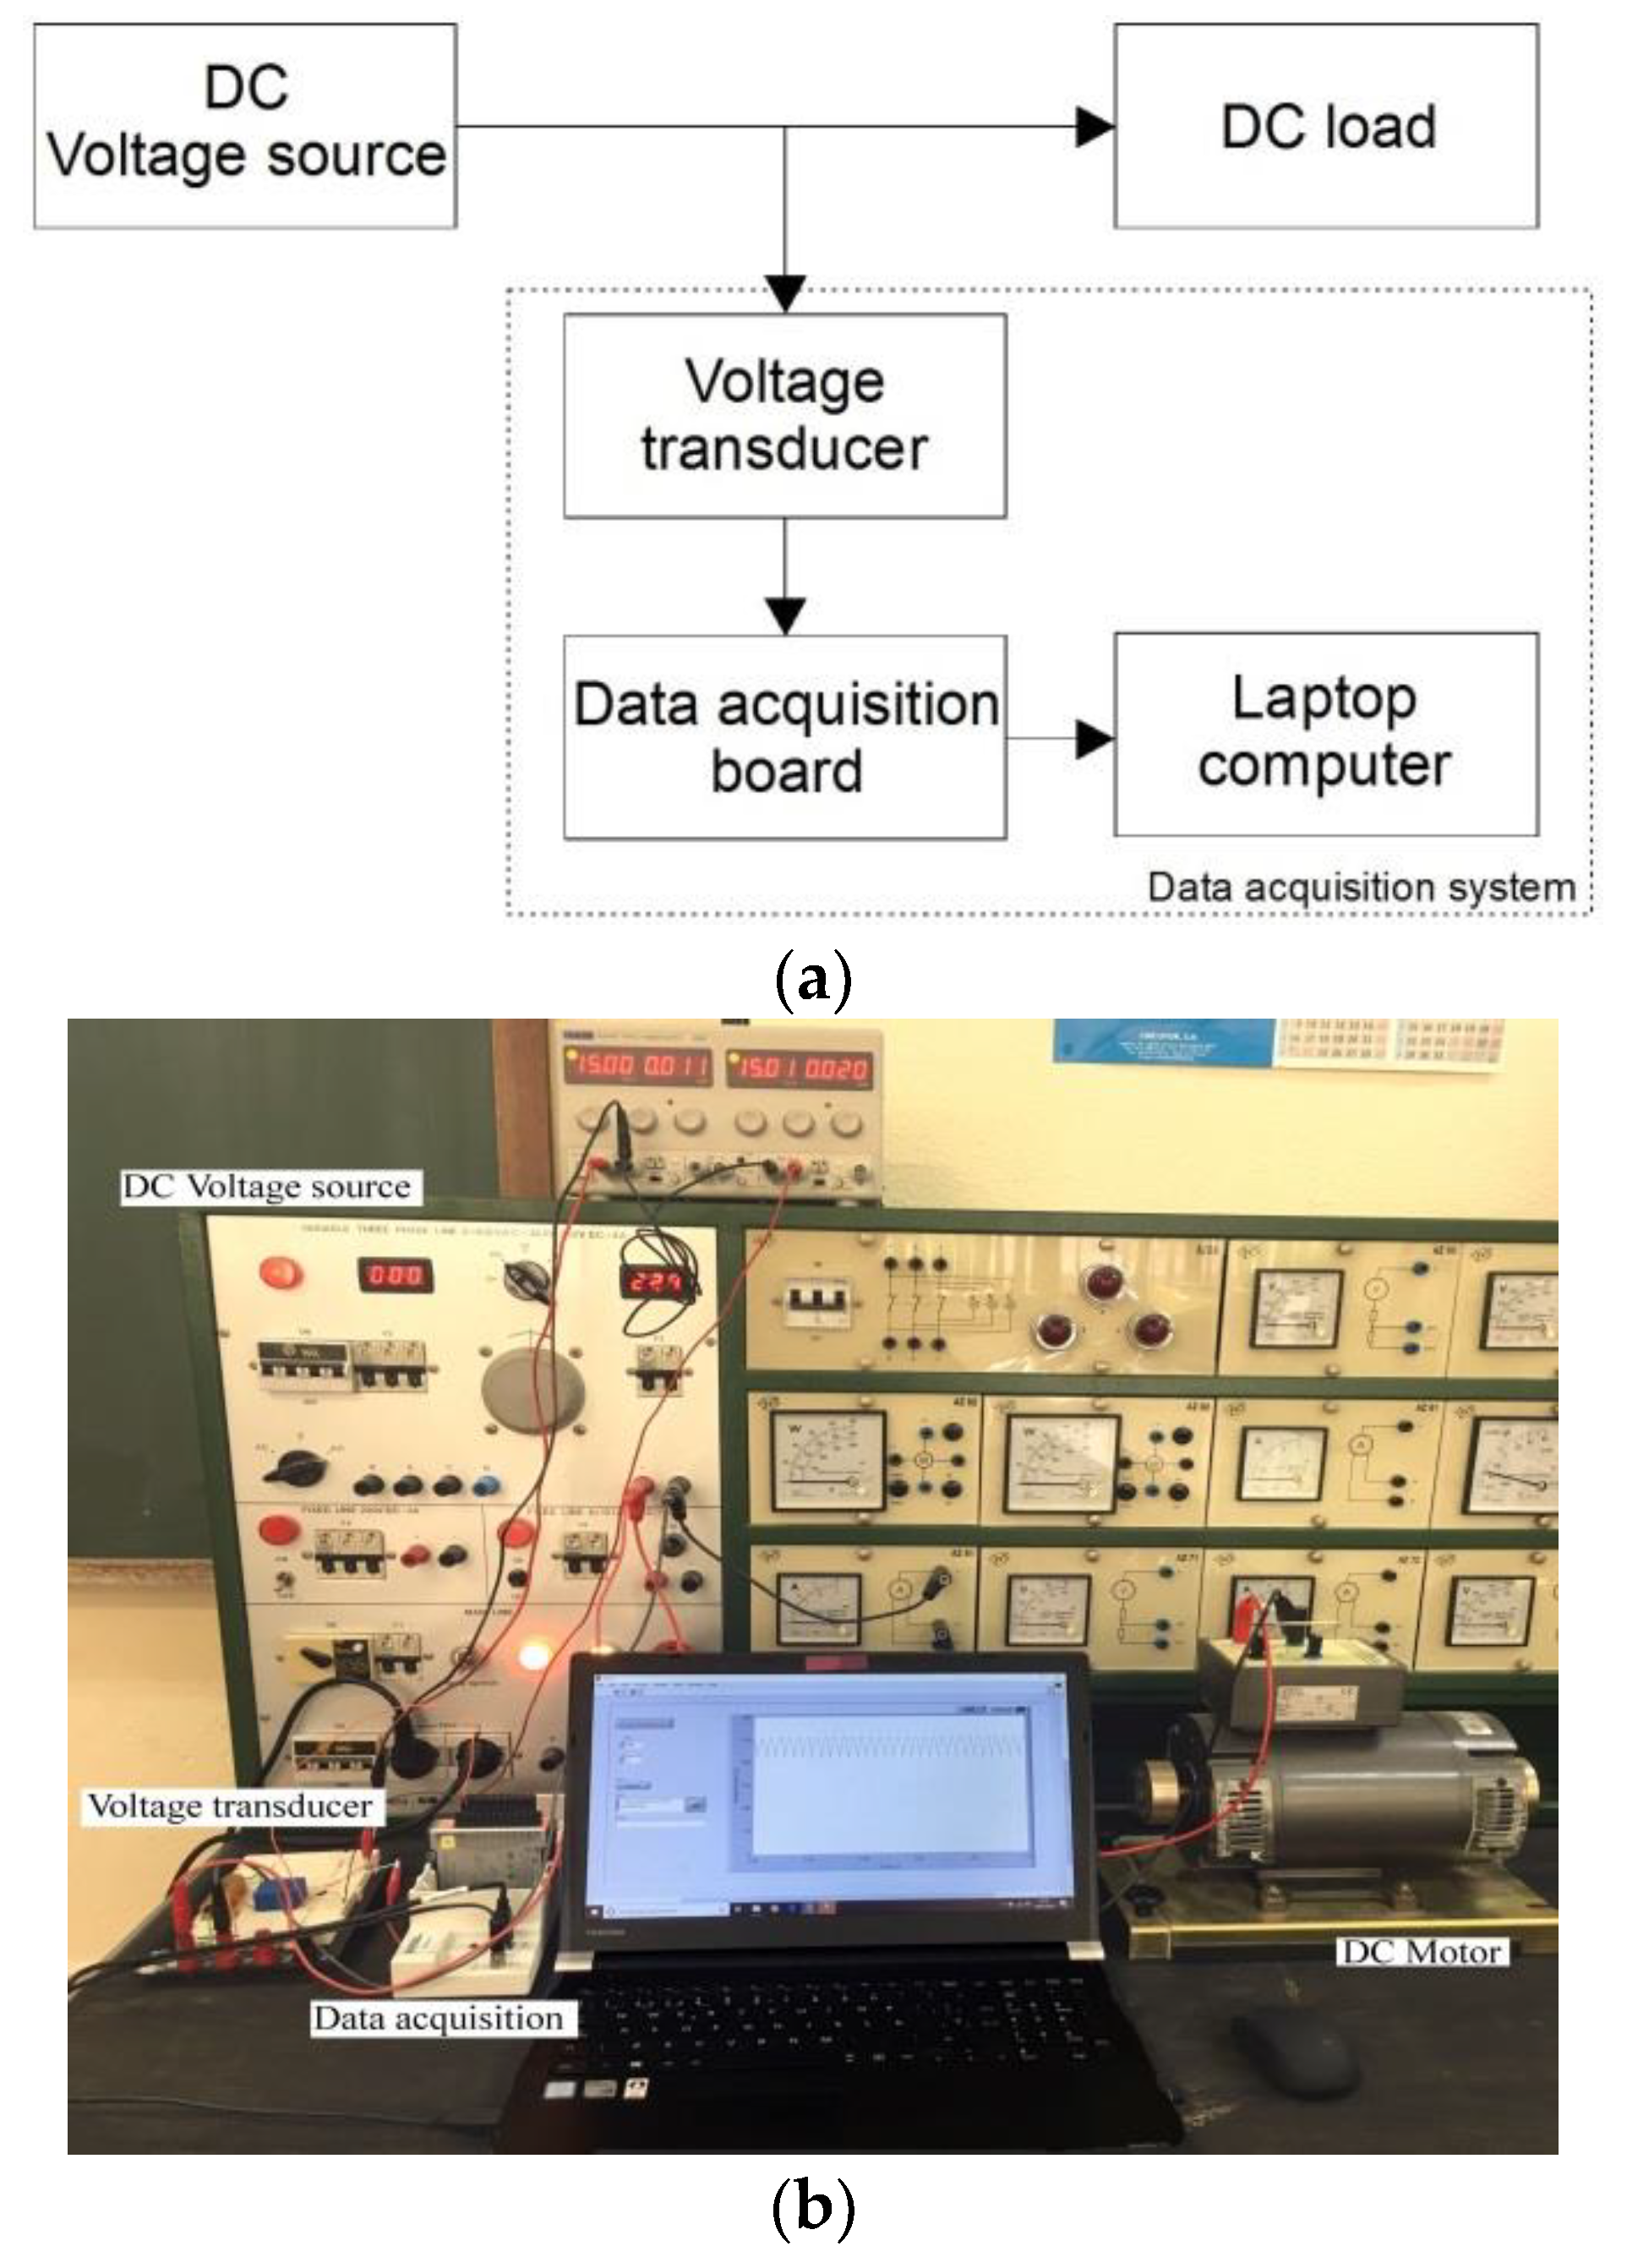
This section presents some of the results obtained in the laboratory set-up developed for DC power quality analysis. The laboratory was made up by two different DC power sources: A regulated AC/DC three-phase rectifying power source with high ripple content and a quasi-ideal programmable DC power source with very low ripple content; and DC loads (resistive loads and DC motors) and a data acquisition system.
Figure 3a shows the block diagram and
Figure 3b the laboratory set-up when using the AC/DC three-phase rectifying programmable power source as the DC voltage source and a DC motor as the DC load.
The data acquisition system used for data acquisition and signal processing consisted of an LEM LV 25-P Hall effect voltage transducer with a frequency range from DC to 150 kHz; an NI CompactDAQ 9172 with a NI 9215, 4 input channels, 16-bit resolution, 100-kS/s/ch maximum sampling rate, and ±10 Volt maximum input range data acquisition board; and a laptop computer (see
Figure 3a).
The sampling frequency used was 6.4 kS/s, high enough for the accurate characterization of the spectrum of the voltage ripple superimposed on the DC voltage. In each test a 10 s record of the DC voltage signal was taken, computing the DC voltage magnitude and different power quality indices depending on the test performed. The software was implemented using the LabVIEW 15 graphic programming environment.
Up to now, there is no standard measurement method for estimation of DC voltage in LVDC distribution grids. In the case of aircraft electric power systems, standard MIL-STD-704F [
18] defines the steady-state voltage as “the time average of the instantaneous DC voltage over a period not to exceed one second,” the same criteria as the standard used for shipboard electric installations [
27]. In all the tests conducted in this paper, we have used a 200 millisecond period for estimation of the steady-state DC voltage (U
DC), the same time interval as the one used for the measurement of r.m.s. voltage in AC grids.
4.1. Voltage Dips and Short Interruptions
This section presents some results obtained in the detection and assessment of voltage dips and short interruptions in DC voltage supply using the sliding arithmetic mean value of the DC voltage previously defined in
Section 3.1.
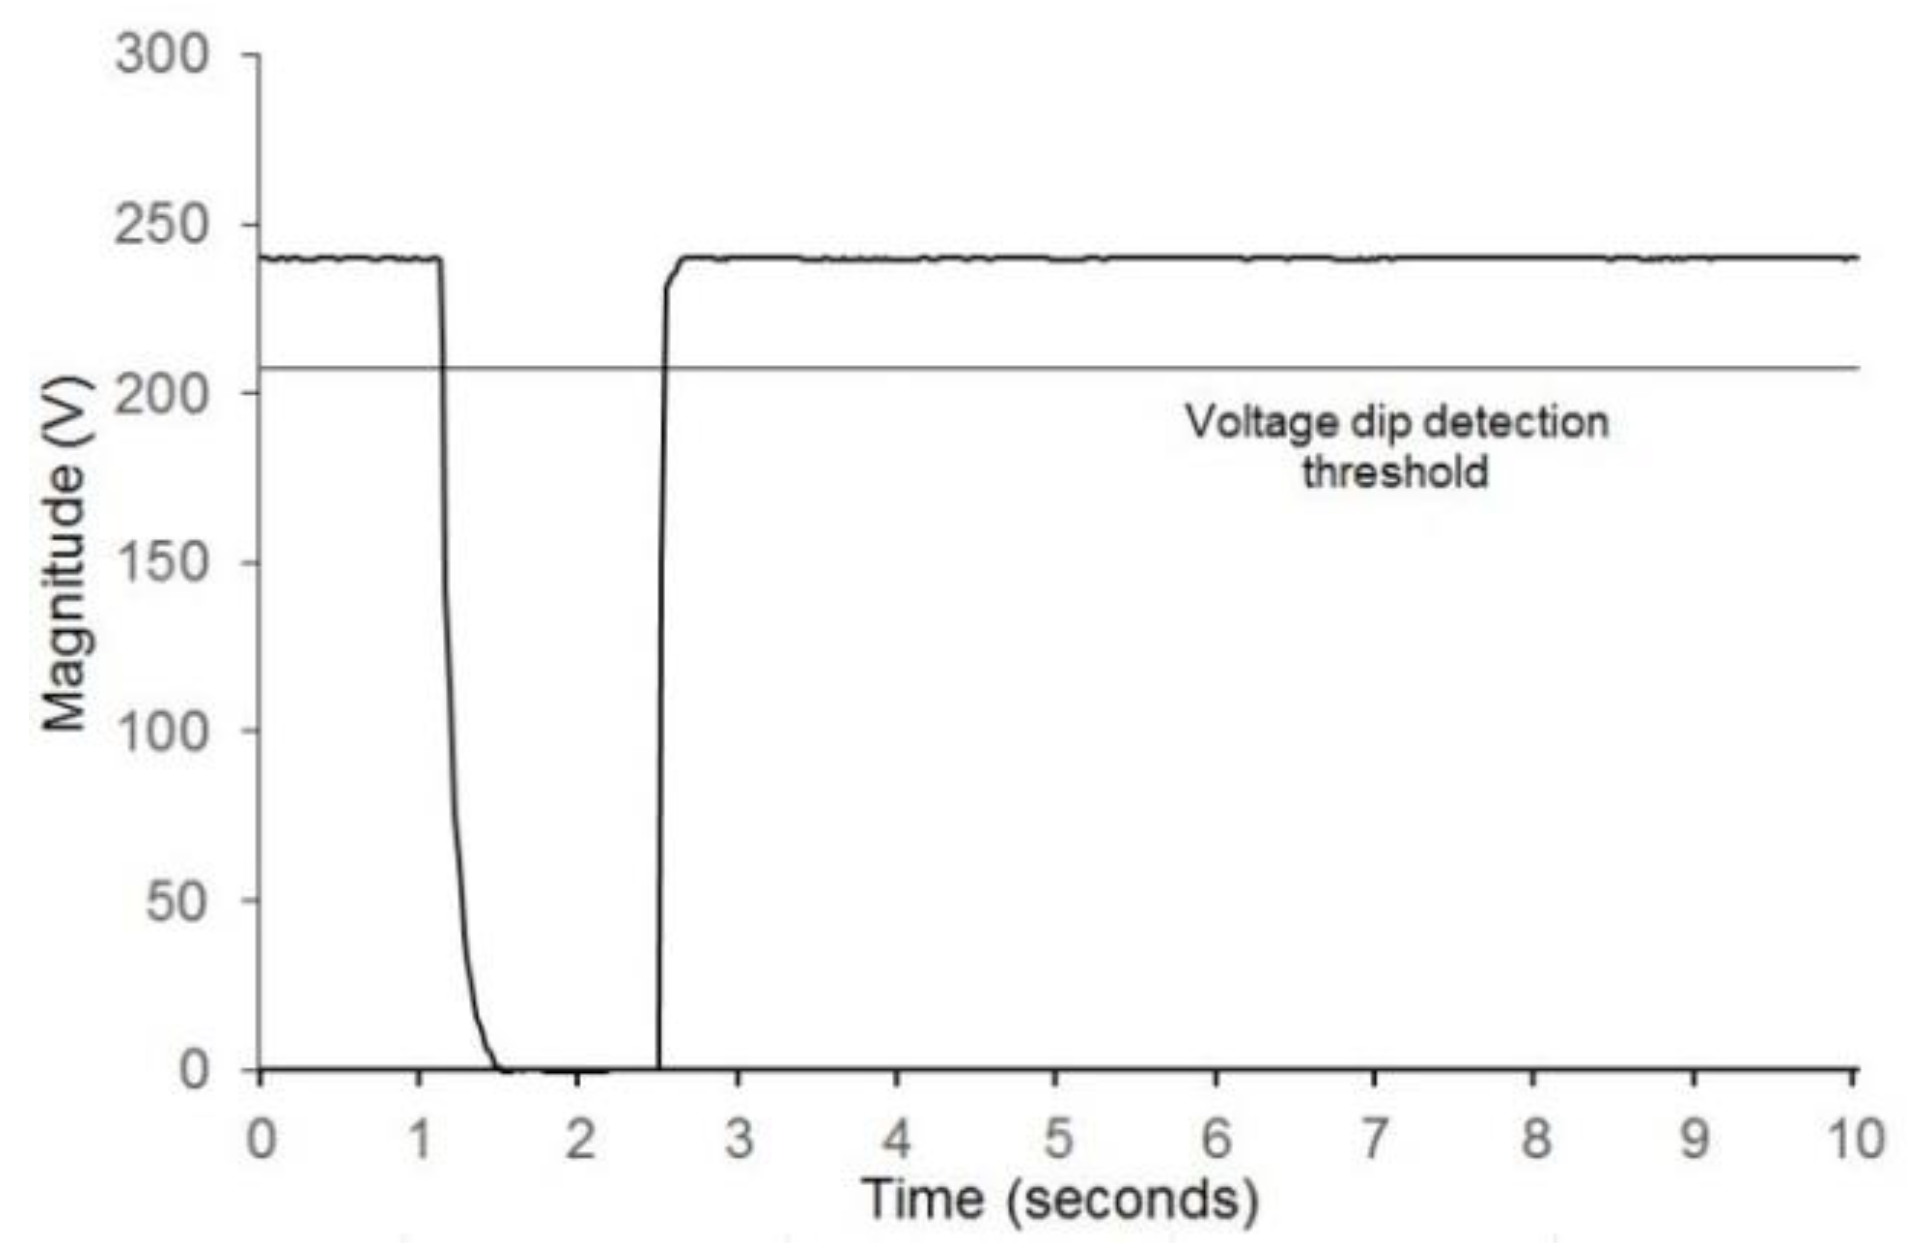
Figure 4 shows an example of a voltage supply interruption produced by the switching on/off of a 230 V, 0.69 kW, DC voltage source in our laboratory. The voltage event is detected when the DC voltage is below the voltage dip detection threshold. The detection threshold selected, as in AC networks, is 90% of the nominal voltage, considering the event as a voltage supply interruption when the DC voltage magnitude during the event is less than 5% of the nominal value, as previously proposed [
11].
As can be seen in
Figure 4, the voltage supply interruption starts at instant 1.24 s and ends at instant 2.60 s of the record, with a duration of 1.36 s. According to the voltage tolerance of equipment in
Figure 2, the duration of this voltage supply interruption could cause the malfunction or the trip of equipment.
4.2. Rapid Voltage Changes
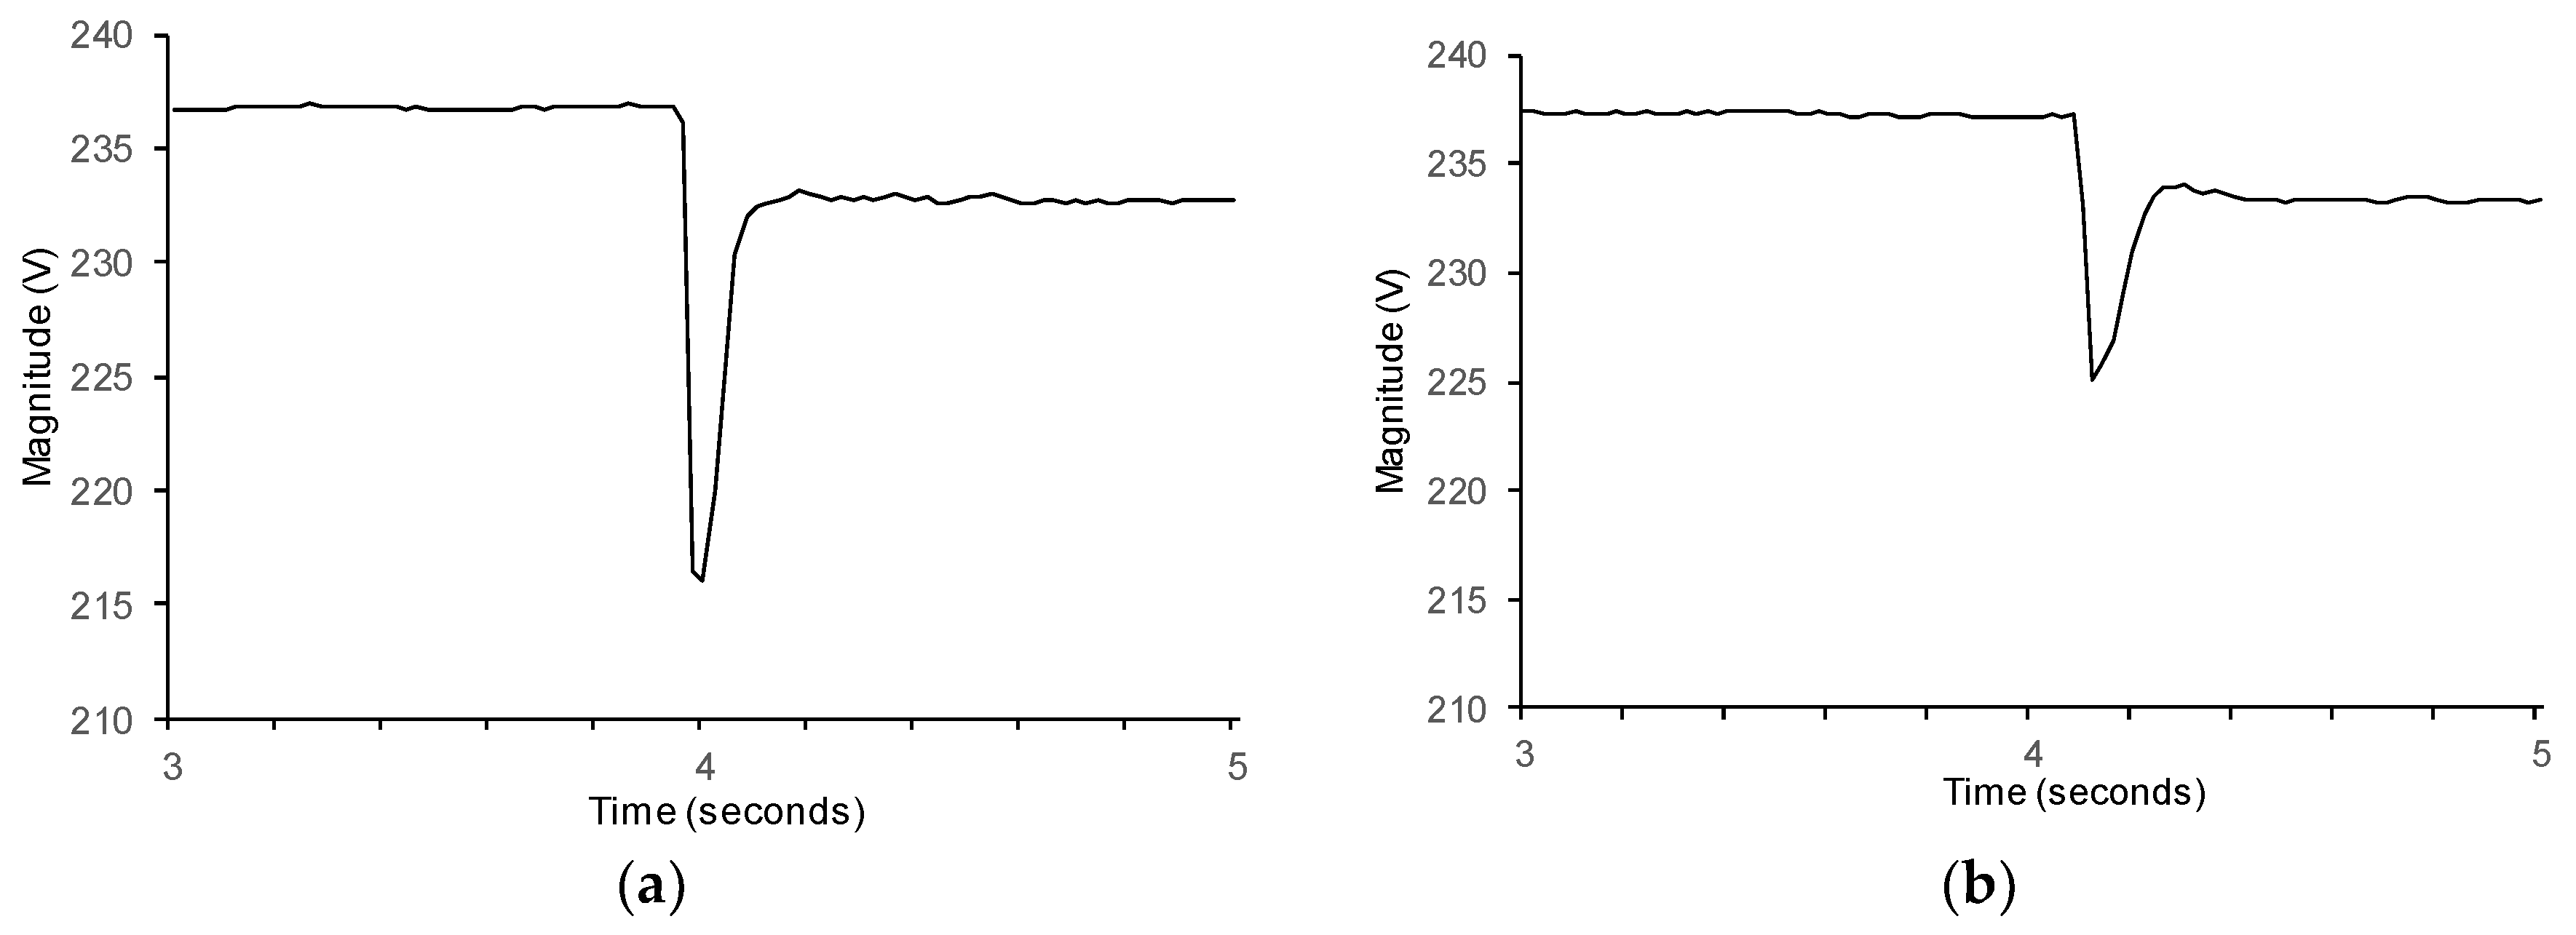
One type of RVC event that can appear in a DC distribution grid is associated with motor start-ups. In these voltage events and after a sudden transition, the voltage gradually recovers to a new value. A 230 V, 0.44 kW, 1500 rpm, DC motor, with different starting resistors connected to a 230 V, 0.69 kW, DC power source was used in our laboratory to produce RVCs of different magnitude and duration.
Figure 5 shows two different examples of RVC events. Different starting resistors were used to limit the starting current to safe values, producing RVCs of different magnitude and duration. The DC arithmetic mean voltage value corresponding to the last second, and recalculated with each new DC voltage sample acquired, as defined in
Section 3.2, was used for RVC detection and characterization. A magnitude of 1% of the nominal voltage was selected as the RVC detection threshold (2.3 V in this case). The two RVC events in
Figure 5 are 20.126 and 8.098 V magnitude (9.148% and 3.361% of the nominal voltage), with 0.18 s and 0.10 s duration, respectively.
4.3. Voltage Ripple
In this section, the results obtained in the assessment of the ripple produced by two different DC power sources in our laboratory are presented. In each case a 10 s record in the DC voltage was recorded, computing the peak-ripple factor, the r.m.s. ripple factor and the ripple distortion factor.
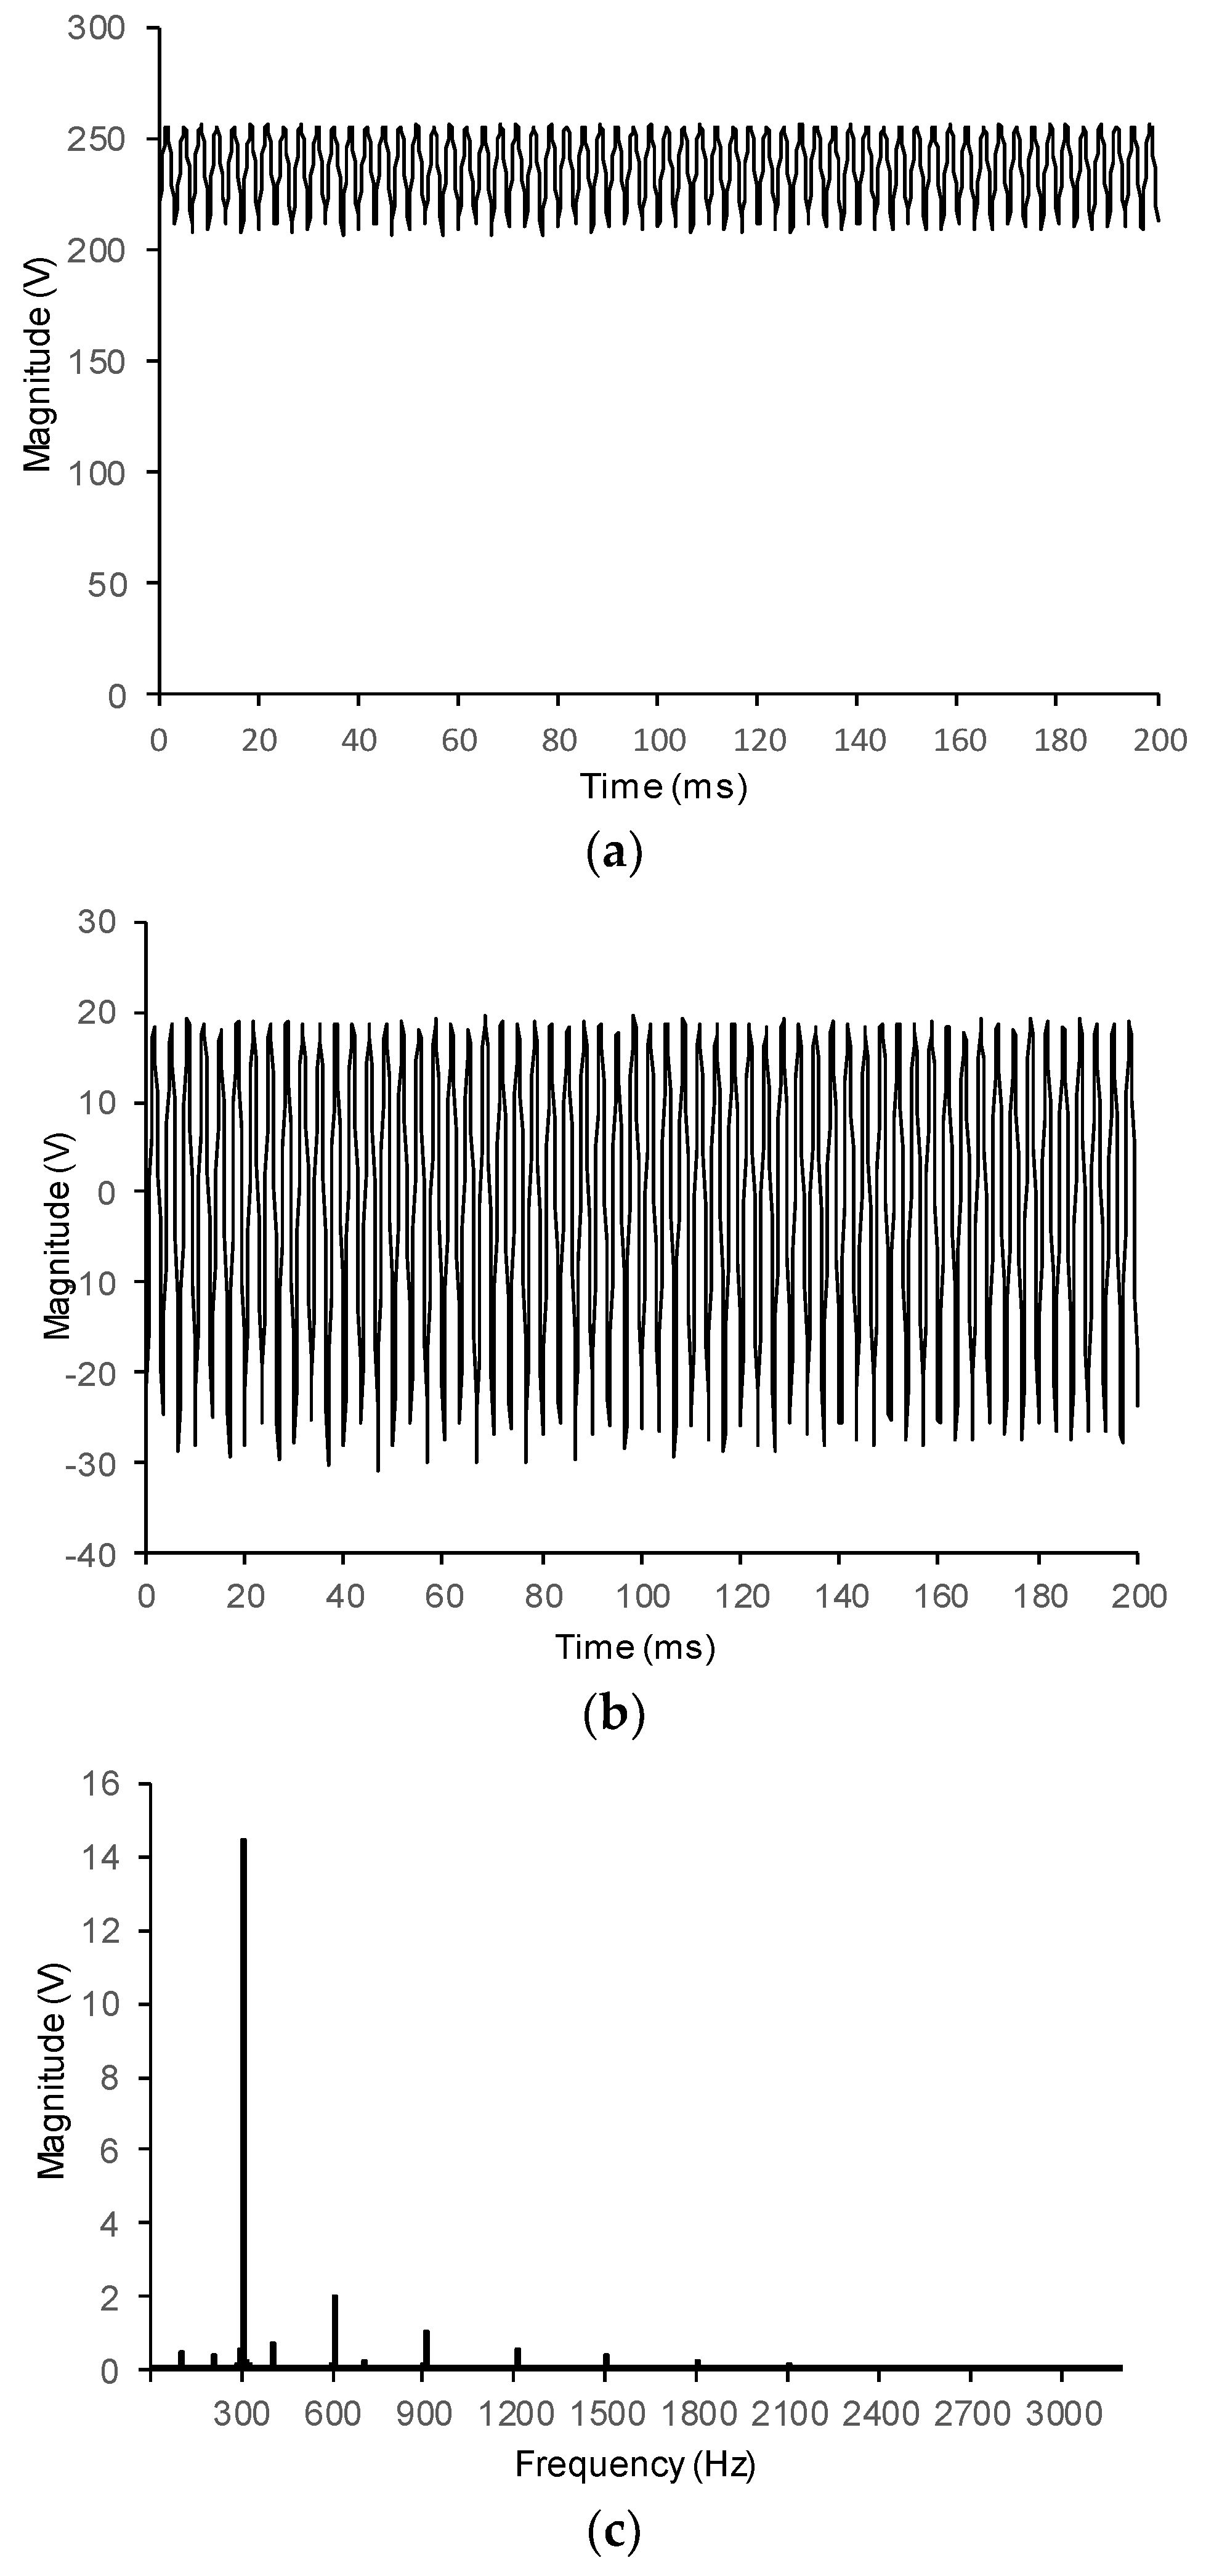
Figure 6 shows an example of the ripple produced by a 230 V, 0.69 kW, AC/DC three-phase rectifying programmable DC power source.
Figure 6a presents 200 milliseconds of the DC voltage waveform, the ripple content is shown in
Figure 6b, and its spectral analysis is presented in
Figure 6c. The DC voltage (computed as the mean value during the 200 milliseconds period in the record), the peak-to-valley, and the r.m.s. values were 237 V, 50.478 V, and 14.735 V, respectively, whereas the peak-ripple factor and the r.m.s.-ripple factor (as defined in the previous section) were 21.299 % and 6.217%, respectively, of the DC voltage.
Table 2 and
Figure 6c show the magnitude of the frequency components of the ripple content computed in the 200 millisecond window in
Figure 6a, applying the DFT analysis with 5 Hz resolution. As can be seen from the results reported, the DC voltage component is 237 V, the fundamental component of the ripple content is 300 Hz, as expected in a three-phase AD/DC conversion voltage source when using 50 Hz AC input voltage with a magnitude of 14.46 V (6.1% of the DC voltage), and predominant harmonic components at 600 Hz, 900 Hz, 1200 Hz and 1500 Hz, with magnitudes of 1.99 (0.84% of the DC voltage), 1.06 (0.45%), 0.60 (0.25%), and 0.38 V (0.16%), respectively. The ripple distortion factor (RDF) of the signal in
Figure 6a is 6.18% of the DC voltage.
Finally,
Figure 7 shows the DC voltage shape and the ripple content as produced, in this case, by a 600 V, 3 kW, programmable ideal DC power source.
Figure 7a shows 200 milliseconds of a 400.06 DC voltage waveform produced by the power source,
Figure 7b shows the ripple content and
Figure 7c shows its spectral components. As can be seen, the DC voltage is quasi-ideal, with deviations from the output voltage of less than 1.5% of the selected voltage magnitude and very low ripple magnitude. The peak-ripple factor and the r.m.s.-ripple factor were 0.621% and 0.104%, respectively, of the DC voltage, and the ripple distortion factor (RDF) was only 0.022% of the DC voltage, with spectral components less than 0.1 V magnitude (0.25% of the DC voltage).


