1. Introduction
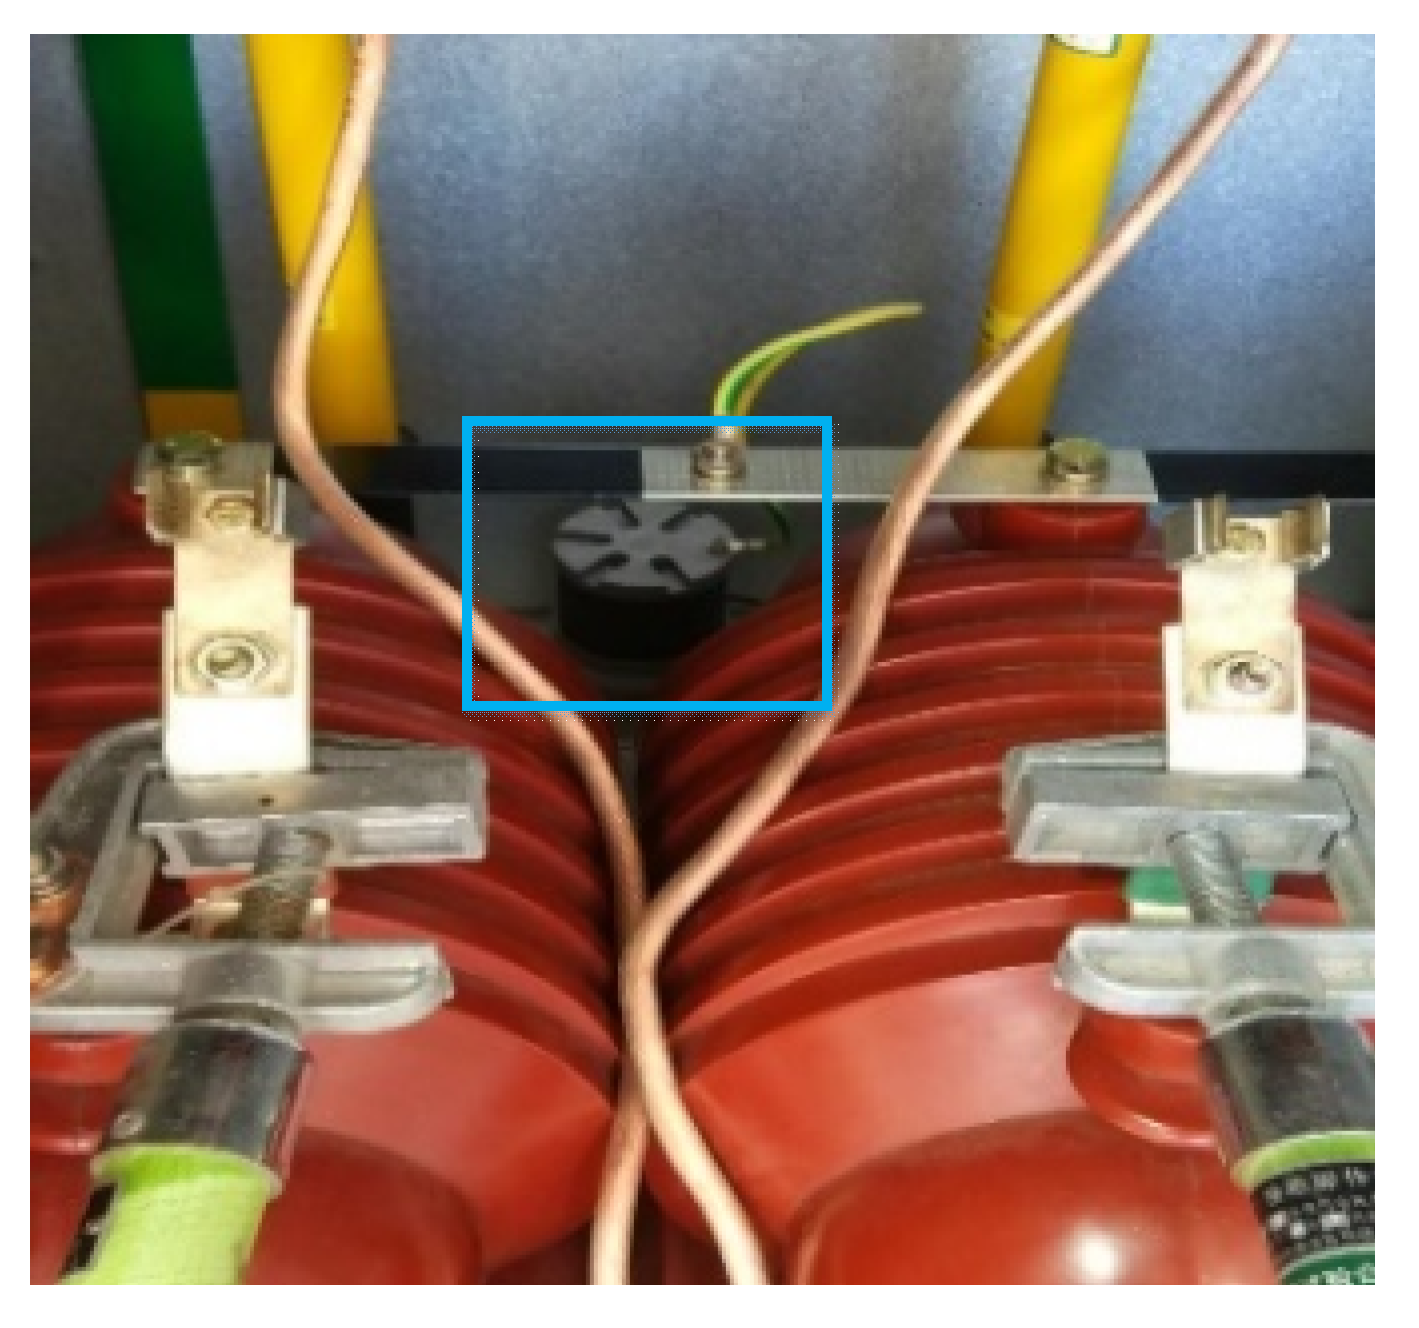
To prevent the ferromagnetic resonance of a voltage transformer during the operation of a non-effective grounding system of 35 kV and below [
1,
2], the neutral point of the Y wiring voltage transformer is generally equipped with a harmonic elimination device [
3,
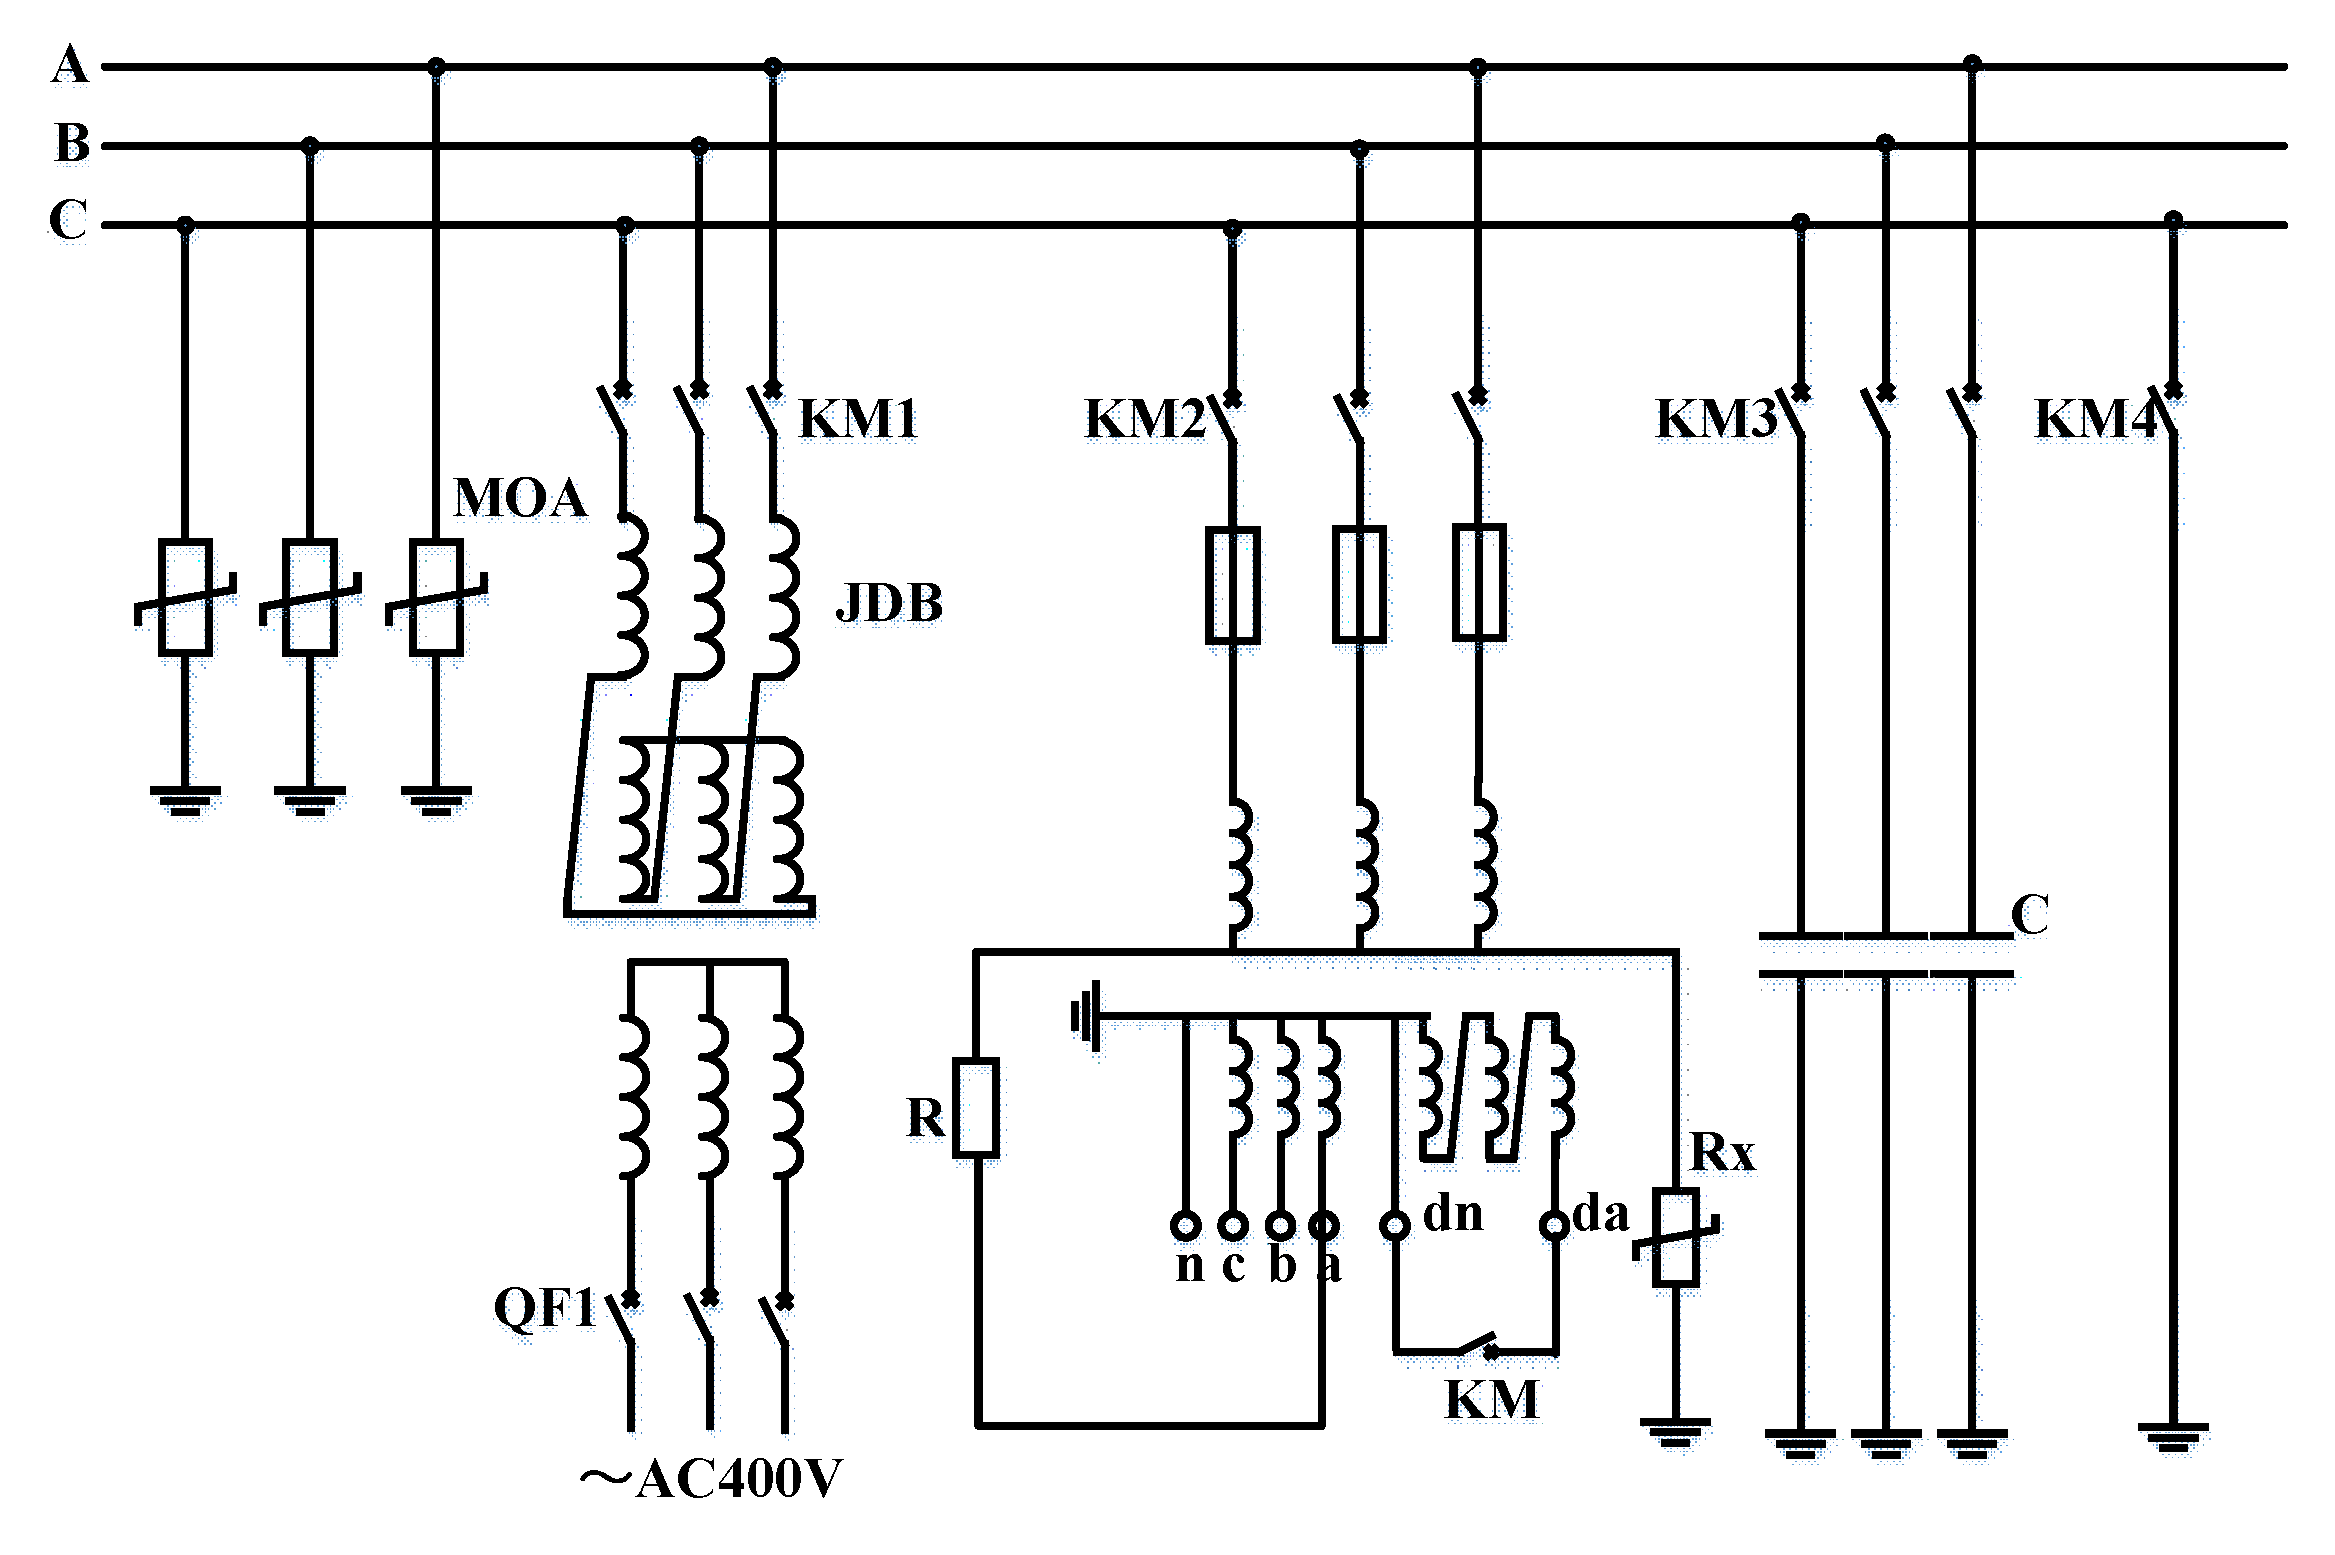
4], as shown in
Figure 1. At present, the harmonic elimination device is generally a non-linear silicon carbide resistor. It is generally believed that the ferromagnetic resonance can be eliminated when the ratio of the resistance value
R of the primary harmonic elimination device to the excitation reactance
Xm of the voltage transformer at the rated line voltage is greater than 0.06. The resistance of a primary harmonic elimination device of 10 kV and below is above 60 kΩ, and the resistance value of 35 kV primary harmonic elimination device is above 150 kΩ. At present, many suppression measures [
5,
6,
7,
8,
9,
10,
11,
12] have been proposed based on the mechanism of ferromagnetic resonance [
13,
14,
15,
16,
17,
18,
19].
Fully insulated electromagnetic voltage transformers and semi-insulated electromagnetic voltage transformers are currentlyused in the distribution network. Fully insulated VT means that the main insulation between the primary winding and the secondary winding and the ground is subjected to a 100% power frequency test voltage. Semi-insulated VT is a single-phase voltage transformer where one end of the primary winding is directly grounded. The semi-insulated electromagnetic voltage transformer is low in cost, small in size and light in weight, and is widely used in distribution network systems of 35 kV and below.
There is insulation between the two windings of the voltage transformer and between the winding and the core, so that there is electrical isolation between the two windings and between the winding and the core. According to the insulation type, the voltage transformer can be divided into dry type, cast type, oil immersed type and inflatable type. The insulating medium of dry voltage transformer is composed of ordinary solid insulating material such as insulating paper, glass ribbon and polyester film. Its structure is simple, there is no danger of fire and explosion, but the insulation strength is low. It is only suitable for indoor devices below 6 kV. The insulating medium of the cast voltage transformer is composed of epoxy resin or unsaturated resin mixed material. It has compact structure and convenient maintenance and it is suitable for indoor power distribution equipment of 35 kV and below. The insulating medium of the oil-immersed voltage transformer is composed of insulating paper and insulating oil. It has good insulation performance and can be used for an outdoor power distribution device of 10 kV or more. Inflatable voltage transformers are used in fully enclosed SF6 appliances.
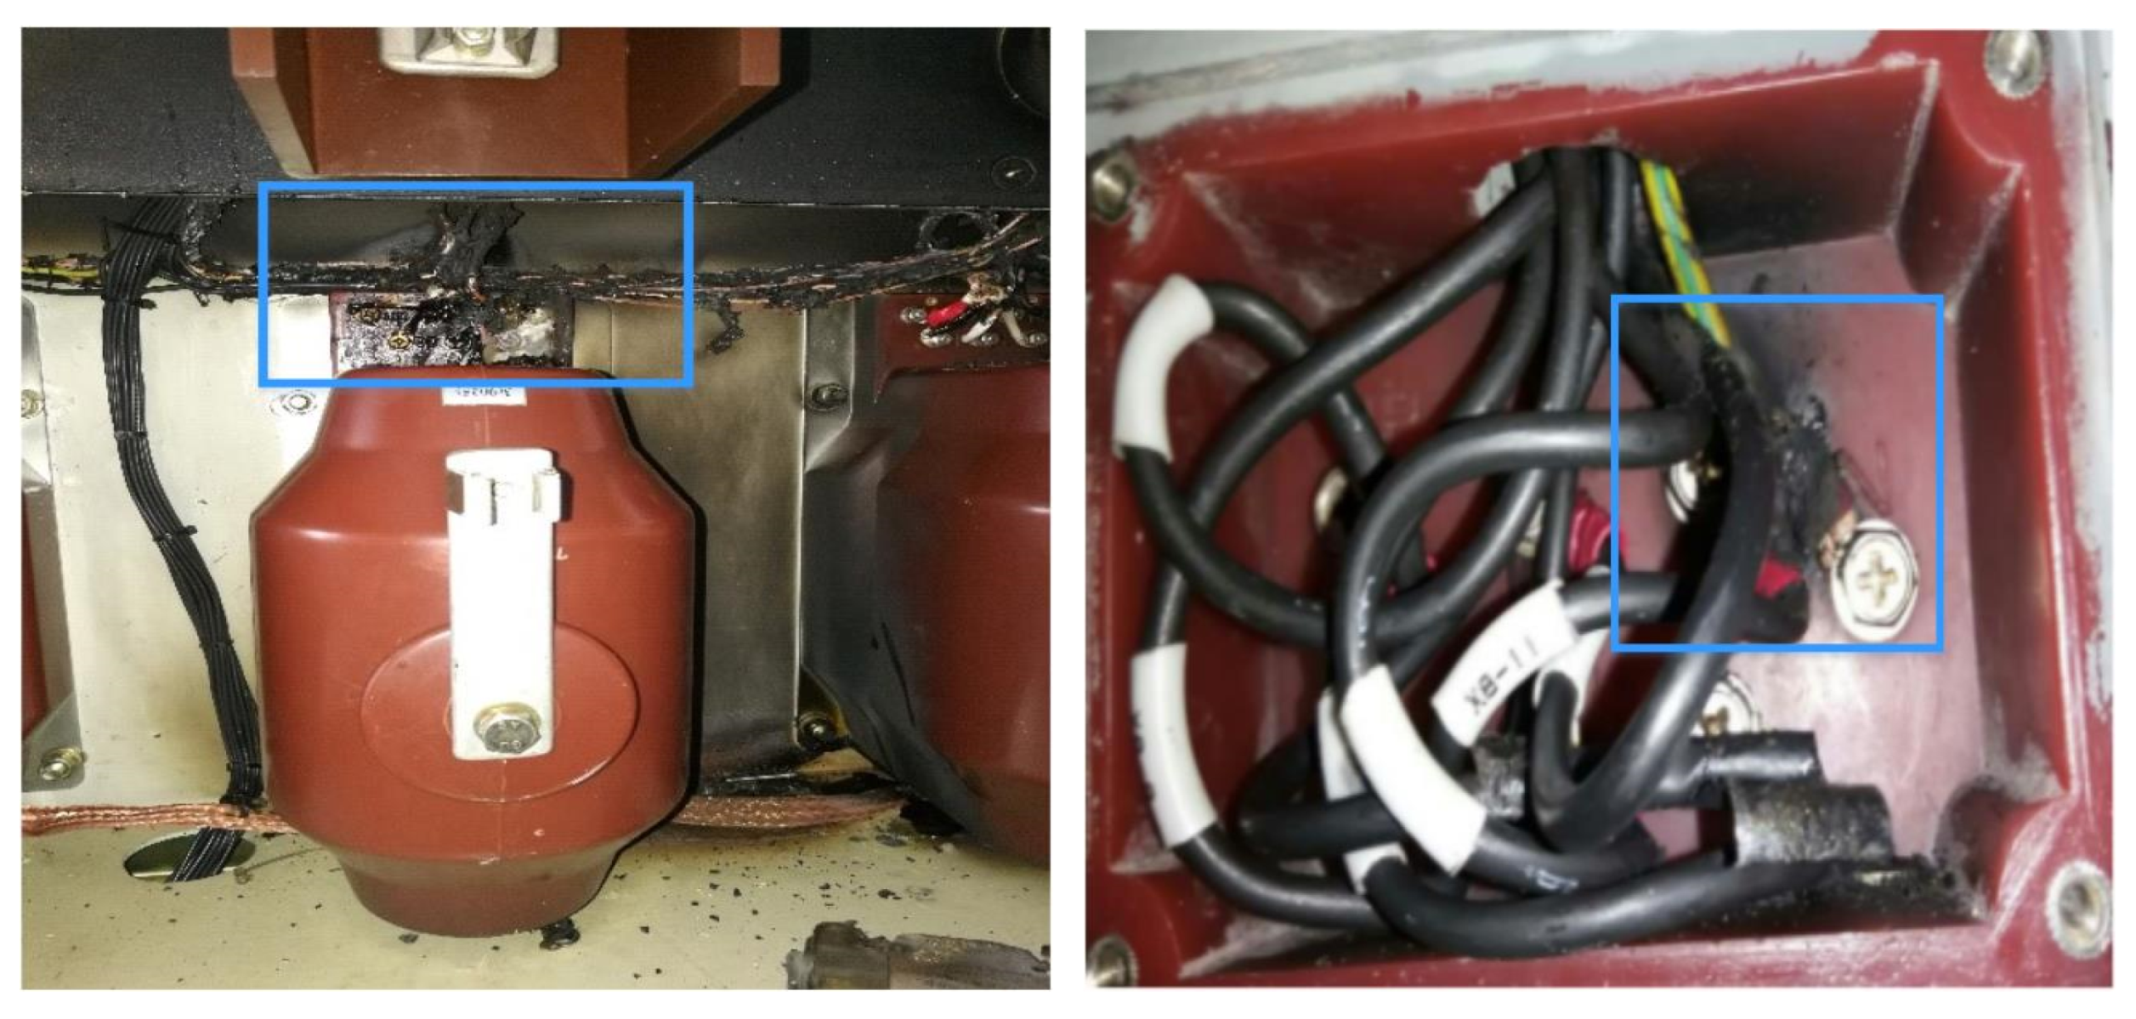
A voltage transformer group equipped with a primary harmonic elimination device is prone to generating a short-time power frequency overvoltage at the neutral point (N terminal), that is, at the tail end of the primary harmonic elimination device under the action of single-phase grounding (recovery), transmission overvoltage, lightning overvoltage, and operating overvoltage. The long-term effects of overvoltage will cause the insulation performance of the voltage transformer to gradually deteriorate until the insulation is destroyed completely and the transformer is damaged, as shown in
Figure 2. The voltage transformer is connected to the bus. If the fuse cannot be blown quickly, the fault is not removed, and the transformer will explode in the switchgear, which will cause the bus to be short-circuited. The transformer is then impacted by the short-circuit current, which seriously affects the safe and stable operation of the power system.
Generally, deterioration of the internal insulation of a voltage transformer cannot be found easily. Because of the installation of the primary harmonic elimination device, the secondary voltage of the transformer is not abnormal, even the insulation is destroyed completely. Hence, in this paper, a small current disturbance using the zero-sequence circuit method is proposed to realize latent fault detection for winding insulation [
20]. This method uses the characteristic parameters of the low-frequency oscillation of zero-sequence voltage after a disturbance to evaluate the insulation state of the winding, and its use will reduce the number of power grid accidents caused by transformer explosion.
2. Small Current Disturbance of a Zero-Sequence Circuit
In the actual operation of a transformer, the vector sum of three-phase voltage is not zero. In the method in this study, a short-circuit switch is connected at both ends of the open triangular winding of the voltage transformer and a small current disturbance ∆
i [
21,
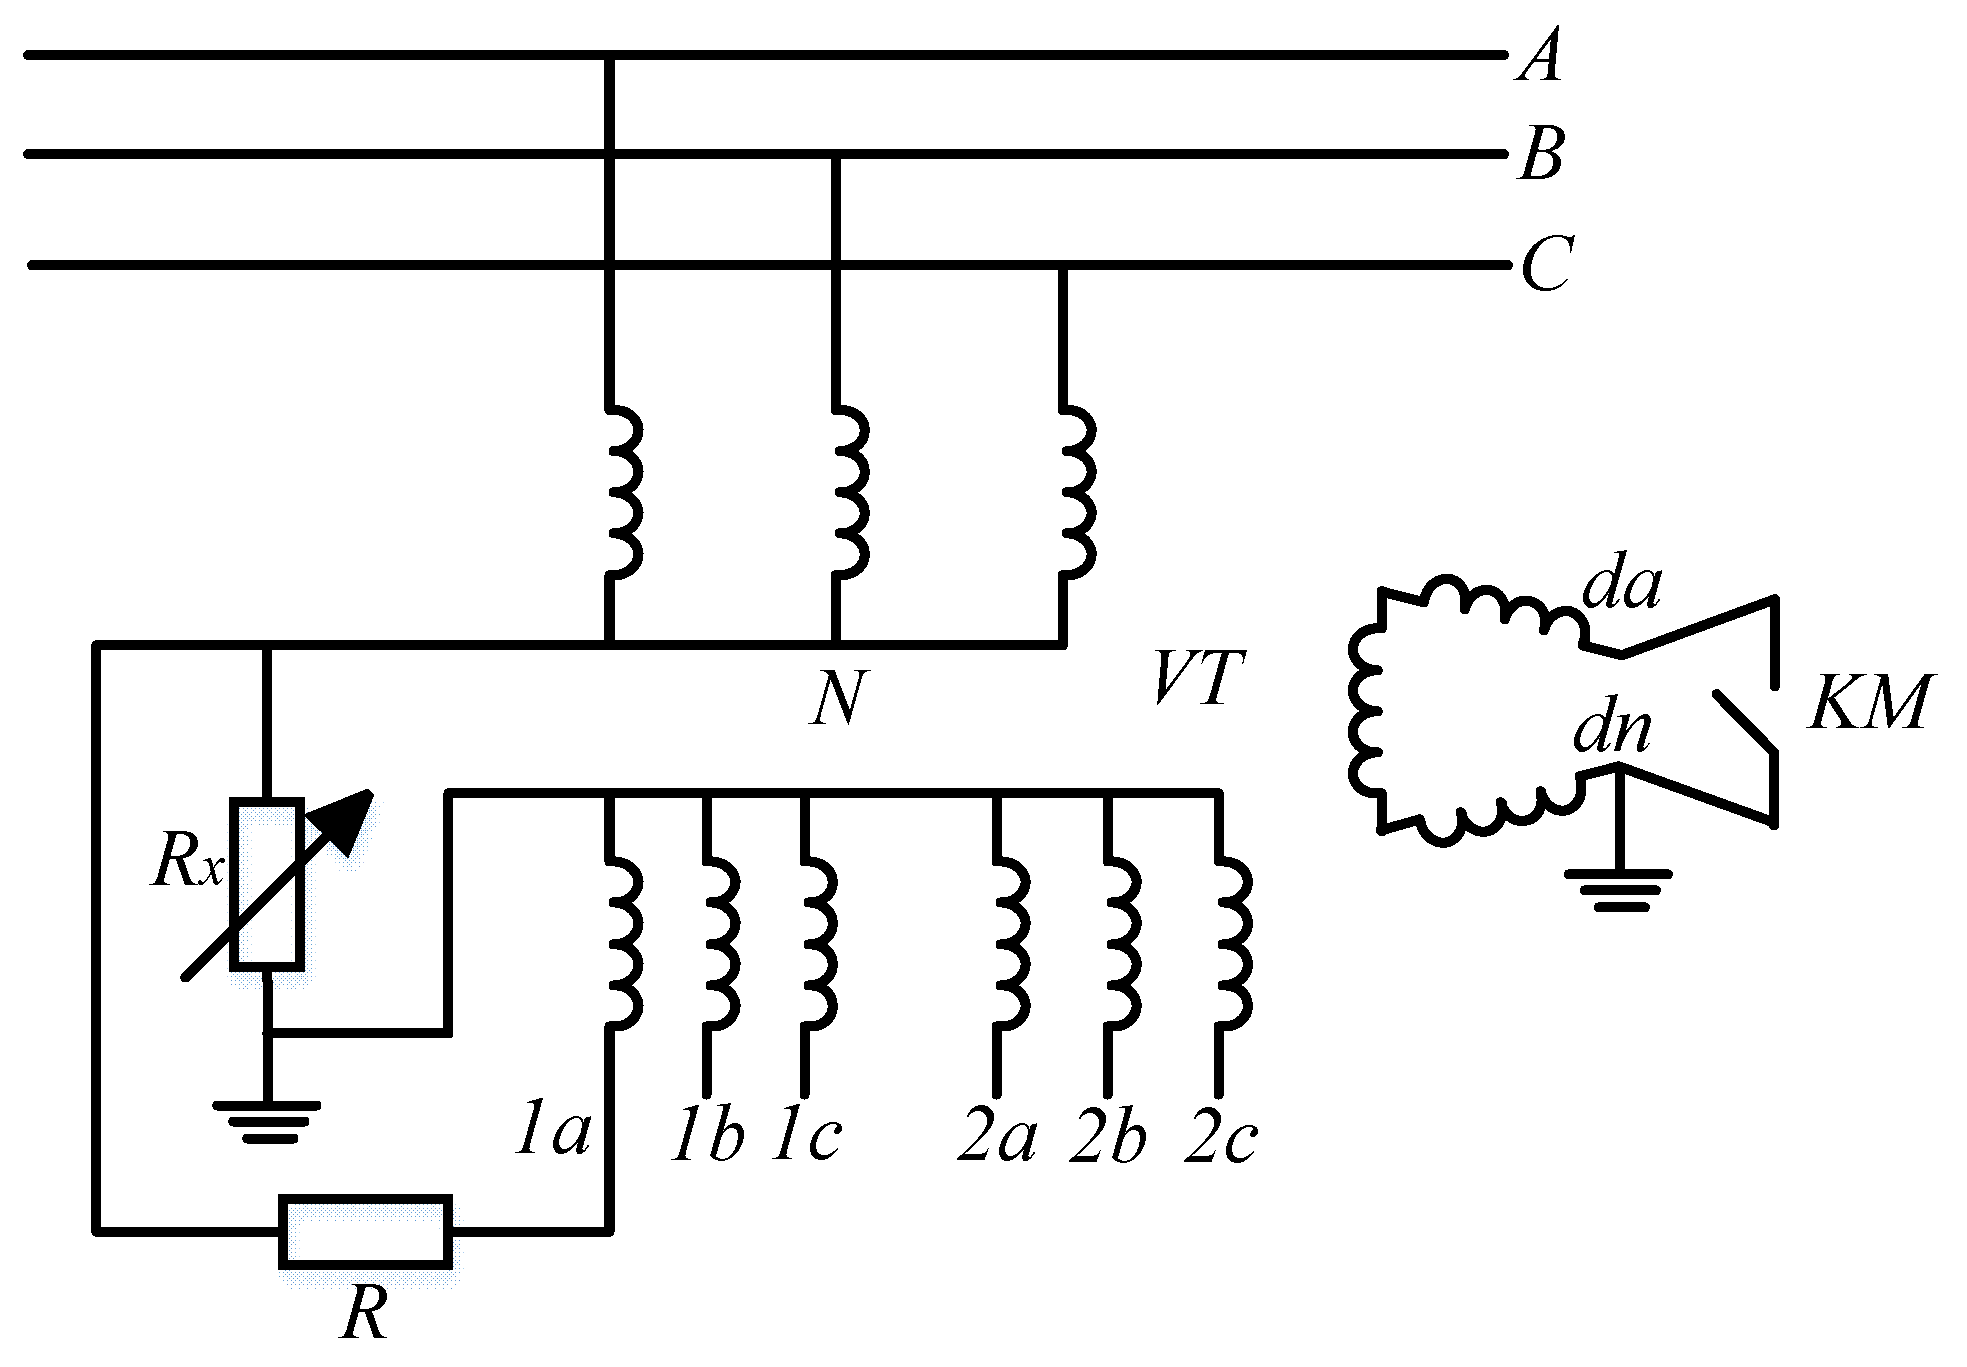
22] is applied to the zero-sequence circuit. The short-circuit switch is closed for a certain time and then opened; the three-phase voltage waveform of the measuring winding is collected and zero-sequence voltage waveform is synthesized. Then, the insulation state is evaluated using the zero-sequence voltage when the short-circuit switch is closed and the fluctuation of the zero-sequence voltage after the short-circuit switch has been opened. The principle of this method is shown in
Figure 3.
In
Figure 3, labels 1
a, 1
b, and 1
c indicate the secondary ends of the transformer; 2
a, 2
b, and 2
c are the measured windings; KM is a shorting switch;
da and
dn are the A and N ends of the open triangular winding of the voltage transformer;
Rx is a harmonic elimination device; and
R is the insulation resistance between the voltage transformer (VT) ground
N end and the secondary 1
a end. If the insulation of the VT winding deteriorates,
R will be greatly reduced. The equivalent model is shown in
Figure 4.
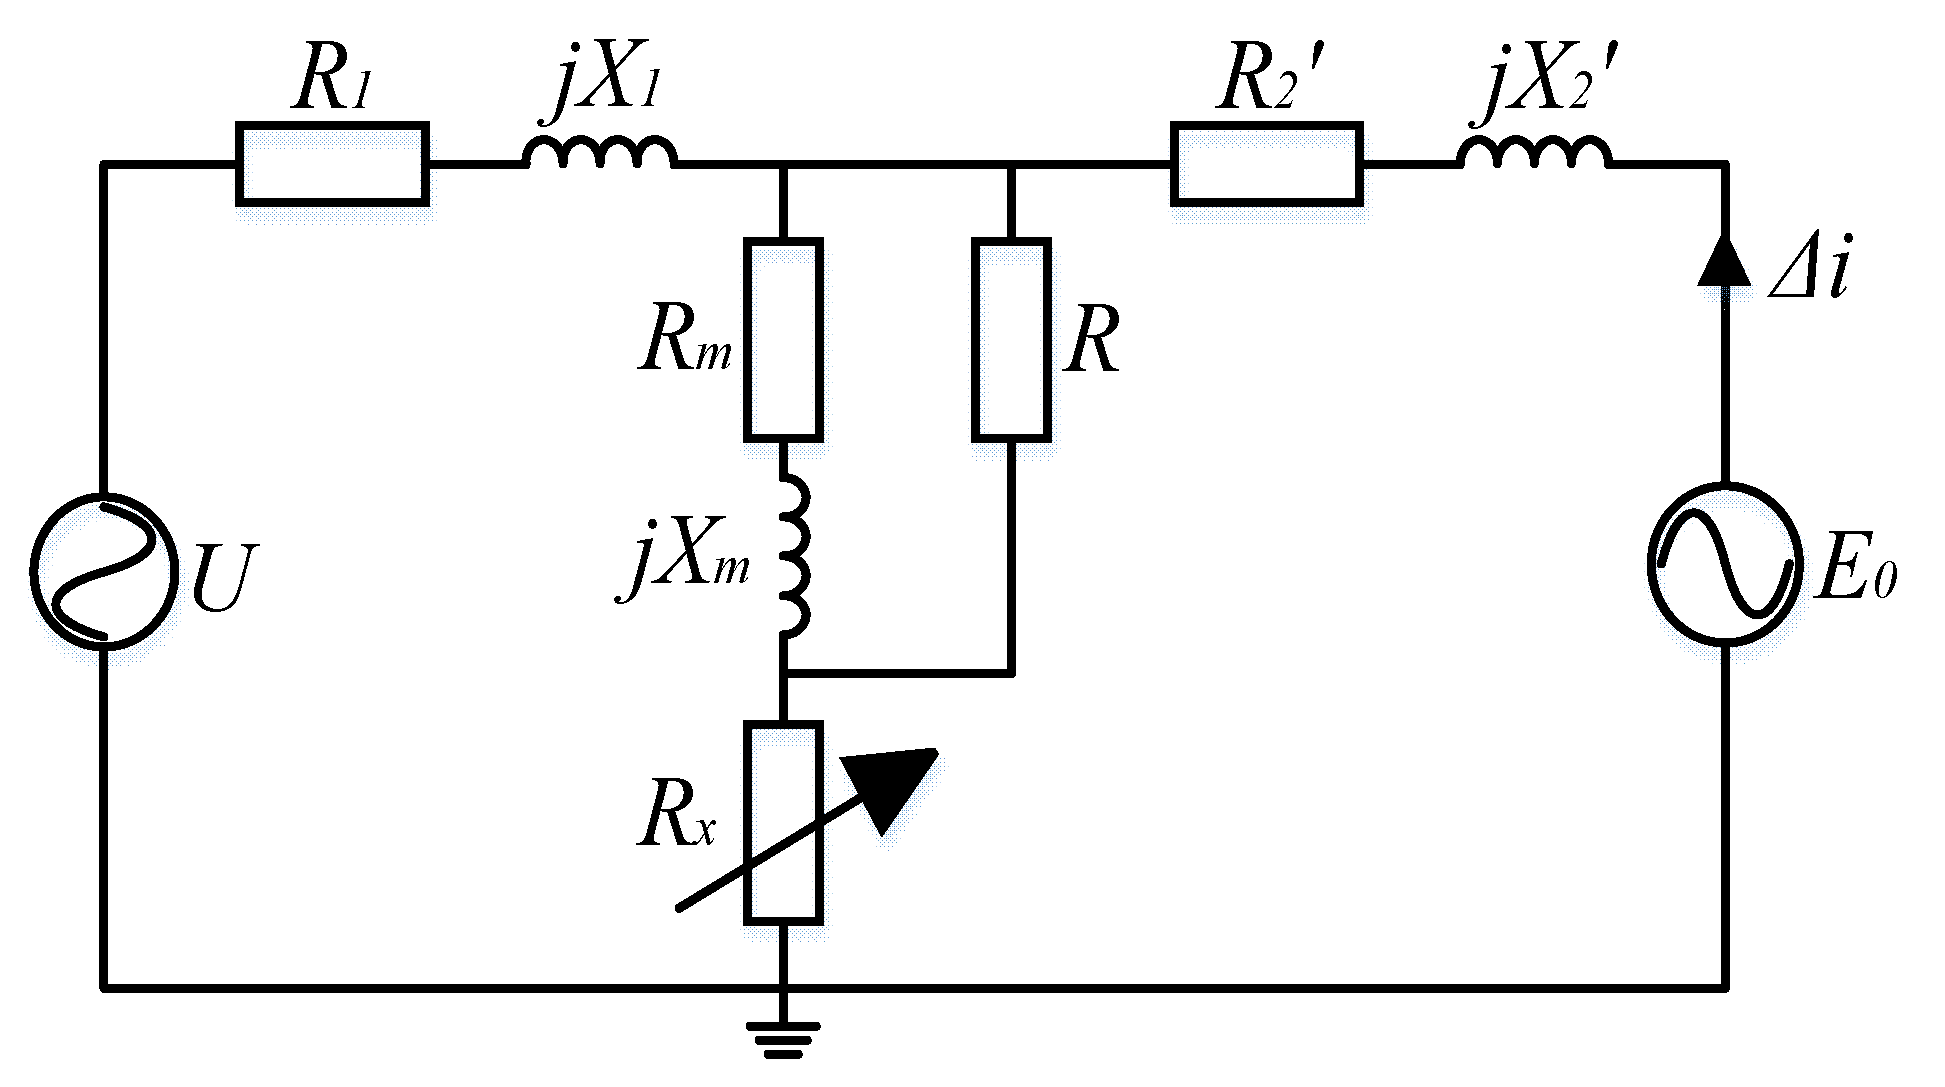
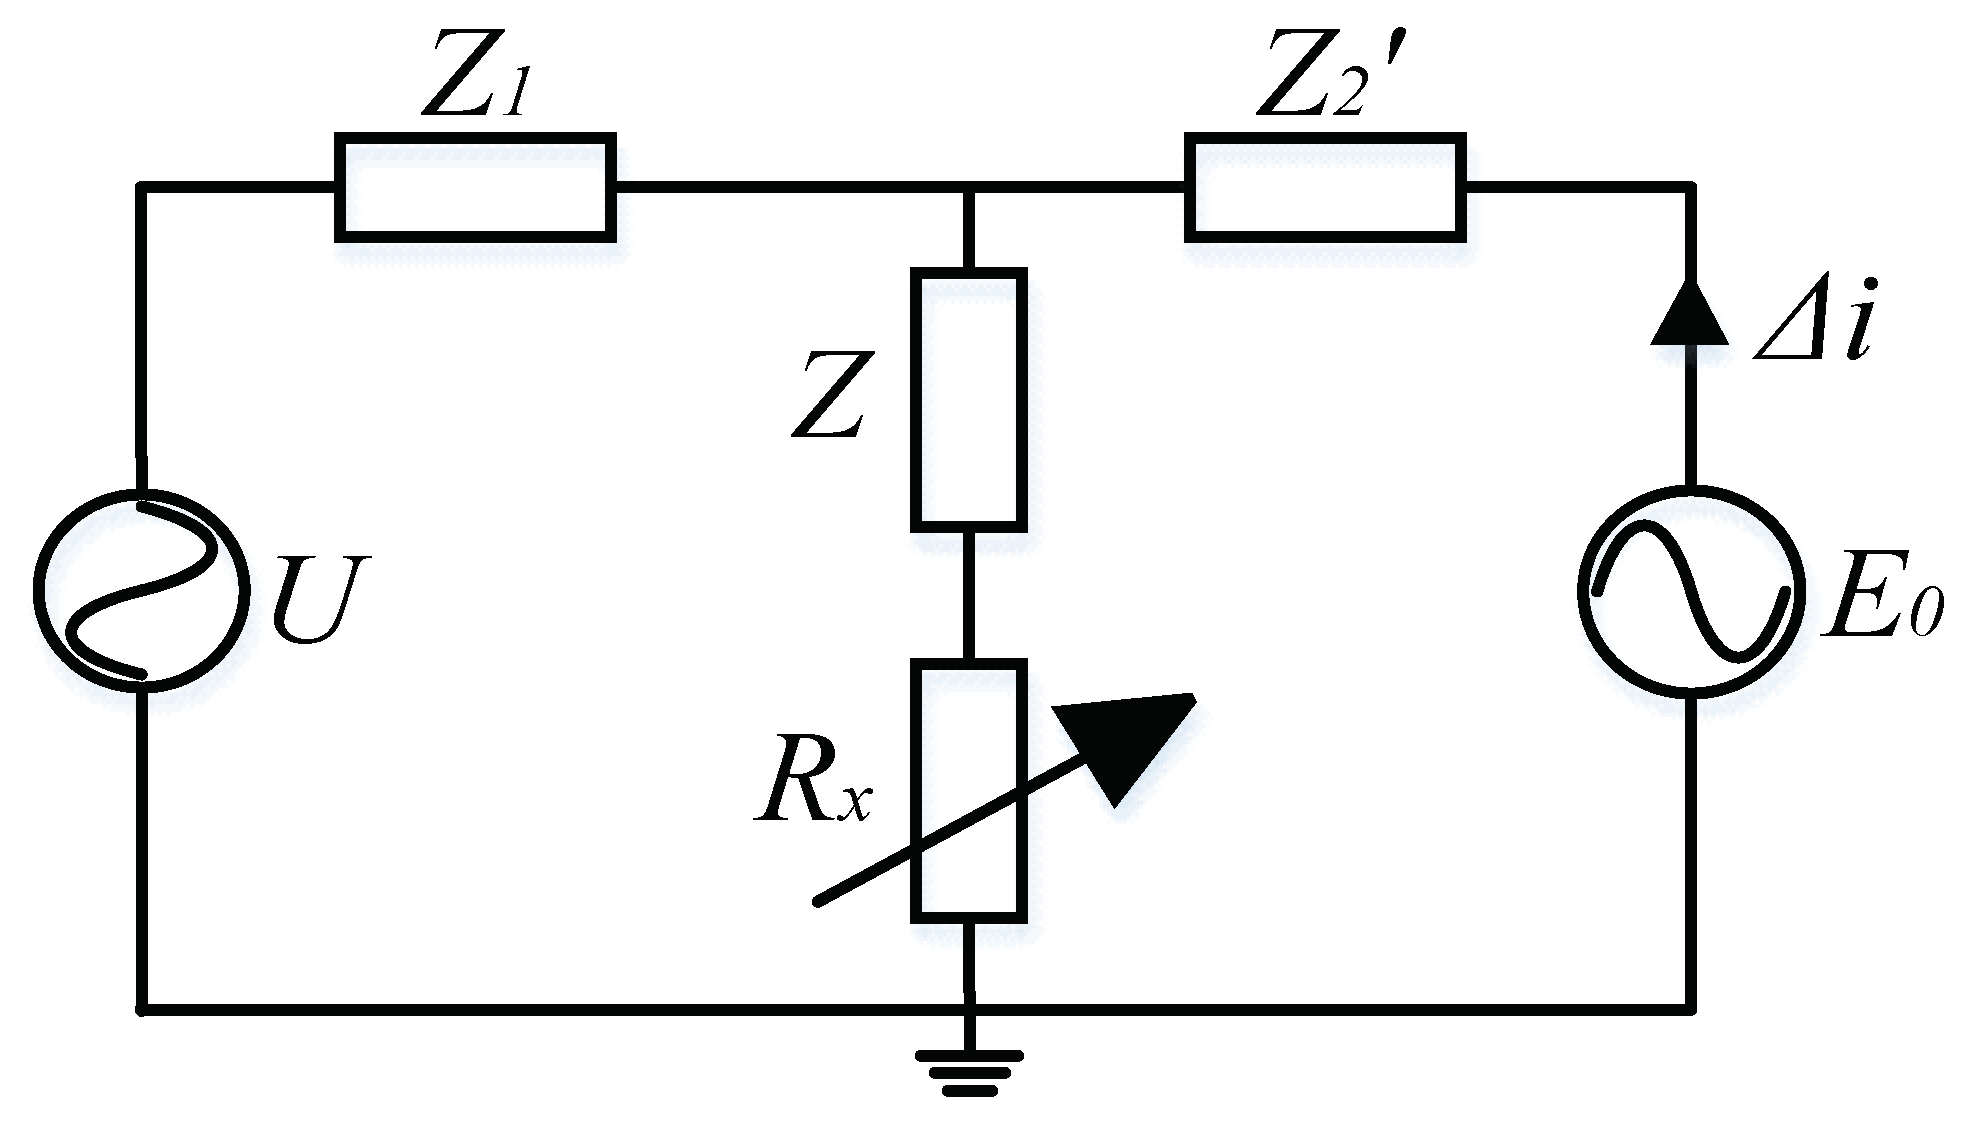
In
Figure 4,
is the injection source of a small current disturbance
,
U is the primary-side voltage of the VT,
R1 and
jX1 are the primary winding resistance and leakage reactance of the transformer, respectively,
Rm and
jXm are the excitation resistance and excitation reactance of the transformer, respectively,
R2′ and
jX2′ are respectively the winding resistance and leakage reactance of the secondary side of the transformer, which is reduced to the primary side,
Rx is the resistance of the harmonic elimination device, and
R is the insulation resistance.
In the equivalent model
, let,
,
.
Figure 4 can then be simplified to
Figure 5.
In the simplified model, the opening voltage value, which is measured from the secondary side, is
before the shorting switch KM is closed and is calculated as:
Equation (1) shows that, due to the presence of harmonic eliminator , even if the insulation is completely deteriorated, that is, , hardly changes. At this time, the three-phase secondary side voltages are , and , and the zero-sequence voltage .
After the shorting switch KM is closed, a small current disturbance signal
is injected, and the opening voltage value measured from the secondary side is
. If the current flowing into the
branch is
and the current flowing into the
branch is
, then:
After the short-circuit switch KM is broken, the small current disturbance signal
will not disappear immediately, and a circulation will be formed in the VT primary circuit until the power signal is absorbed. At this time, the voltage value measured from the secondary side is
. The superposition of the primary side voltage
and the small current disturbance signal
can be obtained as follows:
At this time, the three-phase secondary side opening voltages are
,
and
, and the zero-sequence voltage is:
Equation (7) shows that when the winding insulation is damaged, (or ) decreases, and then the zero-sequence voltage disappears eventually as the vibration of the small current disturbance signal attenuates.
3. Secondary Voltage Value of VT
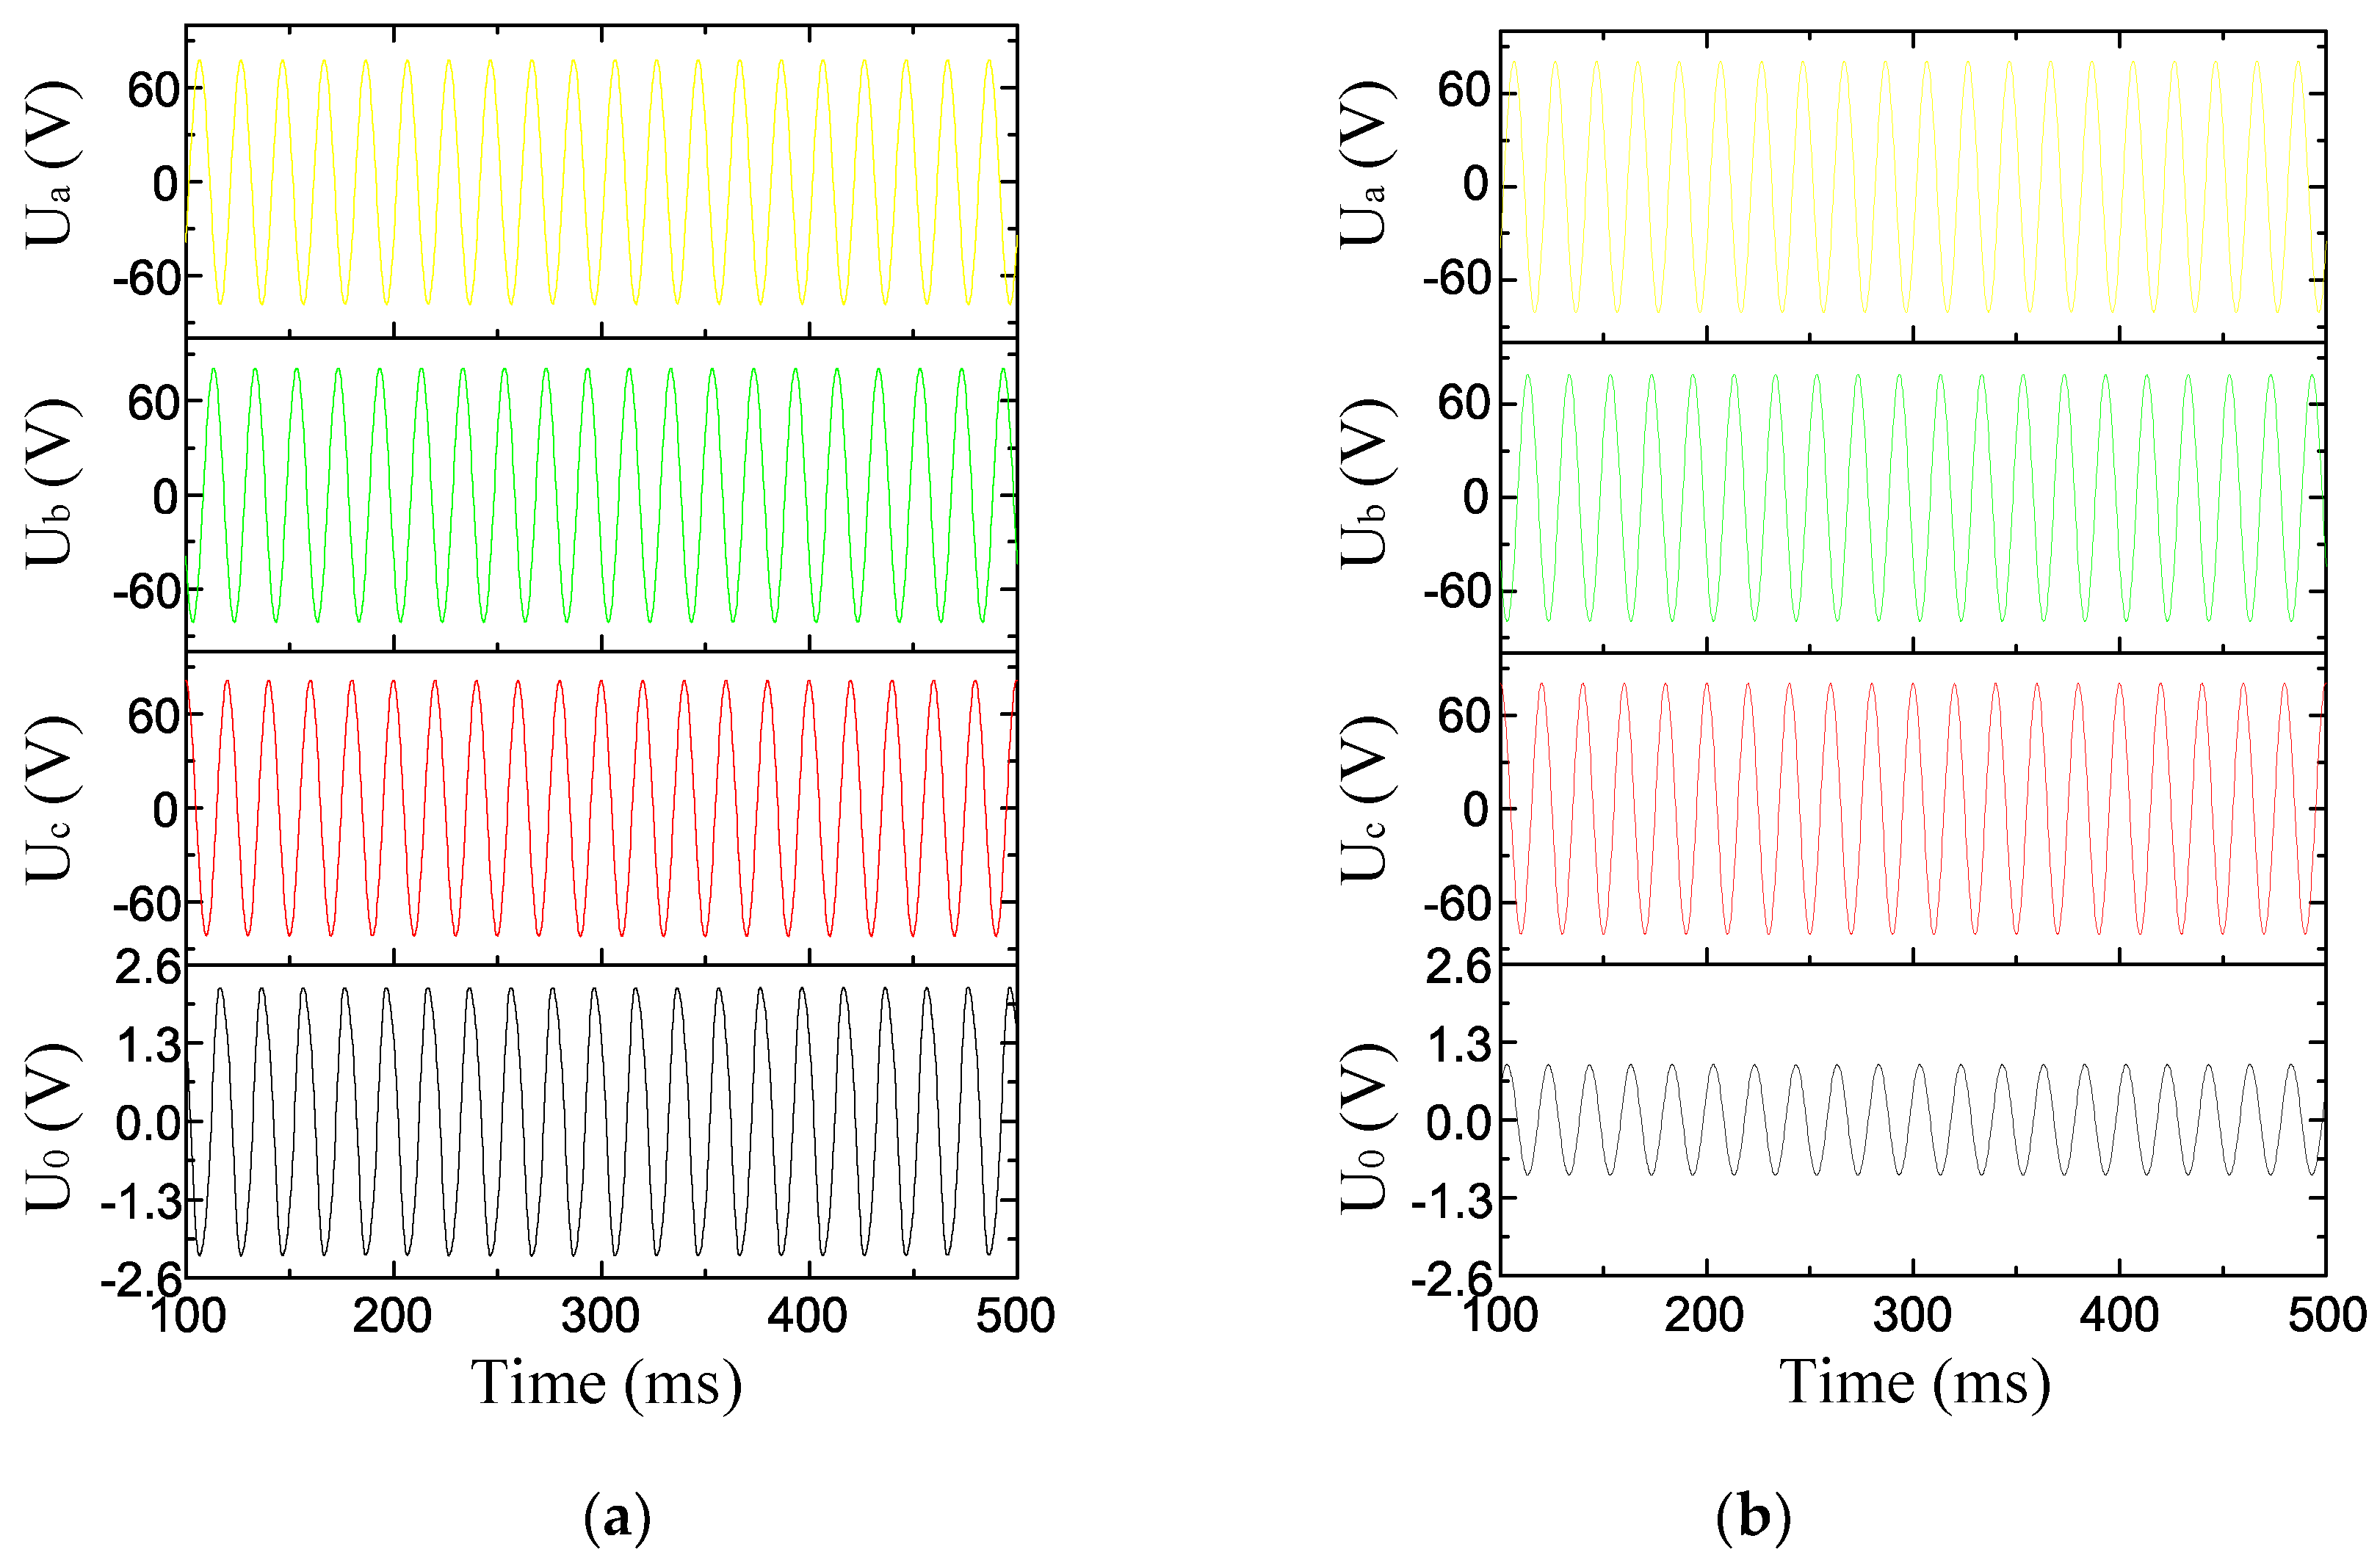
When the VT is operating normally, that is, the zero-sequence circuit is not applying a small current disturbance signal ∆
i, the three-phase voltage and zero-sequence voltage obtained from the secondary end of the VT are measured. The values obtained when the insulation at the end of the transformer winding is normal and in breakdown (the resistance between N and 1
a is zero) are compared in
Figure 6.
When the insulation is normal, the three-phase voltage (secondary) effective values are 55.16 V, 57.28 V, and 57.7 V, and the zero-sequence voltage is 1.56 V. When the insulation is in breakdown, the three-phase voltage (secondary) effective values are 57.07 V, 56.08 V, and 57.07 V, and the zero-sequence voltage is 0.64 V. The amplitude changes between the two states are not obvious.
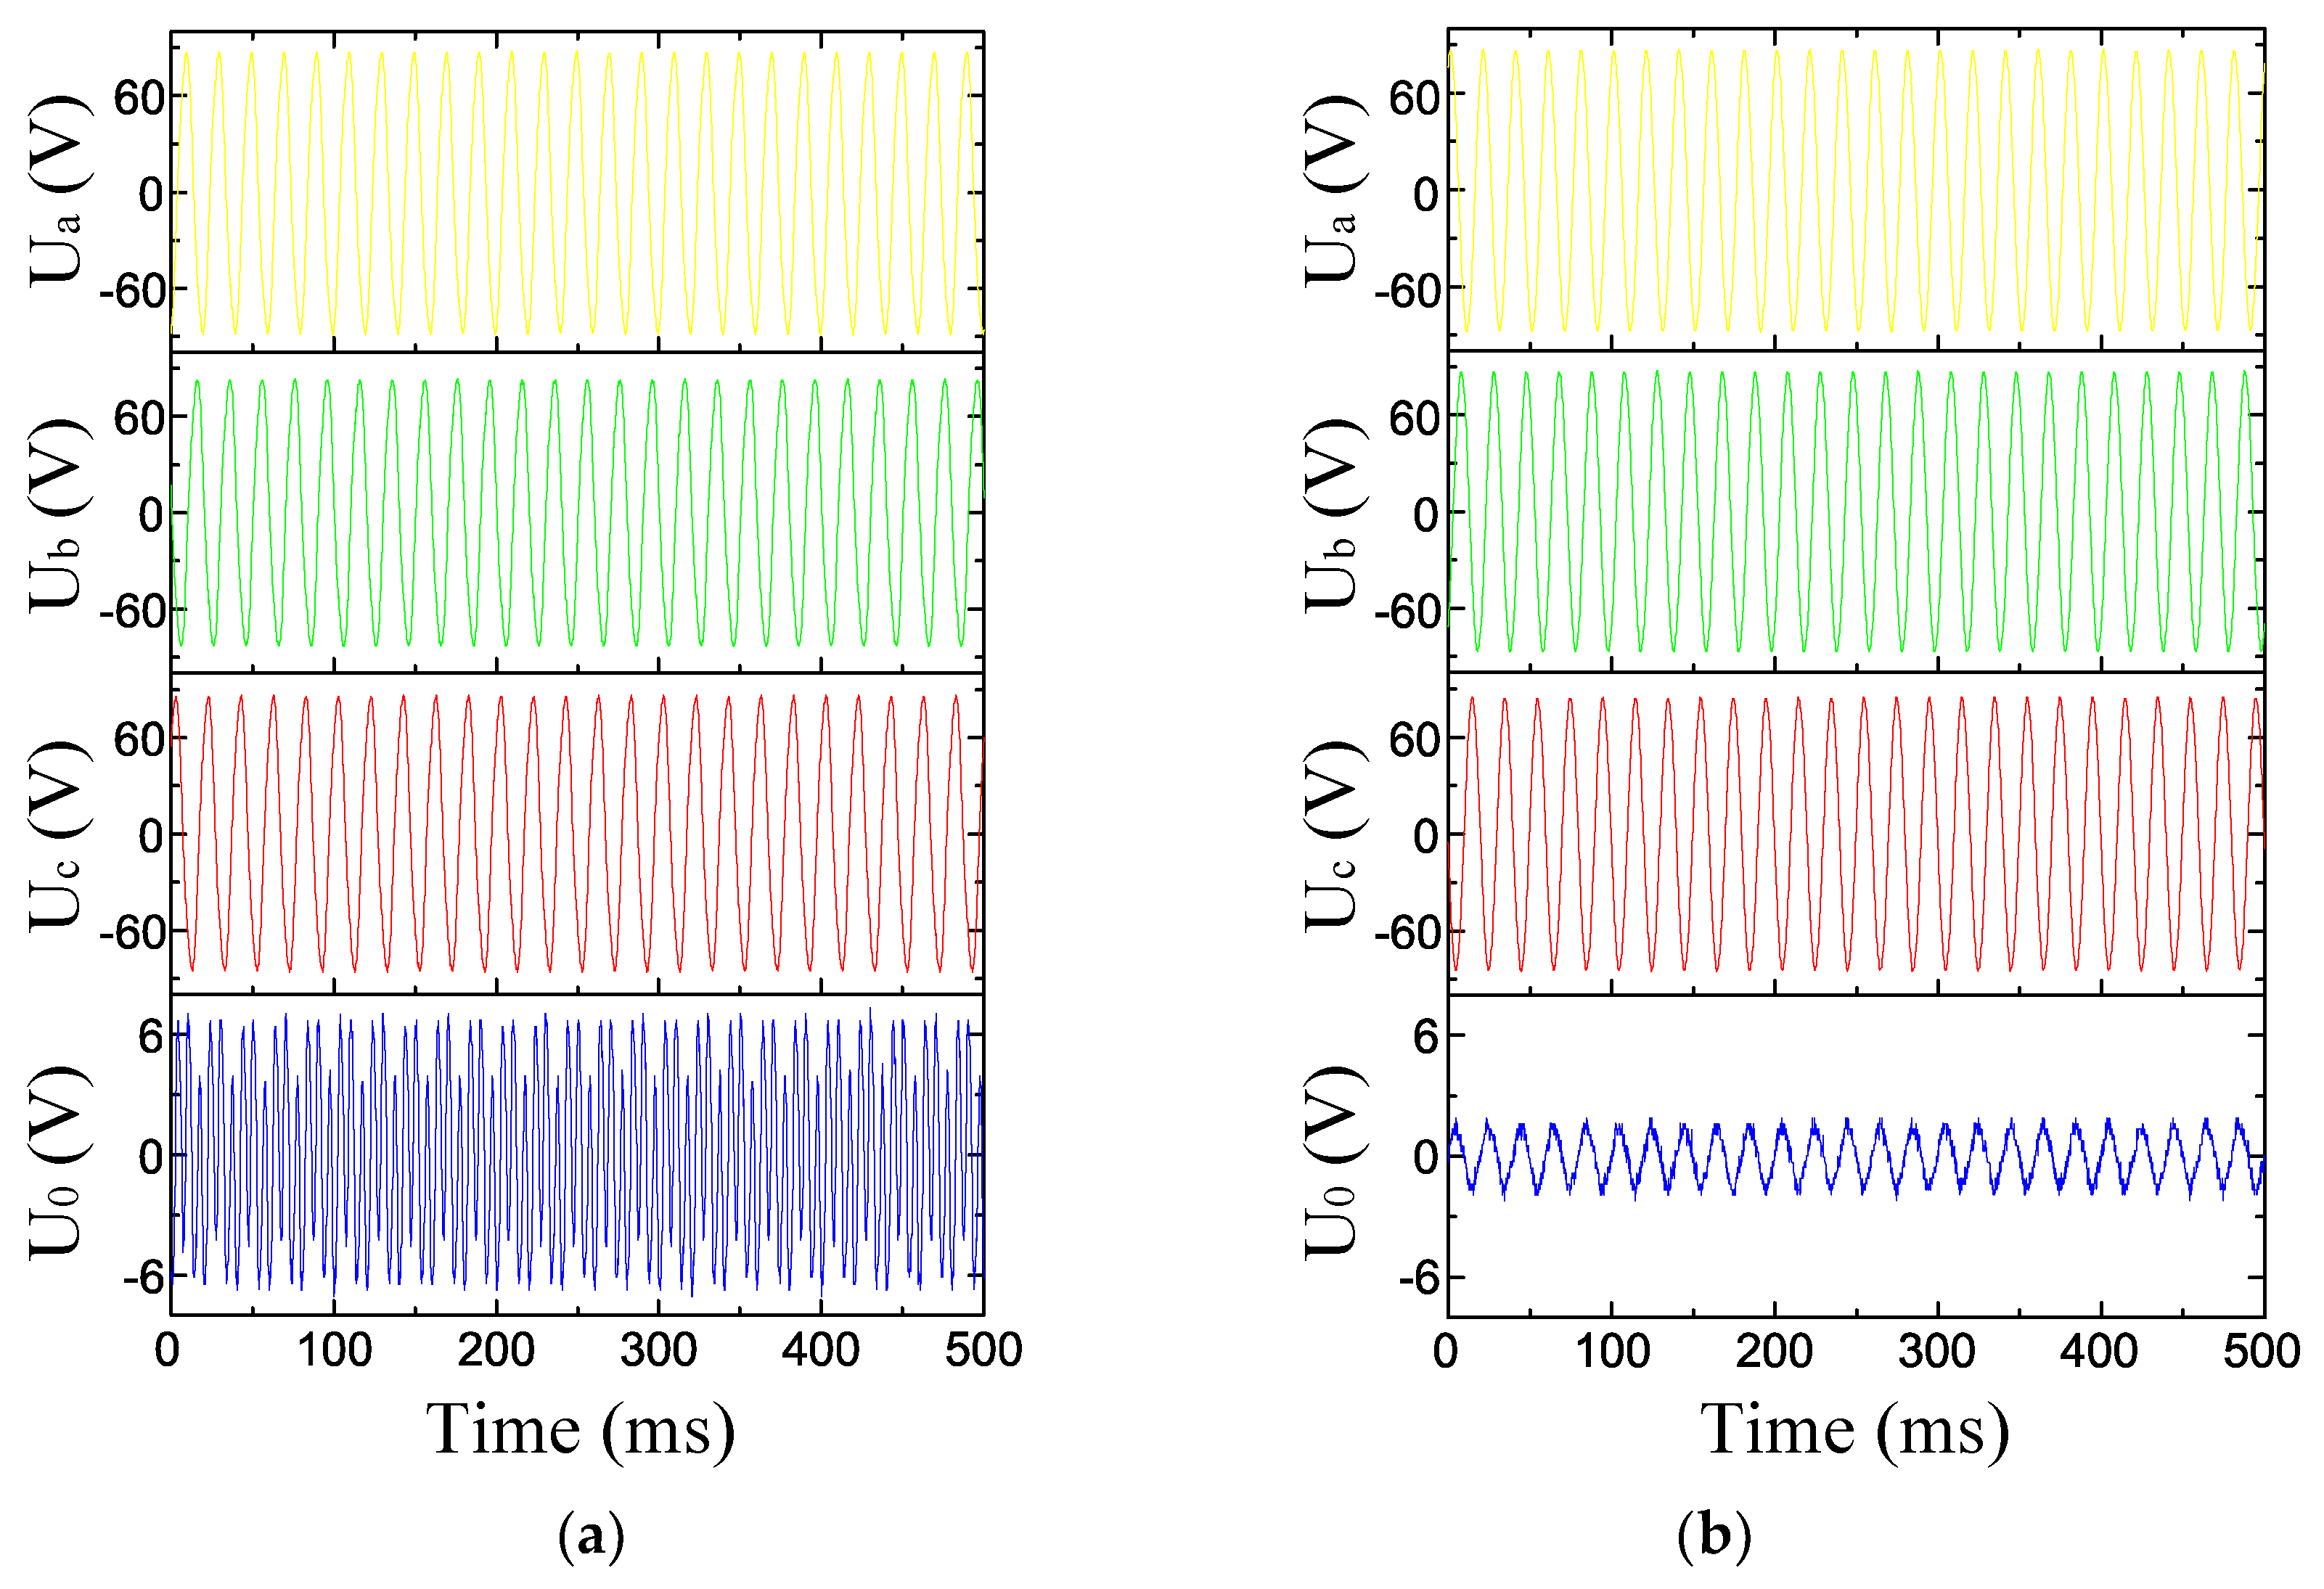
Figure 7 shows the test results of the three-phase voltage and the zero-sequence voltage obtained from the secondary end of the VT when the insulation states of the VT ground N end are normal and in breakdown. When the insulation is normal, the three-phase voltage (secondary) effective values are 61.33 V, 59.57 V, and 59.72 V, and the zero-sequence voltage is 4.3 V. When the insulation is in breakdown, the three-phase voltage (secondary) effective values are 61.33 V, 61.07 V, and 58.92 V, and the zero-sequence voltage is 1.08 V. The amplitude changes between the two states are also not obvious.
The results of the above simulation and test show that the VT operates normally because of the existence of the harmonic elimination device whether the winding of the transformer is insulated or not. That is, the amplitude and waveform of the three-phase and zero-sequence voltages do not change obviously.
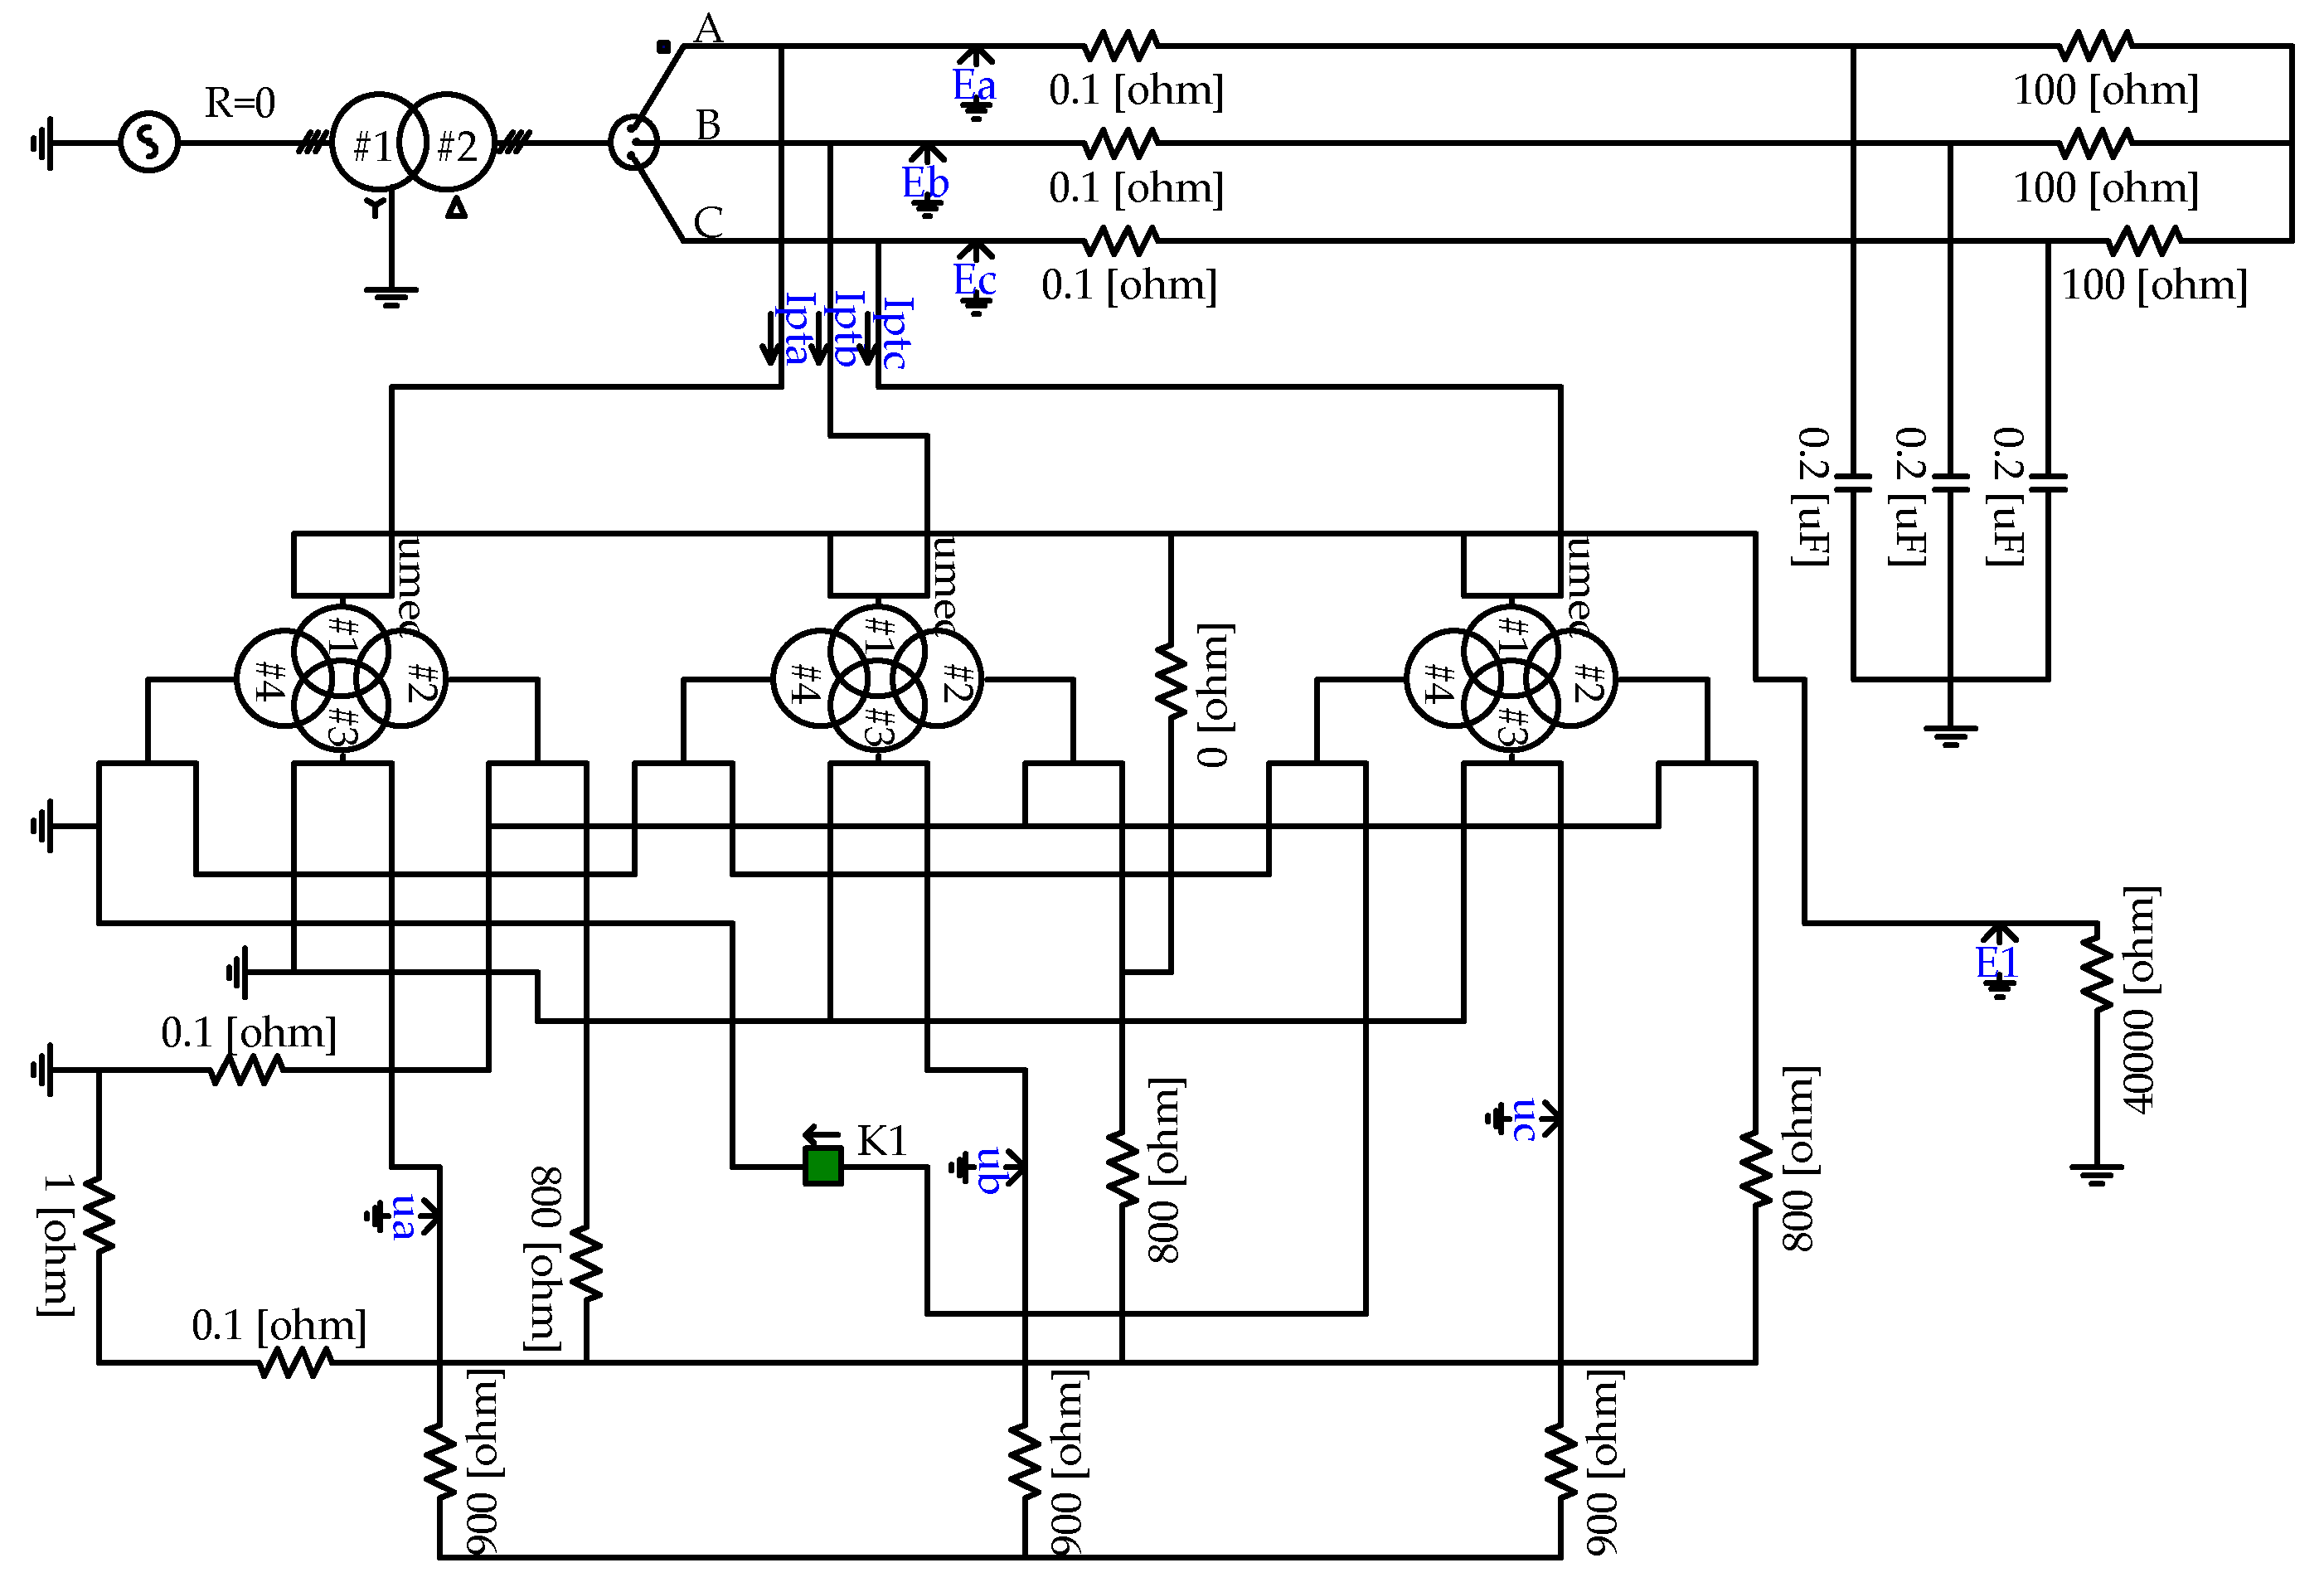
4. Test Simulation Analysis of VT Insulation
A simulation evaluation was carried out to evaluate the proposed method. The simulation model is shown in
Figure 8.
Different values of insulation resistance
R were connected to the N terminal of the VT and the secondary winding 1
a end of the B phase VT. The switch (K1) is shorted at the opening triangle of the VT. After being connected for 80 ms, the switch is opened and the zero-sequence voltage change before and after the switch has been shorted is analyzed. The capacitance in
Figure 8 is the capacitance of the line to ground, and the capacitance value is 0.2 uF. Since the ferromagnetic resonance of the distribution network occurs in the zero-sequence loop, the interphase capacitance, the bus capacitor bank and the active and reactive load in the power grid do not contribute to the resonance and can be ignored.
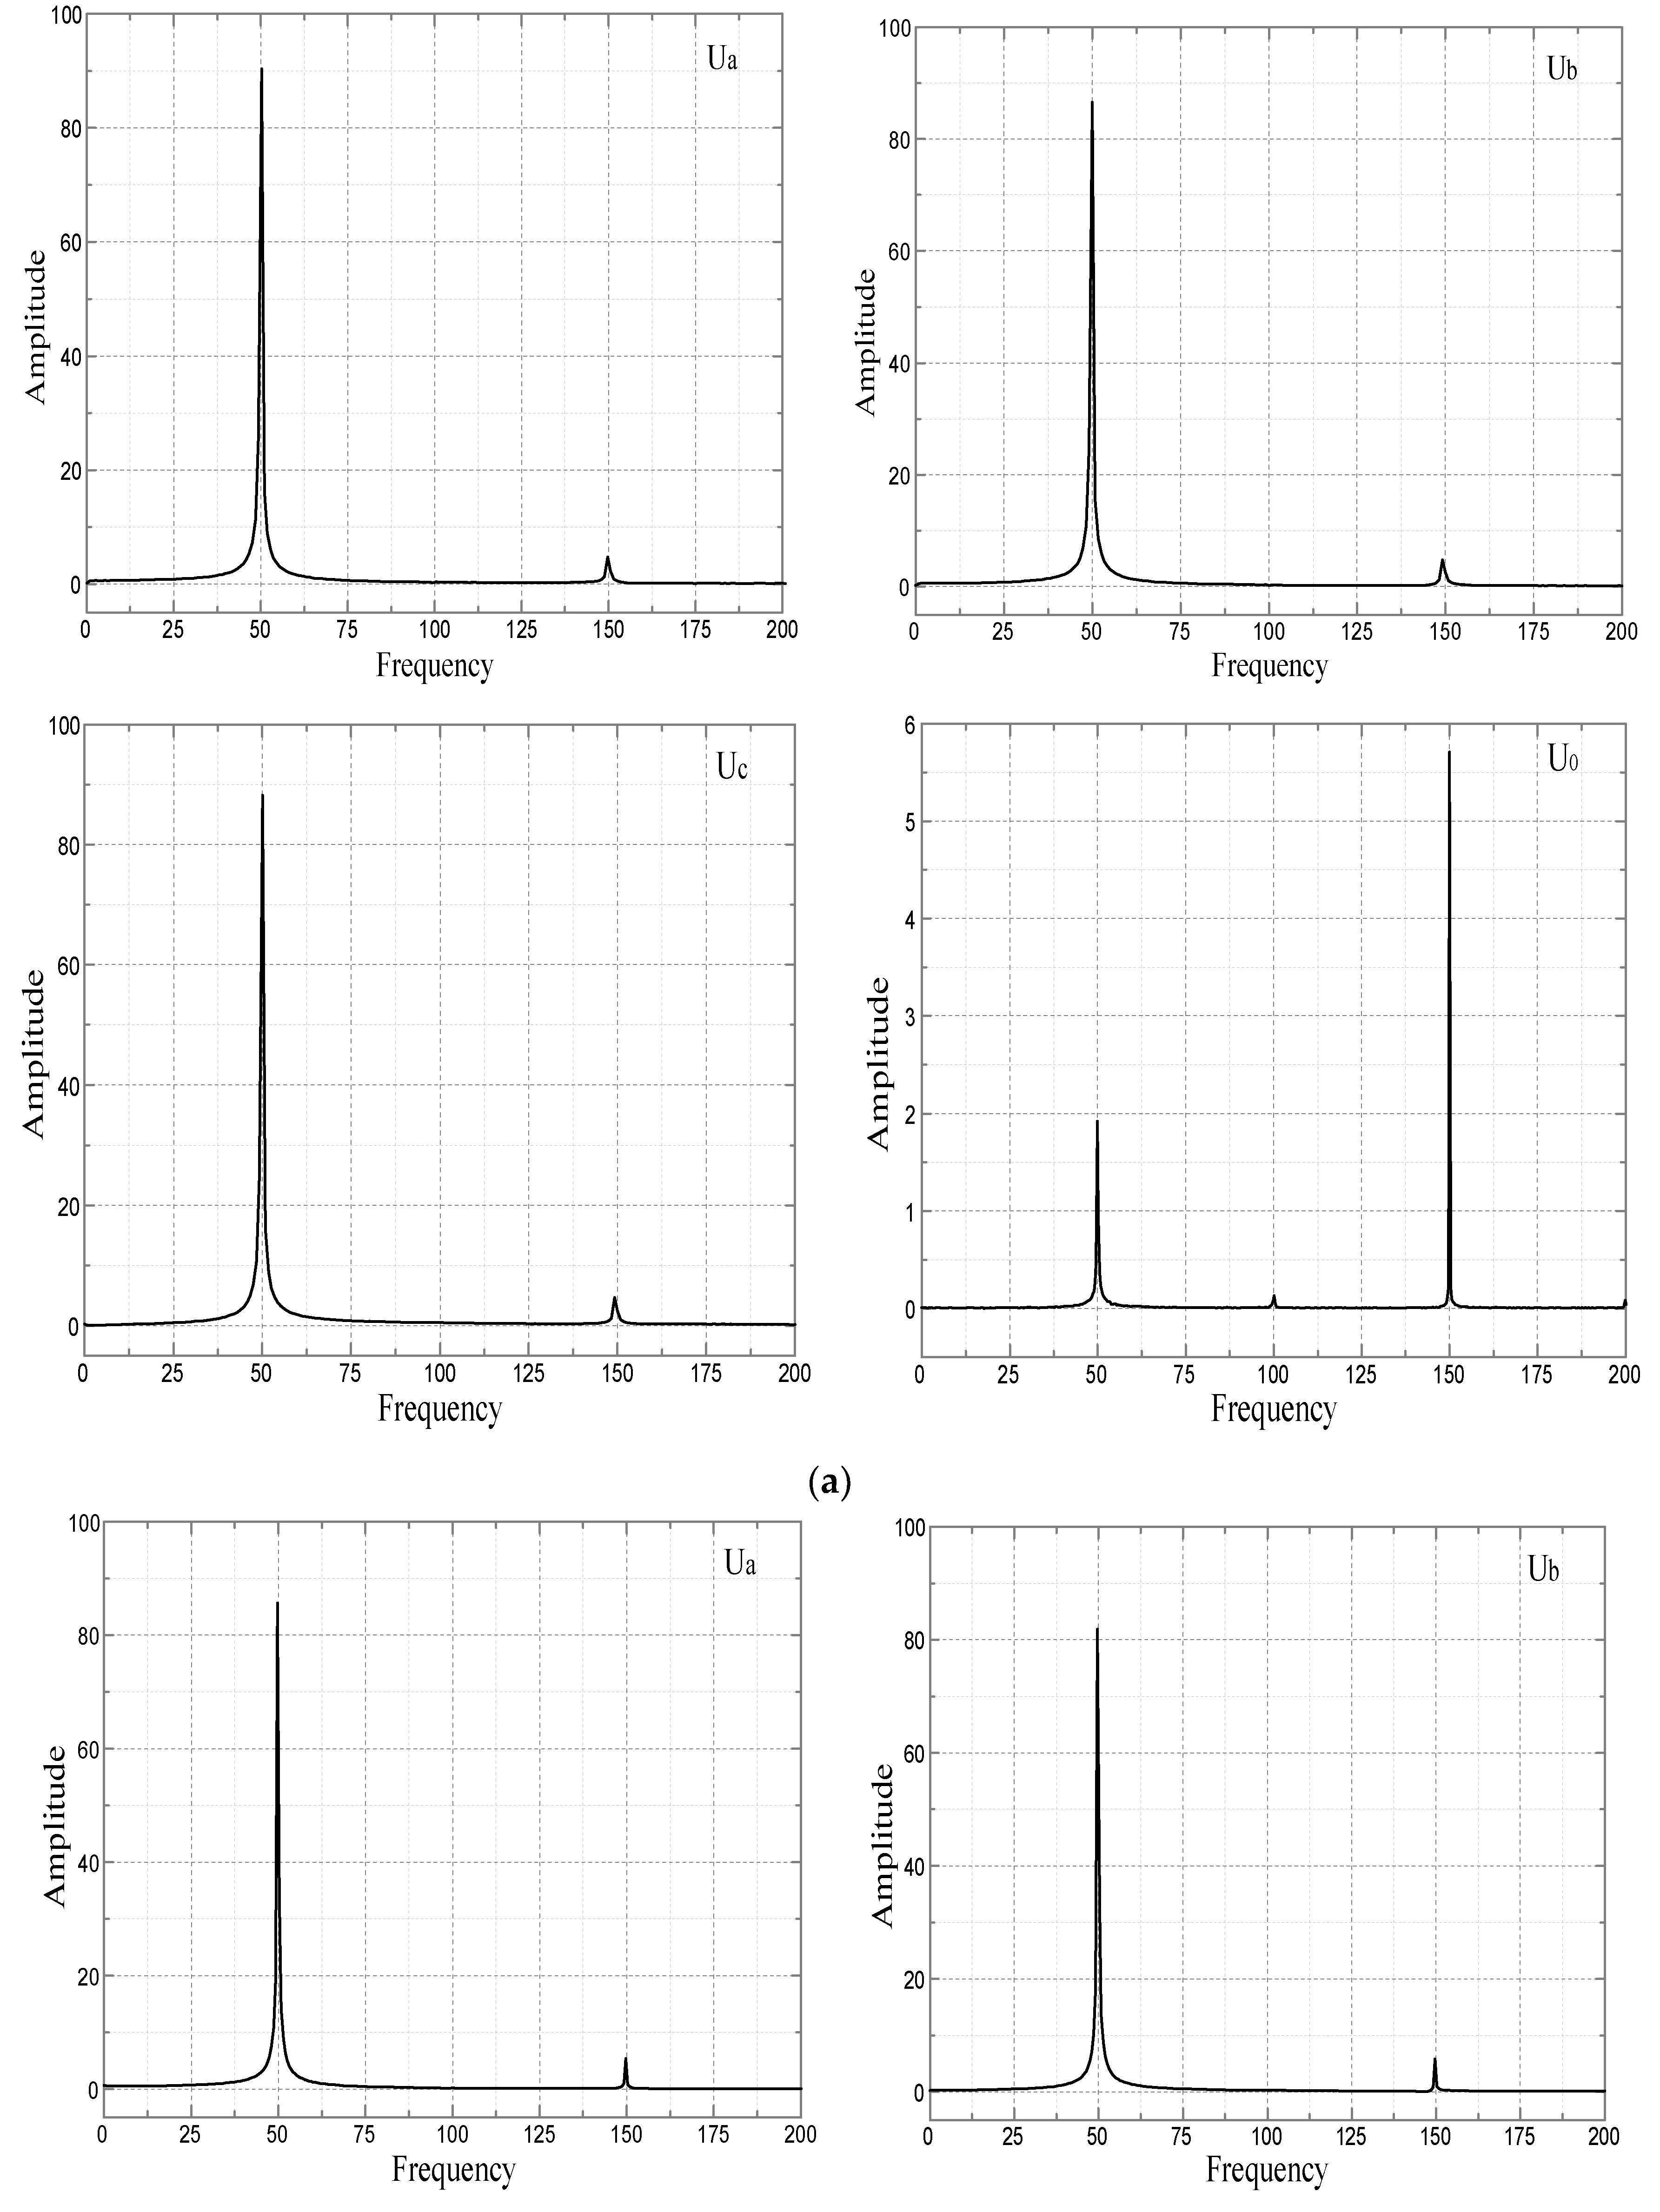
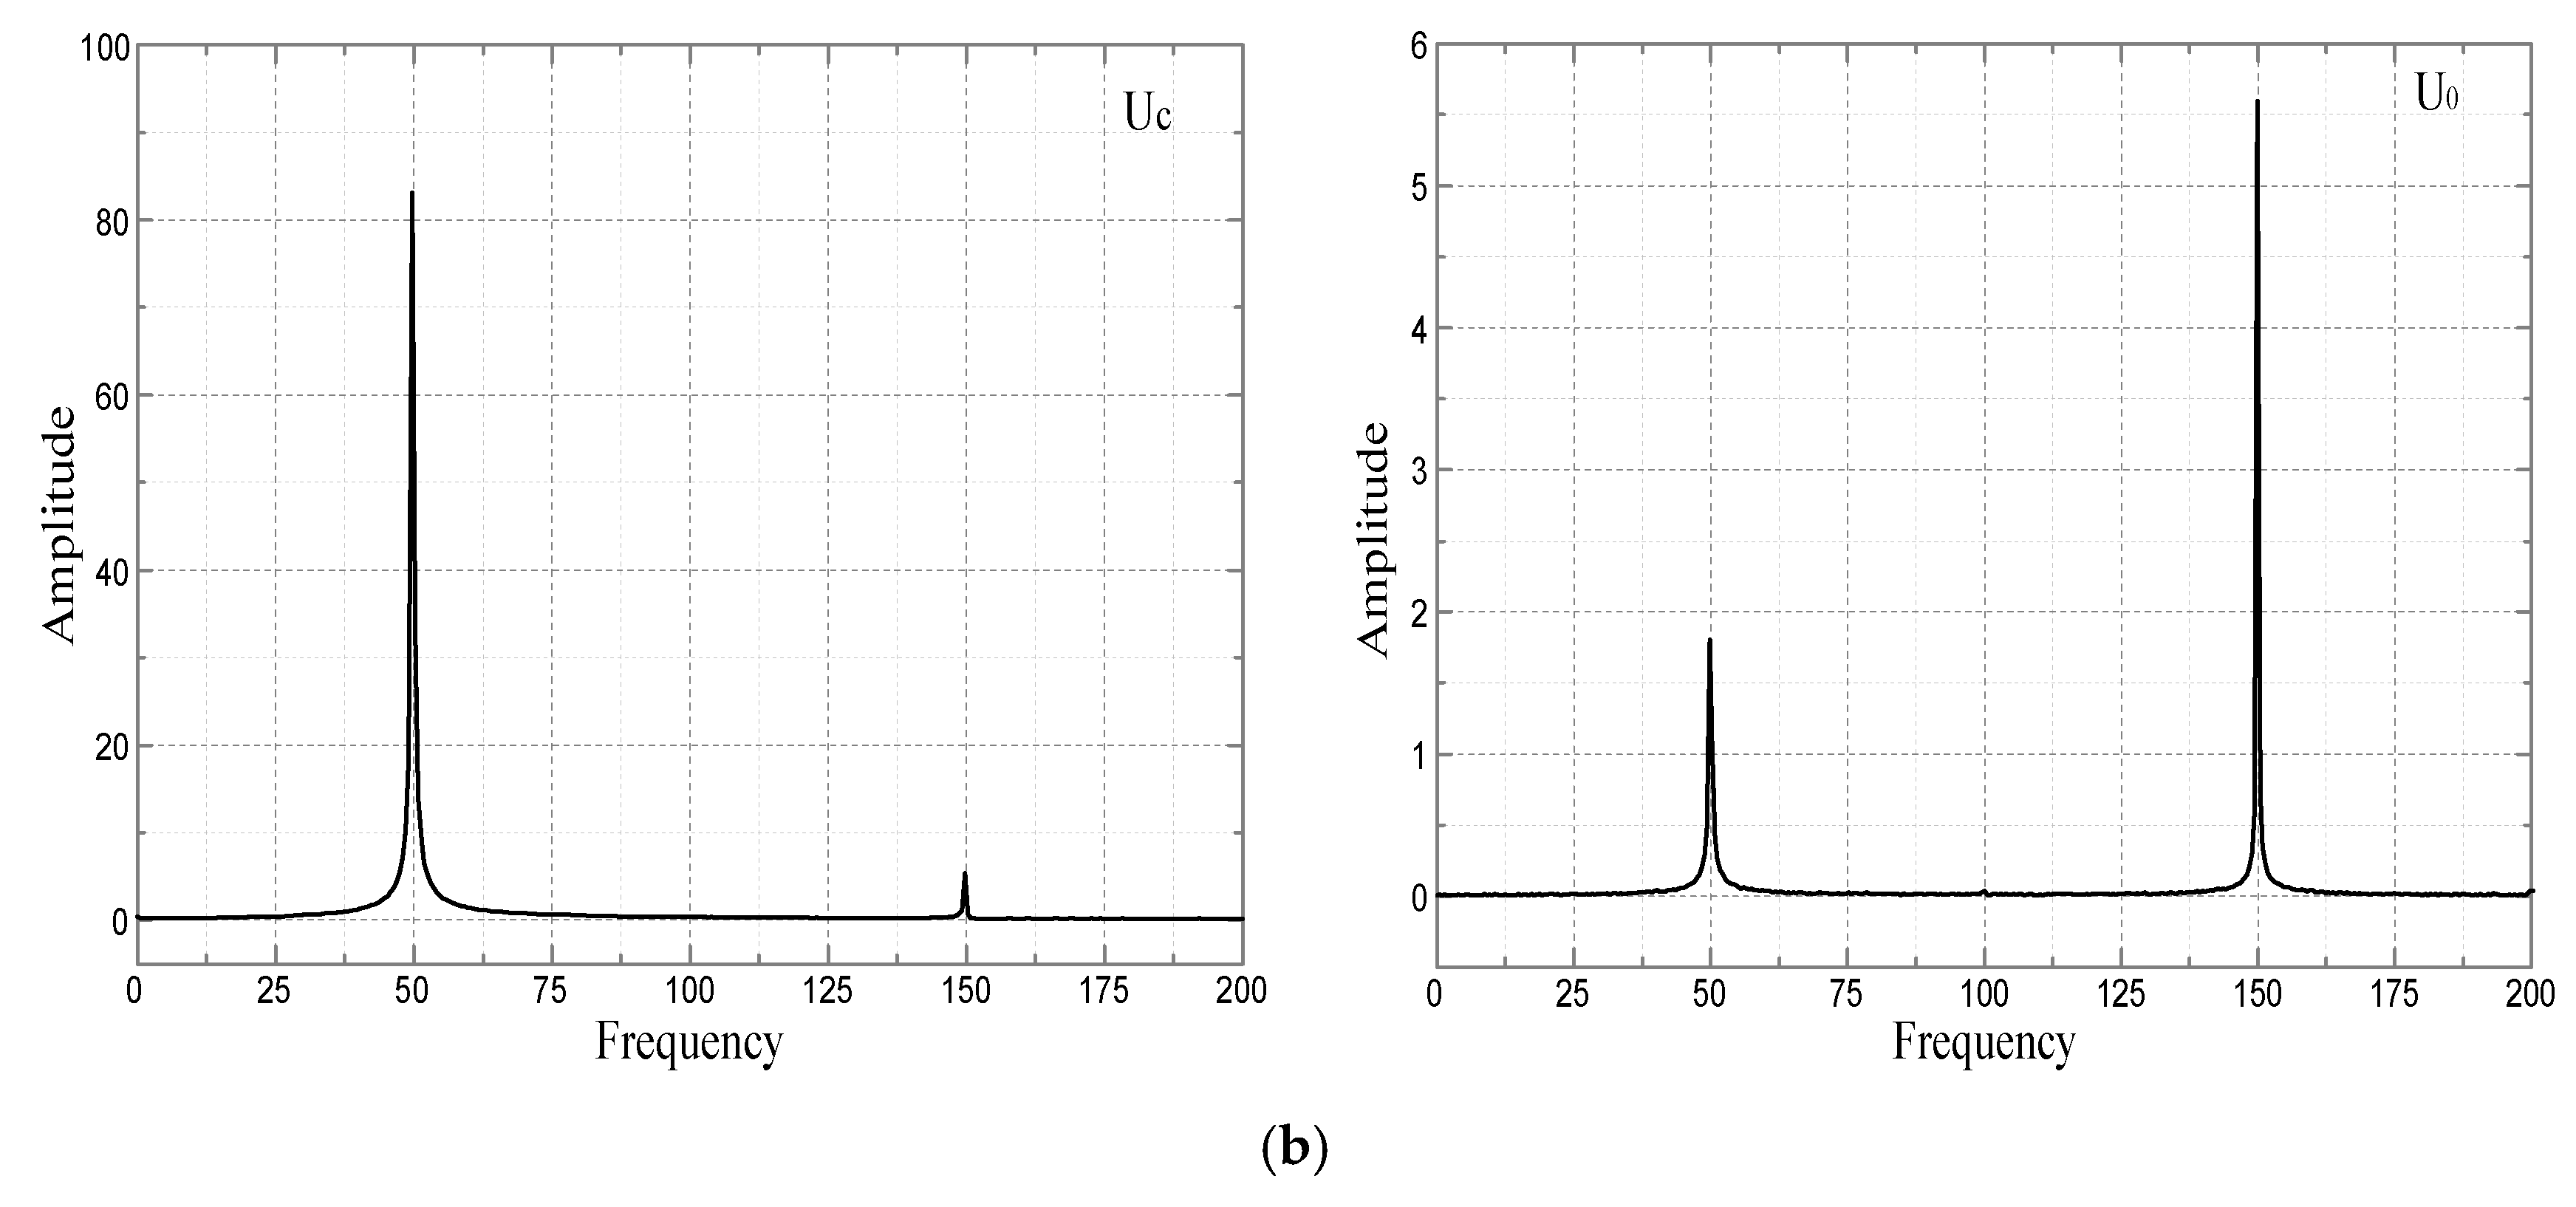
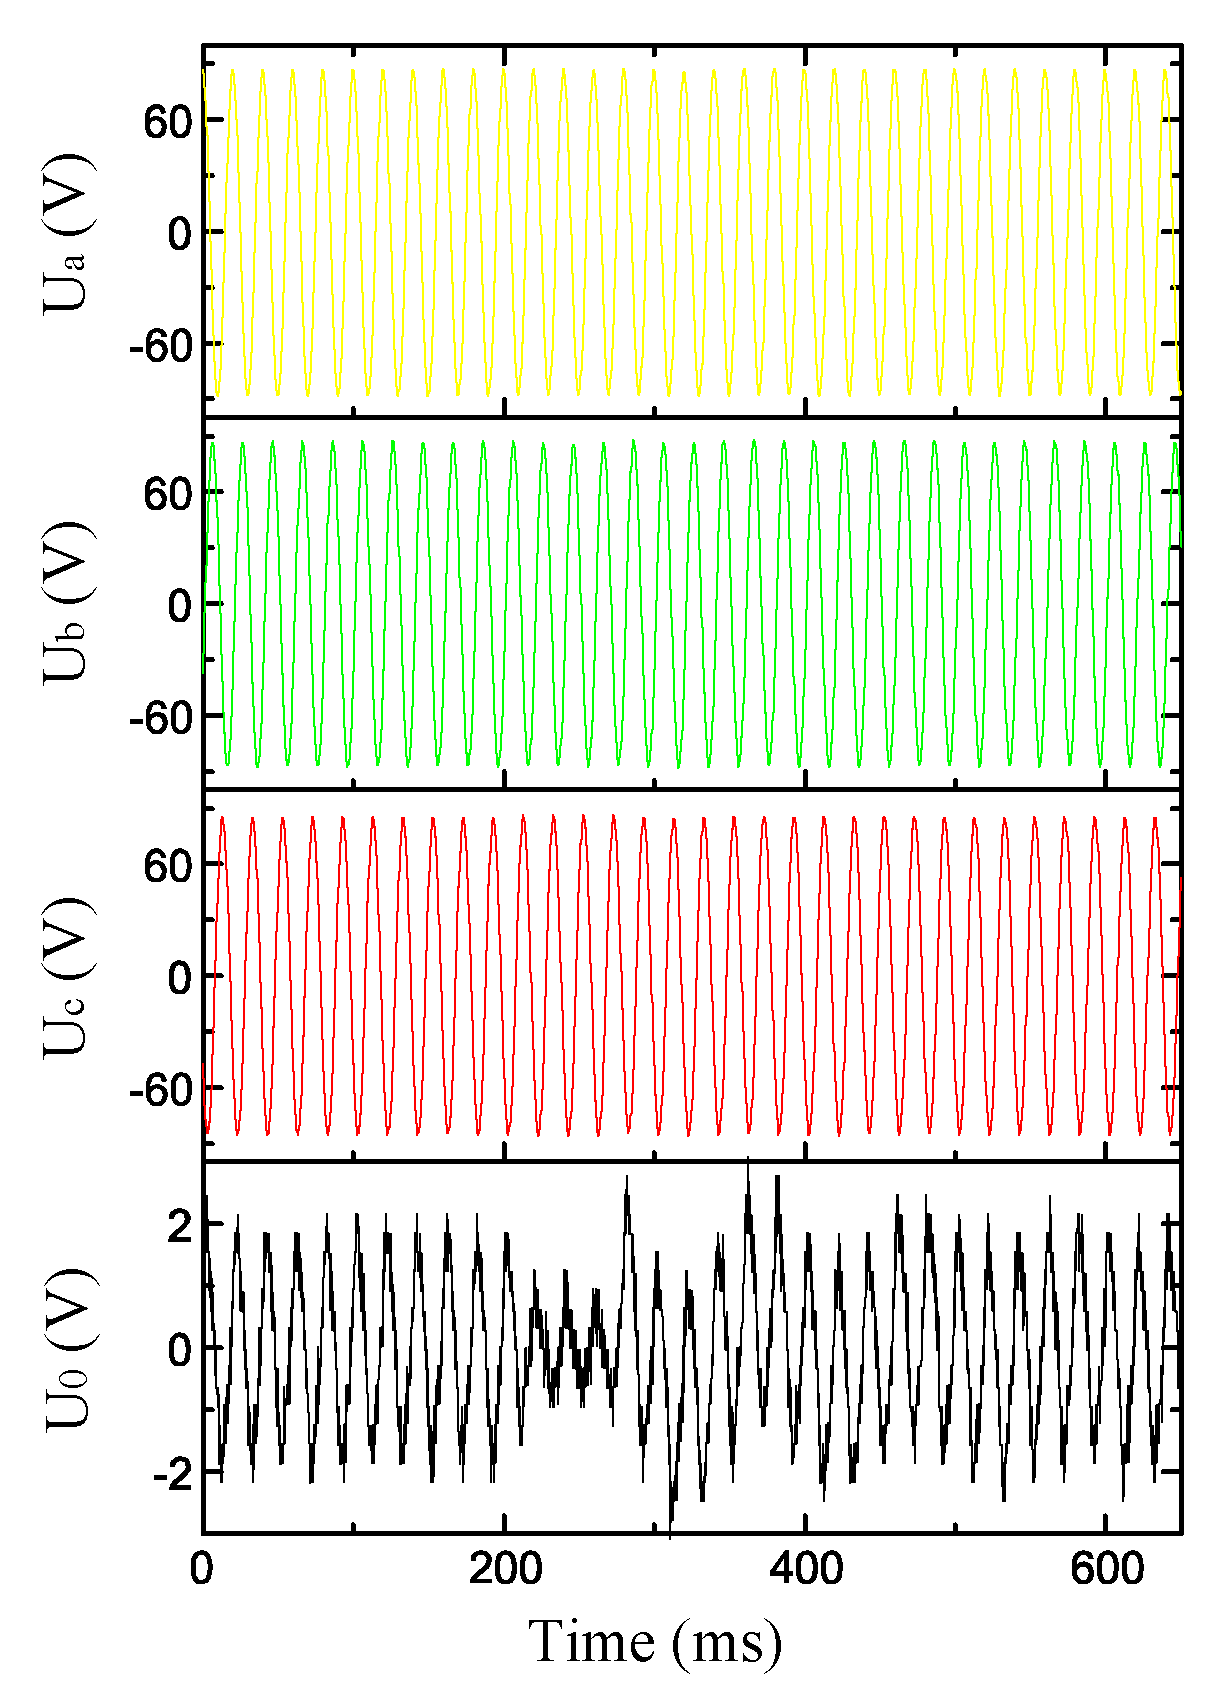
4.1. Simulation Results and Analysis
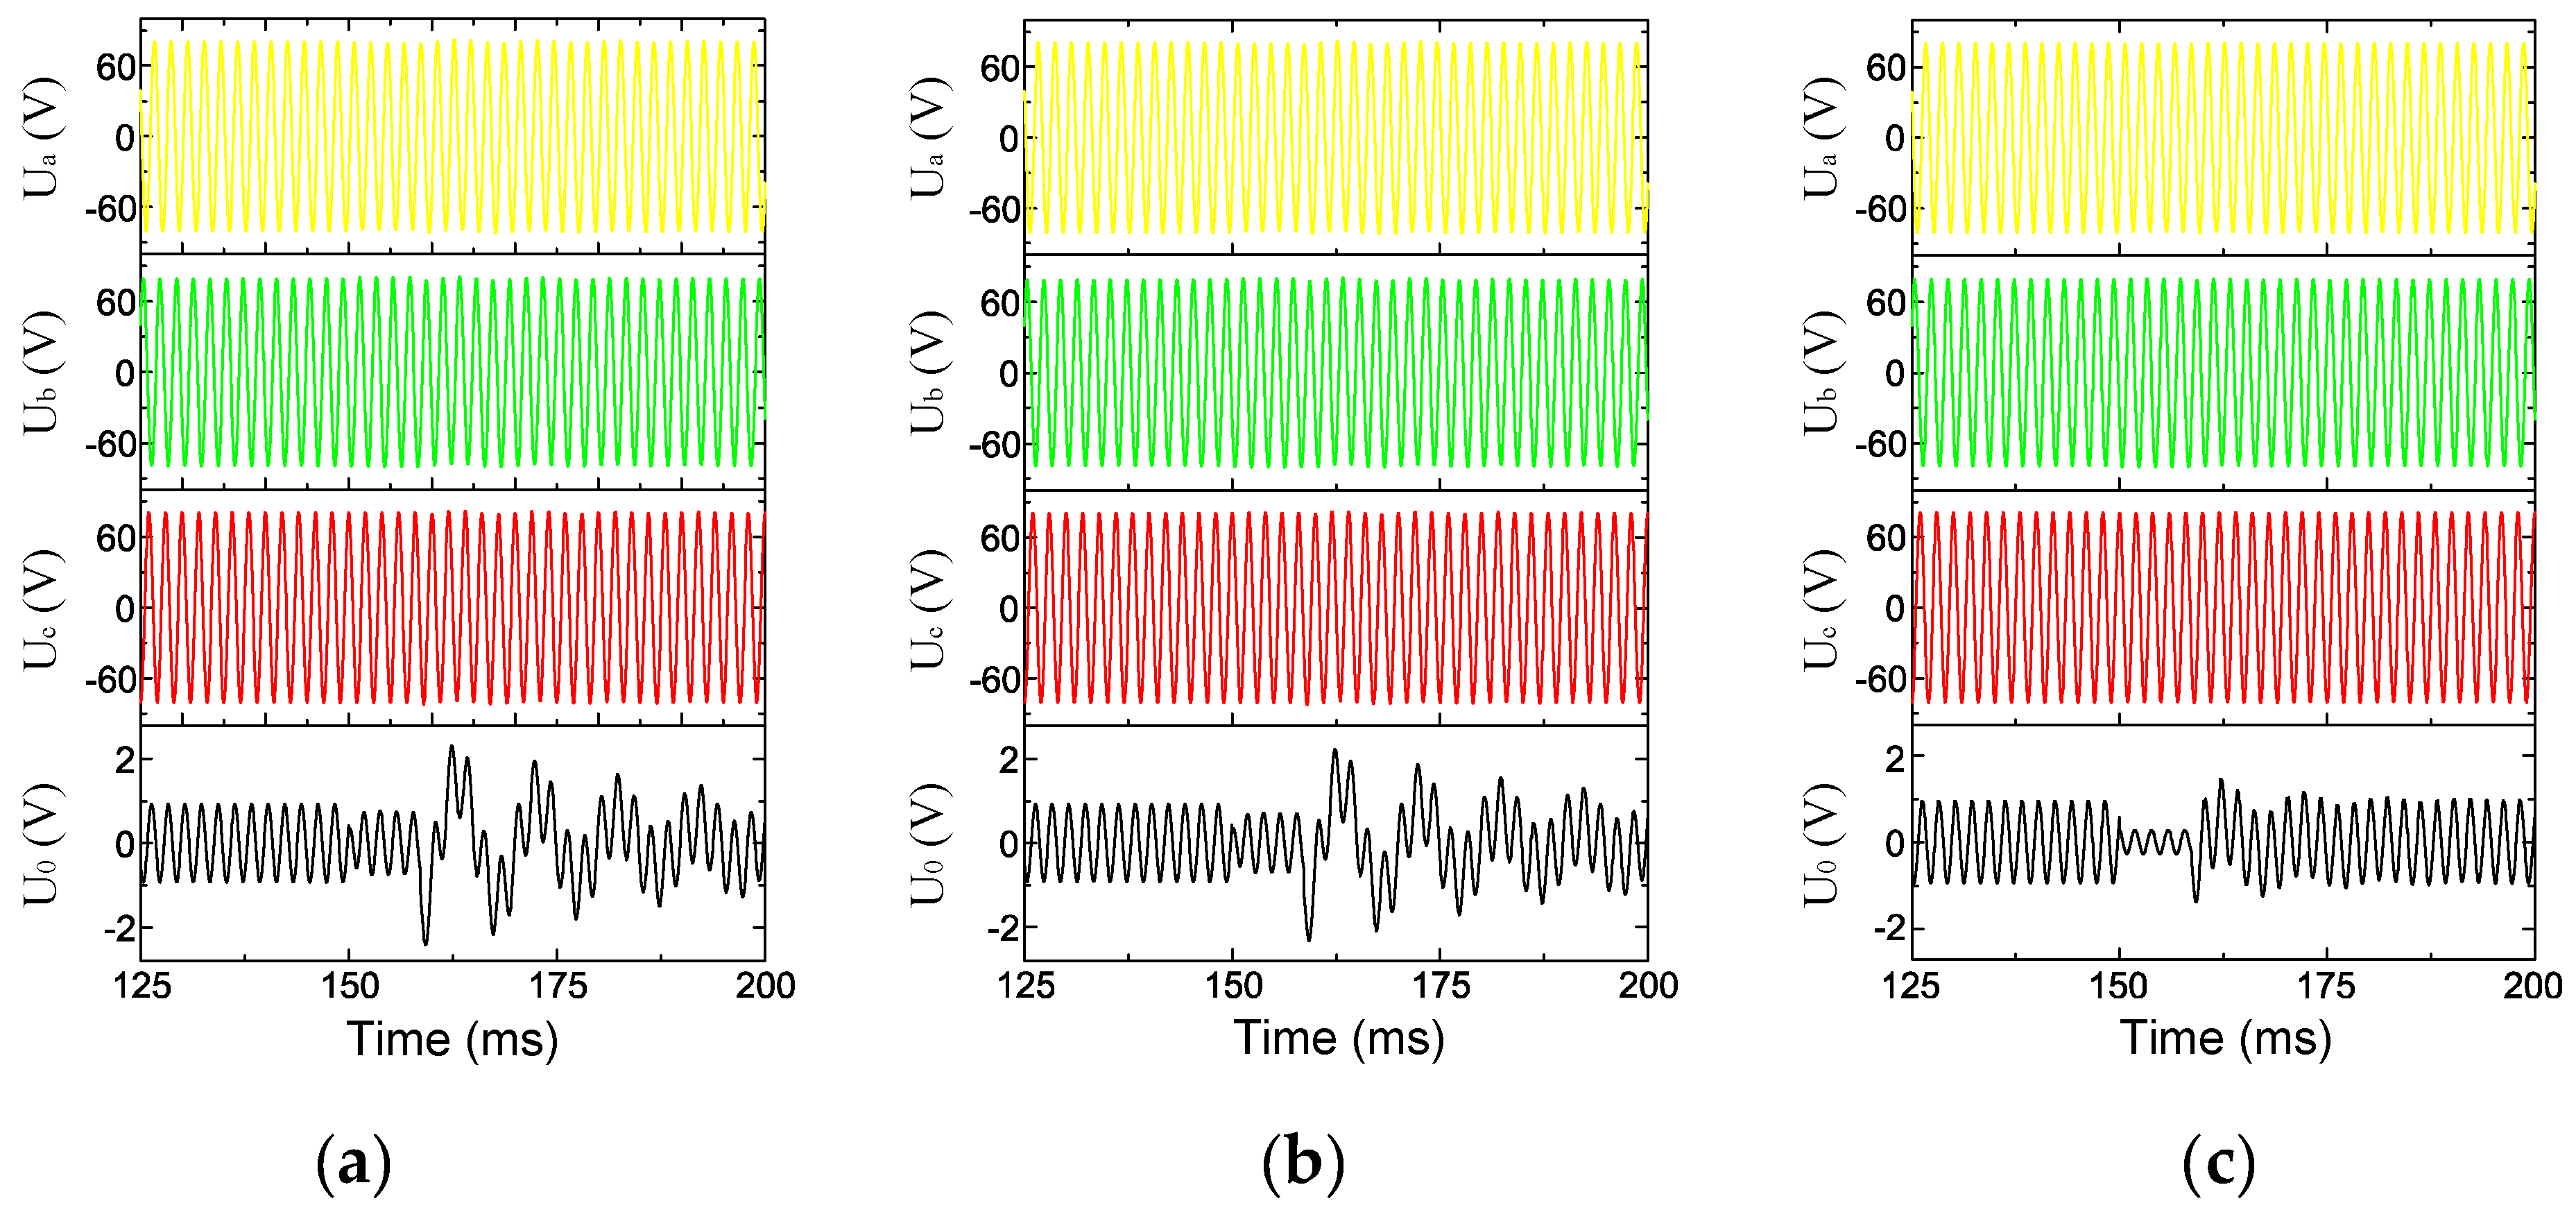
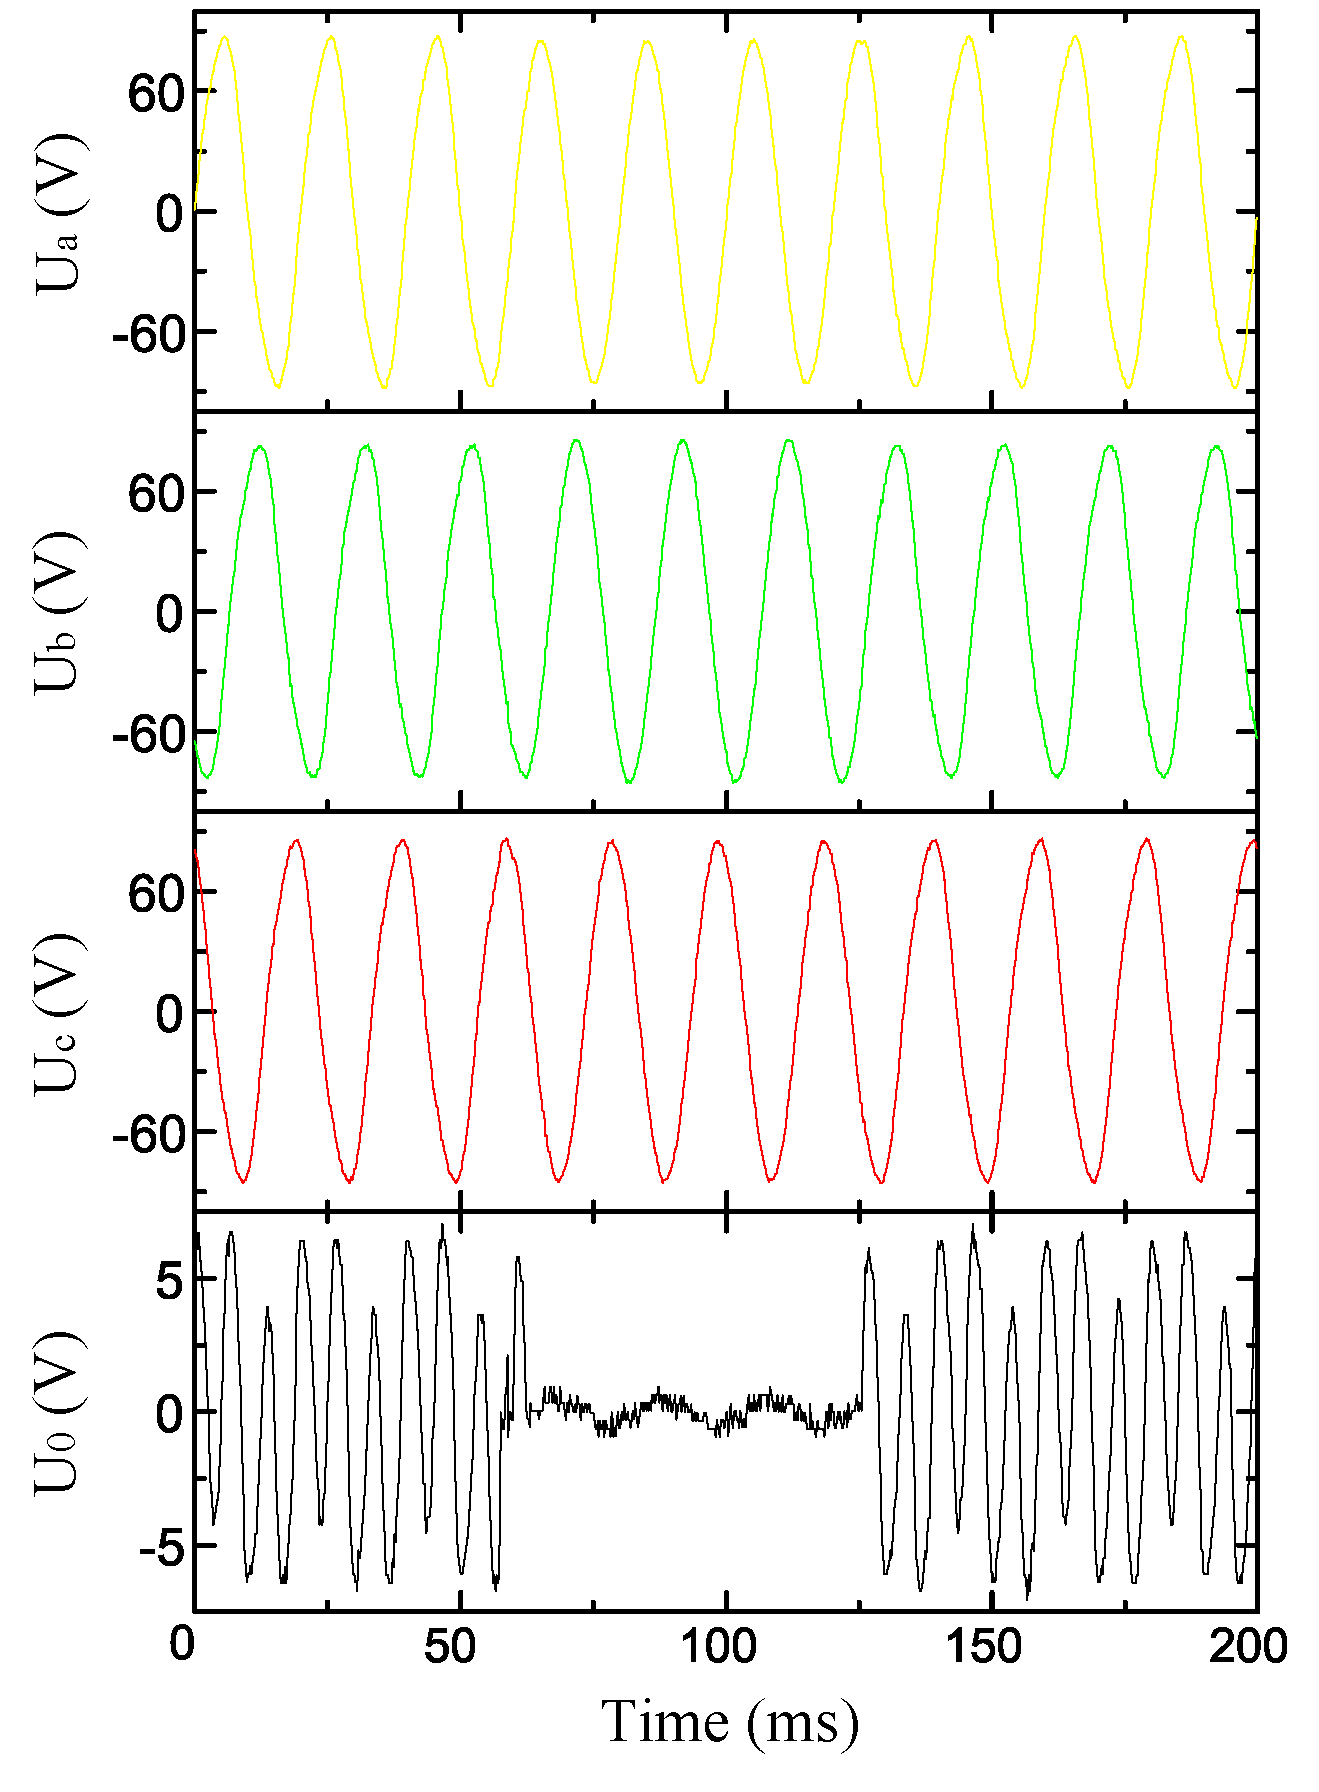
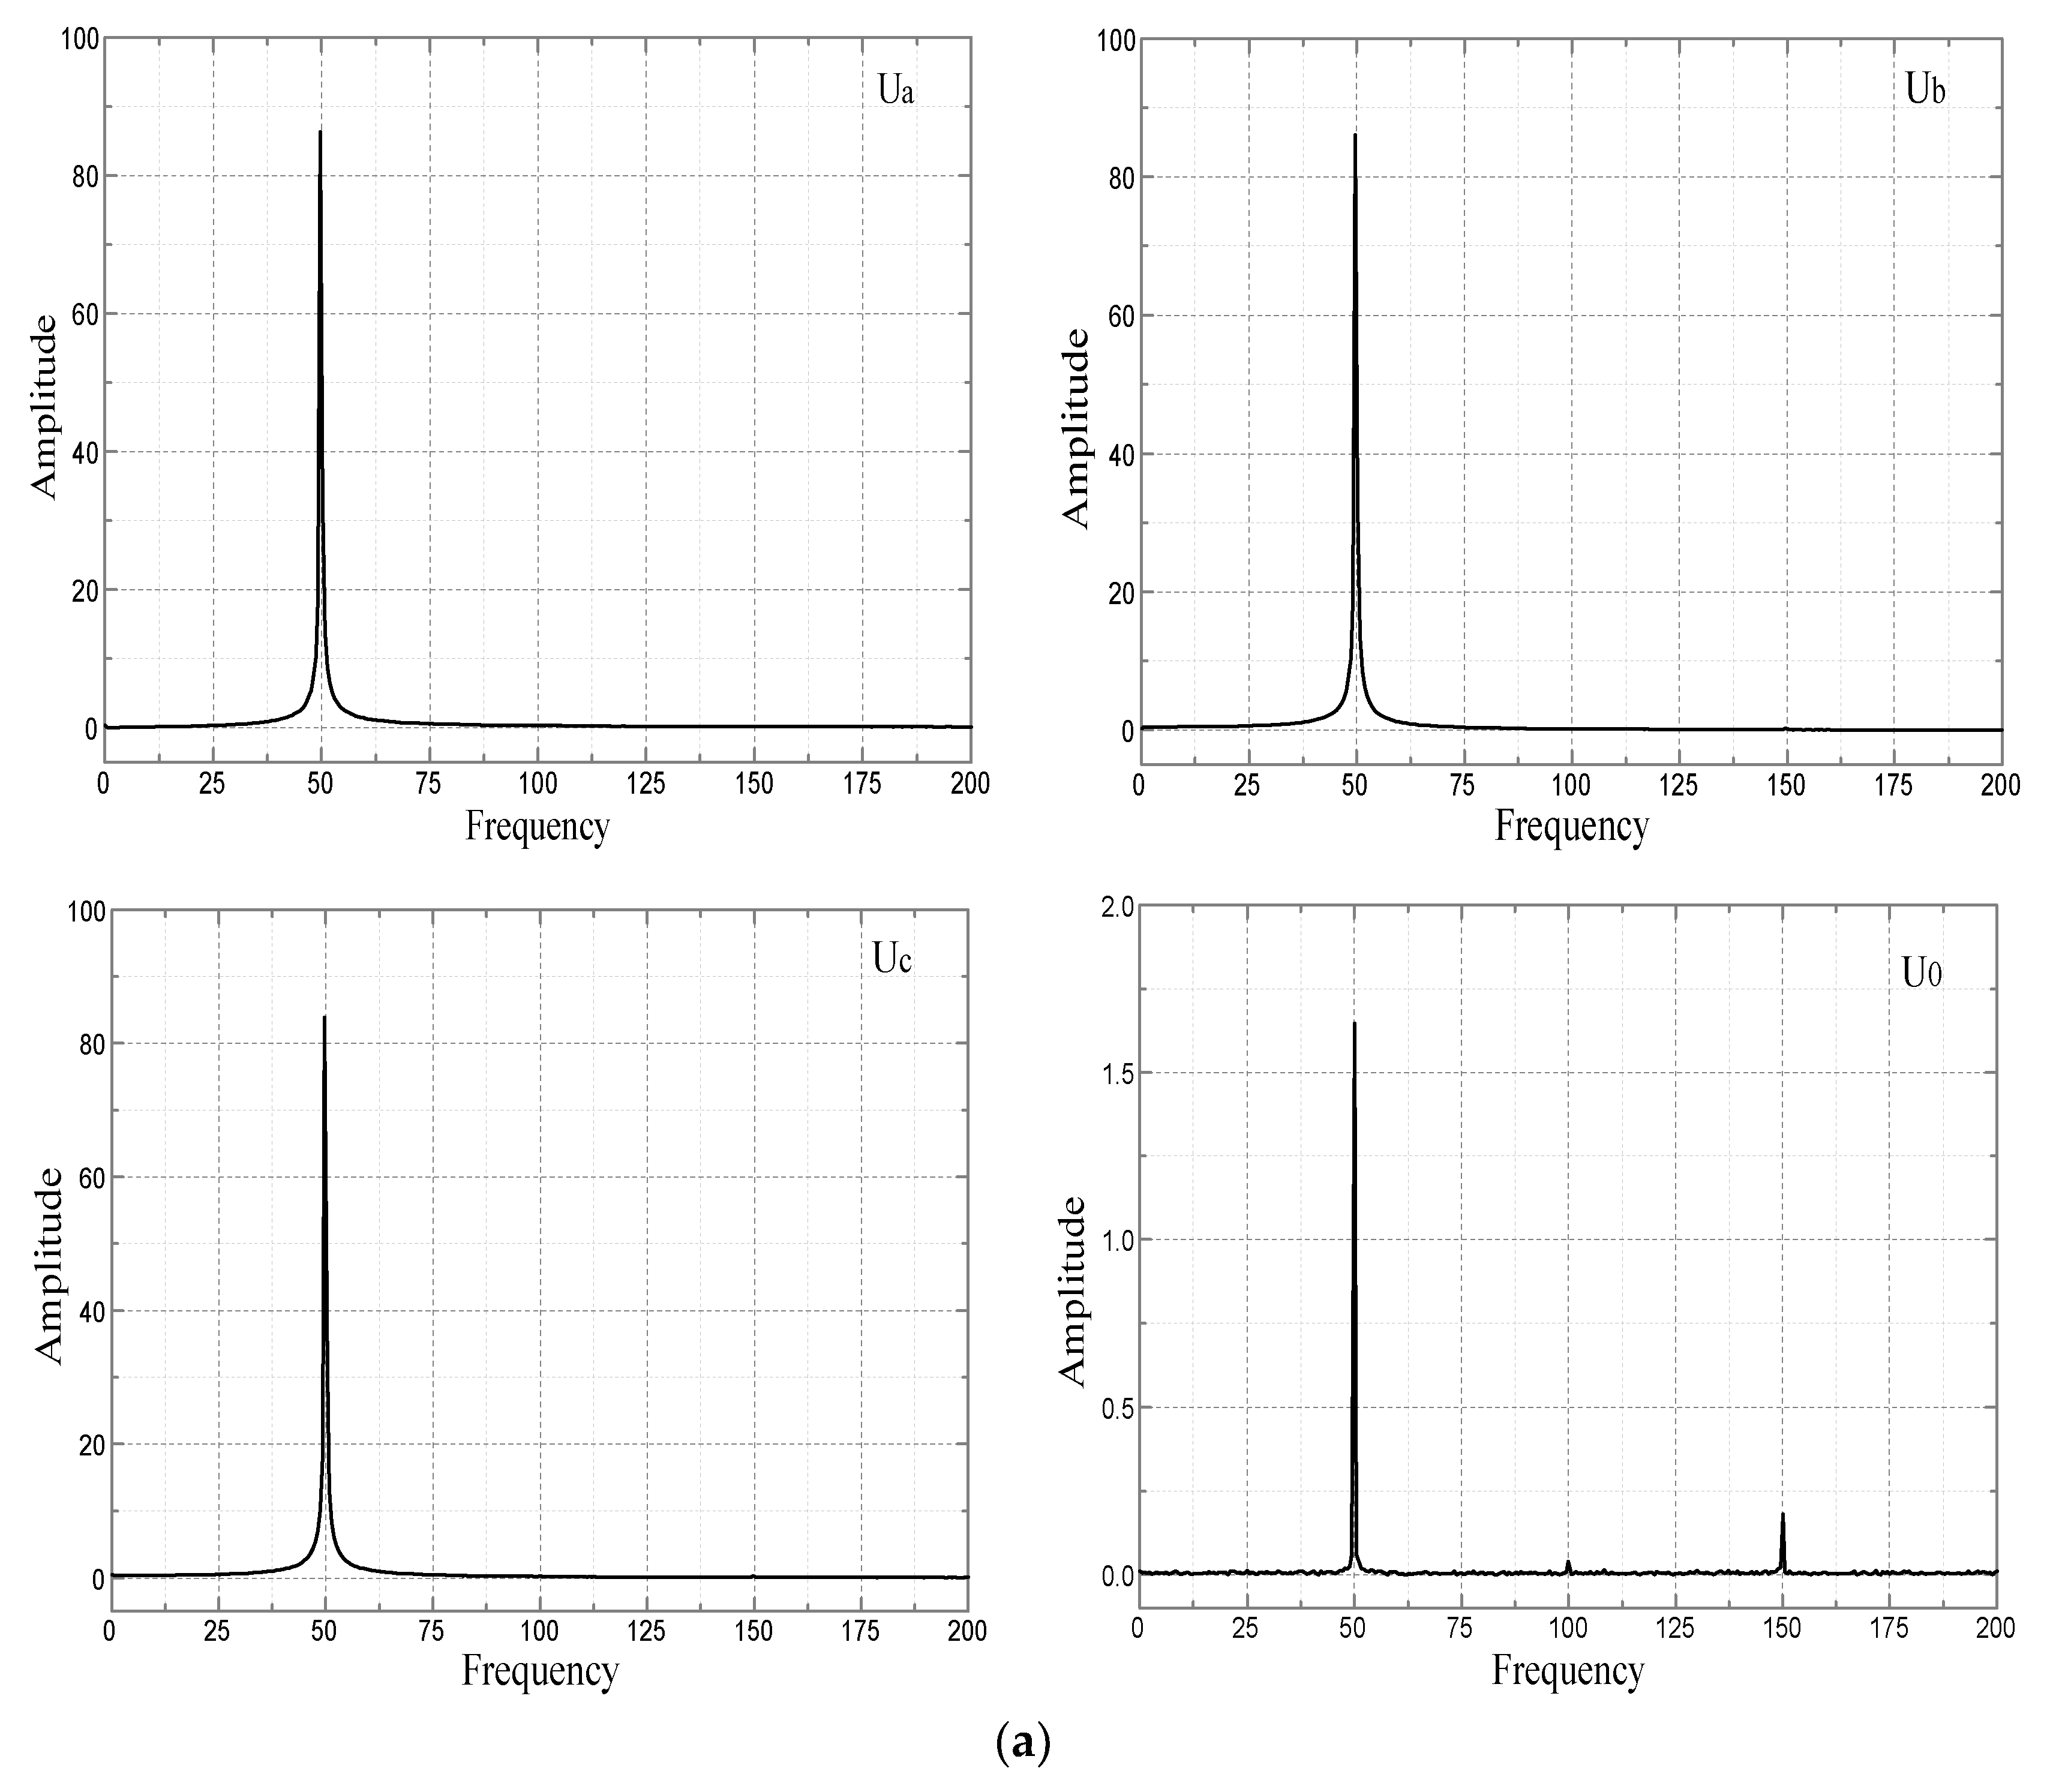
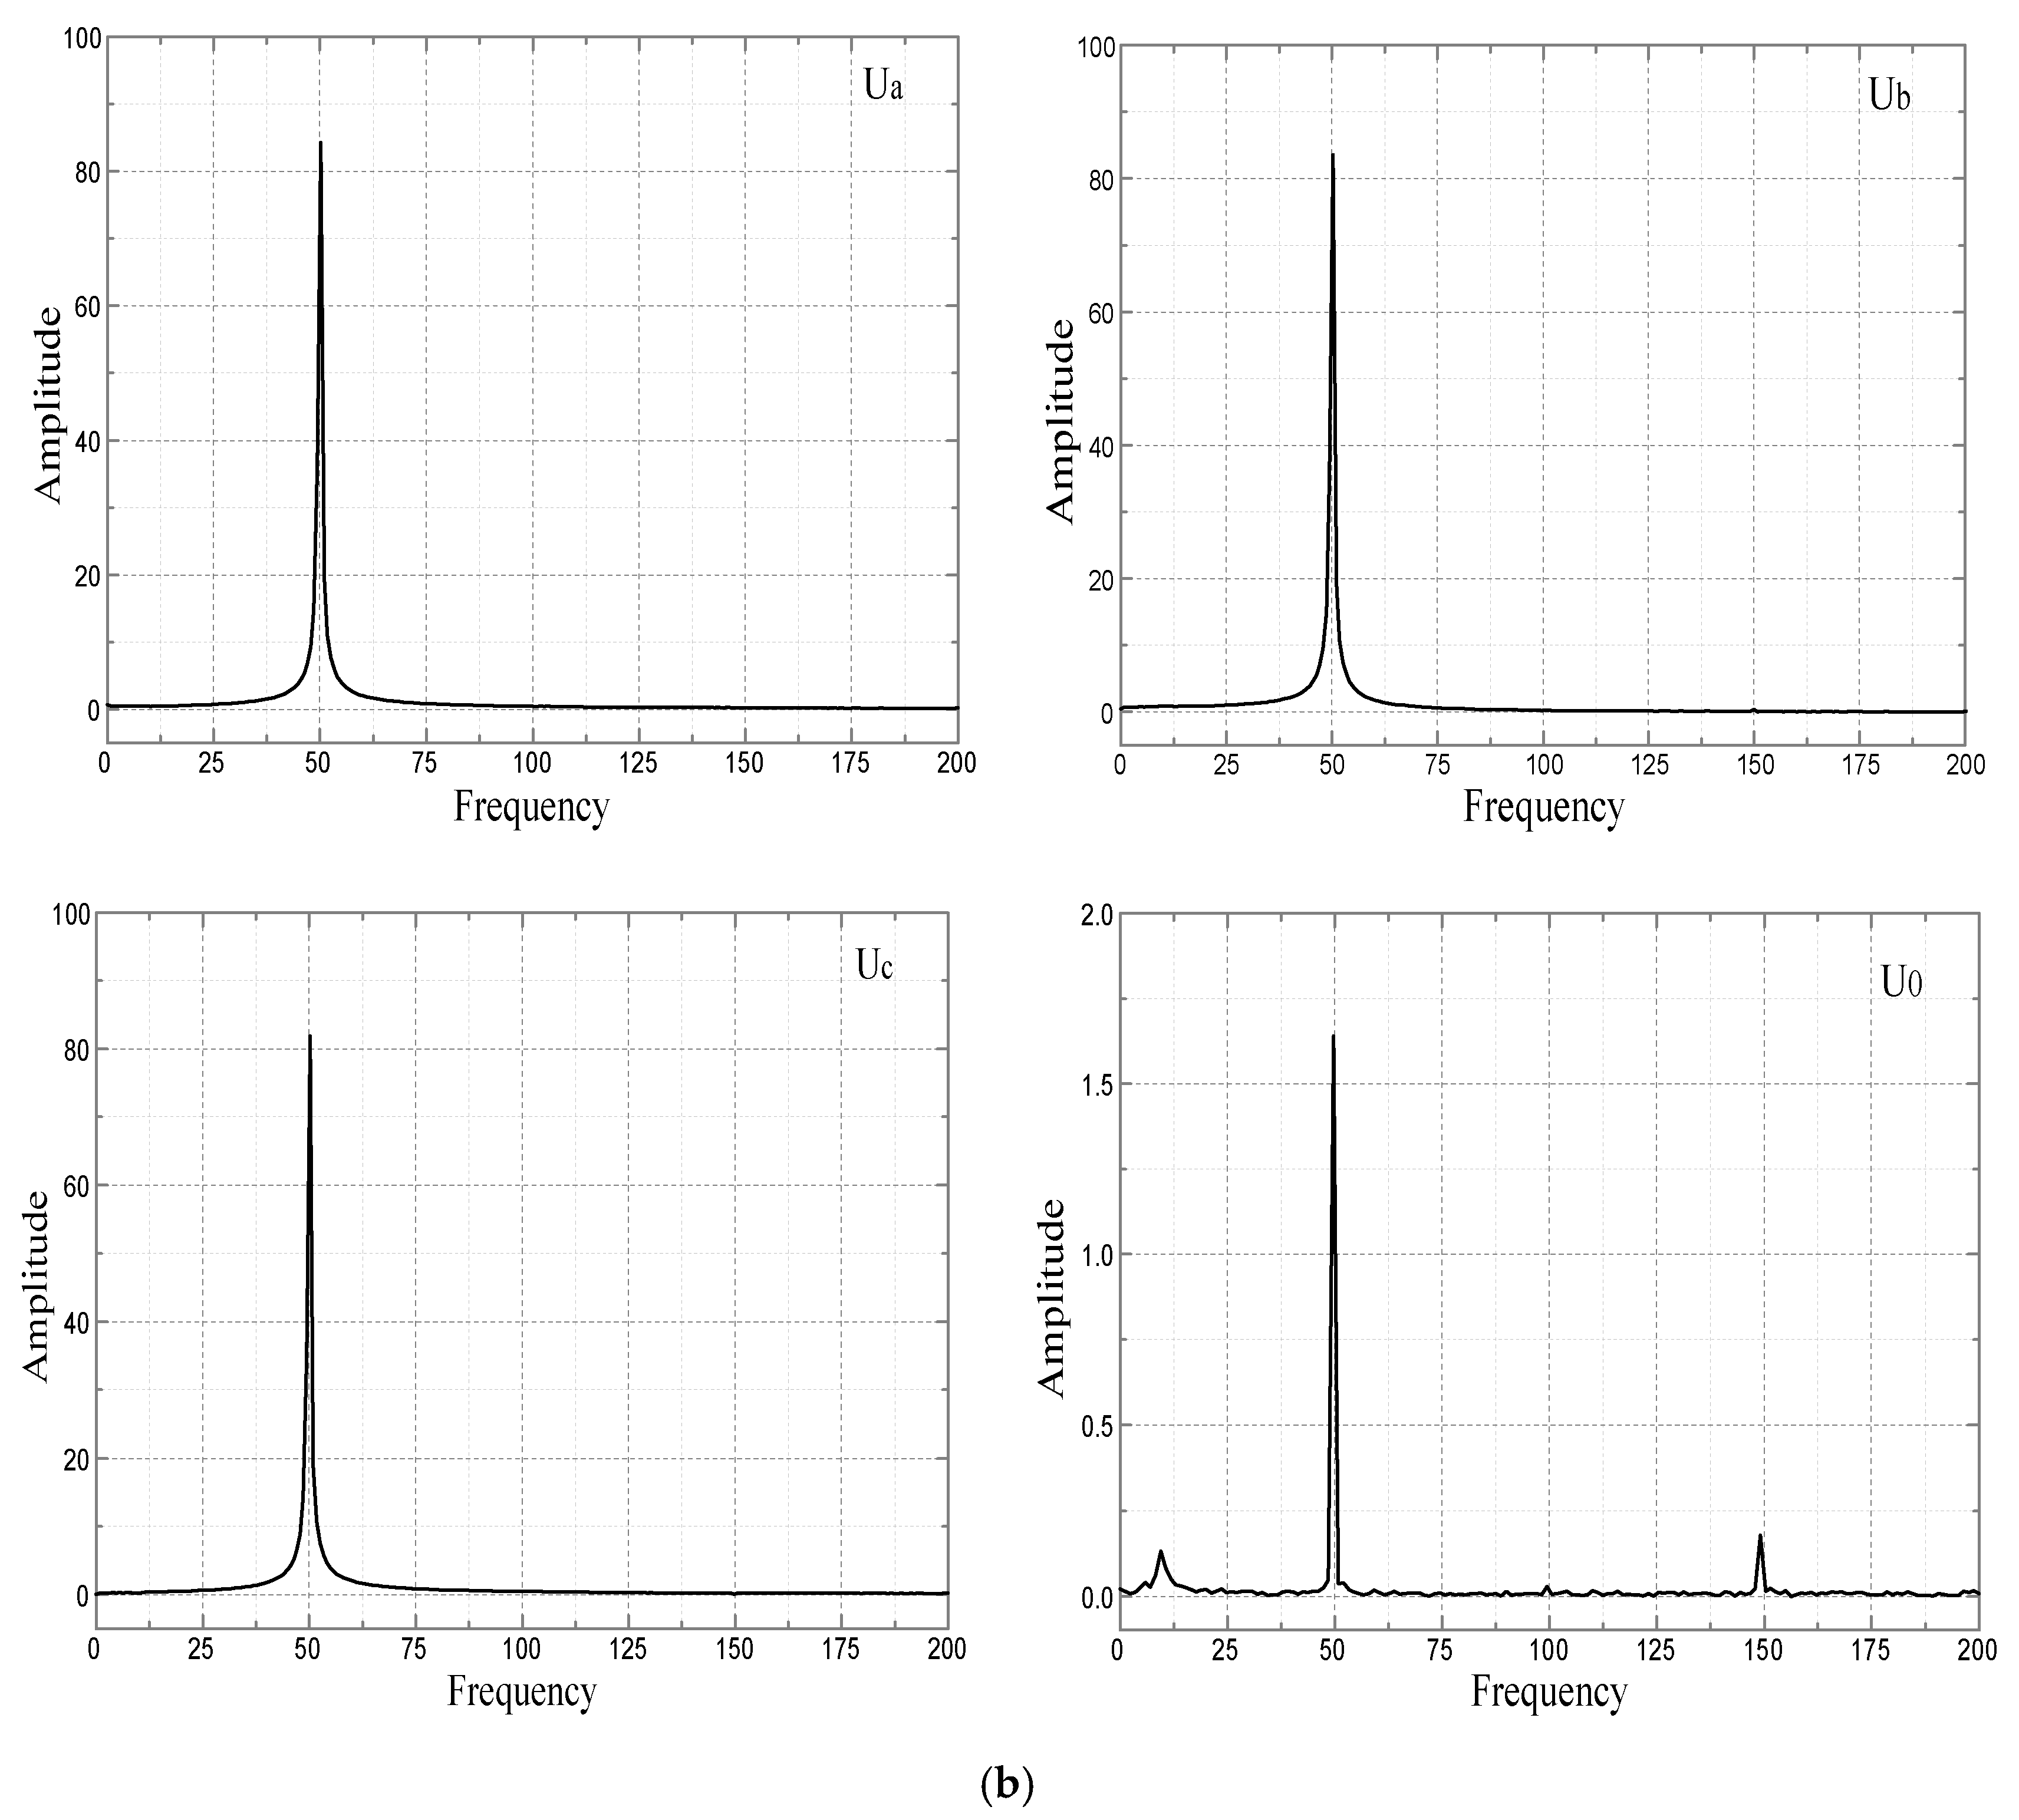
Figure 9 shows the voltage waveforms when the insulation resistance
R is 0 Ω, 200 Ω, and 5 kΩ.
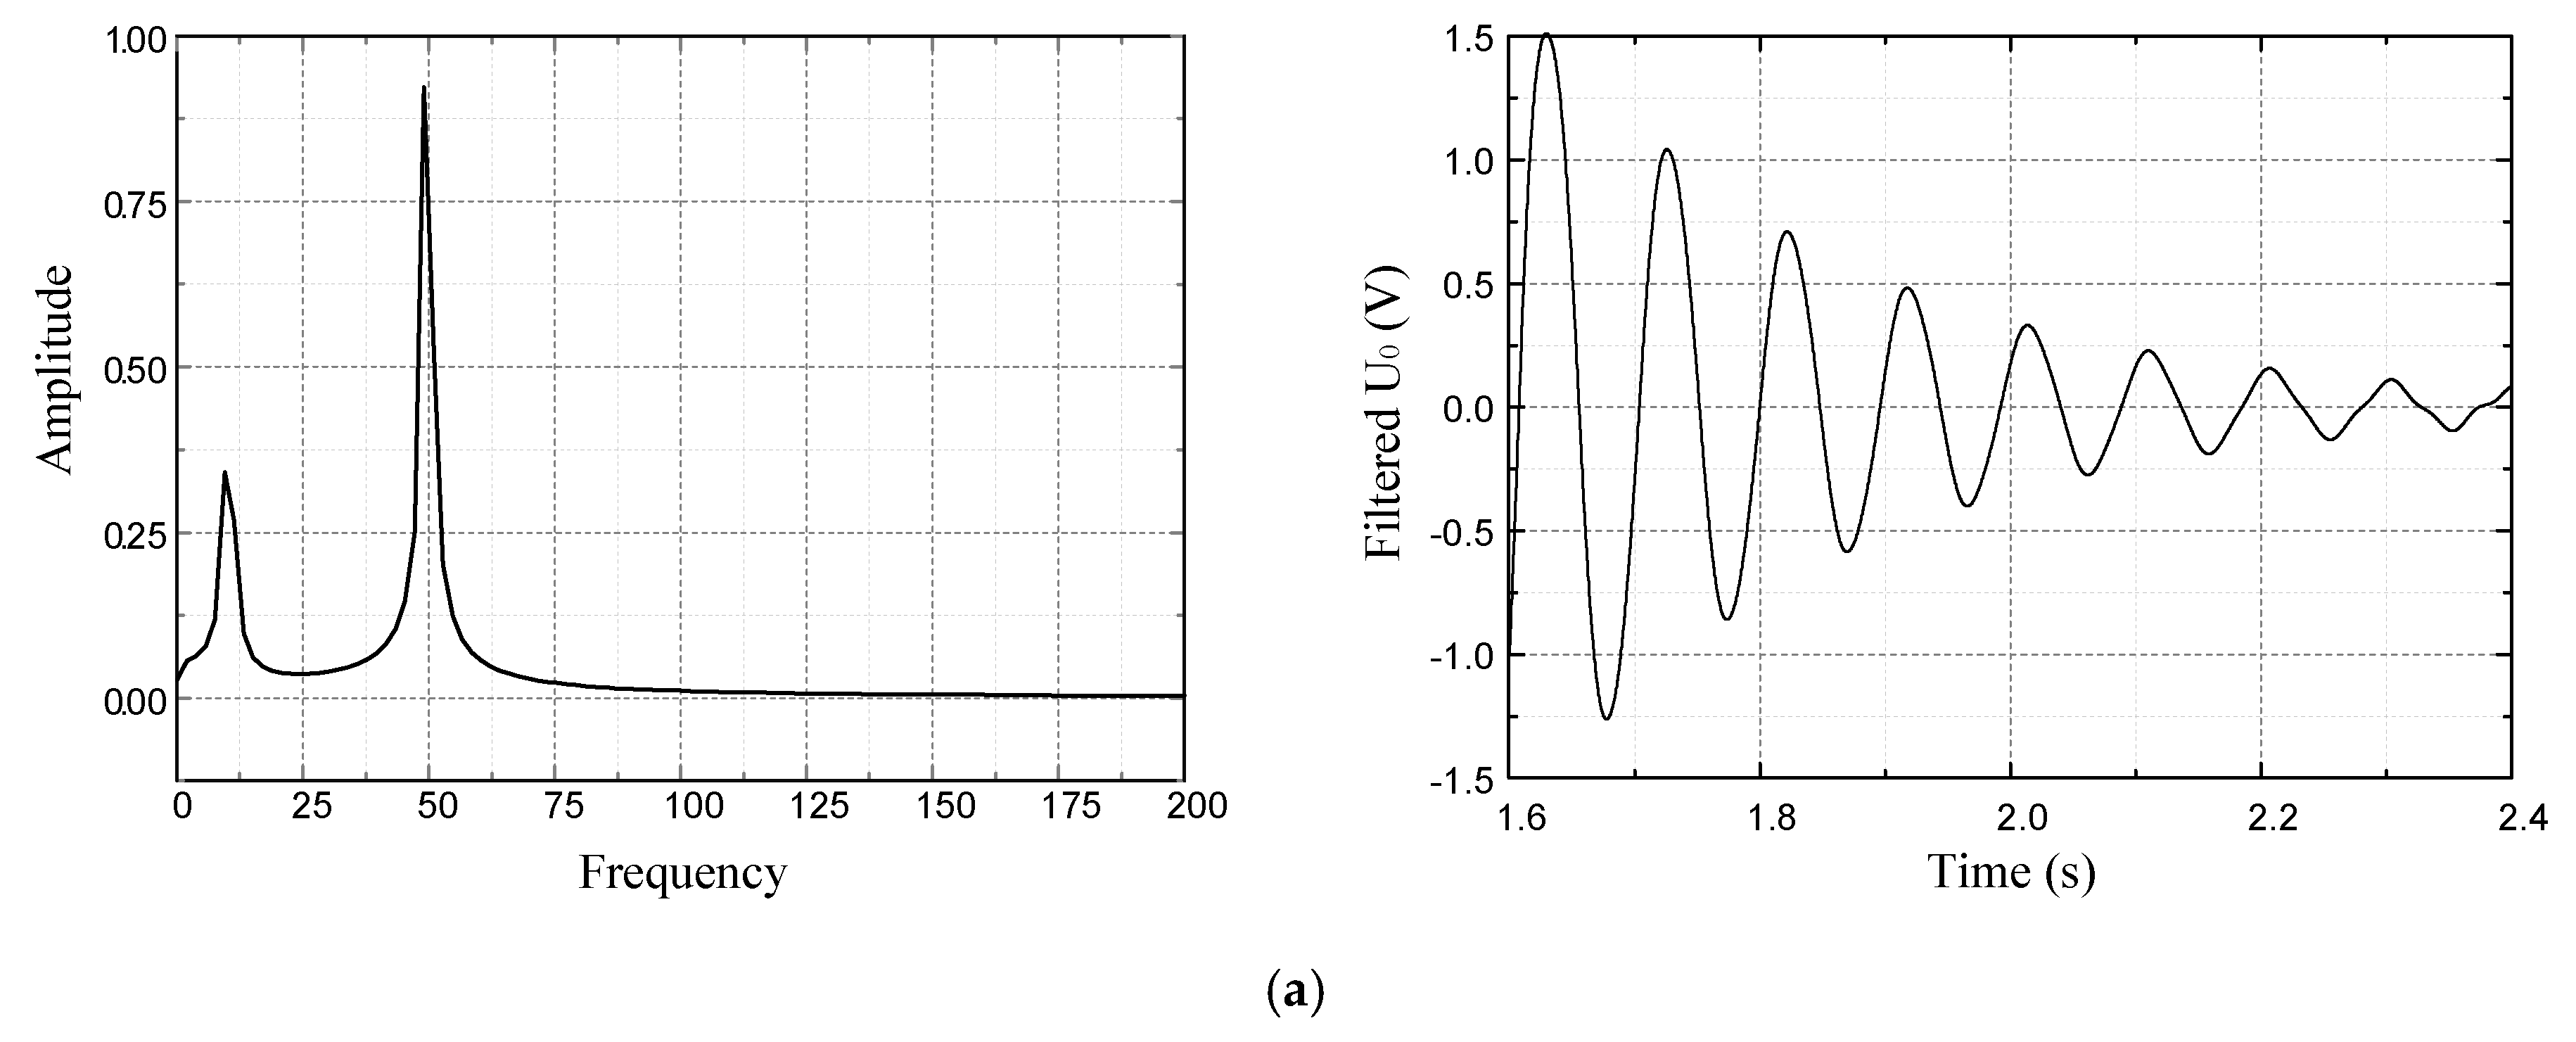
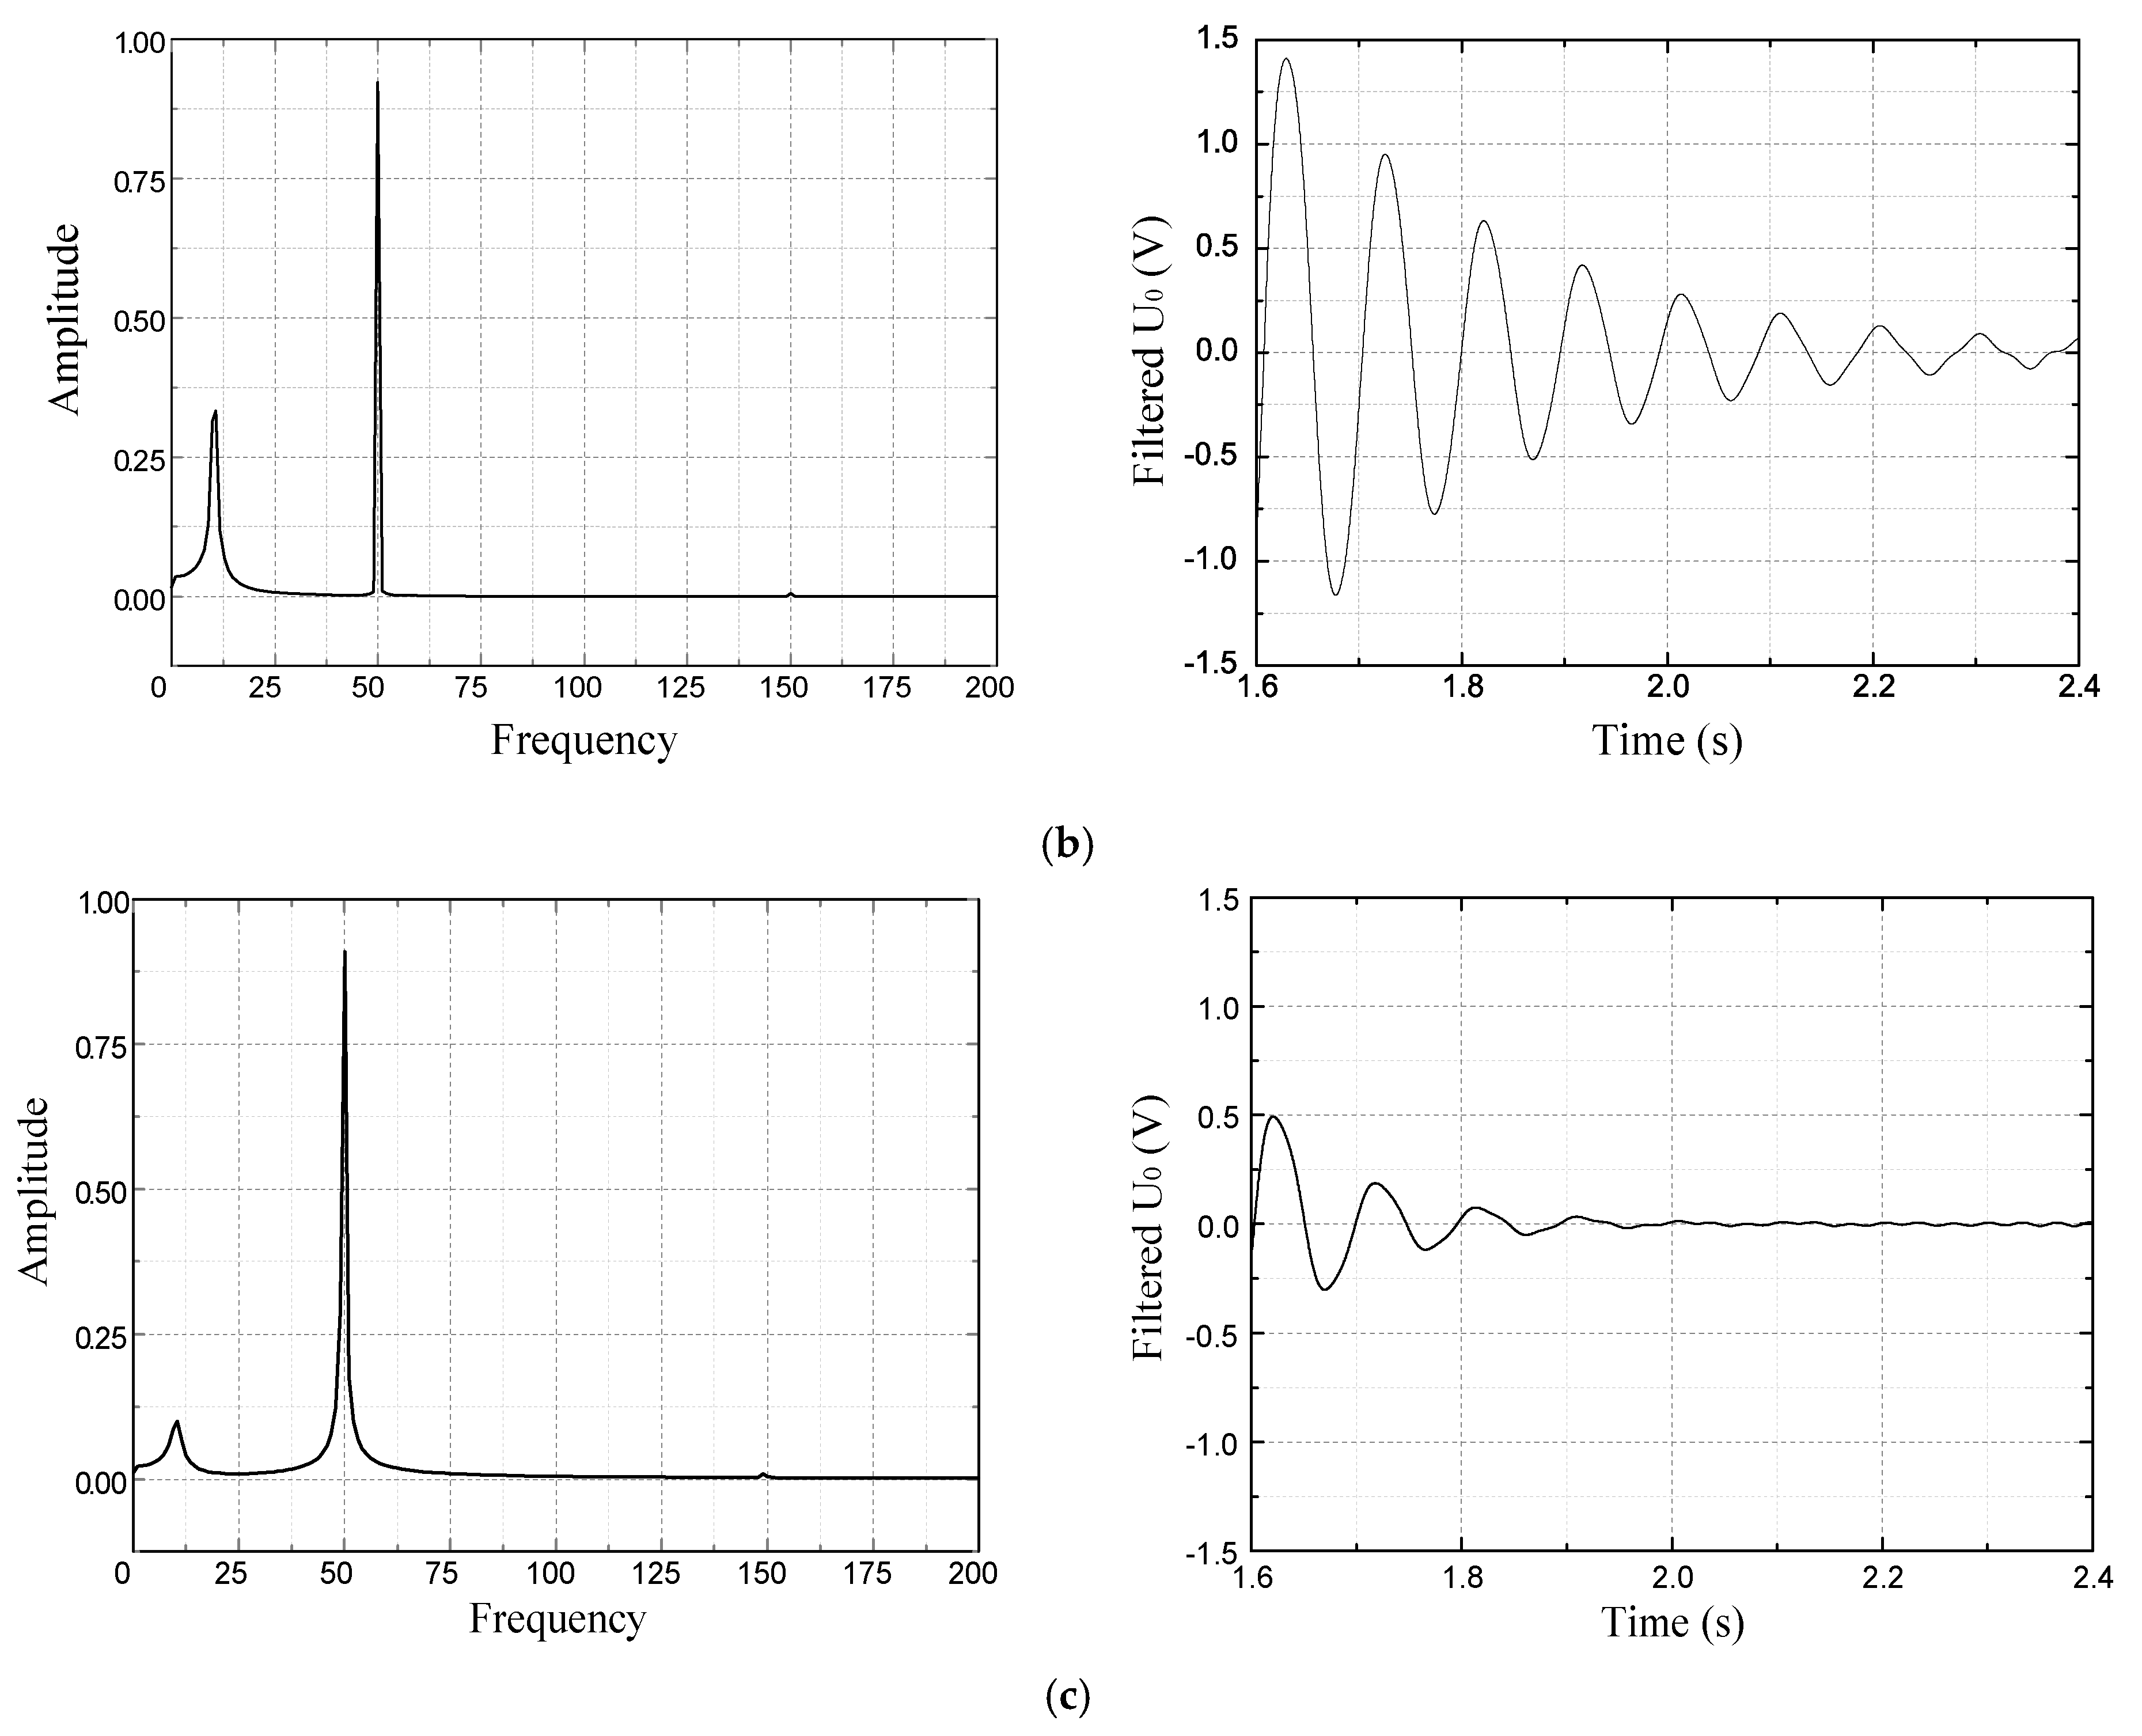
Figure 10 shows the value of
U0 within one second after K1 has been closed and open. The left column is a Fourier analysis of the data and the right column shows the signal after low-pass filtering with a cutoff frequency of 30 Hz.
According to the filtered waveforms shown in
Figure 10, when
R is 0 Ω, 200 Ω, and 5 kΩ and K1 is closed and opened,
U0 has a low frequency oscillation of about 10 Hz. The maximum amplitudes are 1.5 V, 1.4 V, and 0.5 V, respectively. The oscillation duration is approximately 670, 620 and 320 ms, respectively. The duration is defined as the time from the peak of the first oscillation to the peak that has a maximum amplitude of 1/10 or less relative to the first oscillation.
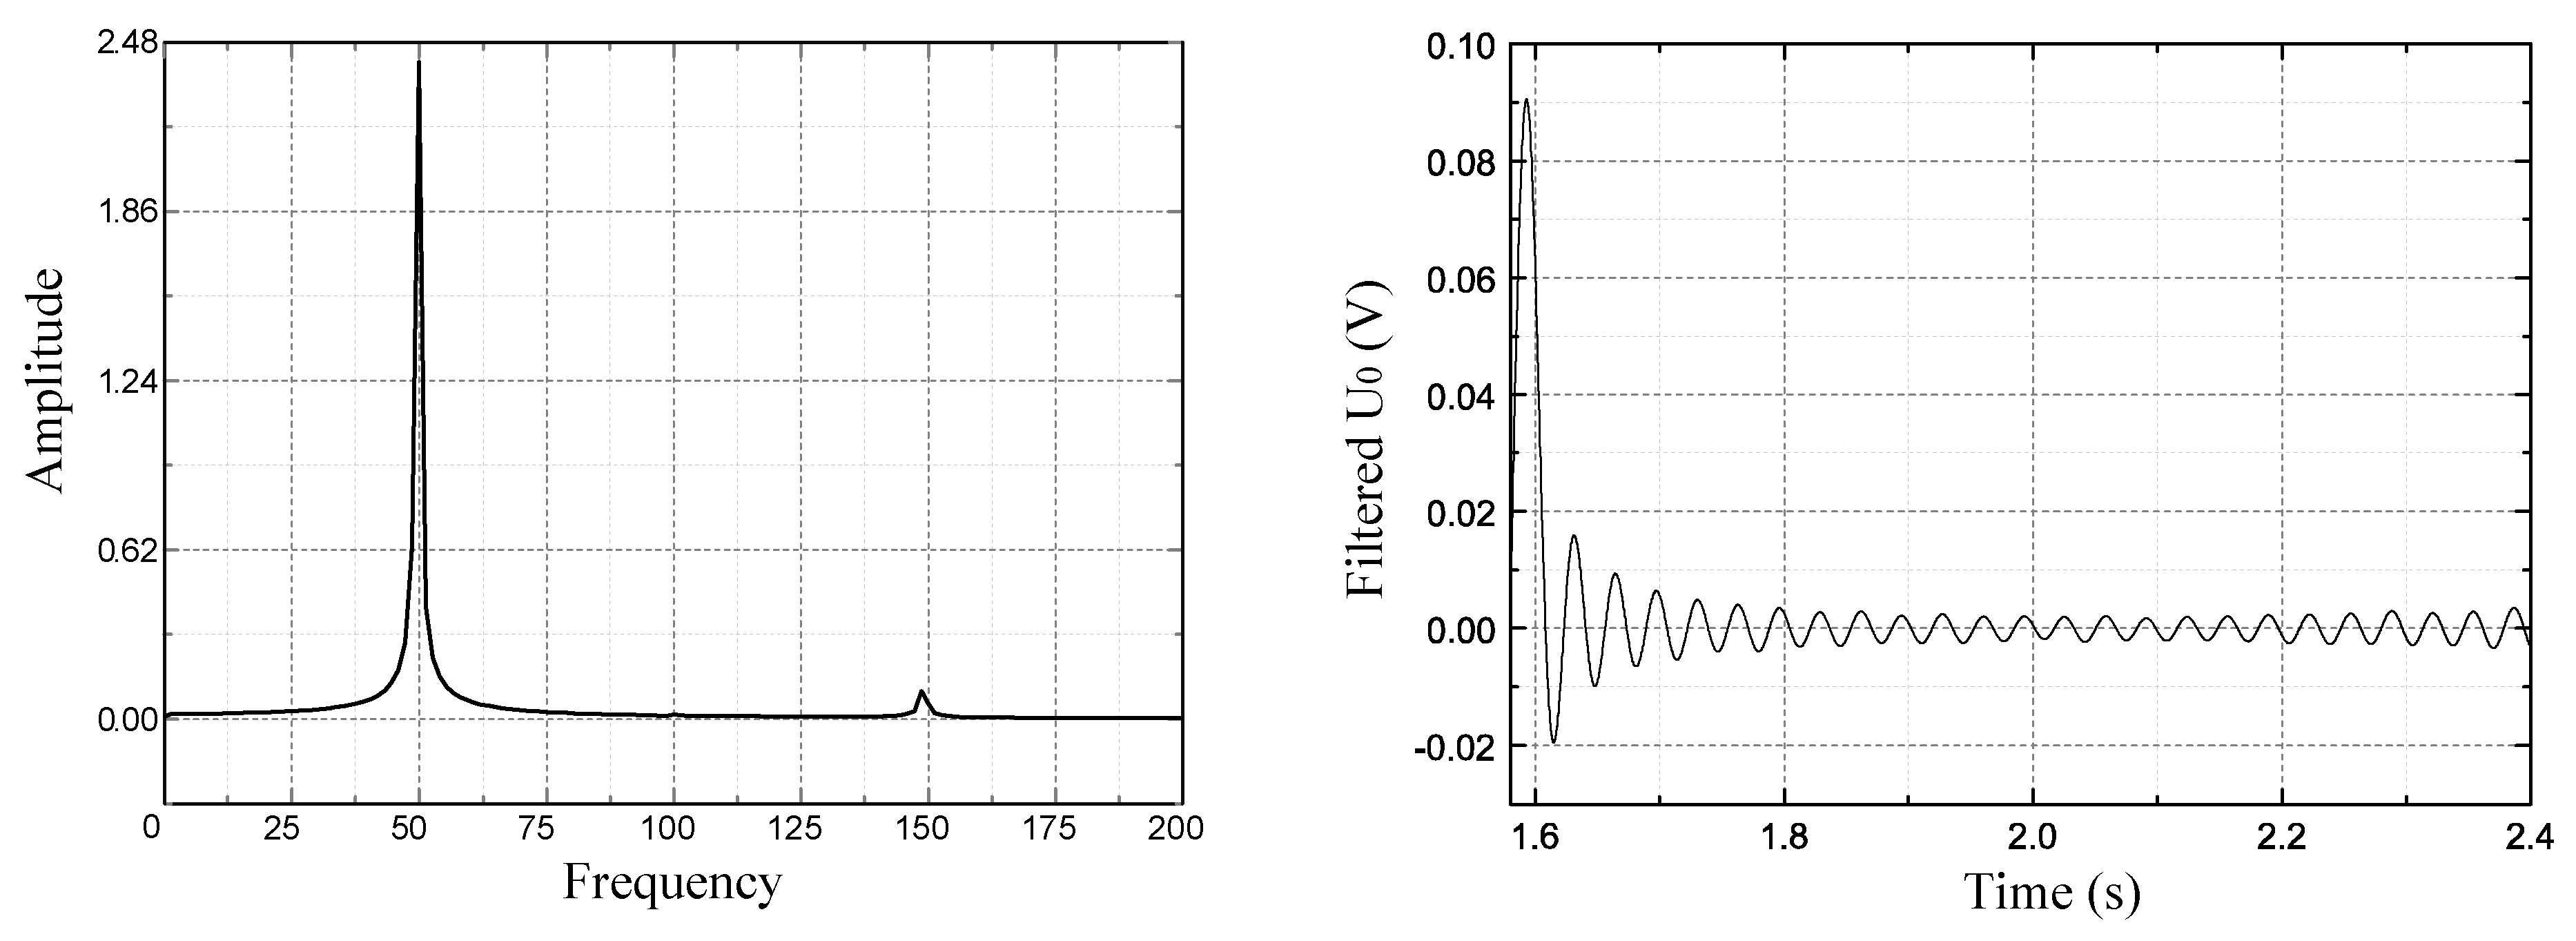
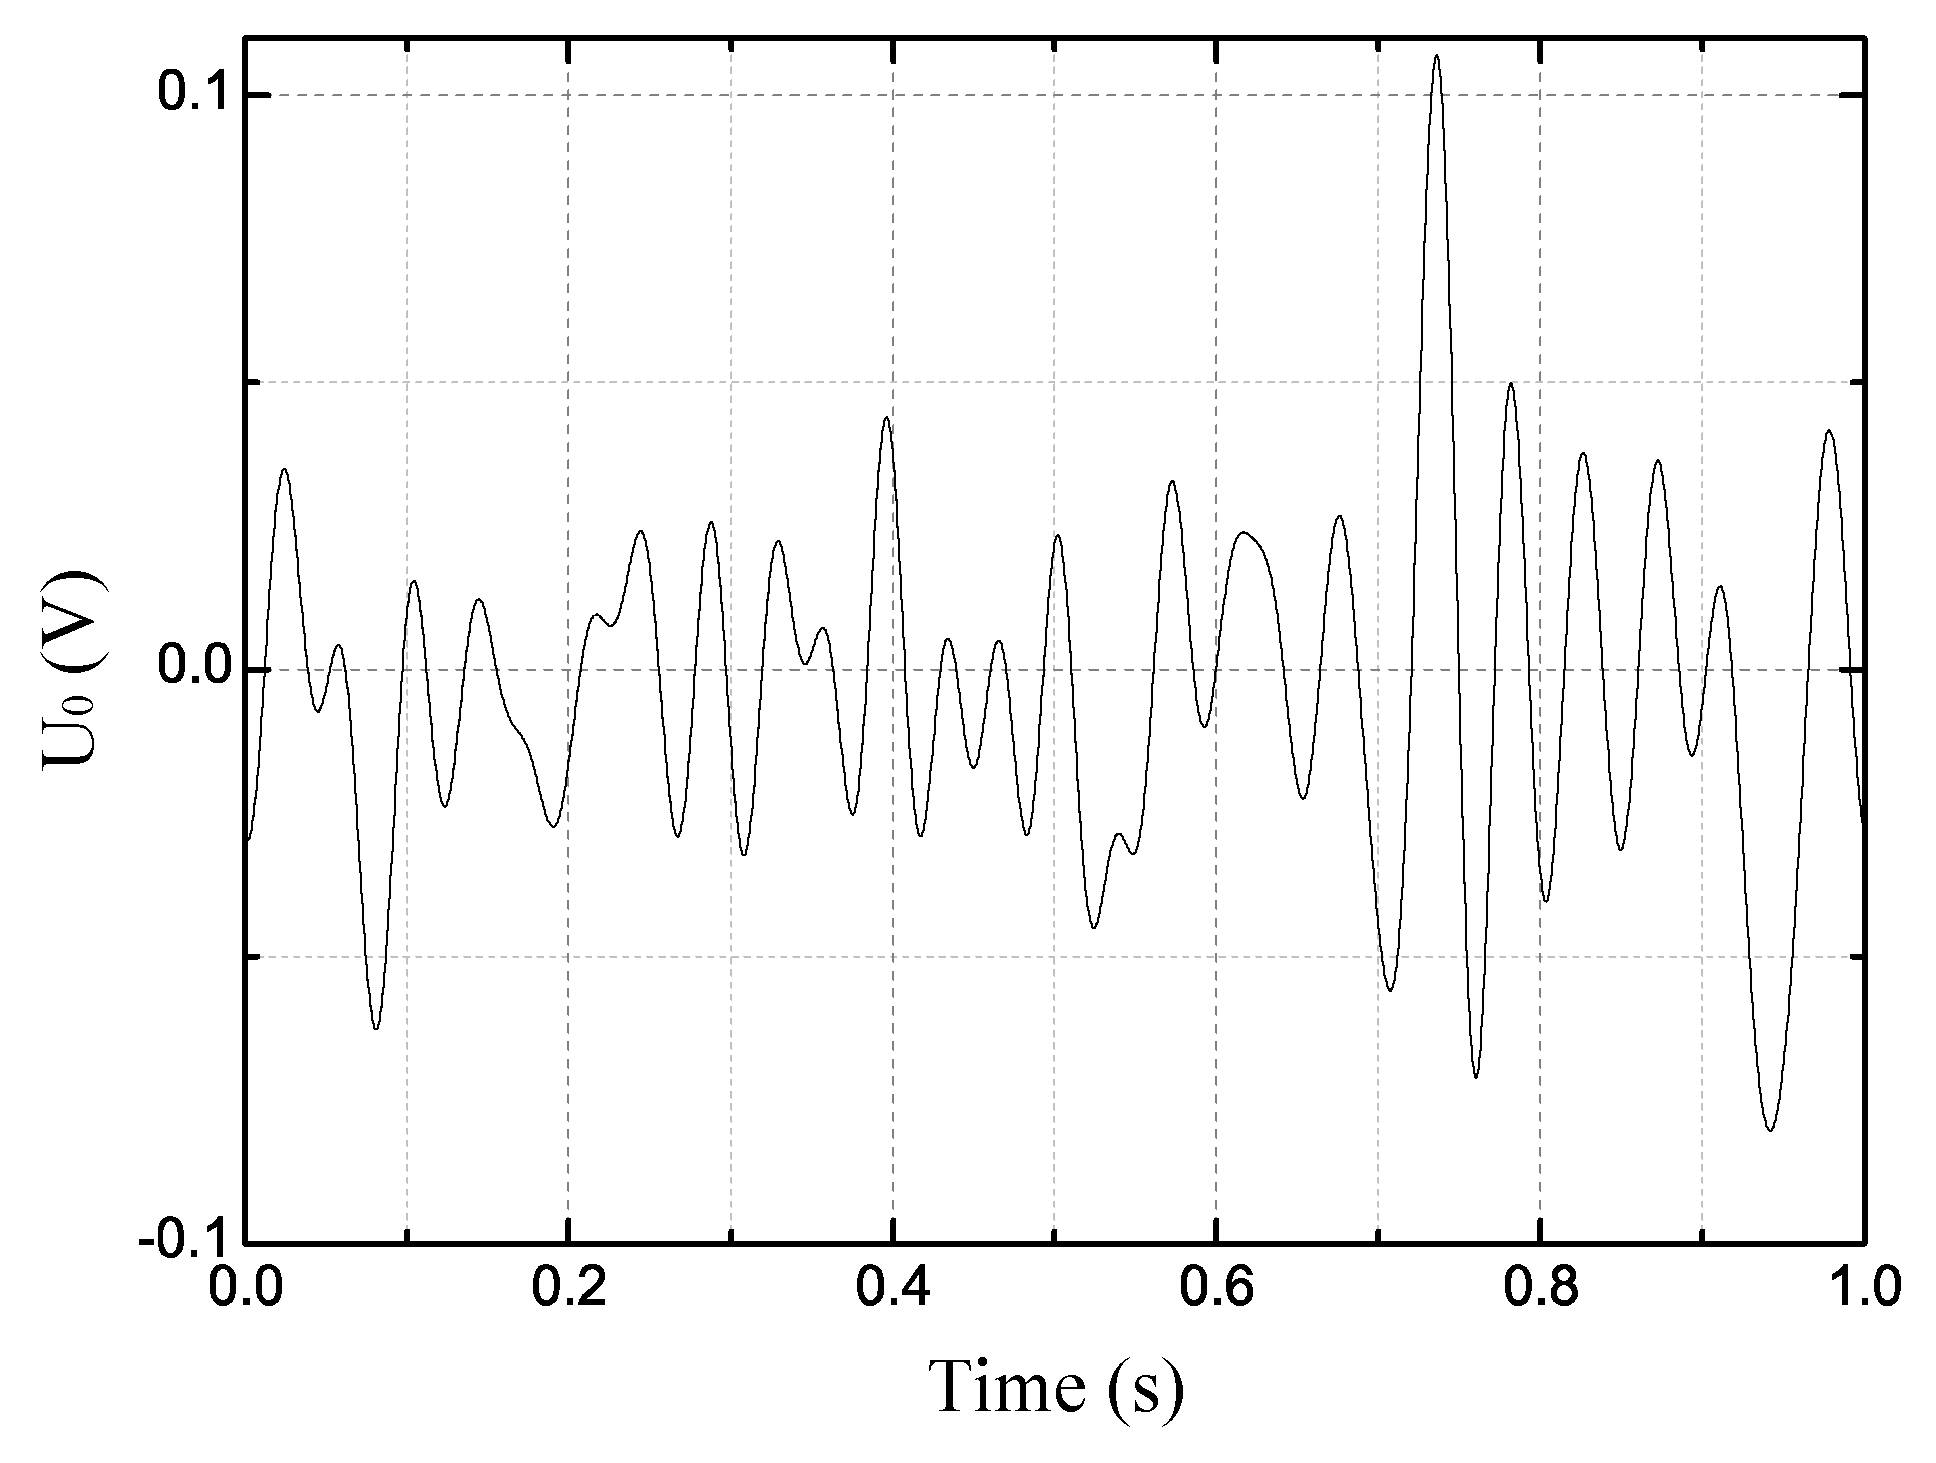
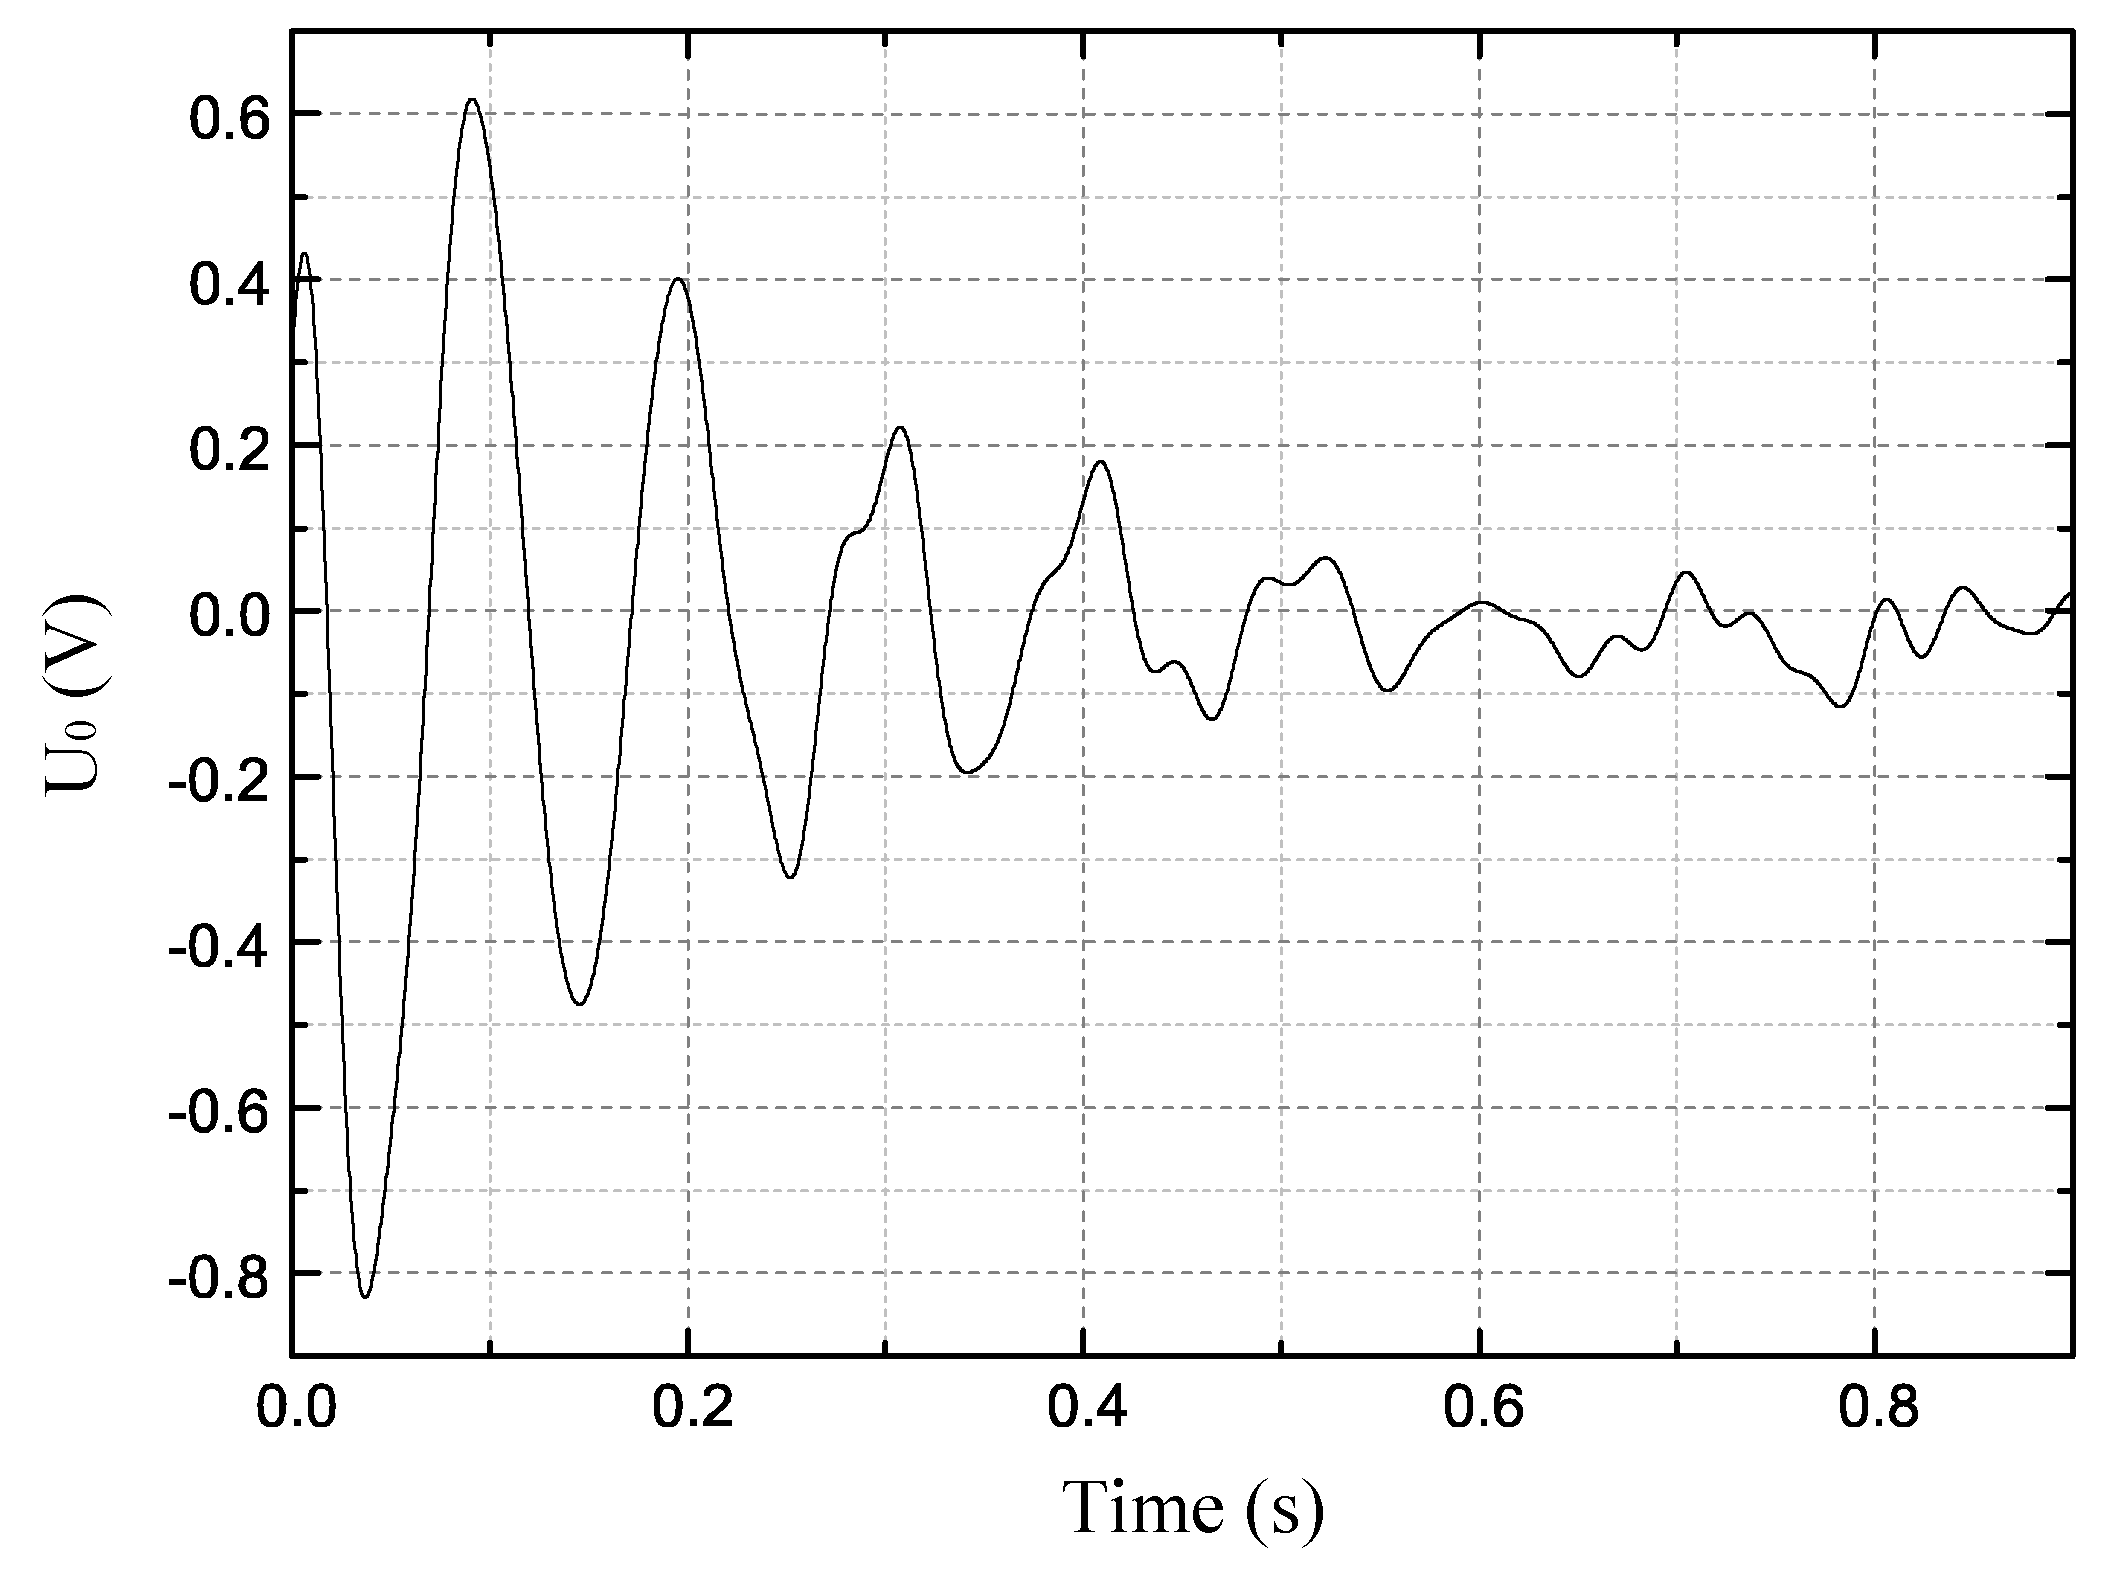
Figure 11 shows the same data for
U0 when
R = ∞, that is, the N terminal insulation of the VT is normal.
According to the filtered waveform in
Figure 11, when
R = ∞ and K1 is operated, a low frequency oscillation of about 30 Hz occurs on
U0. The maximum amplitude is 0.09 V, and the oscillation duration is about 80 ms.
4.2. Analysis and Discussion
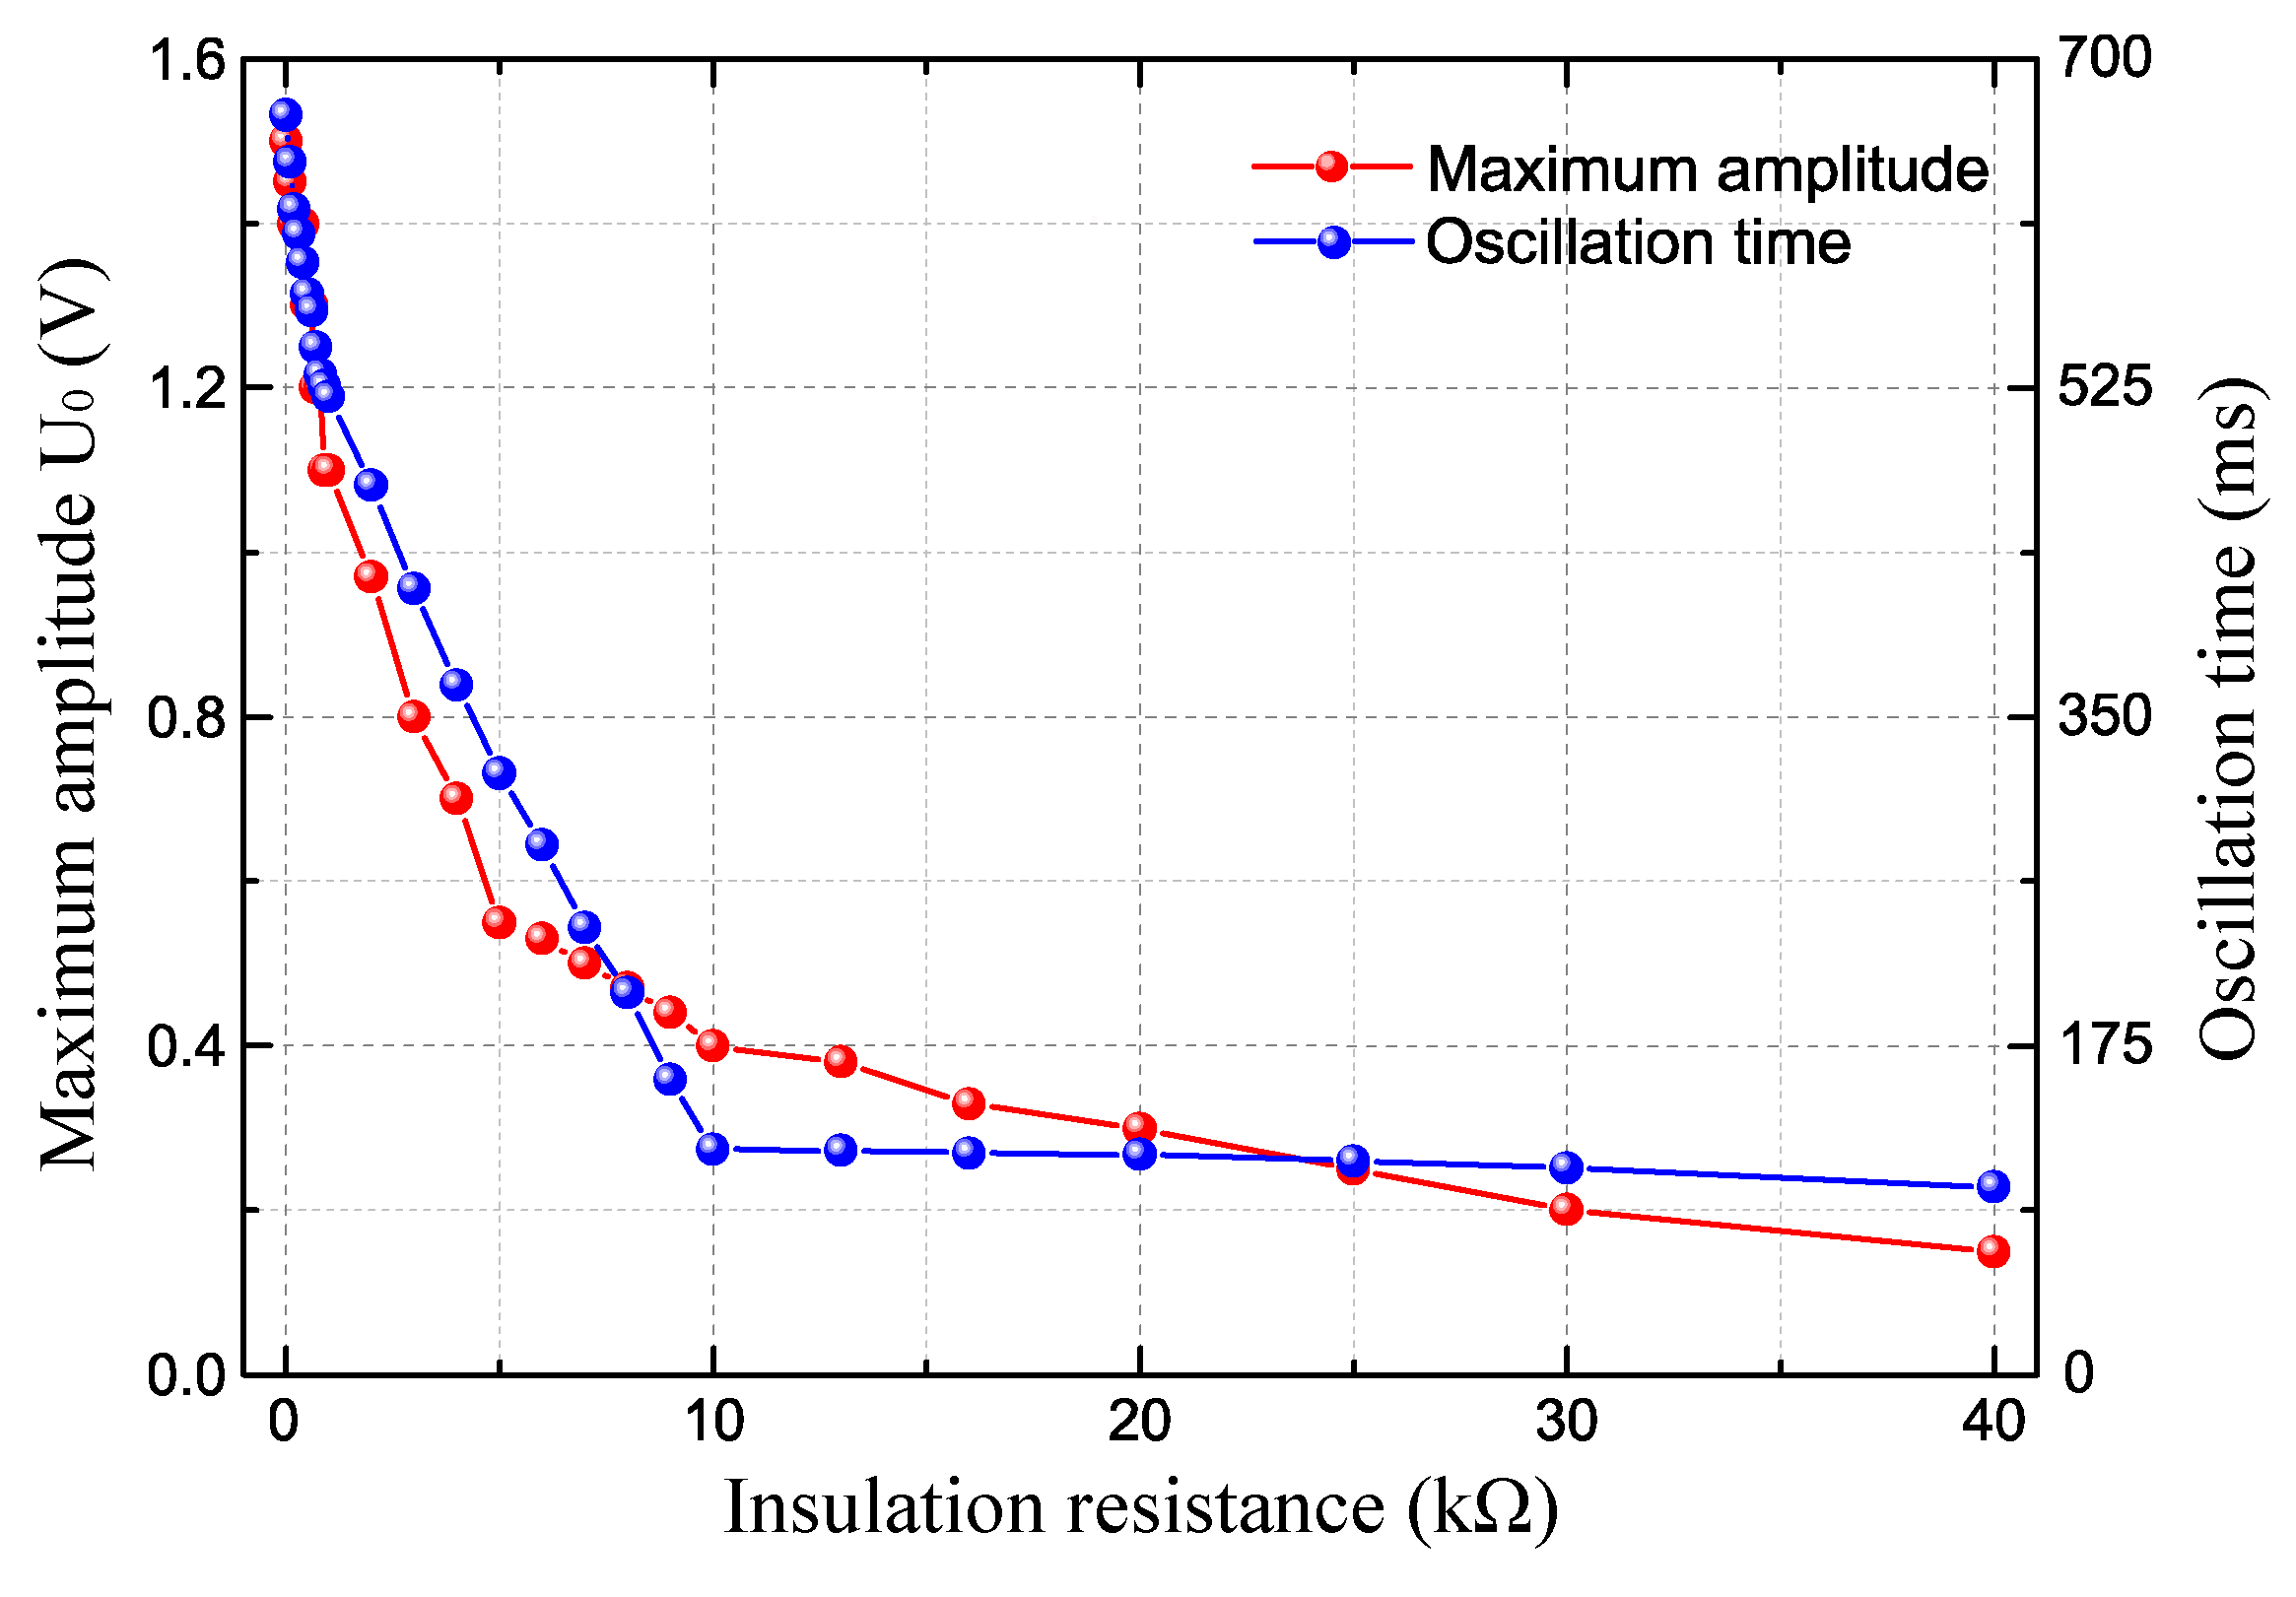
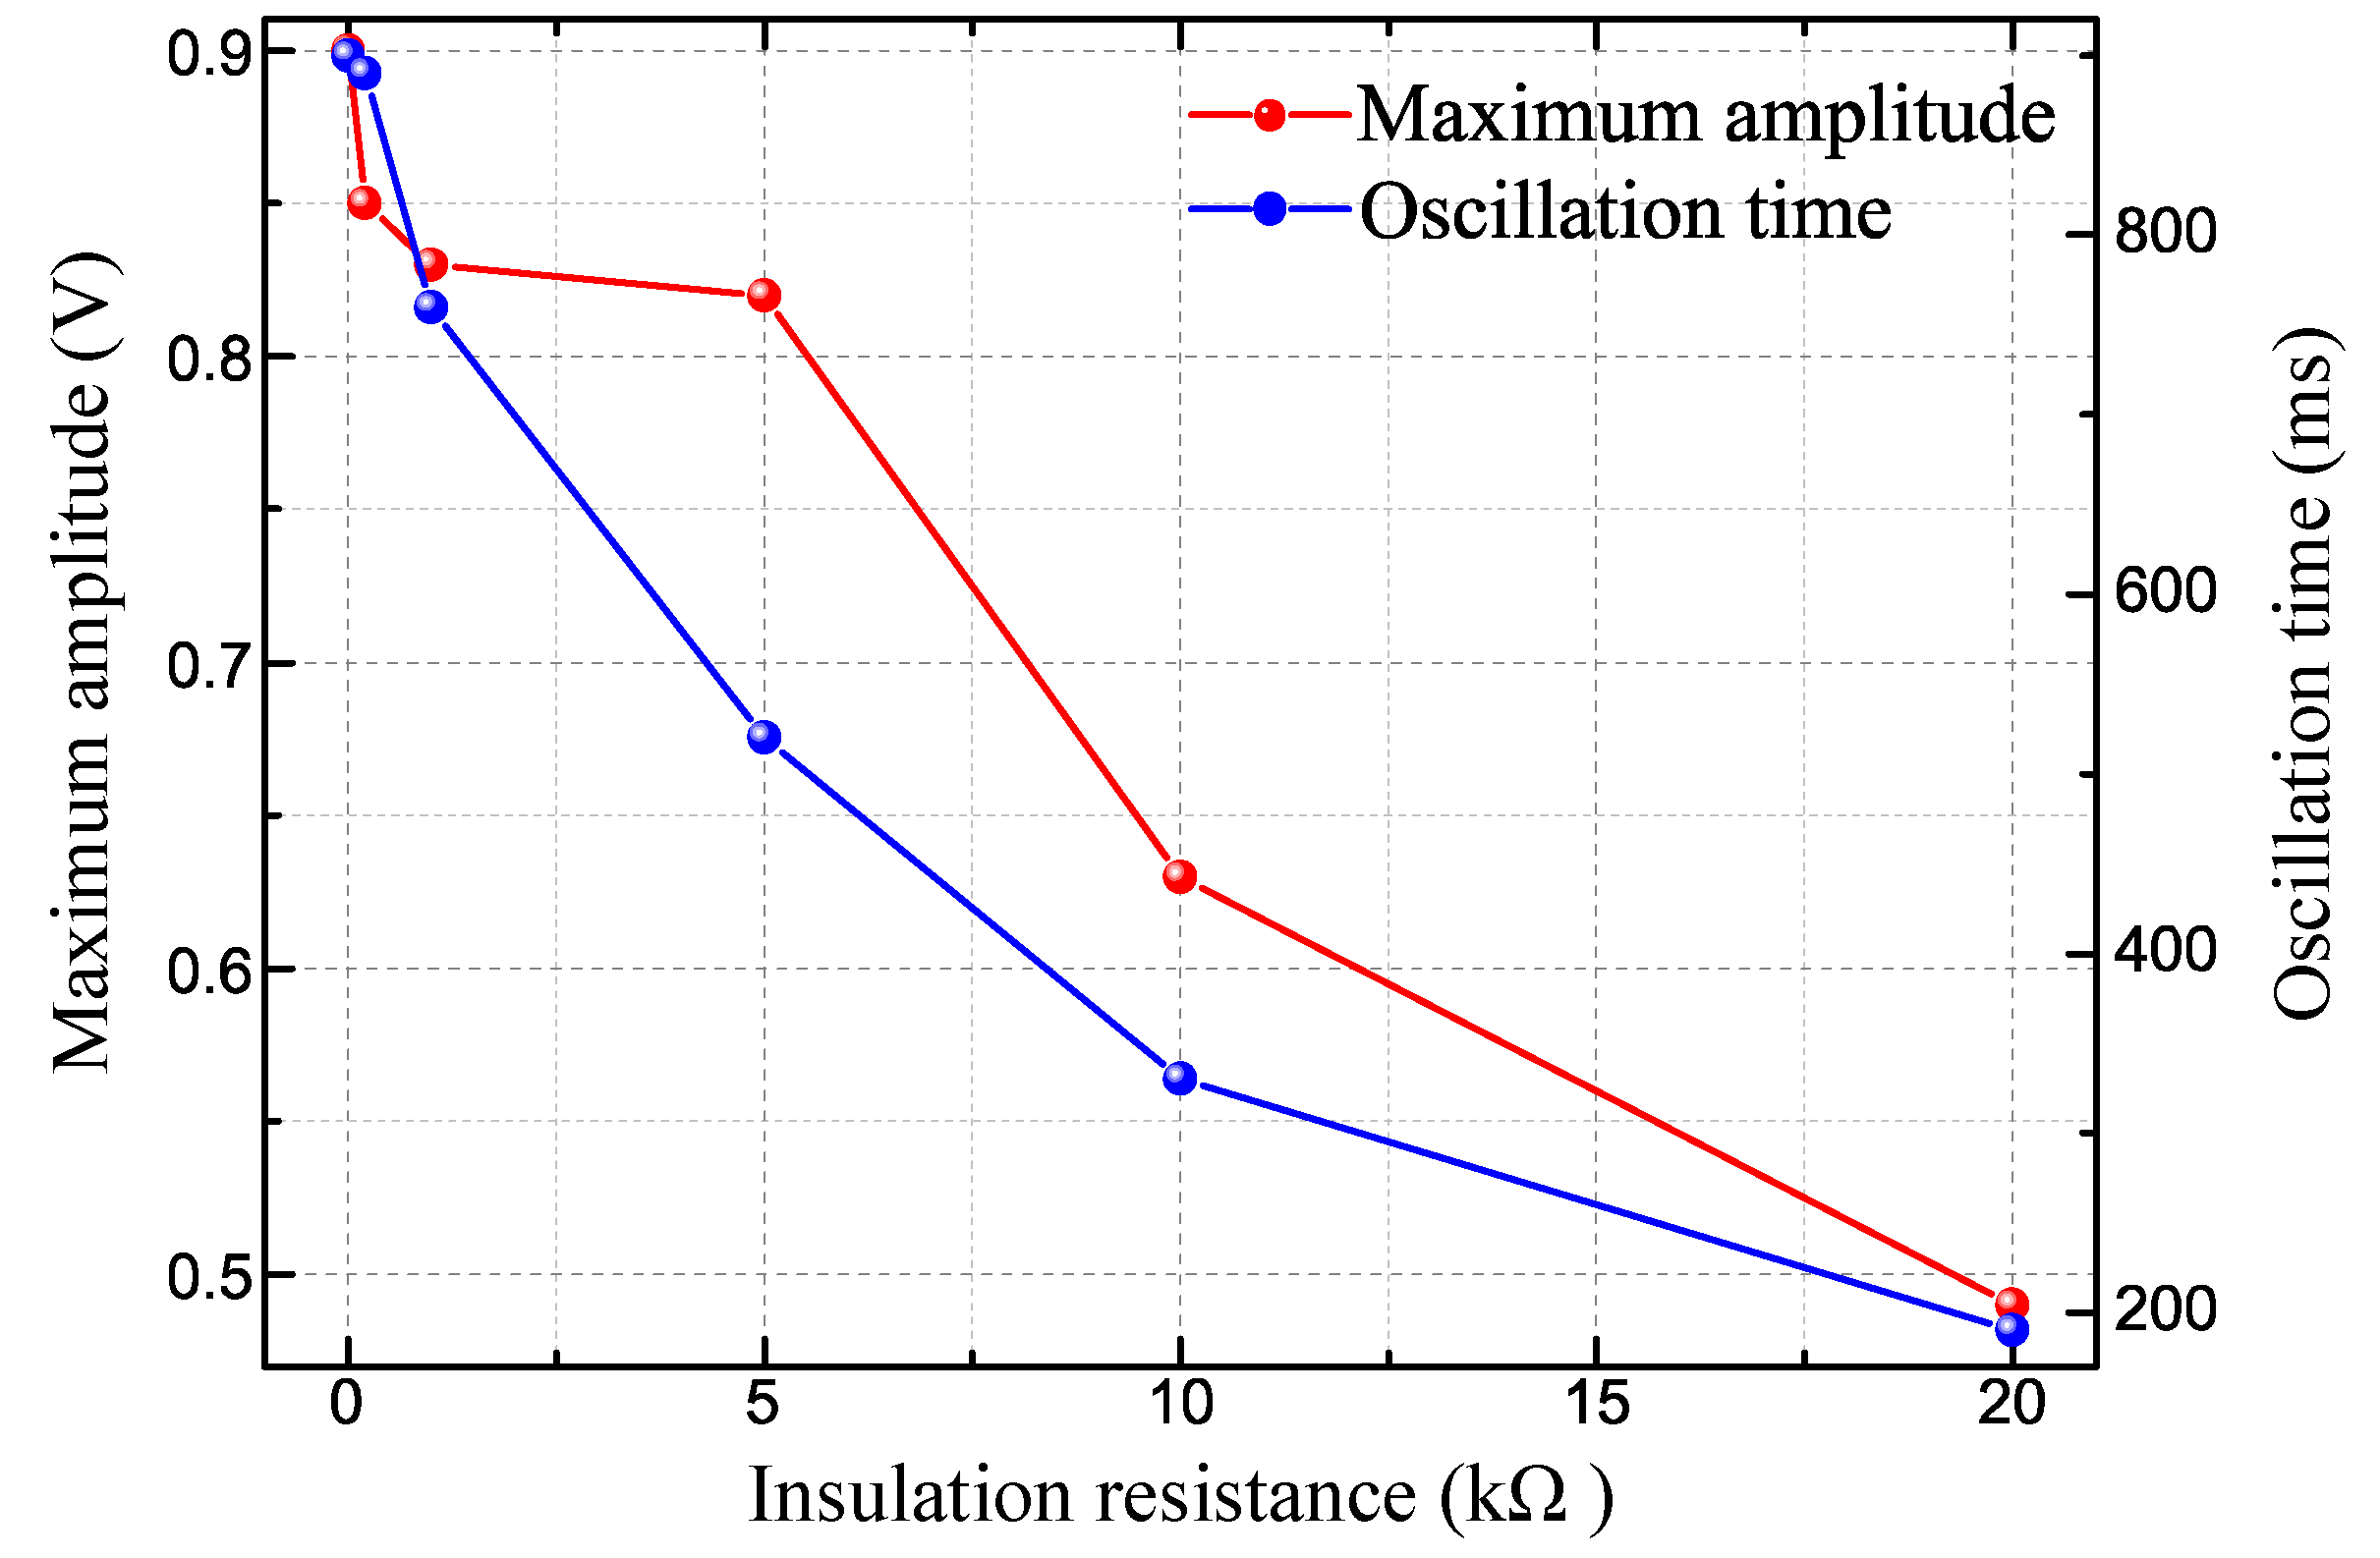
Figure 12 shows the simulation results for the maximum low-frequency oscillation amplitude and duration of
U0 as the insulation resistance
R changes after K1 is closed and opened.
It can be seen from the change in zero-sequence voltage that when the insulation resistance value R is 0–40 kΩ, a low-frequency oscillation with a duration of about several hundred milliseconds and an oscillation frequency of about 10 Hz occurs. Both the voltage amplitude and the oscillation time are inversely proportional to the insulation resistance and proportional to the degree of insulation degradation of the VT winding. When the insulation resistance value R ranges from 10 kΩ to insulation breakdown, the variation of the characteristic parameters of the zero-sequence voltage low-frequency oscillation is obvious. When resistance R decreases from 40 kΩ to 10 kΩ, the variation of the low-frequency oscillation parameters is relatively flat. When the insulation resistance exceeds 40 kΩ, both the voltage amplitude and oscillation time are not much different from those of normal insulation. When the VT insulation is normal, the low frequency oscillation frequency appearing on the zero-sequence voltage is about 30 Hz, and the oscillation amplitude is below 0.1 V. Therefore, in order to avoid deterioration of VT insulation and cause a larger grid accident, we can evaluate the insulation of the VT winding by this method, that is, the different characteristics of the VT zero-sequence voltage low-frequency oscillation.


