Rotor Fault Detection in Induction Motors Based on Time-Frequency Analysis Using the Bispectrum and the Autocovariance of Stray Flux Signals

 ,
, 
 and
and 
Abstract
:1. Introduction
2. Materials and Methods
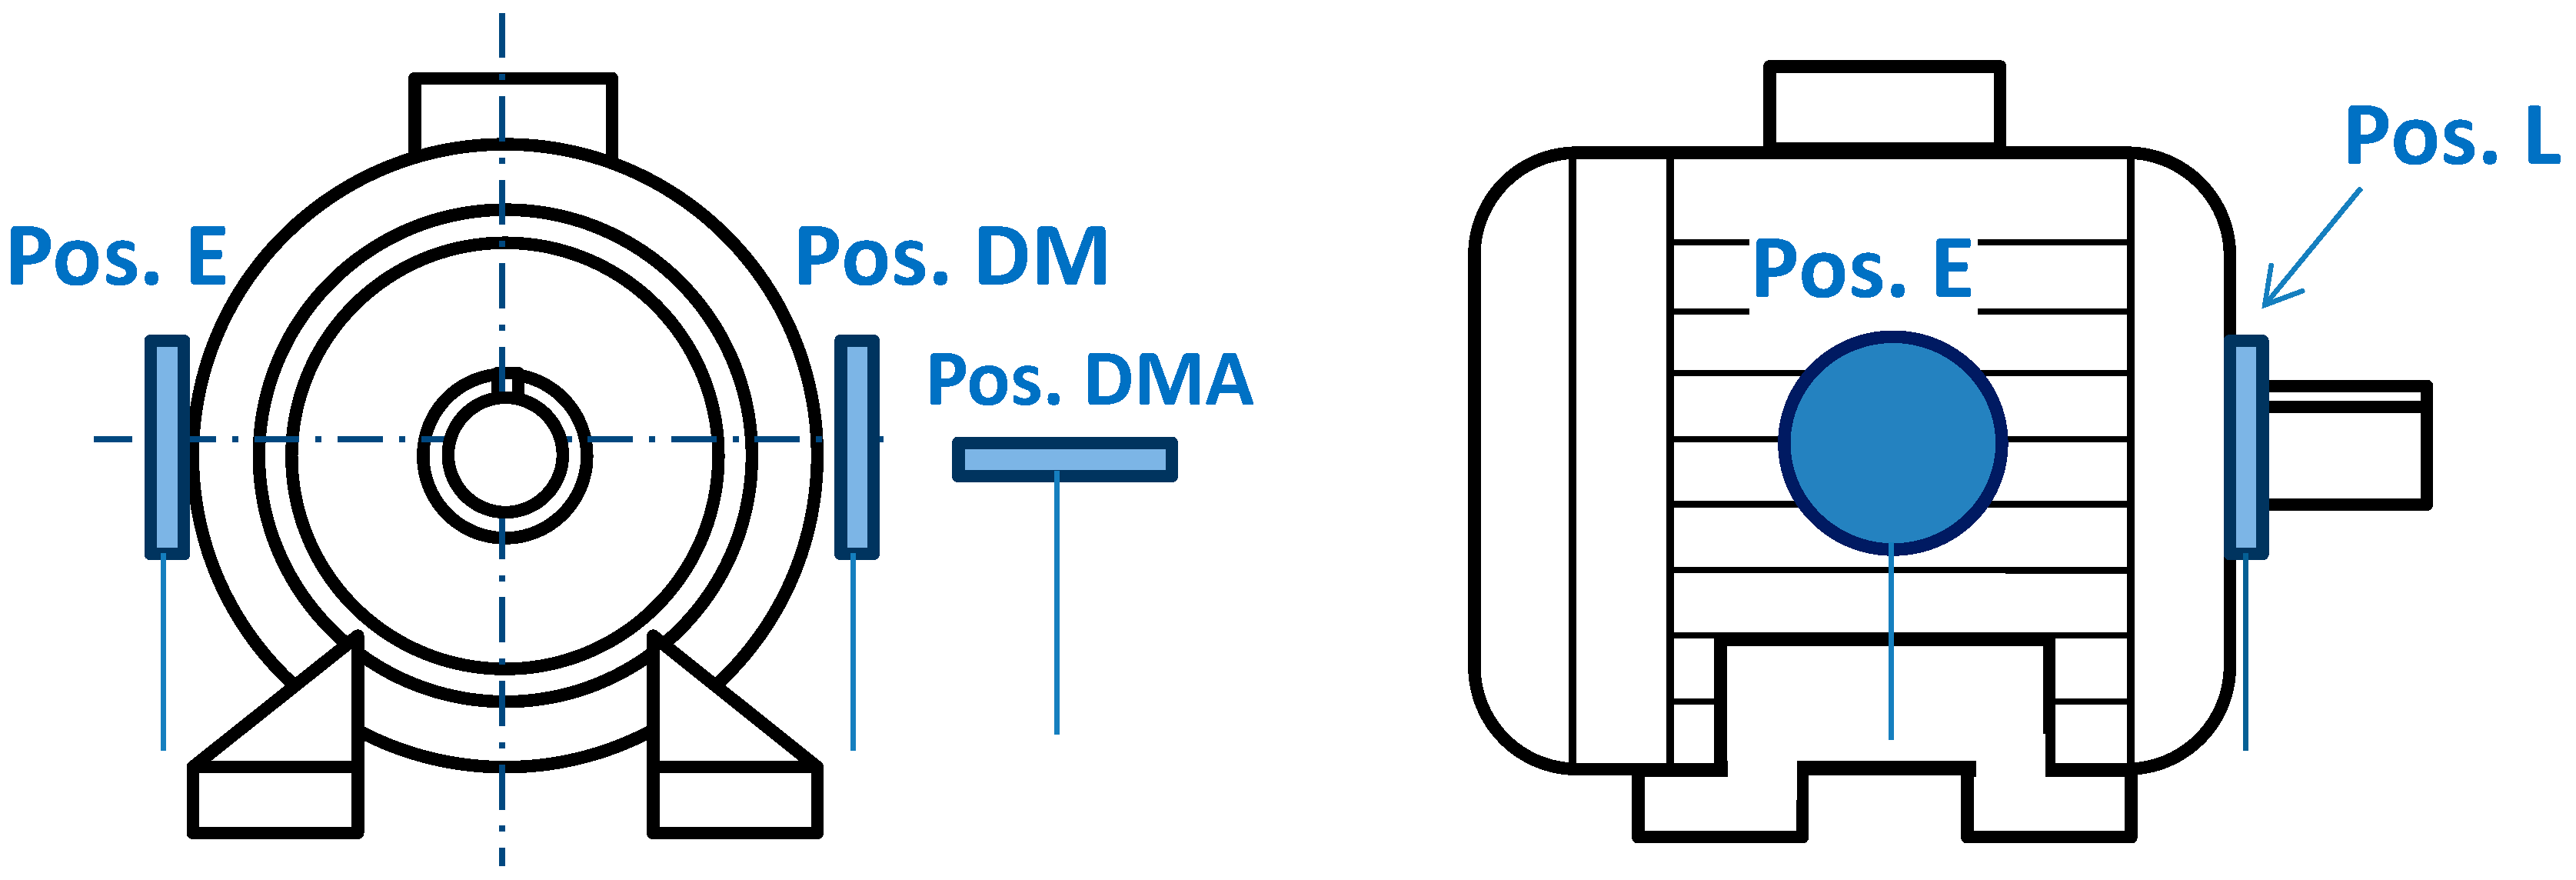
2.1. Data Acquisition
2.2. Analysis in the Frequency Domain: Theoretical Foundation
2.3. Temporal Domain Analysis
3. Results
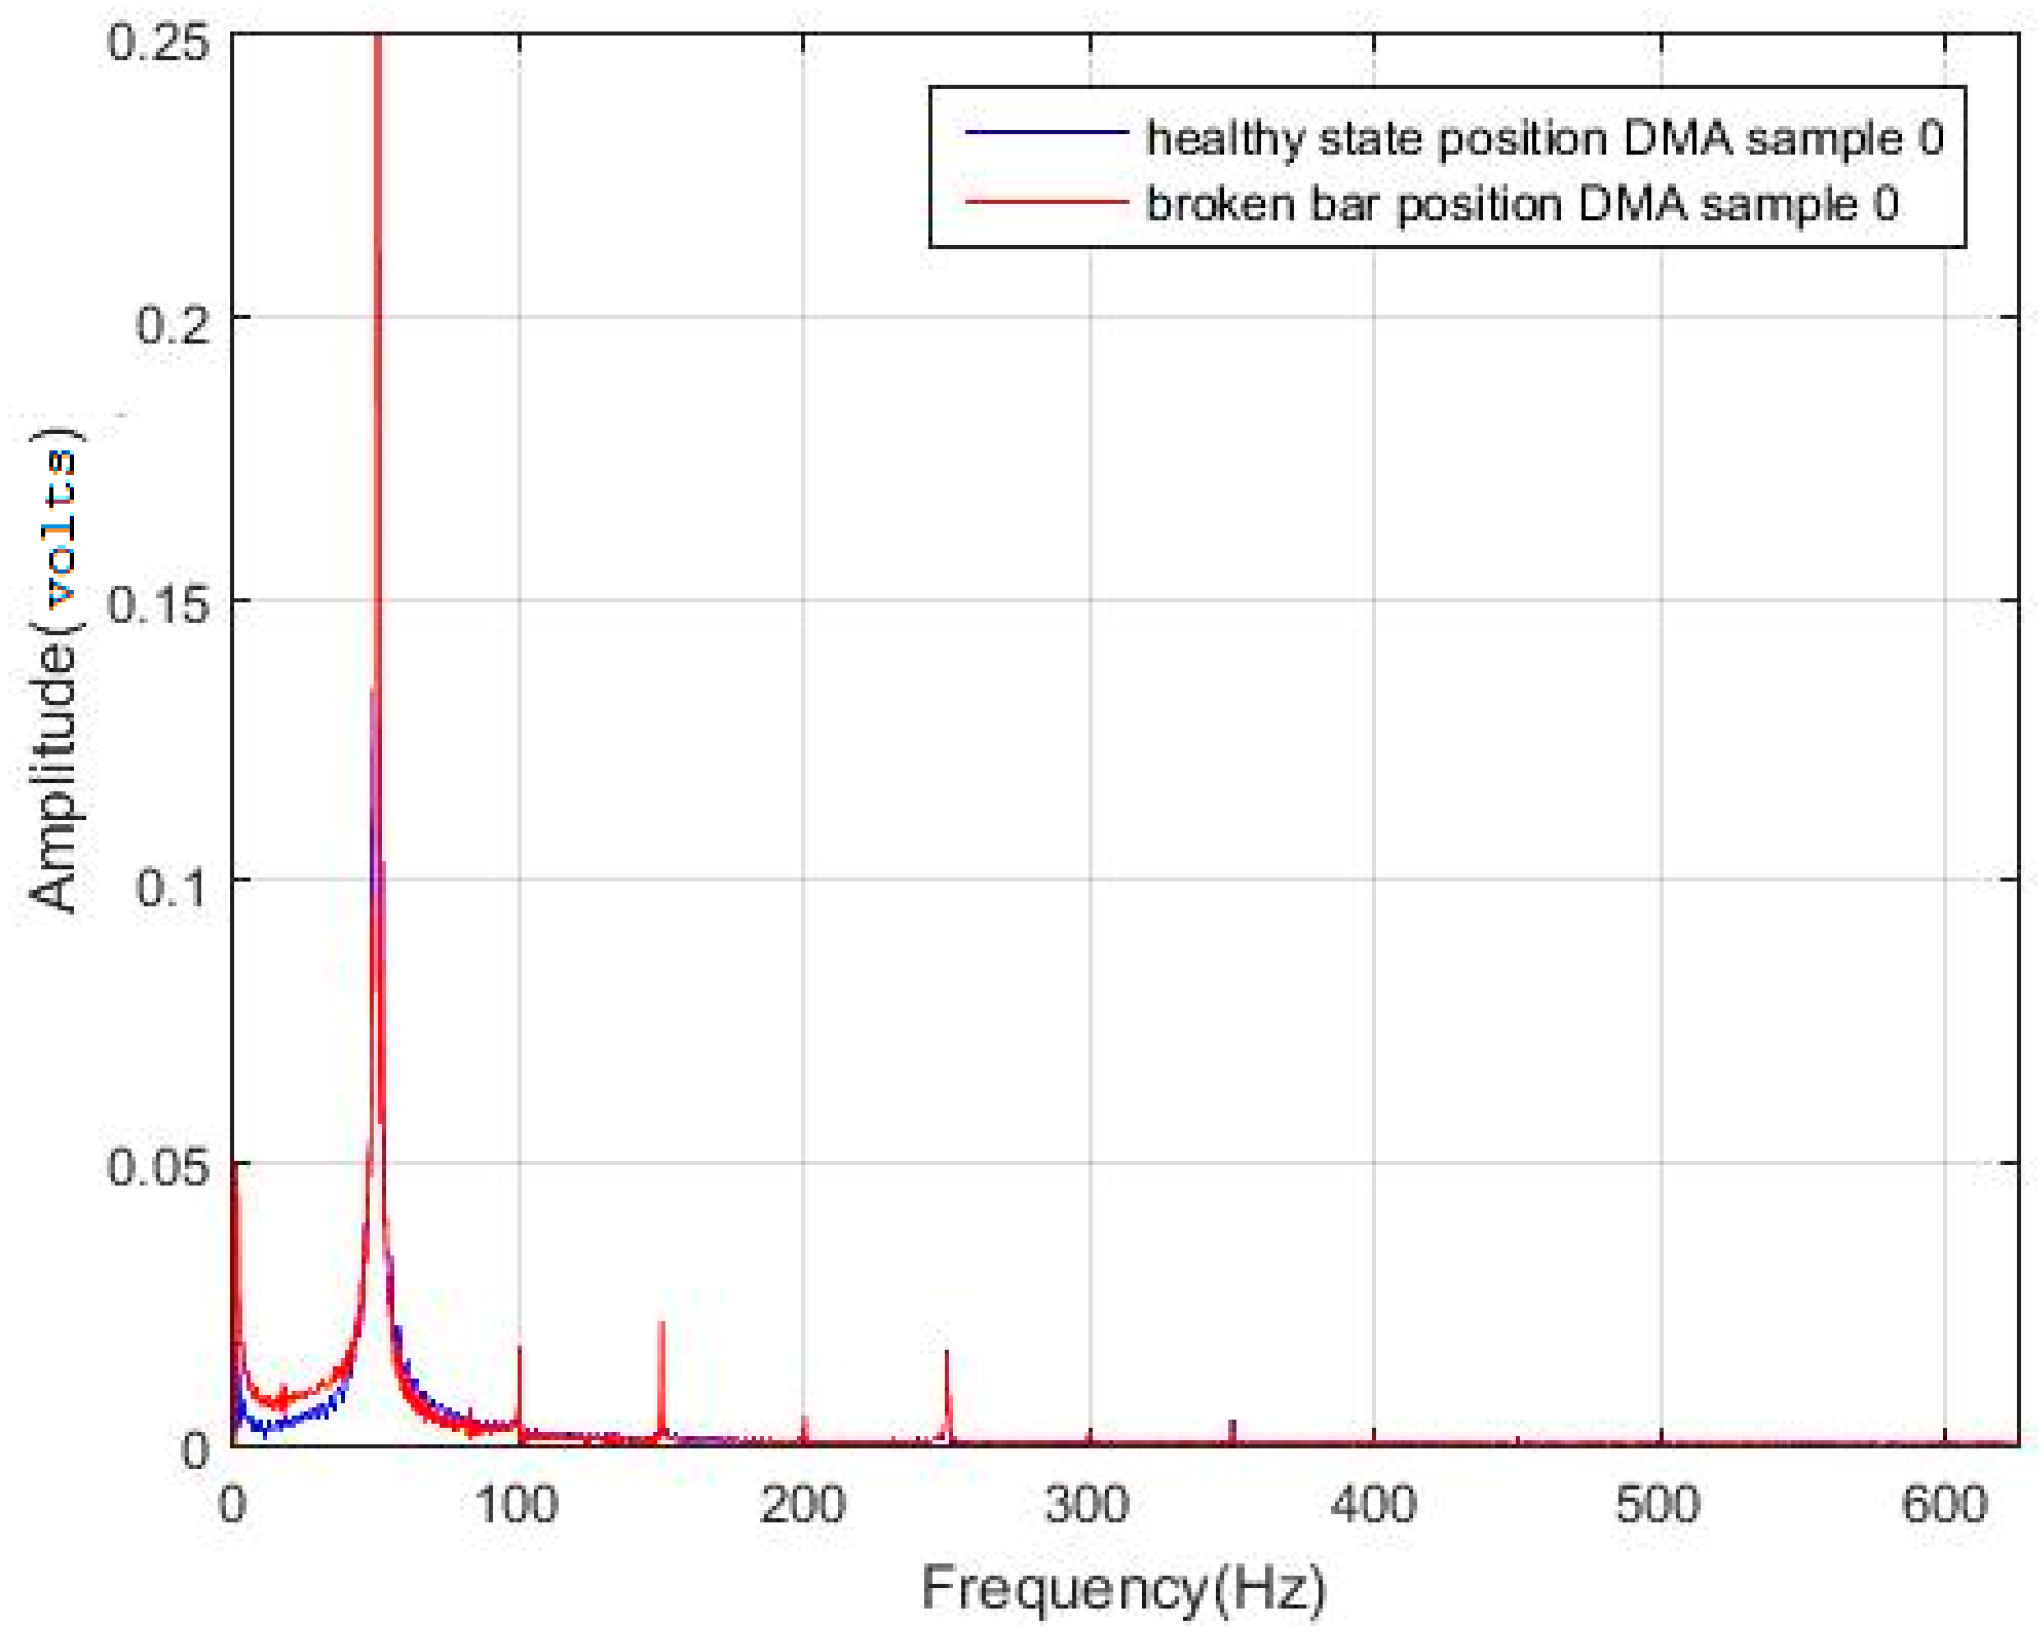
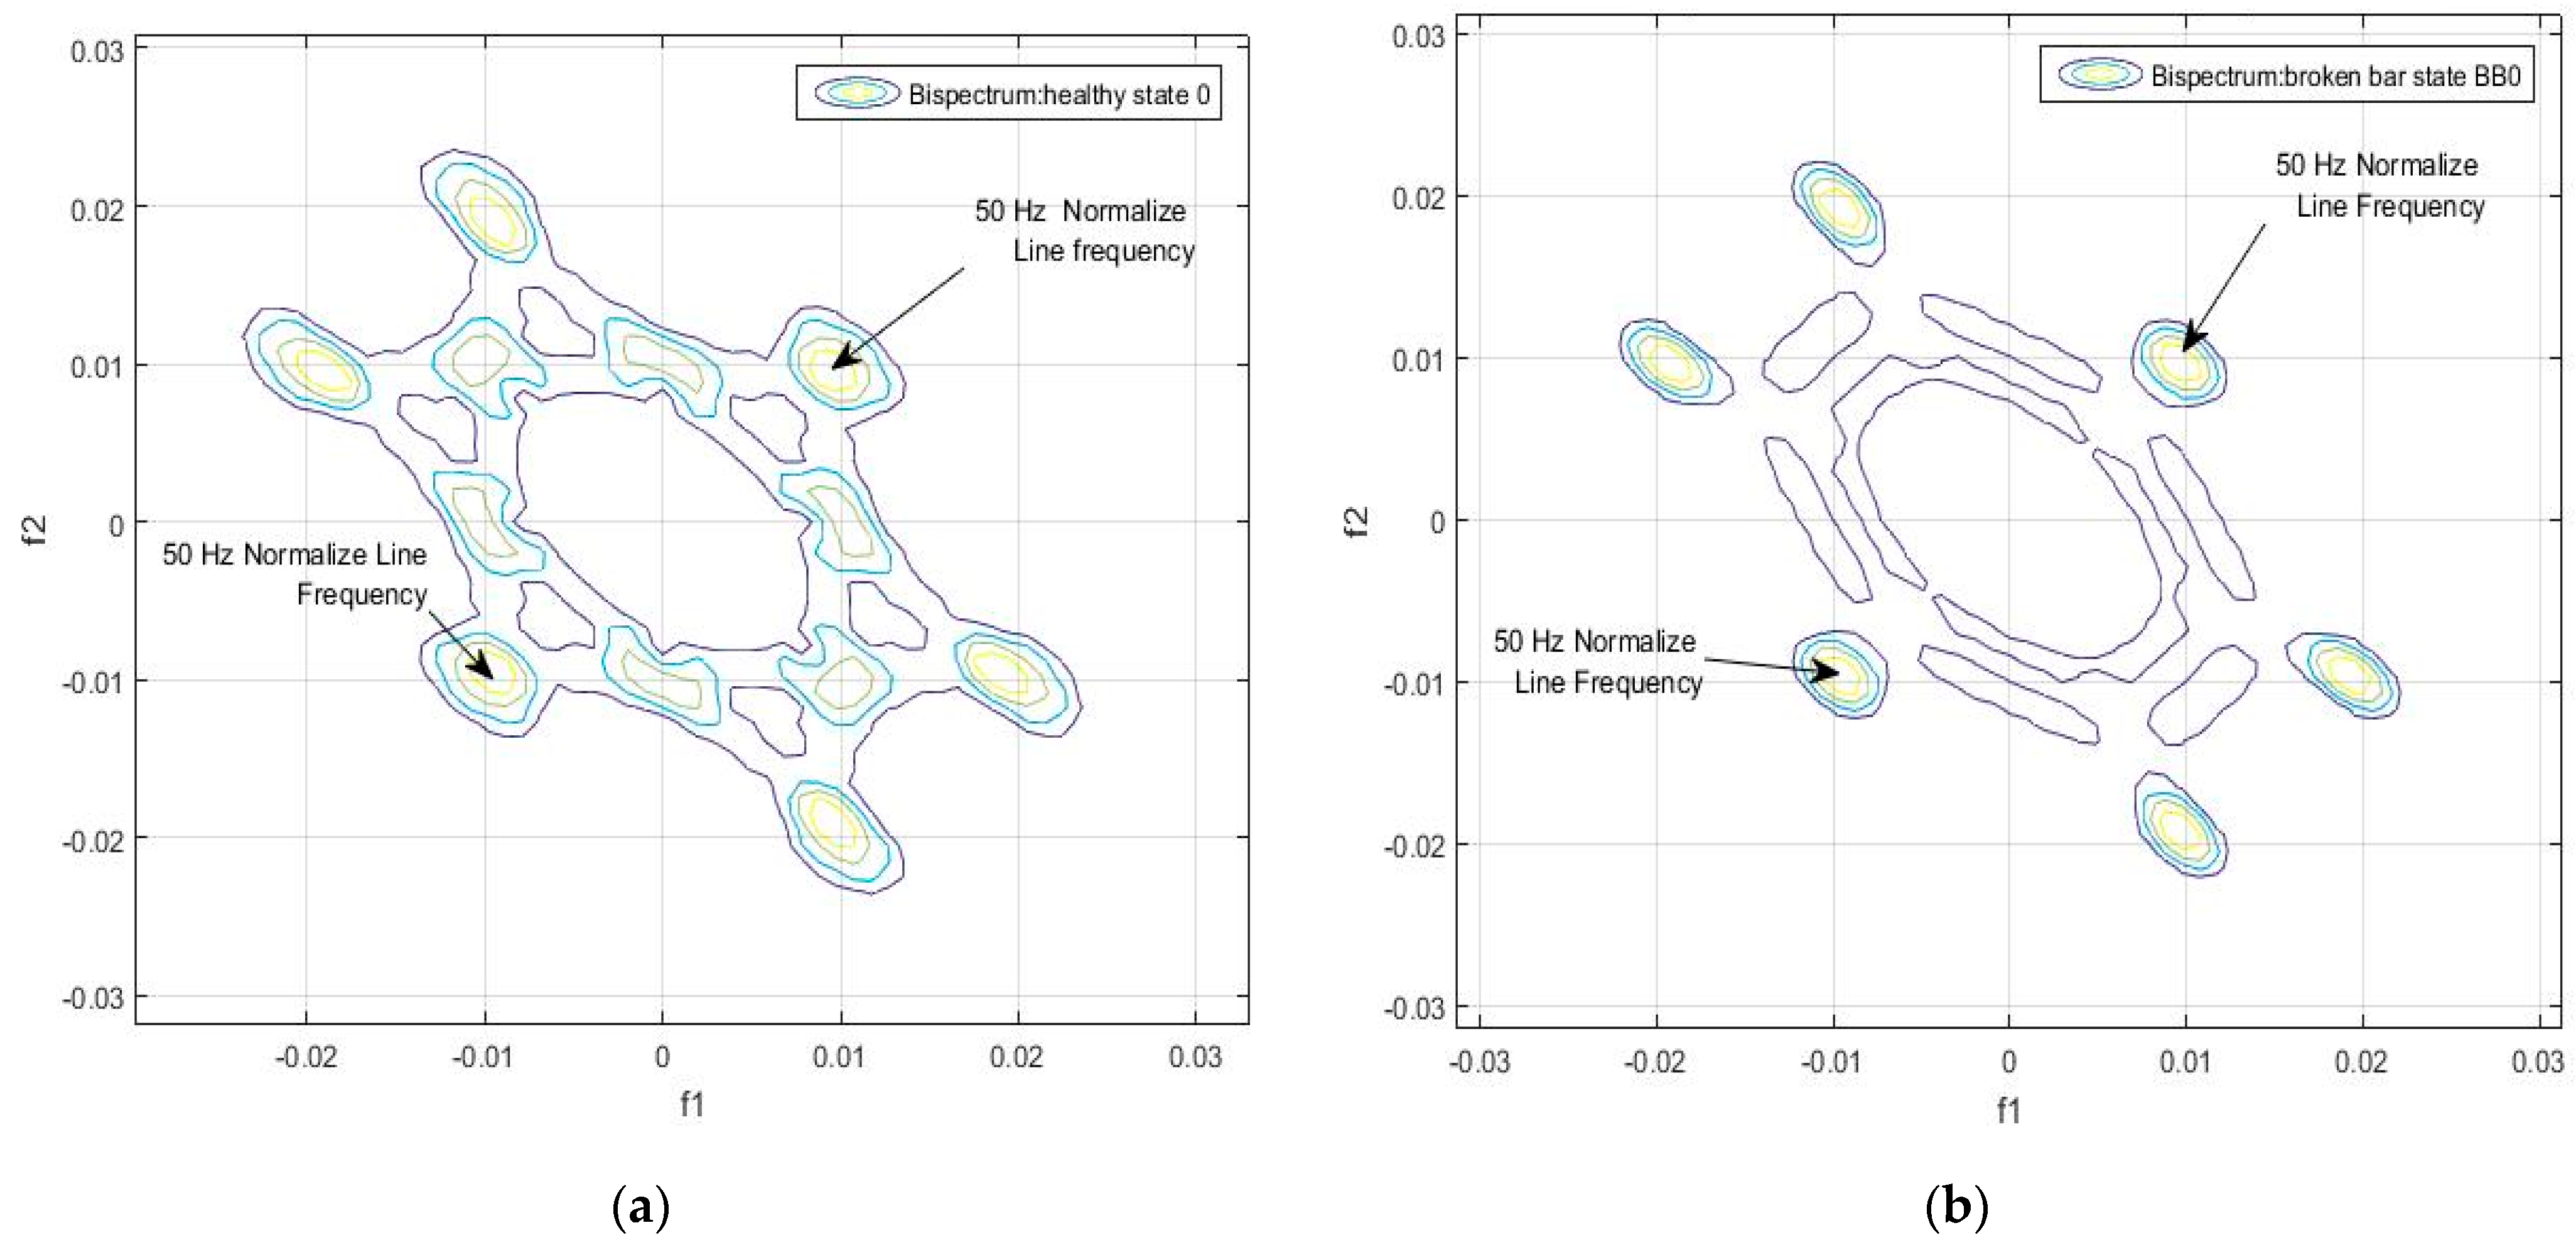
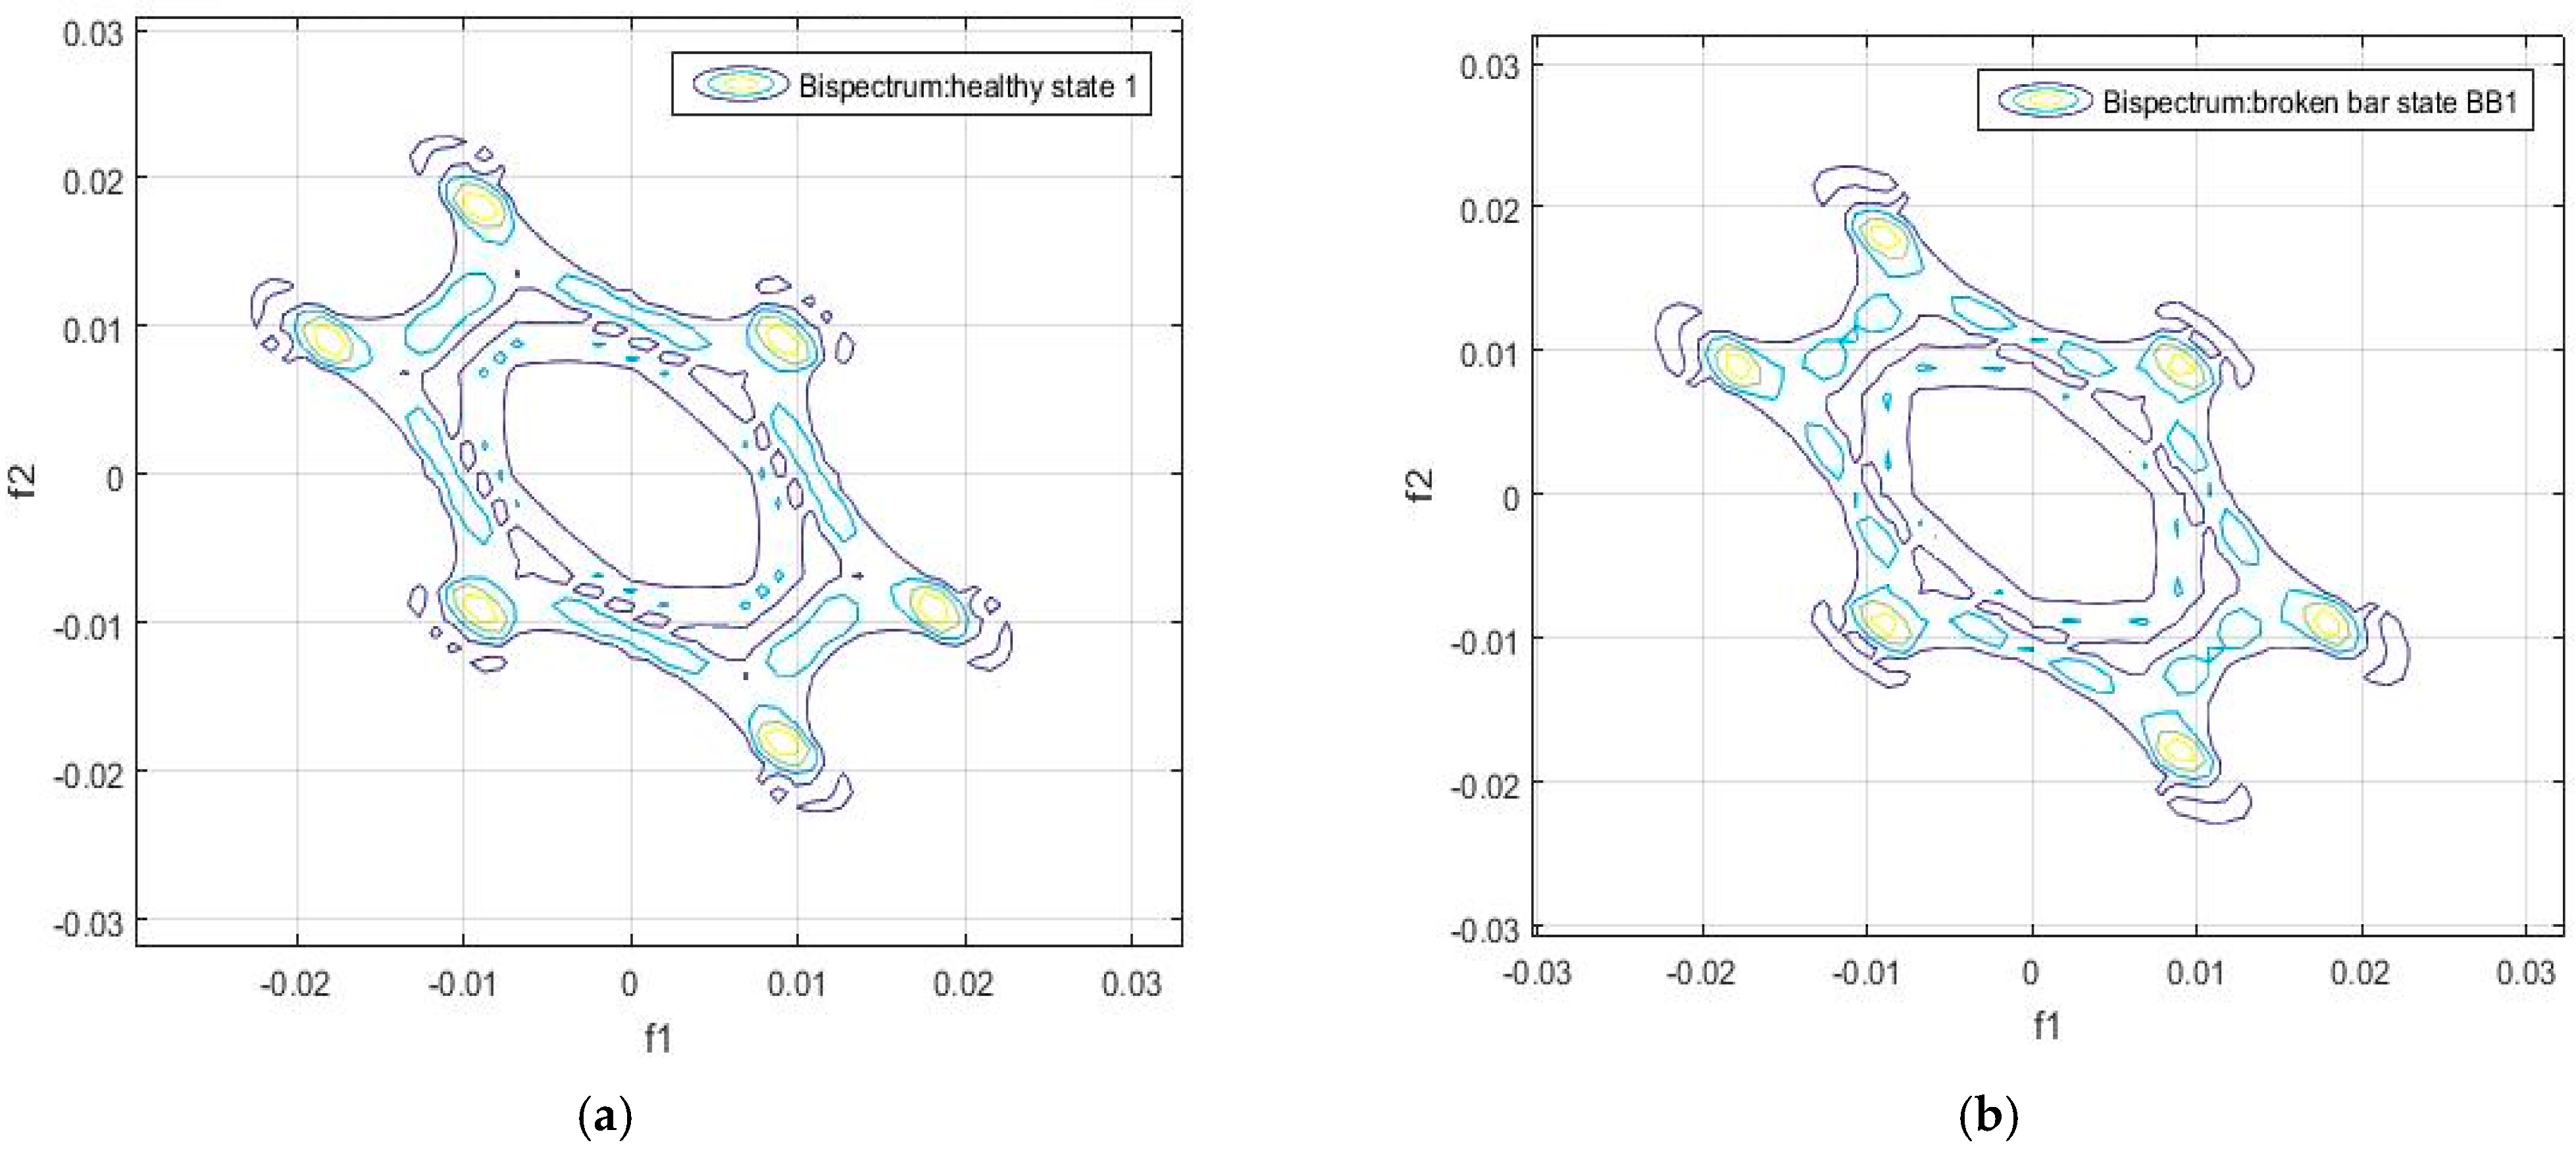
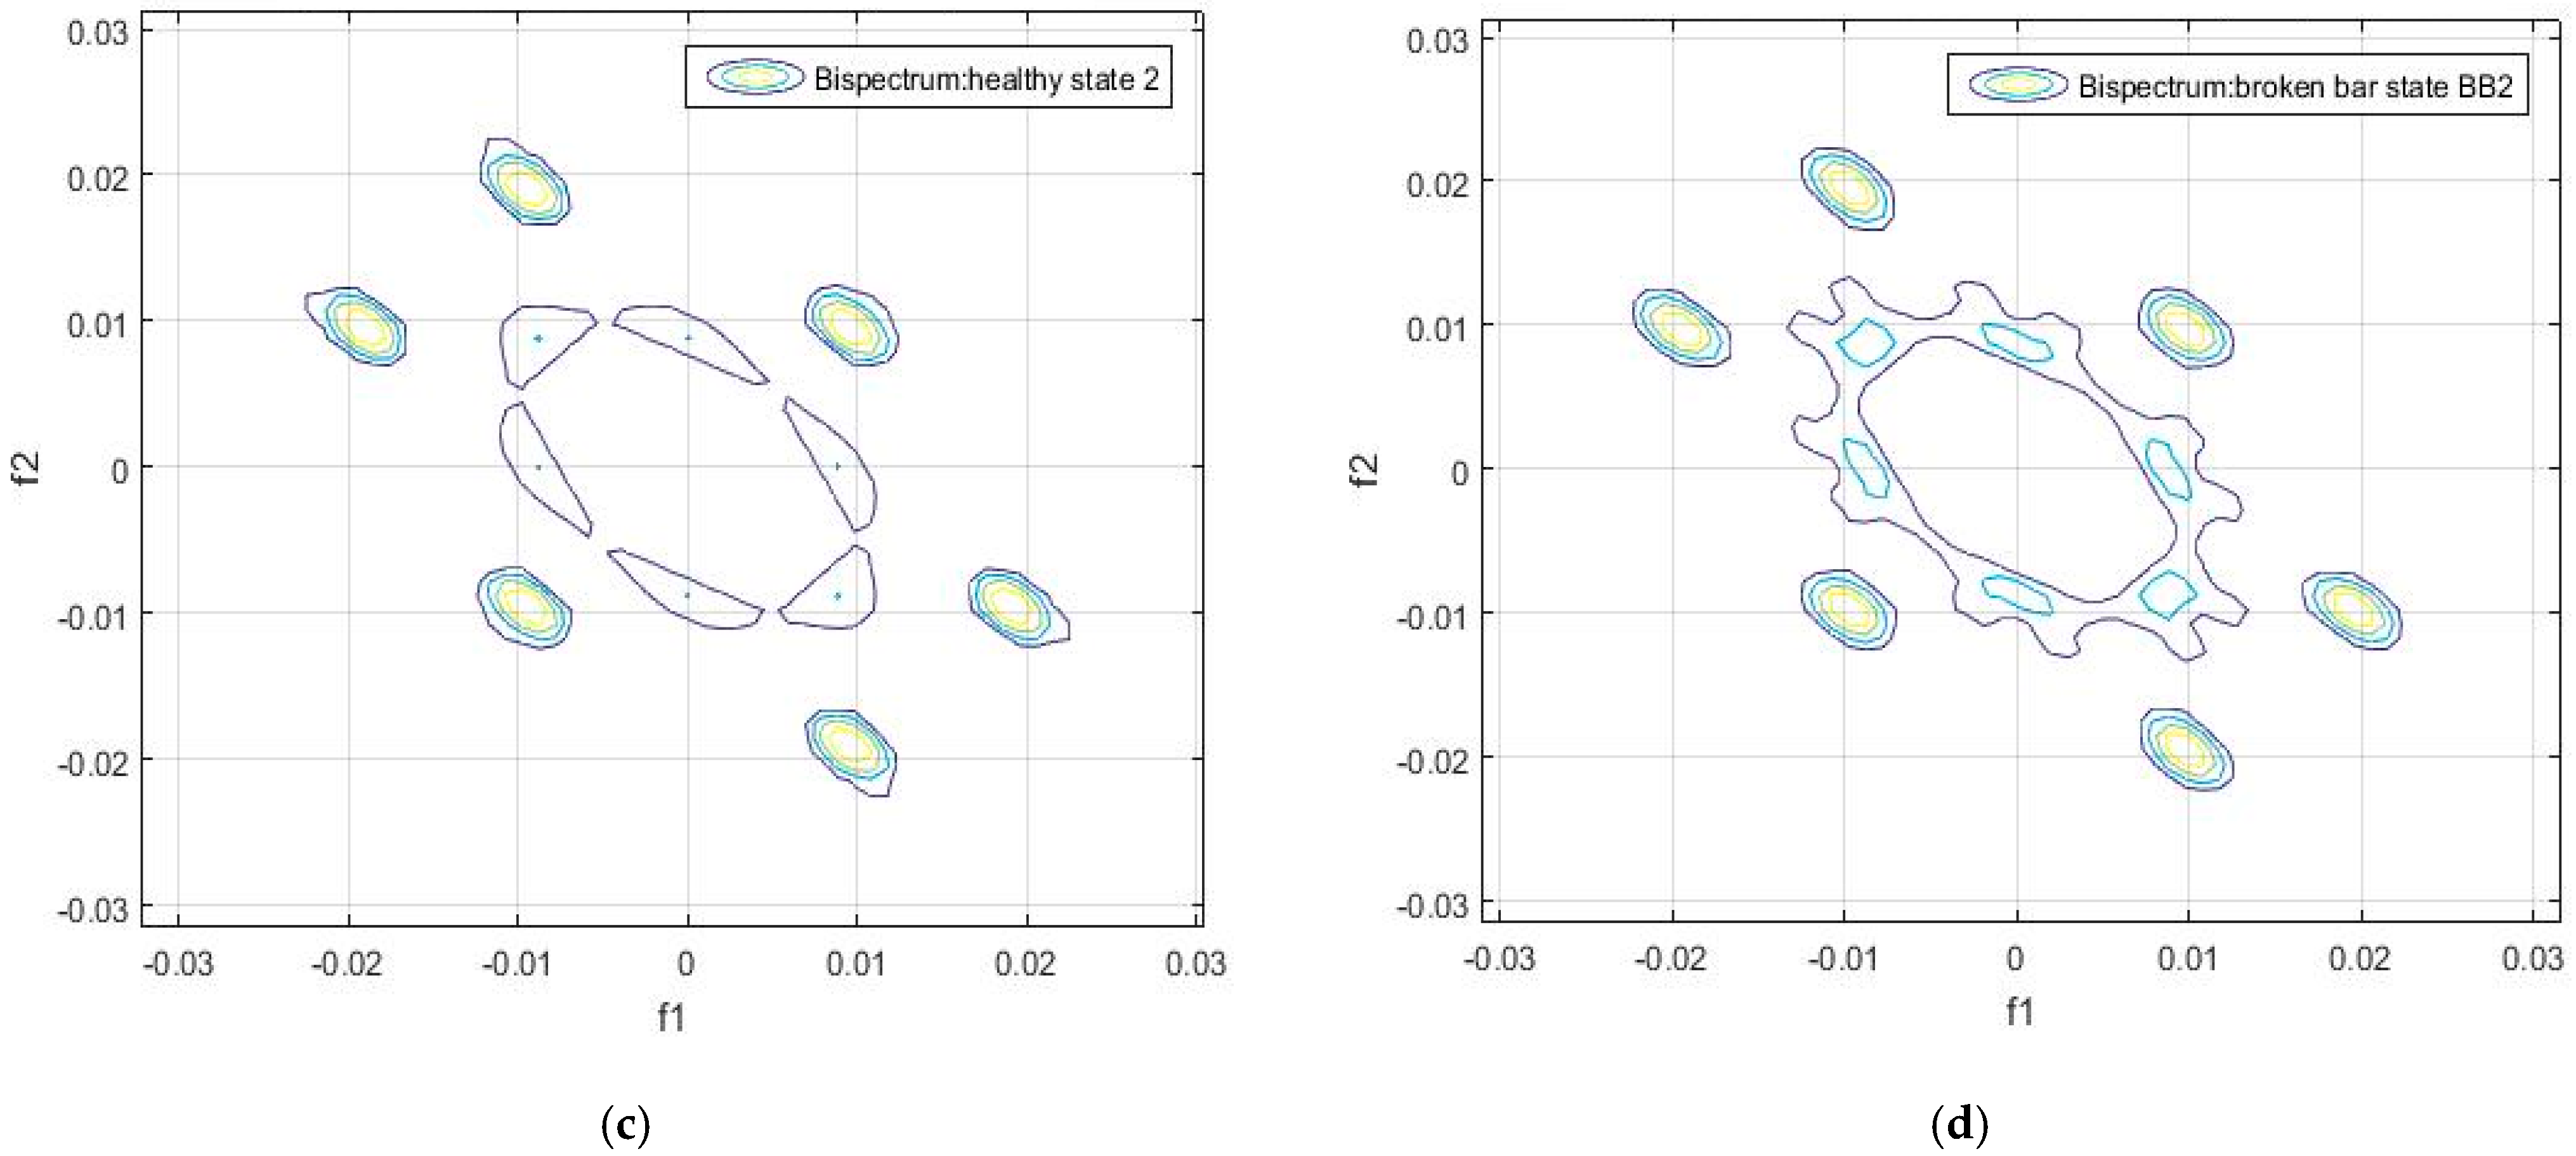
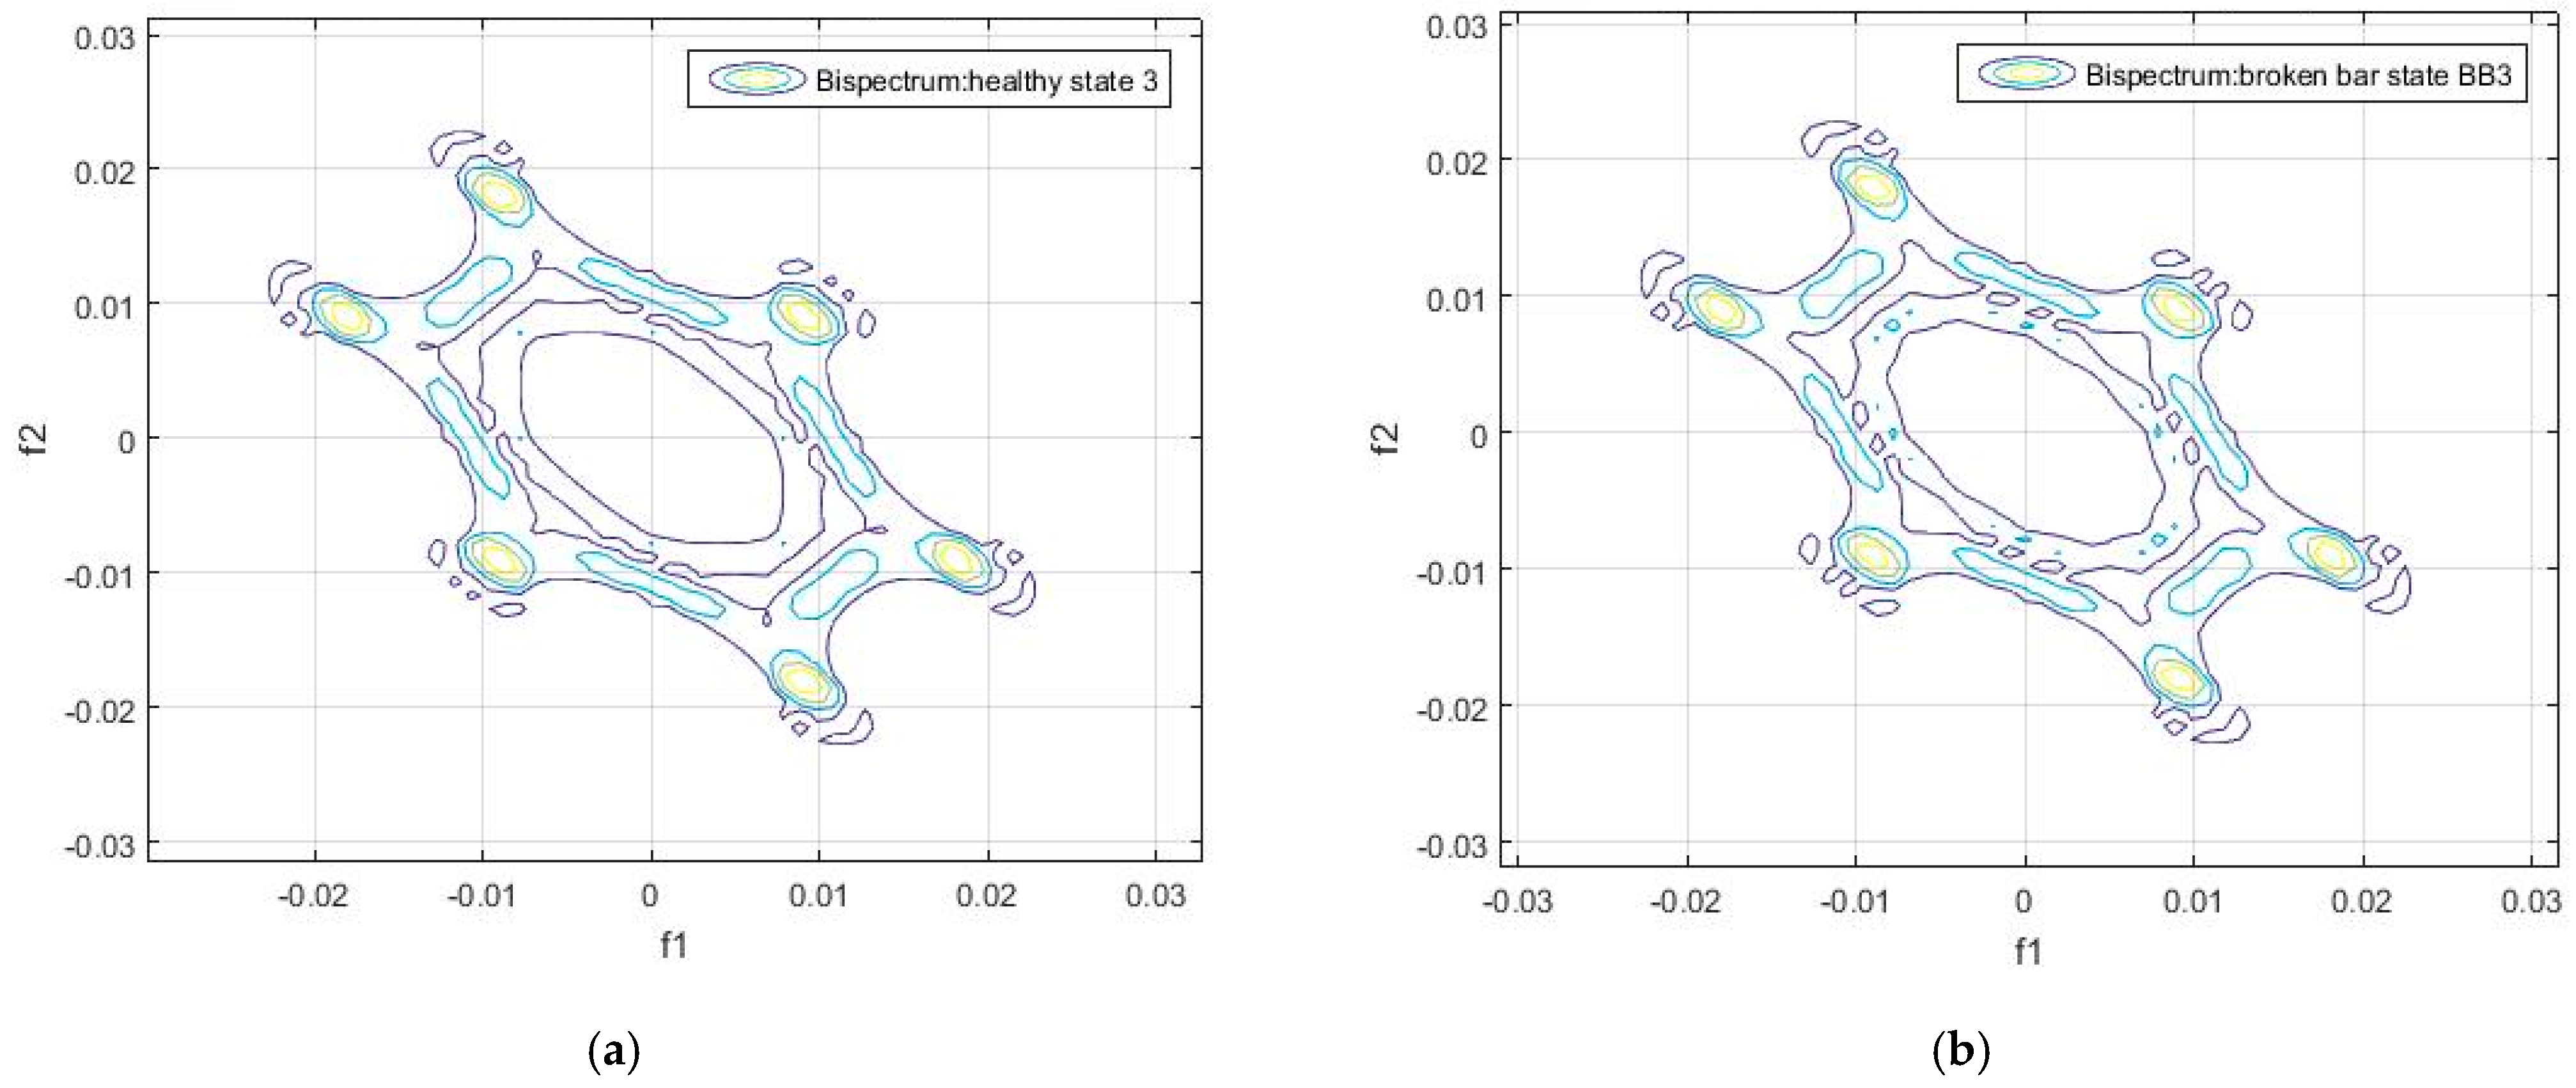
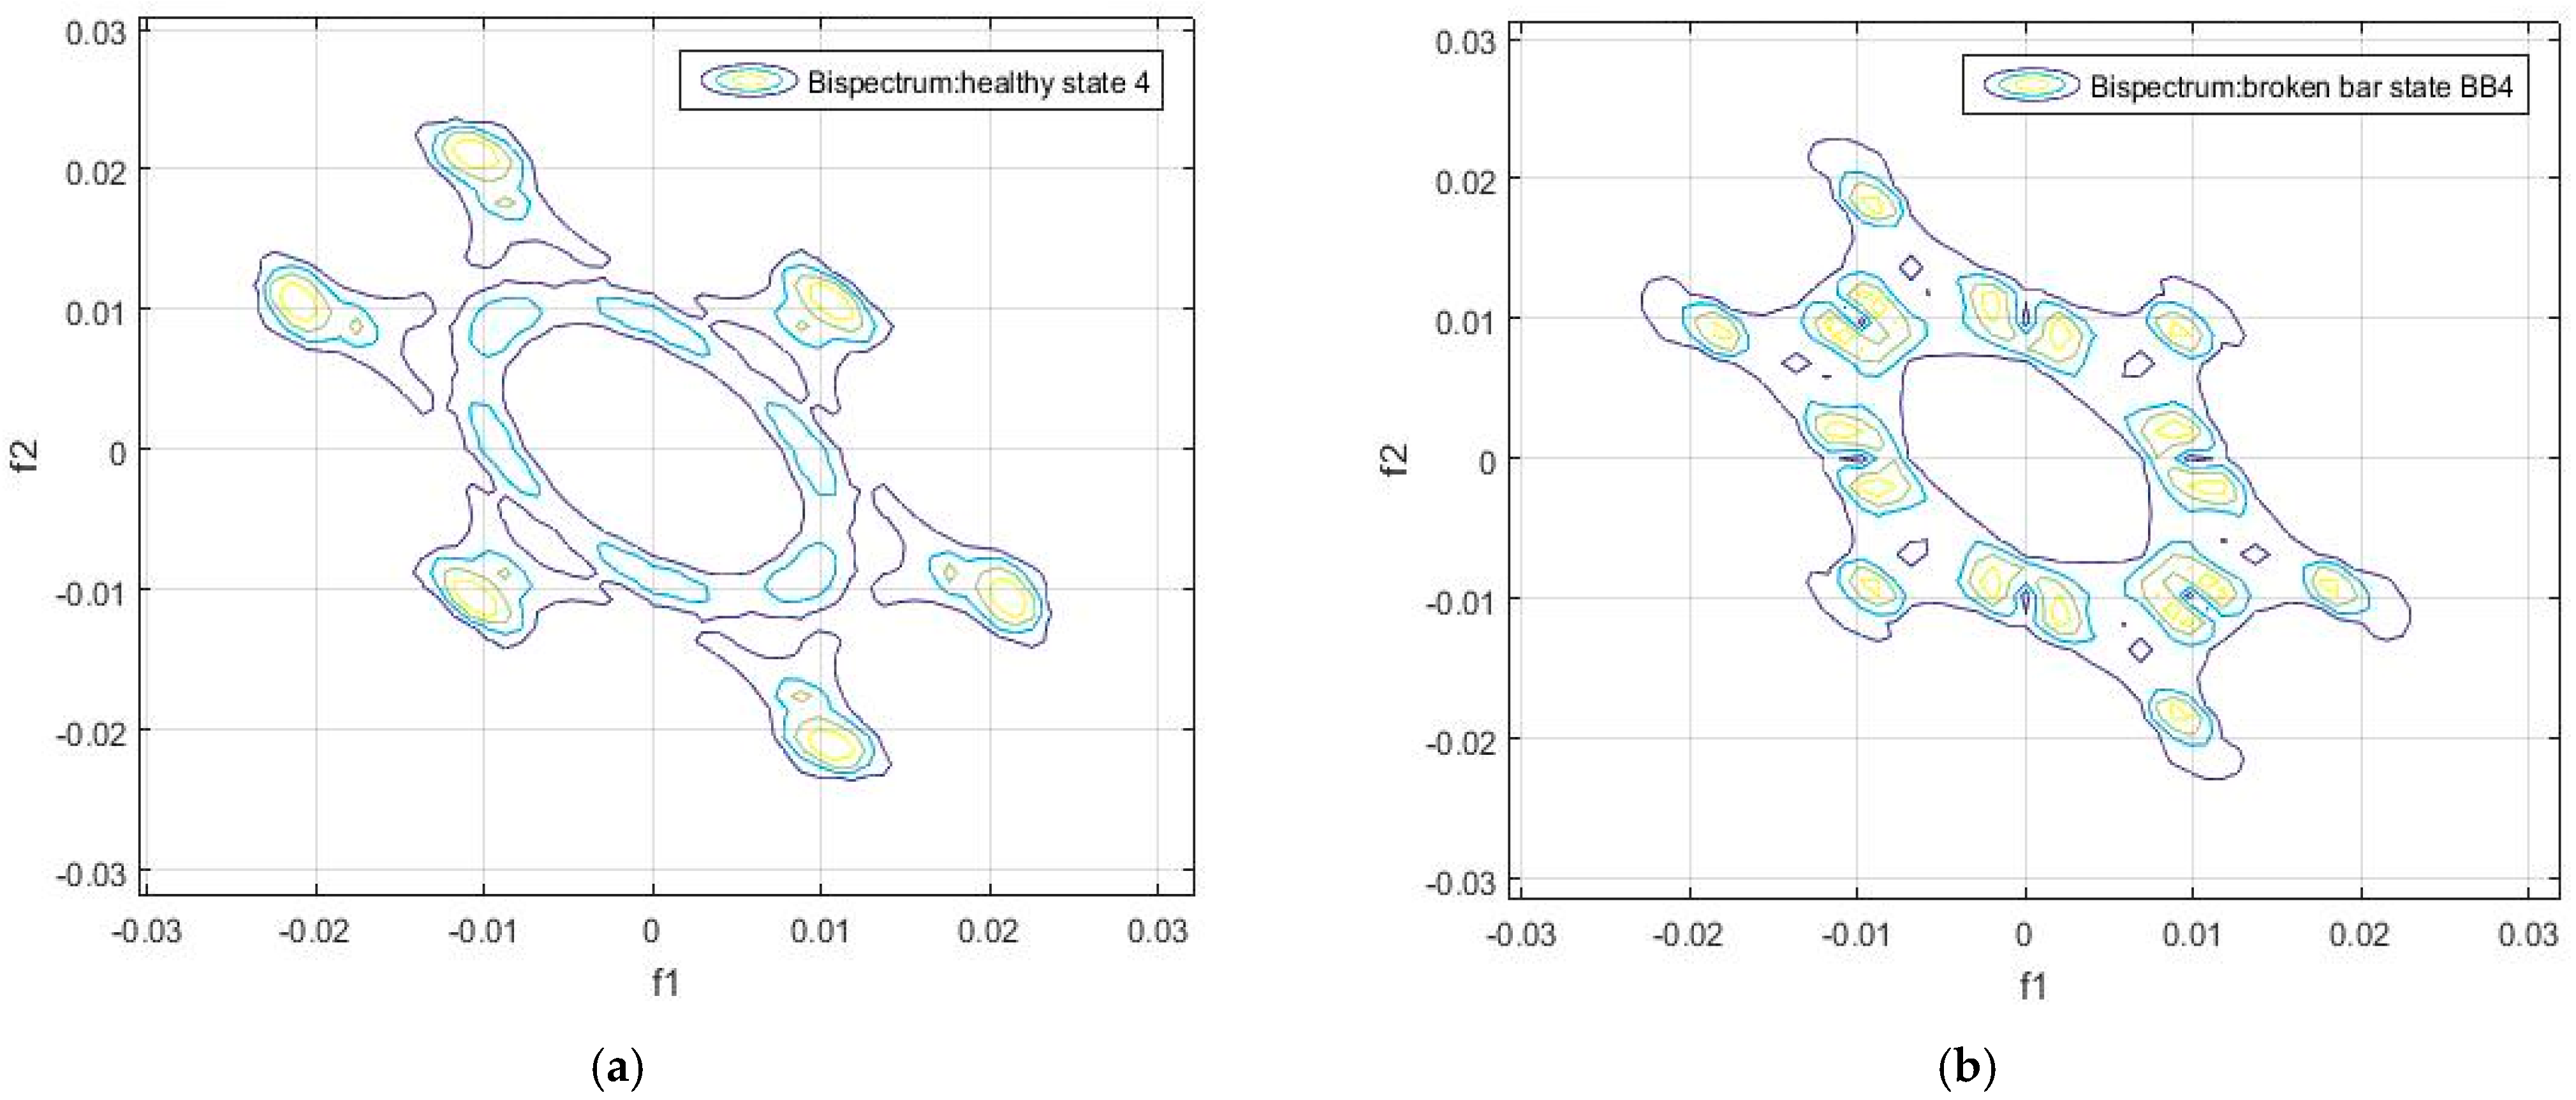
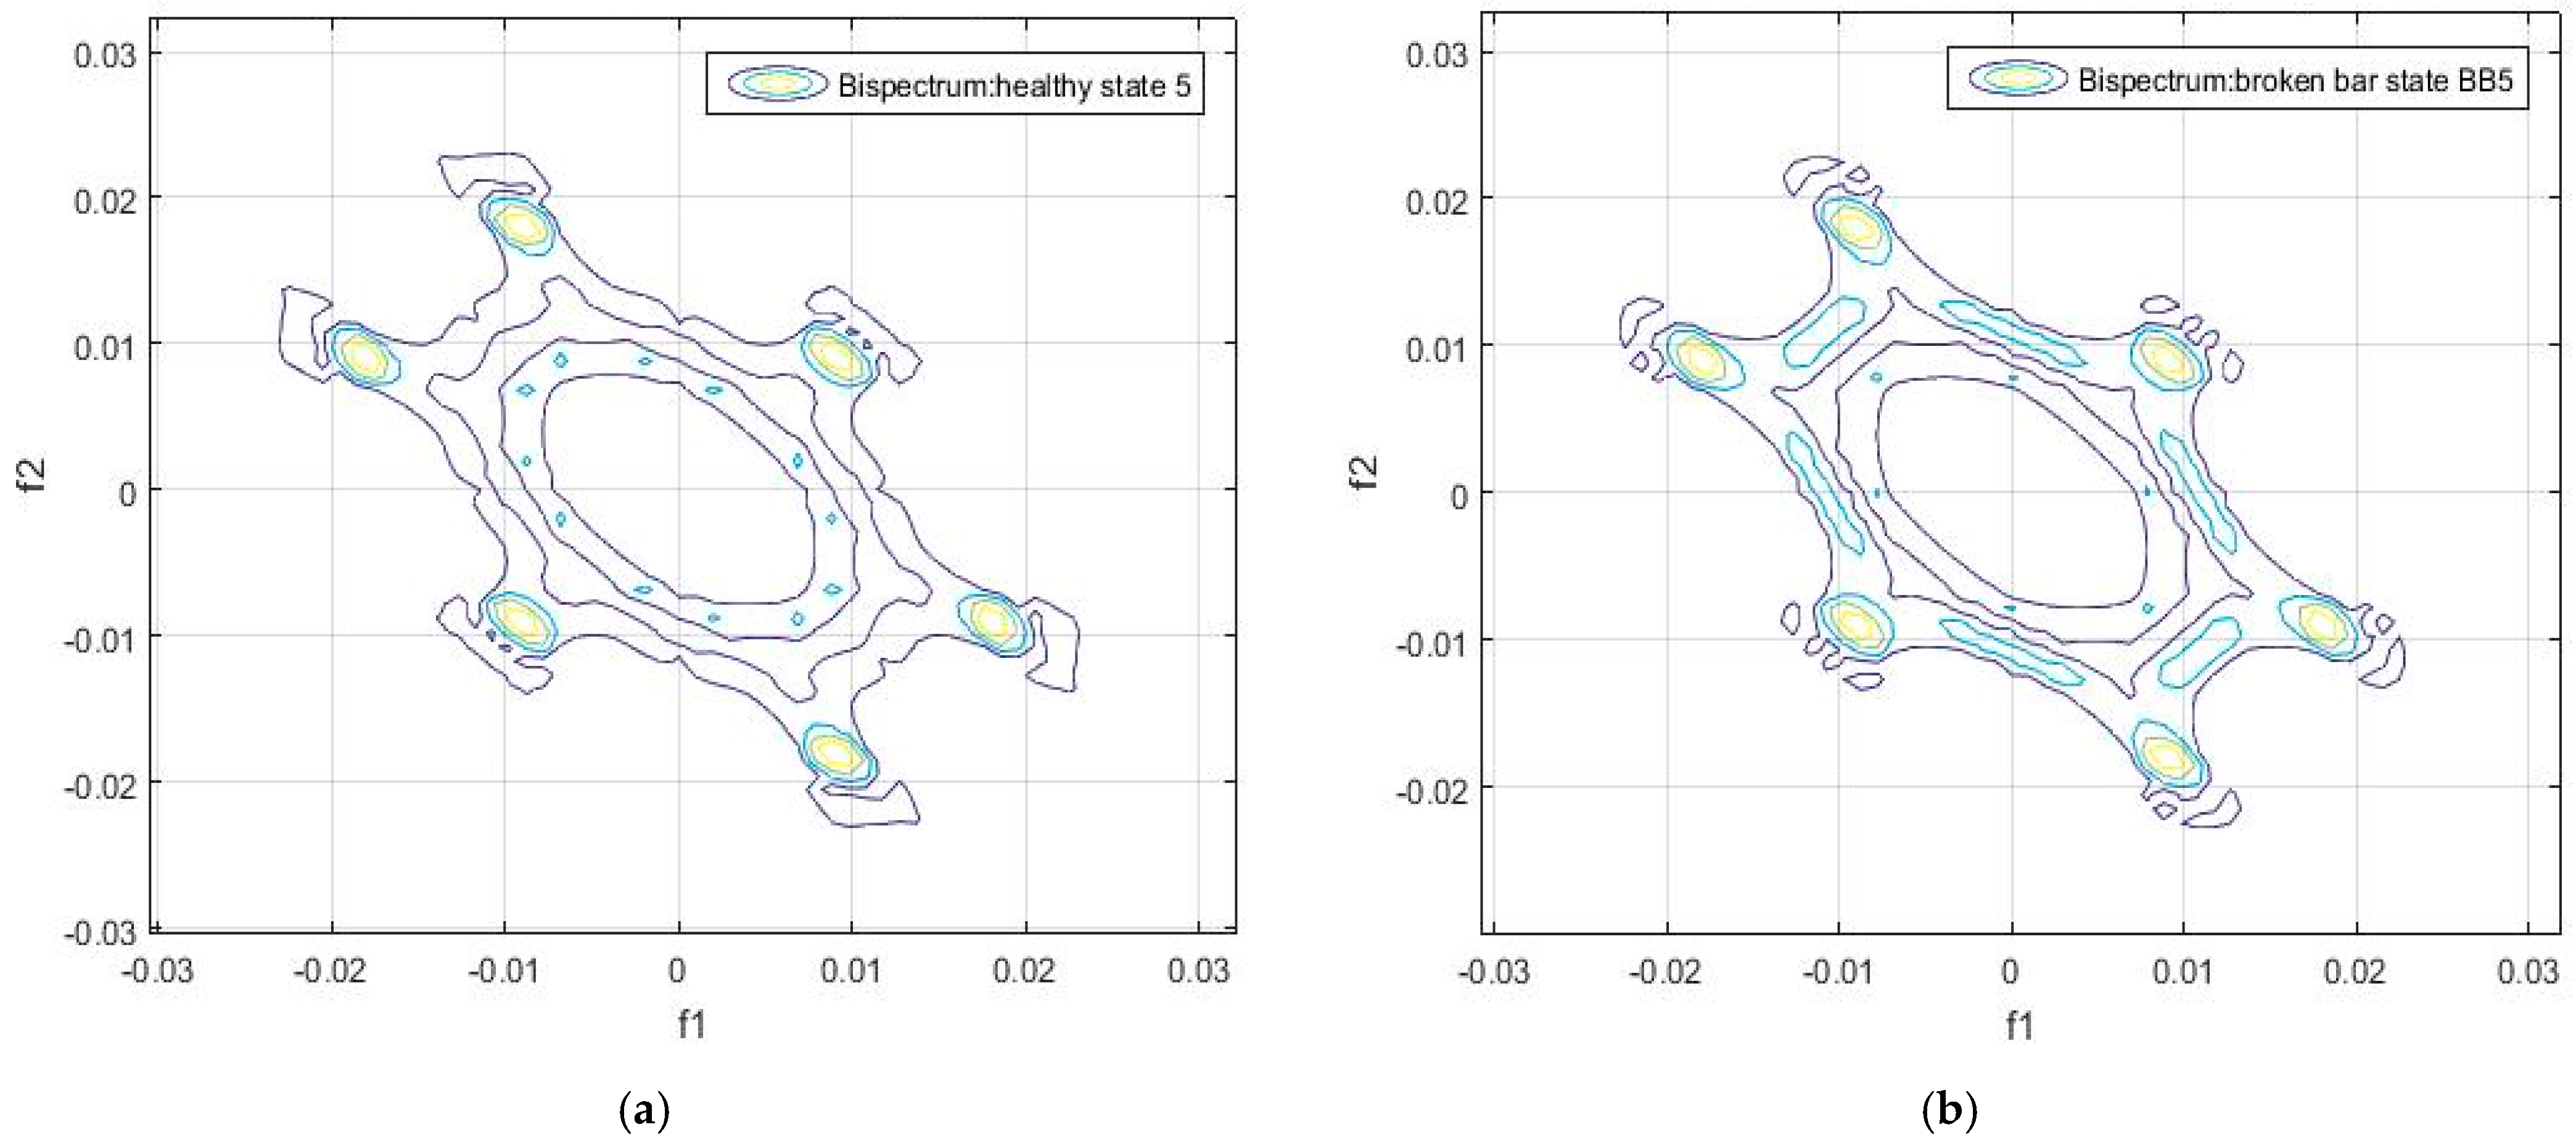
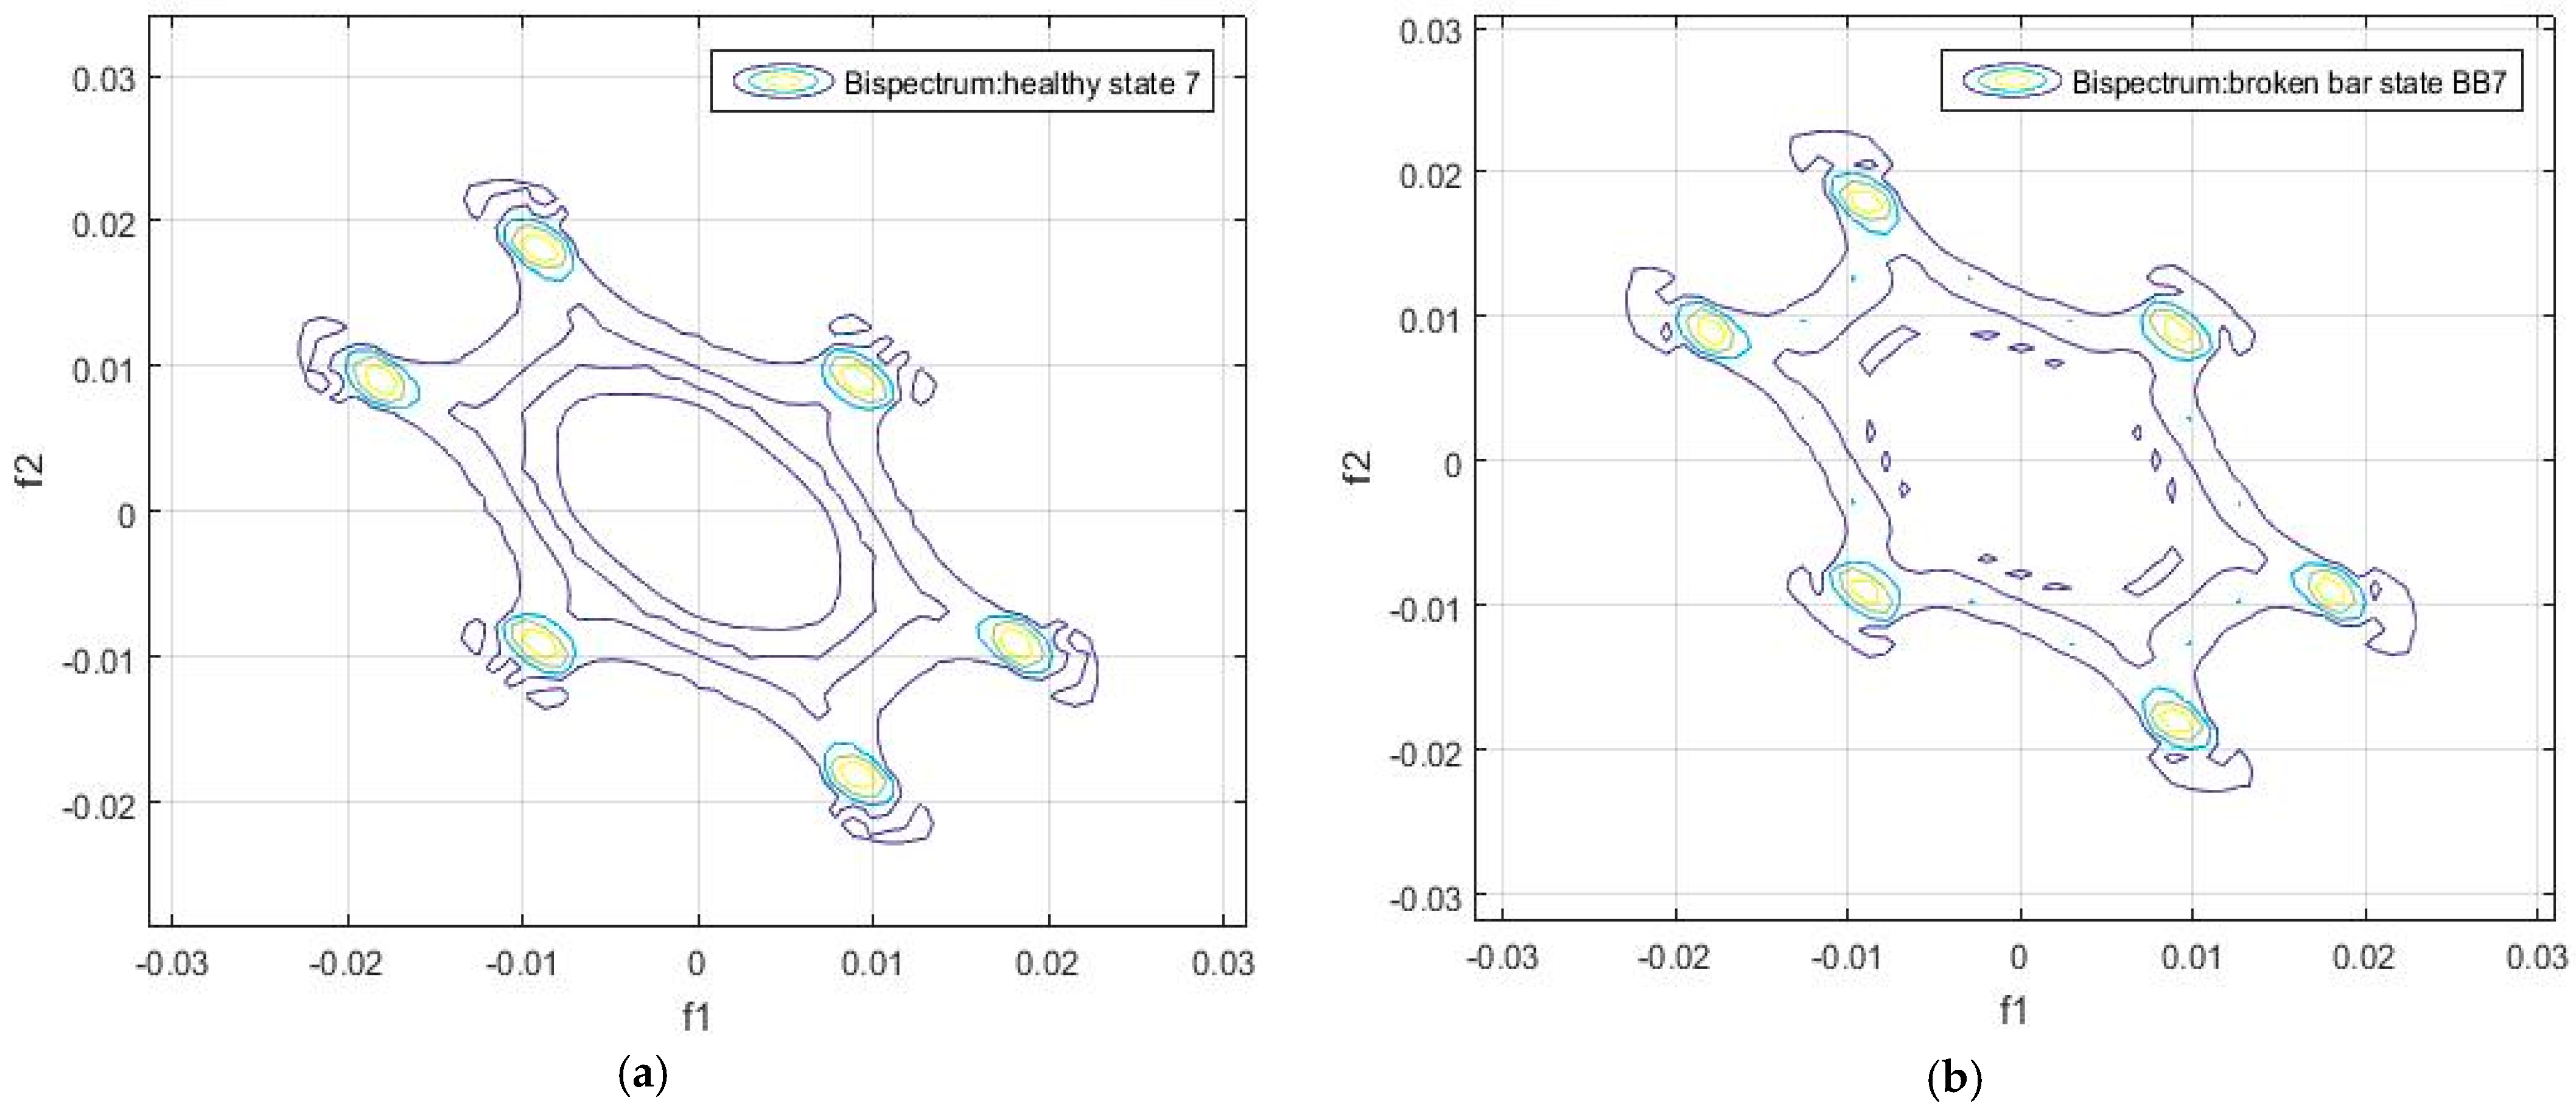
3.1. Results in the Frequency Domain
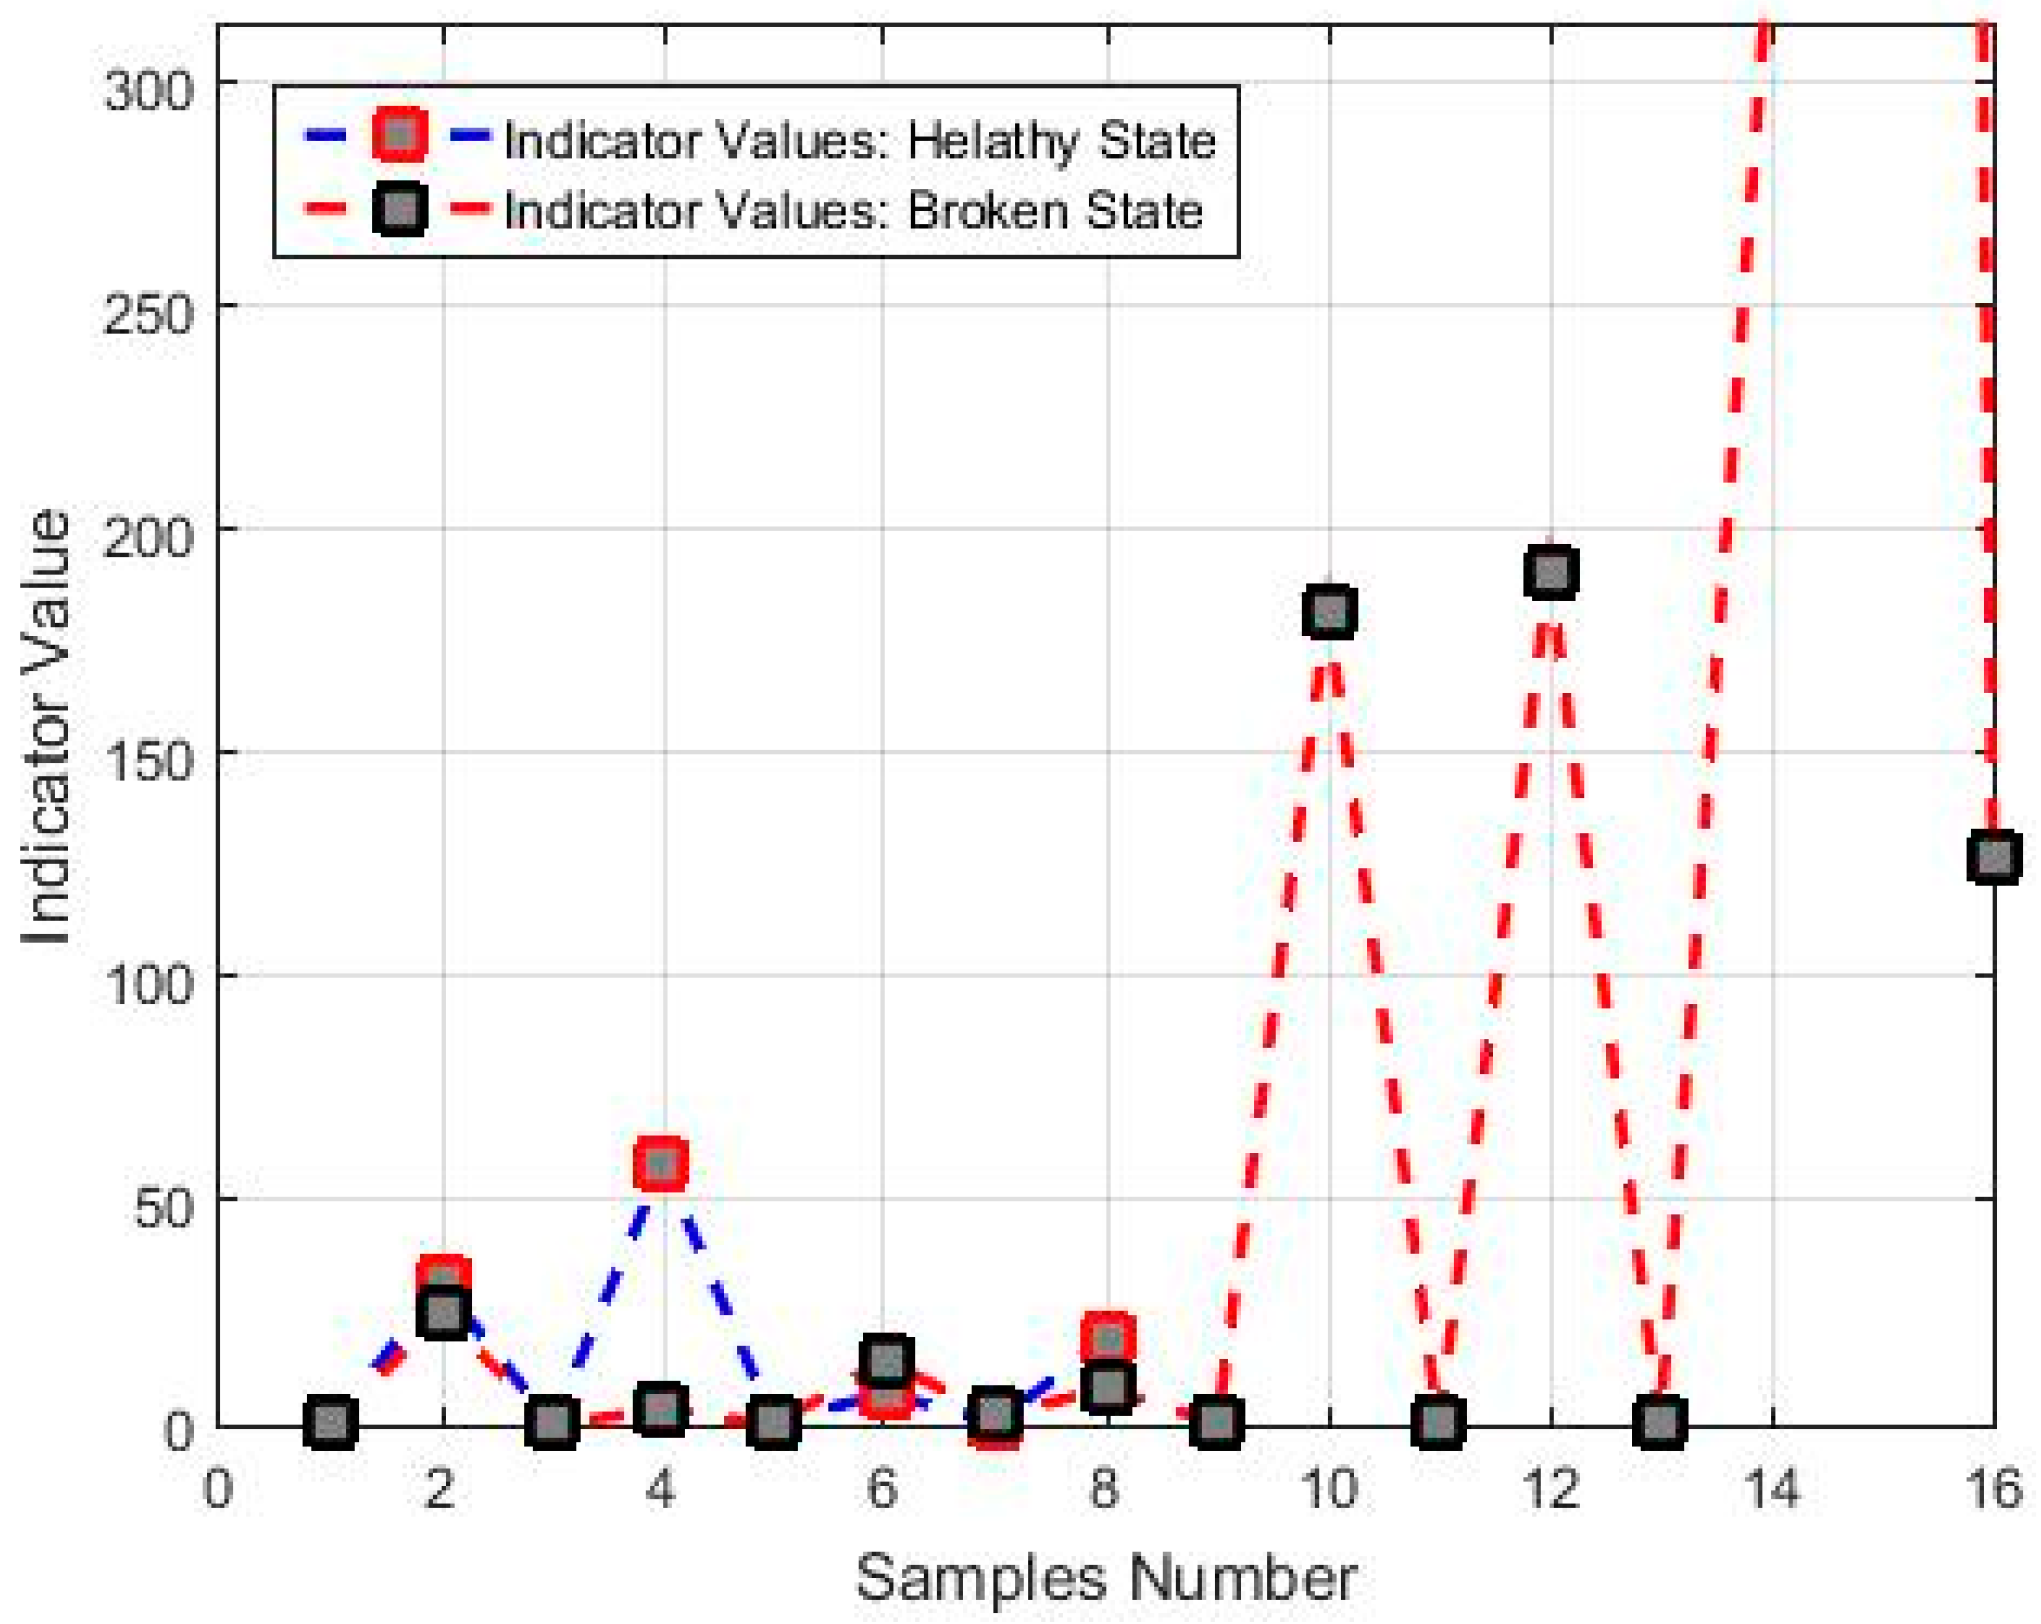
3.2. Results in the Time Domain
4. Discussion
- The indicator in the frequency domain for the healthy condition varies in a range of , and for the faulty condition it varies from during start-up. In this regime, the values of the indicator in the frequency domain for the healthy state are always lower than the corresponding values for the faulty state.
- When the motor operates at steady state, the indicator in the time domain ranges from for the healthy condition, and between for the faulty one.
- The best results are obtained when the measurement is carried out in the DMA position, since the values of both indicators are within the limits of obtained values.
- In order to discern between the healthy and faulty conditions, the signal obtained from the flux sensor must first be evaluated during the start-up, for which the indicator is calculated based on the analysis in the frequency domain. At steady-state, the signal should be better evaluated using the time indicator.
- A diagnostic decision based on the limit values for both indicators should be finally adopted. In order to obtain a more reliable conclusion of the rotor condition, the two indicators must be evaluated.
5. Conclusions
Author Contributions
Funding
Conflicts of Interest
References
- Nandi, S.; Toliyat, H.A.; Li, X. Condition monitoring and fault diagnosis of electrical motors—A review. IEEE Trans. Energy Convers. 2005, 20, 719–729. [Google Scholar] [CrossRef]
- Henao, H.; Capolino, G.-A.; Fernández-Cabanas, M.; Filippetti, F.; Bruzzese, C.; Strangas, E.; Pusca, R.; Estima, J.; Riera-Guasp, M.; Kia, S.H. Trends in fault diagnosis for electrical machines. IEEE Ind. Electron. Mag. 2014, 8, 31–42. [Google Scholar] [CrossRef]
- Riera-Guasp, M.; Antonino-Daviu, J.A.; Capolino, G. Advances in electrical machine, power electronic, and drive condition monitoring and fault detection: State of the art. IEEE Trans. Ind. Electron. 2015, 62, 1746–1759. [Google Scholar] [CrossRef]
- Chen, J.; Sufei, L.; Thomas, G.H. A review of condition monitoring of induction motors based on stray flux. In Proceedings of the IEEE Energy Conversion Congress and Exposition (ECCE), Cincinnati, OH, USA, 1–5 October 2017. [Google Scholar] [CrossRef]
- Romary, R.; Pusca, R.; Lecointe, J.P.; Brudny, J.F. Electrical machines fault diagnosis by stray flux analysis. In Proceedings of the IEEE Workshop Electrical Machines Design, Control and Diagnosis (WEMDCD), Paris, France, 11–12 March 2013; pp. 245–254. [Google Scholar]
- Cabanas, M.F.; Norniella, J.G.; Melero, M.G.; Rojas, C.H.; Cano, J.M.; Pedrayes, F.; Orcajo, G.A. Detection of Stator Winding InsulationFailures: On–line and Off–line Tests. In Proceedings of the IEEE Workshop Electrical Machines Design, Control and Diagnosis (WEMDCD), Paris, France, 11–12 March 2013; pp. 208–217. [Google Scholar]
- Pusca, R.; Demian, C.; Mercier, D.; Lefevre, E.; Romary, R. An improvement of a diagnosis procedure for AC machines using two external flux sensors based on a fusion process with belief functions. In Proceedings of the IECON 2012—38th Annual Conference on IEEE Industrial Electronics Society, Montréal, QC, Canada, 25–28 October 2012; pp. 5096–5101. [Google Scholar]
- Frosini, L.; Borin, A.; Girometta, L.; Venchi, G. A novel approach to detect short circuits in low voltage induction motor by stray flux measurement. In Proceedings of the 2012 XXth International Conference on Electrical Machines, Marseille, France, 2–5 September 2012; pp. 1536–1542. [Google Scholar]
- Ramirez-Nunez, J.A.; Antonino-Daviu, J.A.; Climente-Alarcón, V.; Quijano-López, A.; Razik, H.; Osornio-Rios, R.A.; Romero-Troncoso, R.D. Evaluation of the Detectability of Electromechanical Faults in Induction Motors Via Transient Analysis of the Stray Flux. IEEE Trans. Ind. Appl. 2018, 54, 4324–4332. [Google Scholar] [CrossRef]
- Park, Y.; Yang, C.; Kim, J.; Kim, H.; Lee, S.B.; Gyftakis, K.N.; Panagiotou, P.; Kia, S.H.; Capolino, G.A. Stray Flux Monitoring for Reliable Detection of Rotor Faults under the Influence of Rotor Axial Air Ducts. IEEE Trans. Ind. Electron. 2018. [Google Scholar] [CrossRef]
- Iglesias-Martínez, M.E.; Fernández de Córdoba, P.; Antonino-Daviu, J.A.; Conejero, J.A. Detection of Bar Breakages in Induction Motor via Spectral Subtraction of Stray Flux Signals. In Proceedings of the XIII IEEE International Conference on Electrical Machines (ICEM), Alexandroupoli, Greece, 3–6 September 2018; pp. 1796–1802. [Google Scholar] [CrossRef]
- Panagiotou, P.A.; Arvanitakis, I.; Lophitis, N.; Antonino-Daviu, J.A.; Gyftakis, K.N. Analysis of Stray Flux Spectral Components in Induction Machines under Rotor Bar Breakages at Various Locations. In Proceedings of the XIII IEEE International Conference on Electrical Machines (ICEM), Alexandroupoli, Greece, 3–6 September 2018; pp. 2345–2351. [Google Scholar]
- Mendel, J.M. Tutorial on higher-order statistics (spectra) in signal processing and system theory: Theoretical results and some applications. IEEE Proc. 1991, 79, 278–305. [Google Scholar] [CrossRef]
- Nikia, C.L.; Mendel, J.M. Signal Processing with higher-order spectra. IEEE Signal Process. Mag. 1993, 10, 10–37. [Google Scholar] [CrossRef]
- Swami, A.; Mendel, J.M.; Nikias, C.L. Higher-Order Spectral Analysis Toolbox User’s Guide, Version 2; UnitedSignals & Systems, Inc.: Ranco Palos Verde, CA, USA, 2001. [Google Scholar]
- Vaseghi, S.V. Advanced Digital Signal Processing and Noise Reduction, 4th ed.; John Wiley & Sons: Hoboken, NJ, USA, 2008. [Google Scholar]
- Murua, A.; Sanz-Serna, J.M. Vibrational resonance: A study with high-order word-series averaging. Appl. Math. Nonlinear Sci. 2016, 1, 239–246. [Google Scholar] [CrossRef]


| Sample | Position | Load | Speed (r/min) | Torque (Nm) | Supply Voltage (%) | Time (s) |
|---|---|---|---|---|---|---|
| 0 | DMA | NL | 988 | 0.49 | 60 | 1 |
| 2 | DM | NL | 988 | 0.49 | 60 | 1 |
| 4 | E | NL | 987 | 0.51 | 60 | 1 |
| 6 | L | NL | 986 | 0.54 | 60 | 1 |
| Sample | Position | Load | Speed (r/min) | Torque (Nm) | Supply Voltage (%) | Time (s) |
|---|---|---|---|---|---|---|
| 0 | DMA | NL | 985 | 0.49 | 60 | 1 |
| 2 | DM | NL | 988 | 0.49 | 60 | 1 |
| 4 | E | NL | 987 | 0.49 | 60 | 1 |
| 6 | L | NL | 985 | 0.49 | 60 | 1 |
| 8 | DMA | FL | 755 | 5.1 | 60 | 1 |
| 10 | DM | FL | 750 | 5 | 60 | 1 |
| 12 | E | FL | 760 | 5 | 60 | 1 |
| 14 | L | FL | 765 | 5 | 60 | 1 |
| Sample | Position | Load | Speed (r/min) | Torque (Nm) | Supply Voltage (%) | Time (s) |
|---|---|---|---|---|---|---|
| 1 | DMA | NL | 994 | 0.49 | 100 | 8 |
| 3 | DM | NL | 994 | 0.48 | 100 | 8 |
| 5 | E | NL | 995 | 0.51 | 100 | 8 |
| 7 | L | NL | 995 | 0.5 | 100 | 8 |
| Sample | Position | Load | Speed (r/min) | Torque (Nm) | Supply Voltage (%) | Time (s) |
|---|---|---|---|---|---|---|
| 1 | DMA | NL | 994 | 0.52 | 100 | 8 |
| 3 | DM | NL | 994 | 0.53 | 100 | 8 |
| 5 | E | NL | 994 | 0.55 | 100 | 8 |
| 7 | L | NL | 997 | 0.58 | 100 | 8 |
| 9 | DMA | FL | 940 | 6.2 | 100 | 8 |
| 11 | DM | FL | 940 | 6.13 | 100 | 8 |
| 13 | E | FL | 940 | 6.1 | 100 | 8 |
| 15 | L | FL | 940 | 6.09 | 100 | 8 |
| Sample | Obtained Indicator in Frequency Domain |
|---|---|
| 0, DMA position, healthy state | 9.1160·10−4 |
| 0, DMA position, damage state (one broken bar) | 8.8375·10−4 |
| Sample | Position | Load | Speed (r/min) | Torque (Nm) | Supply Voltage (%) | Time (s) | Indicator |
|---|---|---|---|---|---|---|---|
| 0 | DMA | NL | 988 | 0.49 | 60 | 1 | 30.38804 |
| 2 | DM | NL | 988 | 0.49 | 60 | 1 | 27.28881 |
| 4 | E | NL | 987 | 0.51 | 60 | 1 | 28.56996 |
| 6 | L | NL | 986 | 0.54 | 60 | 1 | 26.75429 |
| Sample | Position | Load | Speed (r/min) | Torque (Nm) | Supply Voltage (%) | Time (s) | Indicator |
|---|---|---|---|---|---|---|---|
| 0 | DMA | NL | 985 | 0.49 | 60 | 1 | 38.15795 |
| 2 | DM | NL | 988 | 0.49 | 60 | 1 | 28.76003 |
| 4 | E | NL | 987 | 0.49 | 60 | 1 | 38.77947 |
| 6 | L | NL | 985 | 0.49 | 60 | 1 | 28.88013 |
| 8 | DMA | FL | 755 | 5.1 | 60 | 1 | 32.06025 |
| 10 | DM | FL | 750 | 5 | 60 | 1 | 25.04451 |
| 12 | E | FL | 760 | 5 | 60 | 1 | 23.42840 |
| 14 | L | FL | 765 | 5 | 60 | 1 | 41.01978 |
| Sample | Position | Load | Speed (r/min) | Torque (Nm) | Supply Voltage (%) | Time (s) | Indicator |
|---|---|---|---|---|---|---|---|
| 1 | DMA | NL | 994 | 0.49 | 100 | 8 | 1.152108 |
| 3 | DM | NL | 994 | 0.48 | 100 | 8 | 1.192266 |
| 5 | E | NL | 995 | 0.51 | 100 | 8 | 0.597756 |
| 7 | L | NL | 995 | 0.5 | 100 | 8 | 0.726403 |
| Sample | Position | Load | Speed (r/min) | Torque (Nm) | Supply Voltage (%) | Time (s) | Indicator |
|---|---|---|---|---|---|---|---|
| 1 | DMA | NL | 994 | 0.52 | 100 | 8 | 0.842987 |
| 3 | DM | NL | 994 | 0.53 | 100 | 8 | 0.854711 |
| 5 | E | NL | 994 | 0.55 | 100 | 8 | 0.975386 |
| 7 | L | NL | 997 | 0.58 | 100 | 8 | 0.709328 |
| 9 | DMA | FL | 940 | 6.2 | 100 | 8 | 3.707399 |
| 11 | DM | FL | 940 | 6.13 | 100 | 8 | 3.254082 |
| 13 | E | FL | 940 | 6.1 | 100 | 8 | 3.979508 |
| 15 | L | FL | 940 | 6.09 | 100 | 8 | 2.998851 |
| Sample | Position | Load | Speed (r/min) | Torque (Nm) | Supply Voltage (%) | Time (s) | Indicator |
|---|---|---|---|---|---|---|---|
| 0 | DMA | NL | 988 | 0.49 | 60 | 1 | 0.071959 |
| 2 | DM | NL | 988 | 0.49 | 60 | 1 | 0.027691 |
| 4 | E | NL | 987 | 0.51 | 60 | 1 | 0.435514 |
| 6 | L | NL | 986 | 0.54 | 60 | 1 | 0.537173 |
| Sample | Position | Load | Speed (r/min) | Torque (Nm) | Supply Voltage (%) | Time (s) | Indicator |
|---|---|---|---|---|---|---|---|
| 0 | DMA | NL | 985 | 0.49 | 60 | 1 | 0.003537 |
| 2 | DM | NL | 988 | 0.49 | 60 | 1 | 0.009451 |
| 4 | E | NL | 987 | 0.49 | 60 | 1 | 0.009606 |
| 6 | L | NL | 985 | 0.49 | 60 | 1 | 2.046191 |
| 8 | DMA | FL | 755 | 5.1 | 60 | 1 | 0.370122 |
| 10 | DM | FL | 750 | 5 | 60 | 1 | 0.033363 |
| 12 | E | FL | 760 | 5 | 60 | 1 | 0.005345 |
| 14 | L | FL | 765 | 5 | 60 | 1 | 2227.965 |
| Sample | Position | Load | Speed (r/min) | Torque (Nm) | Supply Voltage (%) | Time (s) | Indicator |
|---|---|---|---|---|---|---|---|
| 1 | DMA | NL | 994 | 0.49 | 100 | 8 | 31.38462 |
| 3 | DM | NL | 994 | 0.48 | 100 | 8 | 58.30218 |
| 5 | E | NL | 995 | 0.51 | 100 | 8 | 6.948441 |
| 7 | L | NL | 995 | 0.5 | 100 | 8 | 19.03505 |
| Sample | Position | Load | Speed (r/min) | Torque (Nm) | Supply Voltage (%) | Time (s) | Indicator |
|---|---|---|---|---|---|---|---|
| 1 | DMA | NL | 994 | 0.52 | 100 | 8 | 24.67371 |
| 3 | DM | NL | 994 | 0.53 | 100 | 8 | 3.342042 |
| 5 | E | NL | 994 | 0.55 | 100 | 8 | 14.26557 |
| 7 | L | NL | 997 | 0.58 | 100 | 8 | 7.897072 |
| 9 | DMA | FL | 940 | 6.2 | 100 | 8 | 181.7043 |
| 11 | DM | FL | 940 | 6.13 | 100 | 8 | 190.5501 |
| 13 | E | FL | 940 | 6.1 | 100 | 8 | 334.8858 |
| 15 | L | FL | 940 | 6.09 | 100 | 8 | 126.3791 |
| Sample | Position | Load | Speed (r/min) | Torque (Nm) | Supply Voltage (%) | Time (s) | Frequency Indicator | Time Indicator | State |
|---|---|---|---|---|---|---|---|---|---|
| 0 | DMA | NL | 988 | 0.49 | 60 | 1 | 30.38804 | 0.071959 | Healthy |
| DMA | NL | 994 | 0.49 | 38.15795 | 0.003537 | Faulty | |||
| 1 | DMA | NL | 994 | 0.49 | 100 | 8 | 1.152108 | 31.38462 | Healthy |
| DMA | NL | 994 | 0.52 | 0.842987 | 24.67371 | Faulty |
| Sample | Position | Load | Speed (r/min) | Torque (Nm) | Supply Voltage (%) | Time (s) | Frequency Indicator | Time Indicator | State |
|---|---|---|---|---|---|---|---|---|---|
| 2 | DM | NL | 988 | 0.49 | 60 | 1 | 27.28881 | 0.027691 | Healthy |
| DM | NL | 988 | 0.49 | 28.76003 | 0.009451 | Faulty | |||
| 3 | DM | NL | 994 | 0.48 | 100 | 8 | 1.192266 | 58.30218 | Healthy |
| DM | NL | 994 | 0.53 | 0.854711 | 3.342042 | Faulty |
| Sample | Position | Load | Speed (r/min) | Torque (Nm) | Supply Voltage (%) | Time (s) | Frequency Indicator | Time Indicator | State |
|---|---|---|---|---|---|---|---|---|---|
| 4 | E | NL | 987 | 0.51 | 60 | 1 | 28.56996 | 0.435514 | Healthy |
| E | NL | 987 | 0.49 | 38.77947 | 0.009606 | Faulty | |||
| 5 | E | NL | 995 | 0.51 | 100 | 8 | 0.597756 | 6.948441 | Healthy |
| E | NL | 994 | 0.55 | 0.975386 | 14.26557 | Faulty |
| Sample | Position | Load | Speed (r/min) | Torque (Nm) | Supply Voltage (%) | Time (s) | Frequency Indicator | Time Indicator | State |
|---|---|---|---|---|---|---|---|---|---|
| 6 | L | NL | 986 | 0.54 | 60 | 1 | 26.75429 | 0.537173 | Healthy |
| L | NL | 985 | 0.49 | 28.88013 | 2.046191 | Faulty | |||
| 7 | L | NL | 995 | 0.5 | 100 | 8 | 0.726403 | 19.03505 | Healthy |
| L | NL | 997 | 0.58 | 0.709328 | 7.897072 | Faulty |
© 2019 by the authors. Licensee MDPI, Basel, Switzerland. This article is an open access article distributed under the terms and conditions of the Creative Commons Attribution (CC BY) license (http://creativecommons.org/licenses/by/4.0/).
Share and Cite
Iglesias-Martínez, M.E.; Antonino-Daviu, J.A.; Fernández de Córdoba, P.; Conejero, J.A. Rotor Fault Detection in Induction Motors Based on Time-Frequency Analysis Using the Bispectrum and the Autocovariance of Stray Flux Signals. Energies 2019, 12, 597. https://doi.org/10.3390/en12040597
Iglesias-Martínez ME, Antonino-Daviu JA, Fernández de Córdoba P, Conejero JA. Rotor Fault Detection in Induction Motors Based on Time-Frequency Analysis Using the Bispectrum and the Autocovariance of Stray Flux Signals. Energies. 2019; 12(4):597. https://doi.org/10.3390/en12040597
Chicago/Turabian StyleIglesias-Martínez, Miguel E., Jose Alfonso Antonino-Daviu, Pedro Fernández de Córdoba, and J. Alberto Conejero. 2019. "Rotor Fault Detection in Induction Motors Based on Time-Frequency Analysis Using the Bispectrum and the Autocovariance of Stray Flux Signals" Energies 12, no. 4: 597. https://doi.org/10.3390/en12040597
APA StyleIglesias-Martínez, M. E., Antonino-Daviu, J. A., Fernández de Córdoba, P., & Conejero, J. A. (2019). Rotor Fault Detection in Induction Motors Based on Time-Frequency Analysis Using the Bispectrum and the Autocovariance of Stray Flux Signals. Energies, 12(4), 597. https://doi.org/10.3390/en12040597