Exploring the Causes of Power-Converter Failure in Wind Turbines based on Comprehensive Field-Data and Damage Analysis

 , ,
, , 
Abstract
1. Introduction
1.1. State of Research on Power-Converter Reliability in Wind Turbines
1.2. Previous Work of the Authors
1.3. Contribution and Outline of the Present Paper
2. Investigated Systems and Analysis Methods
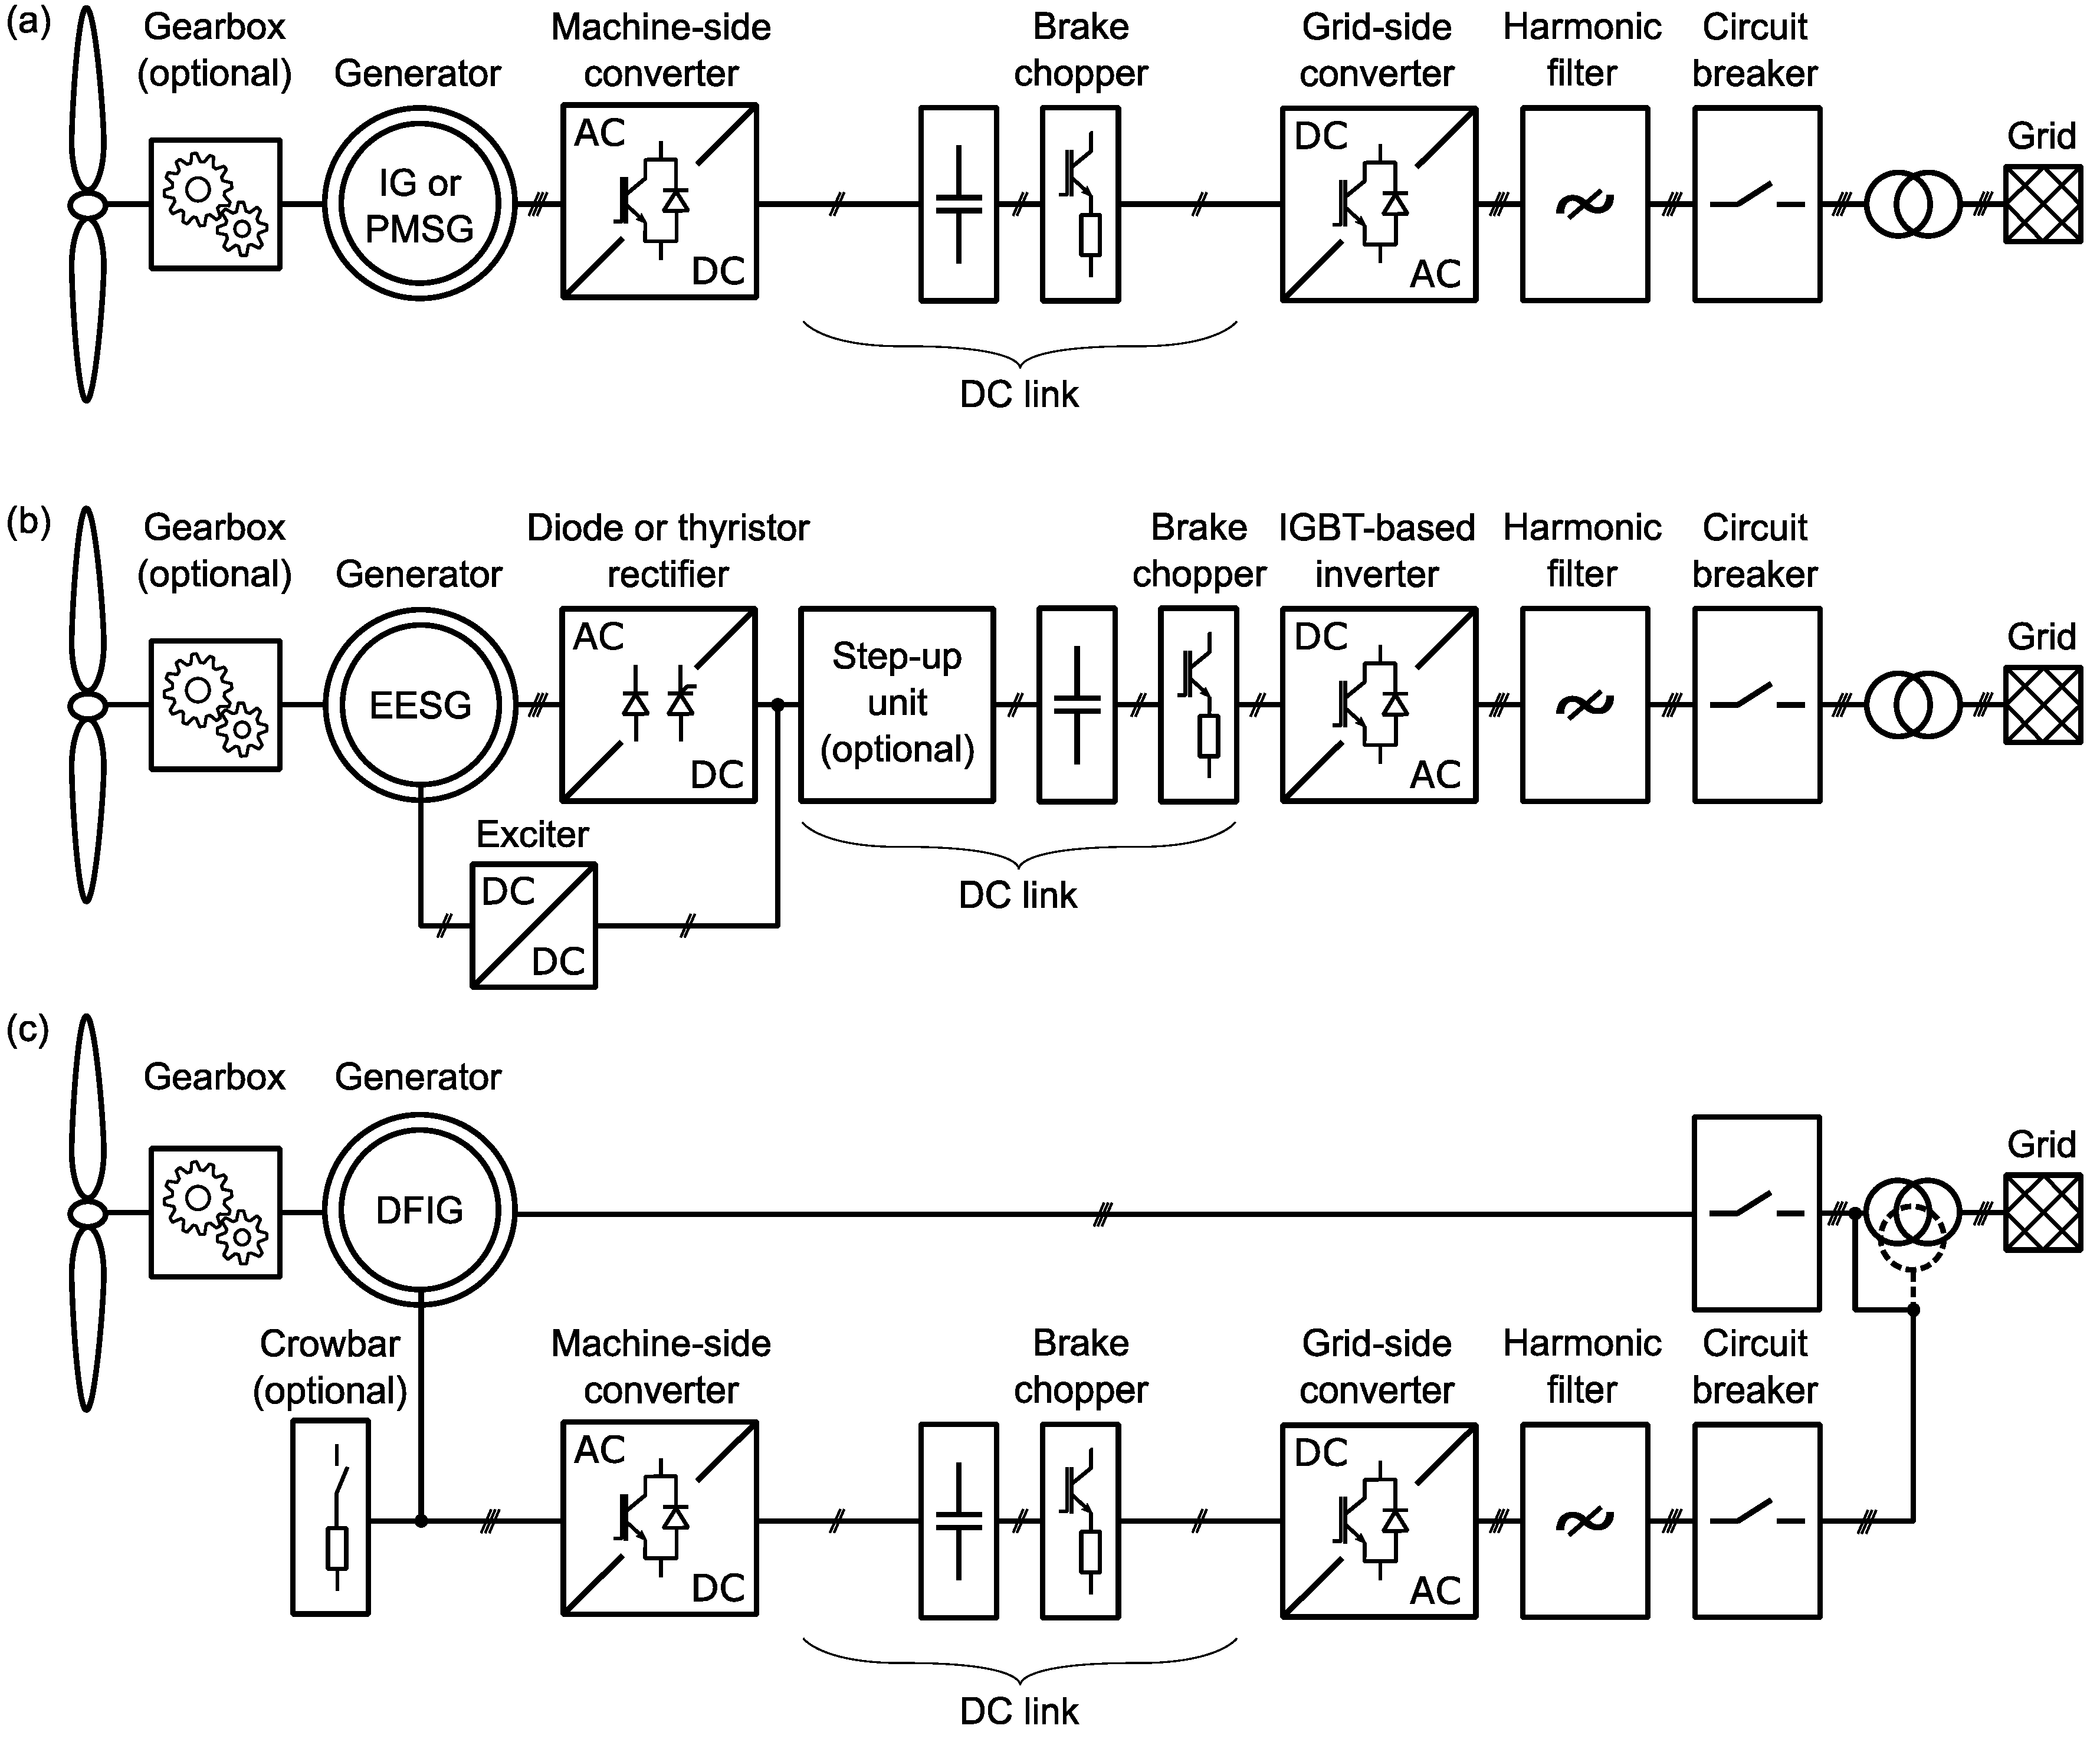
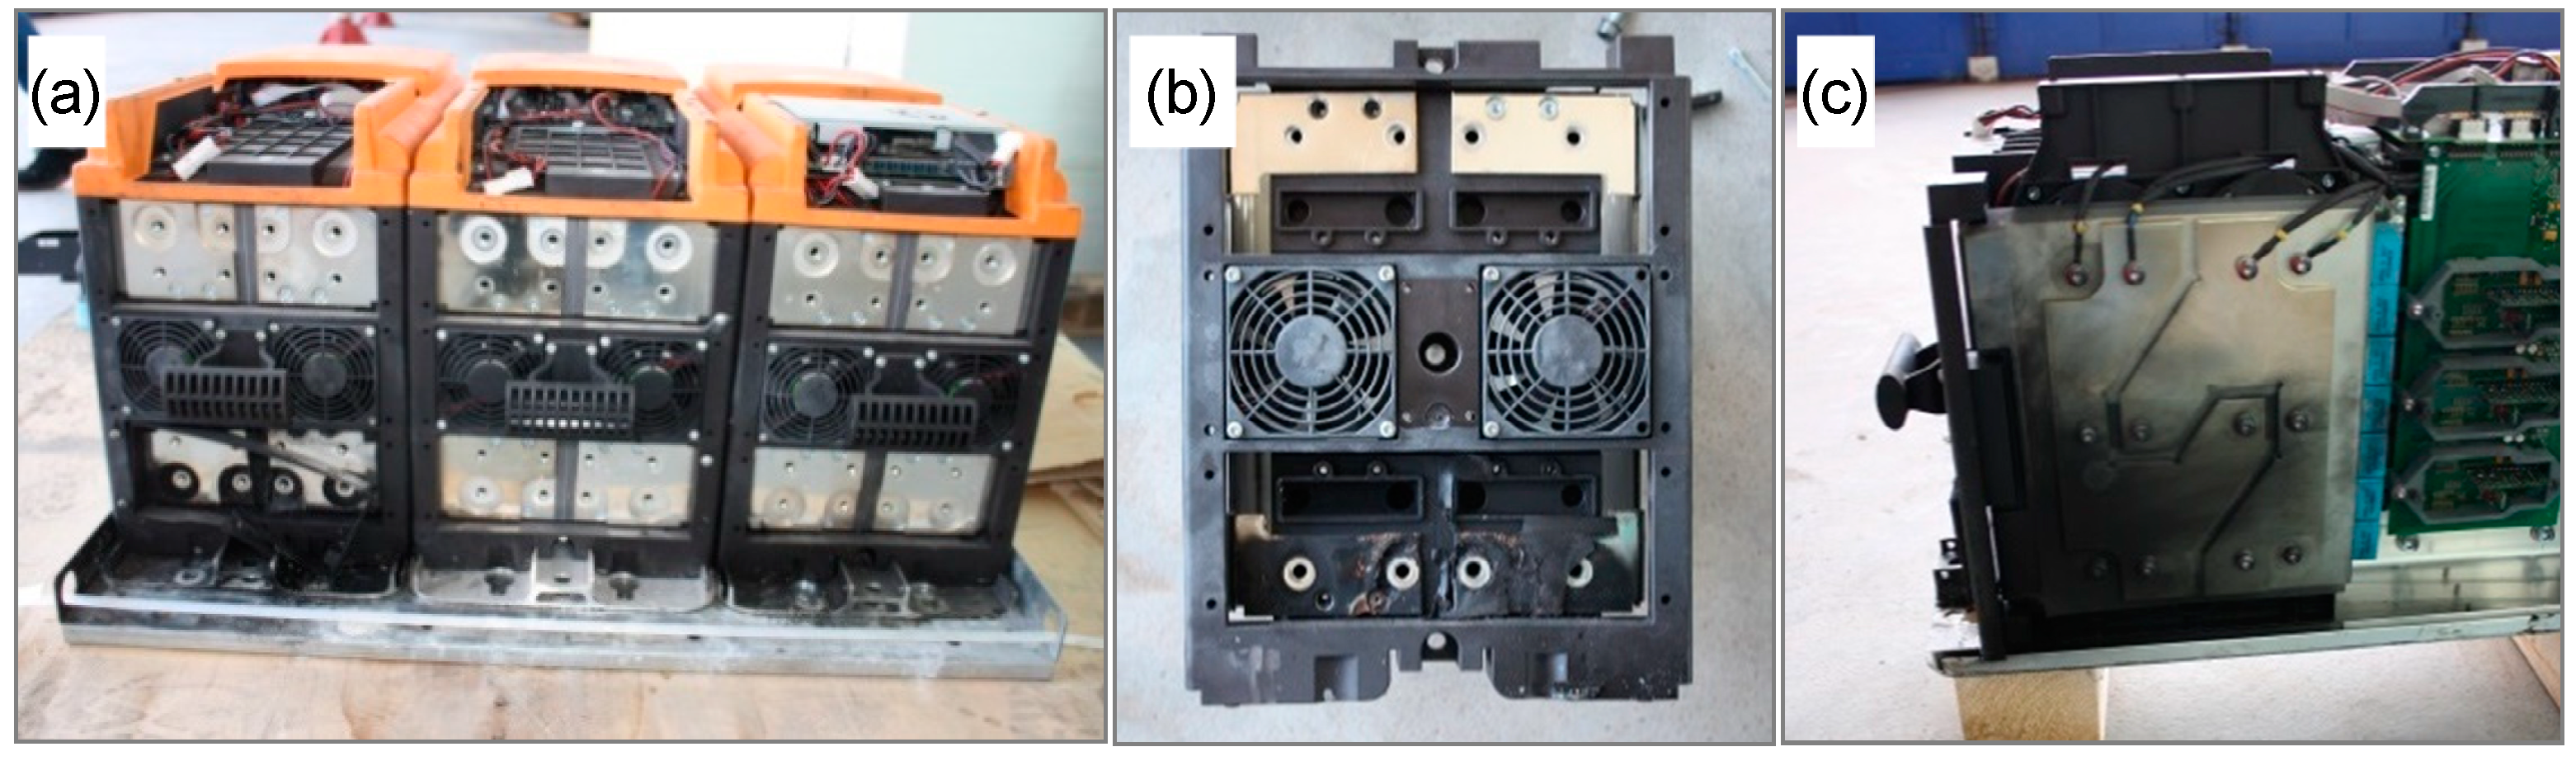
2.1. Studied Wind-Turbine Systems
2.2. Field-Data Analysis
- phase module (including IGBT modules and corresponding driver boards, DC-link capacitors and busbars)
- power-converter control board
- cooling system
- main circuit breaker
- grid-coupling contactor
- other power-converter components (e.g., electrical filter components, fuses, relays, …)
2.3. Post-Mortem Analysis of Returned Power-Converter Components
- visual inspection
- optical microscopy
- X-ray transmission
- scanning acoustic microscopy (SAM)
- scanning electron microscopy (SEM)
- diagnostic measurements for defect localization
- manual pull-testing of bond contacts
3. Results
3.1. Results of the Field-Data Analysis
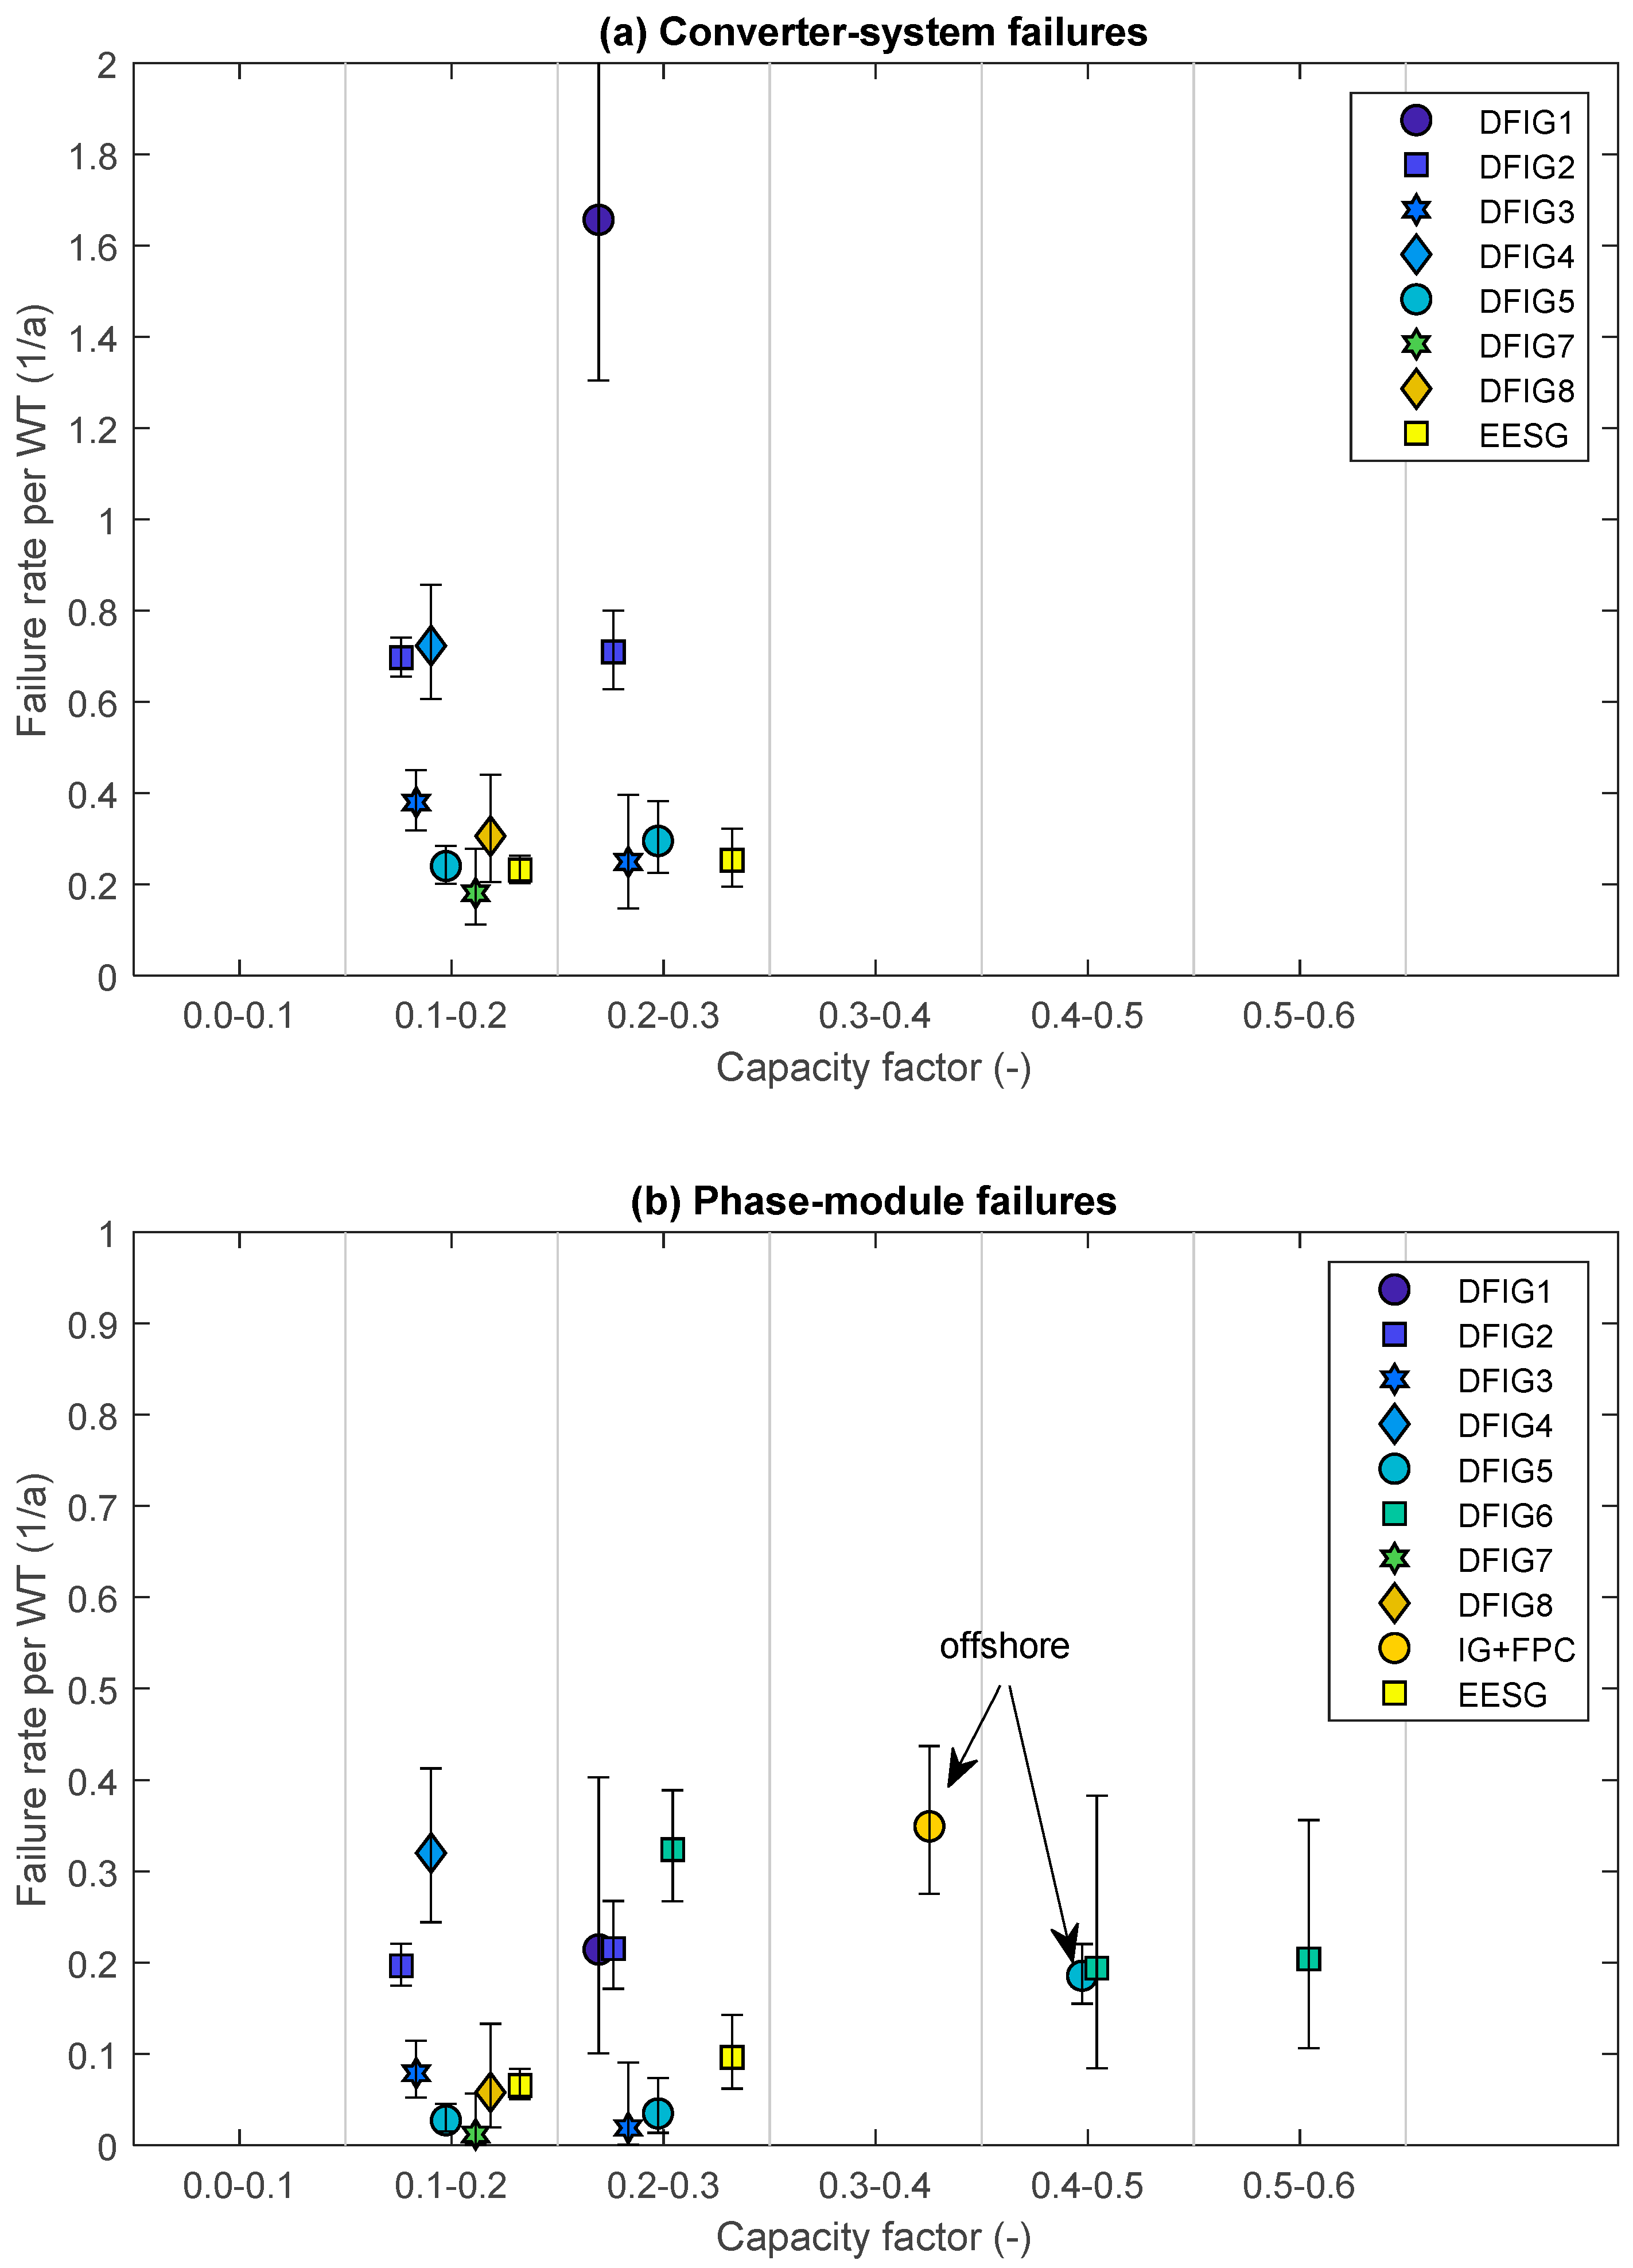
3.1.1. Converter Failure Rates vs. Wind-Turbine Capacity Factors
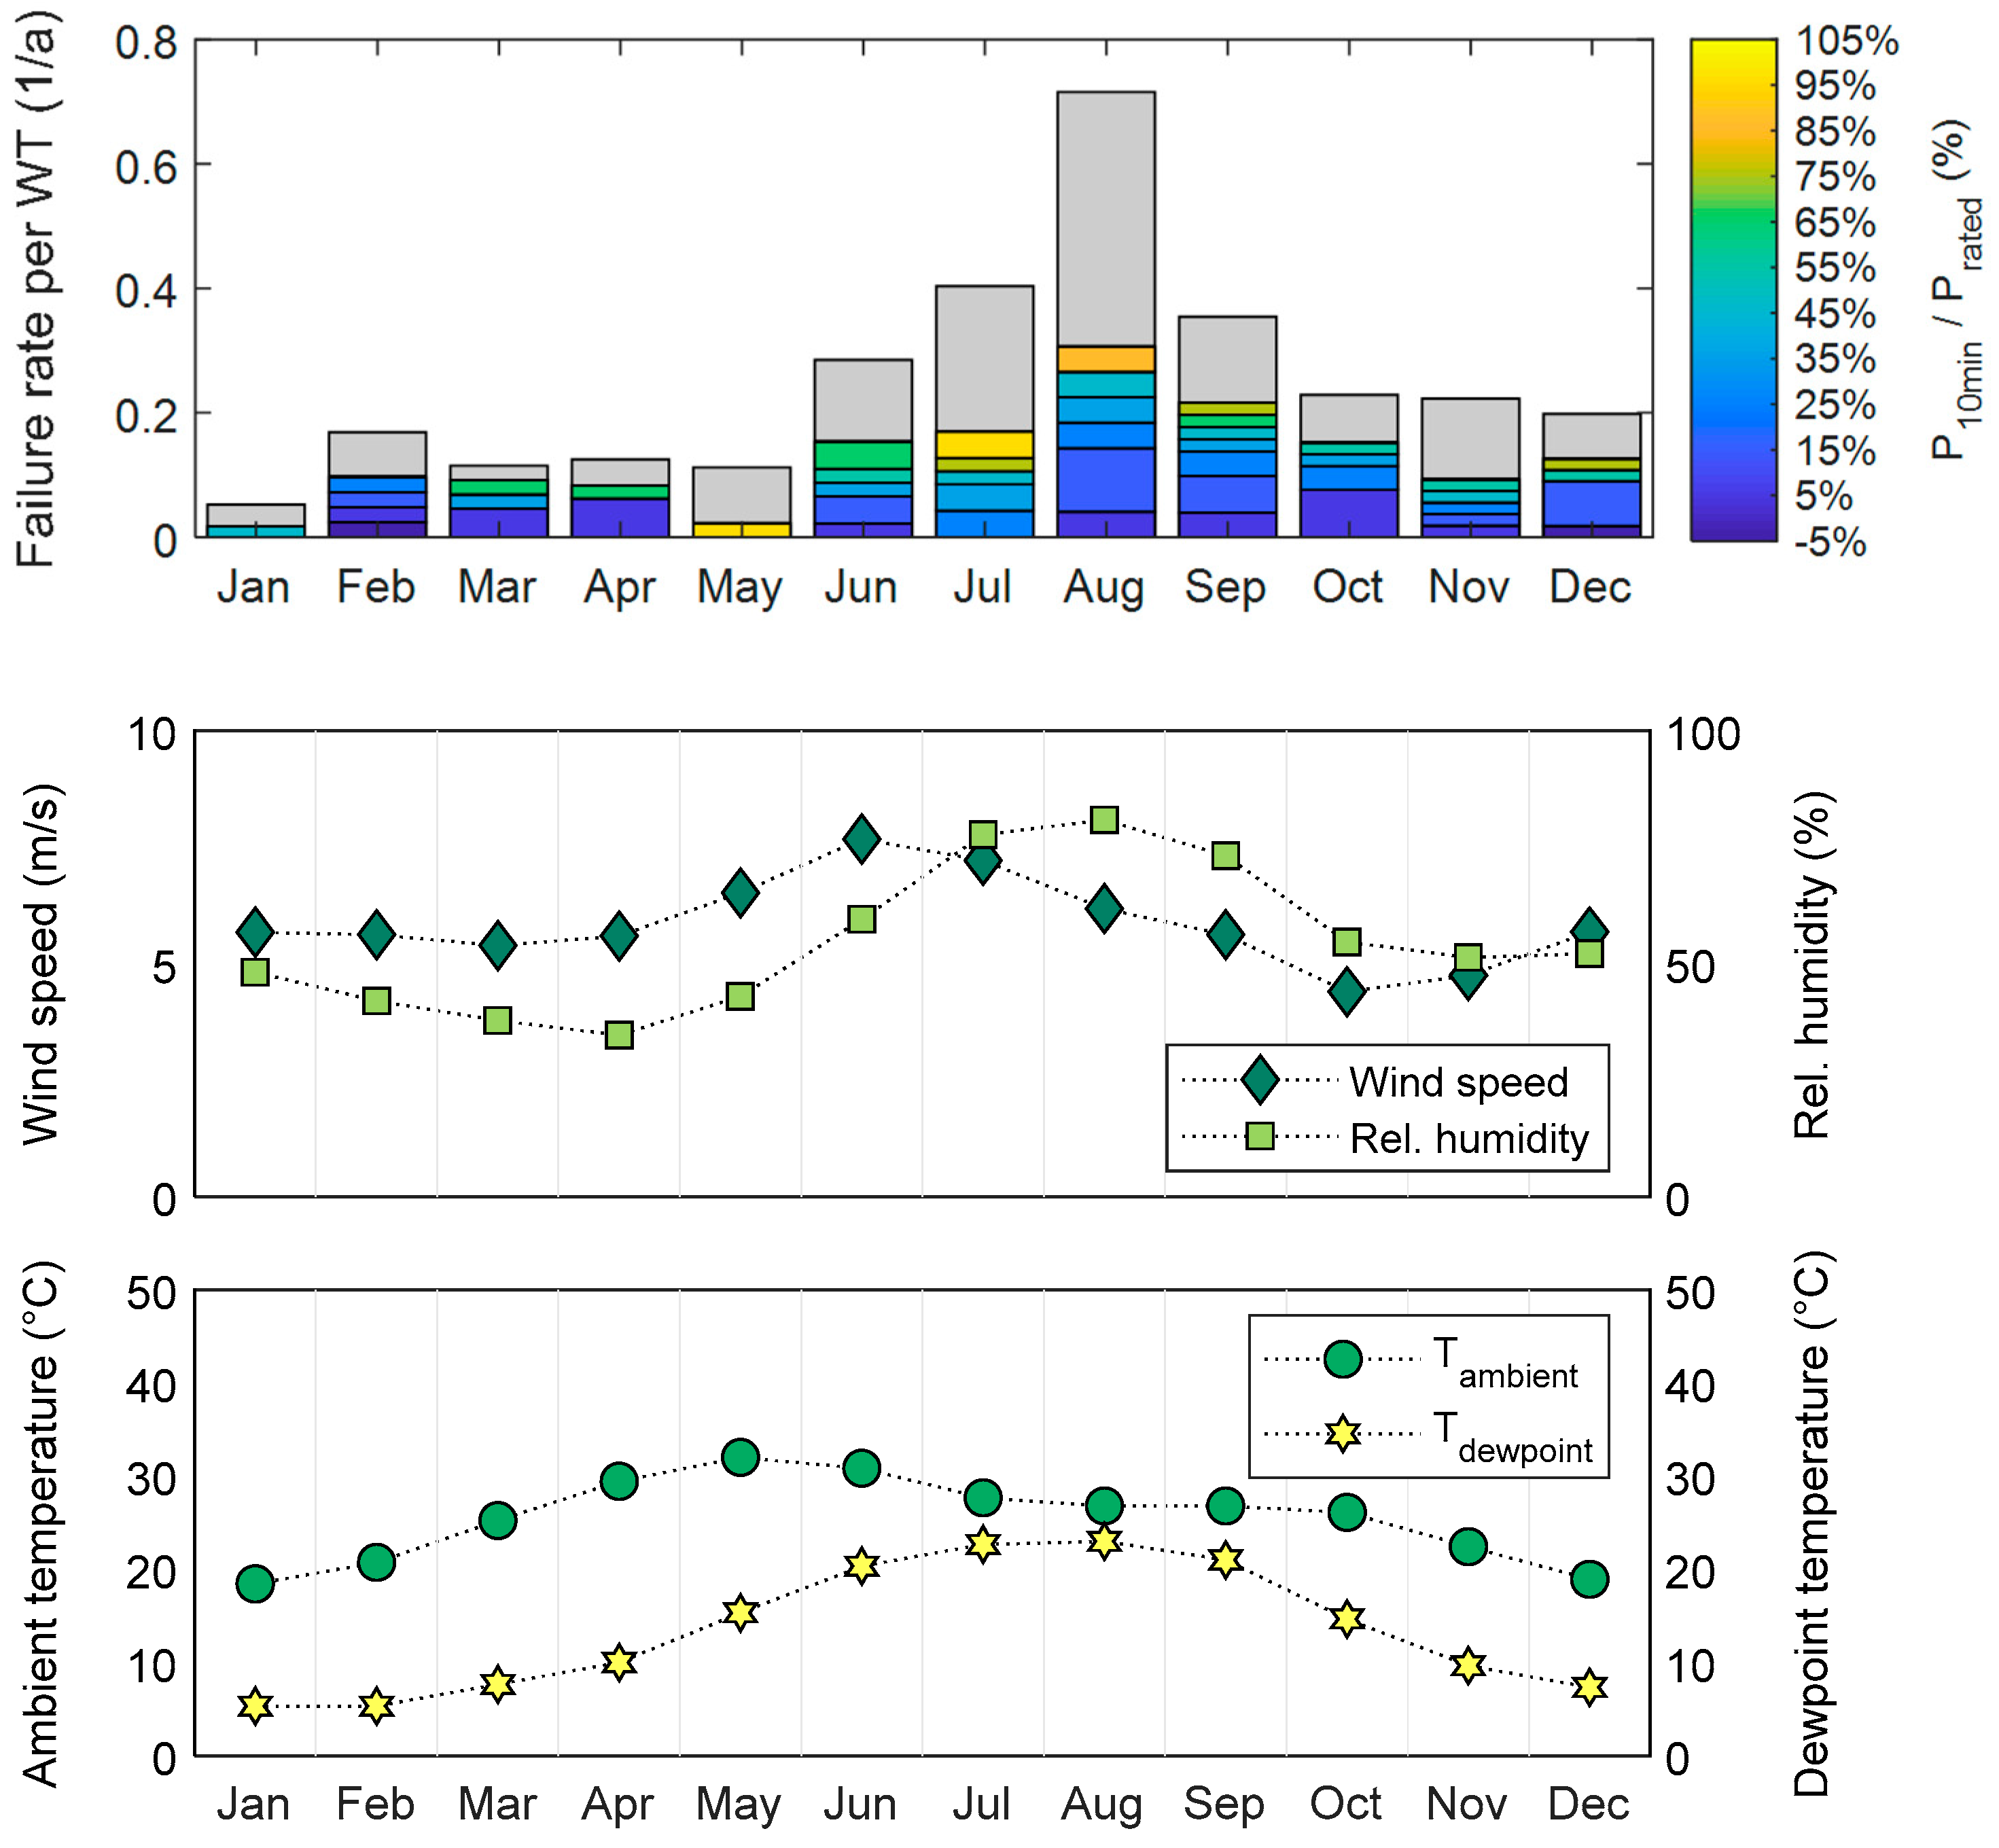
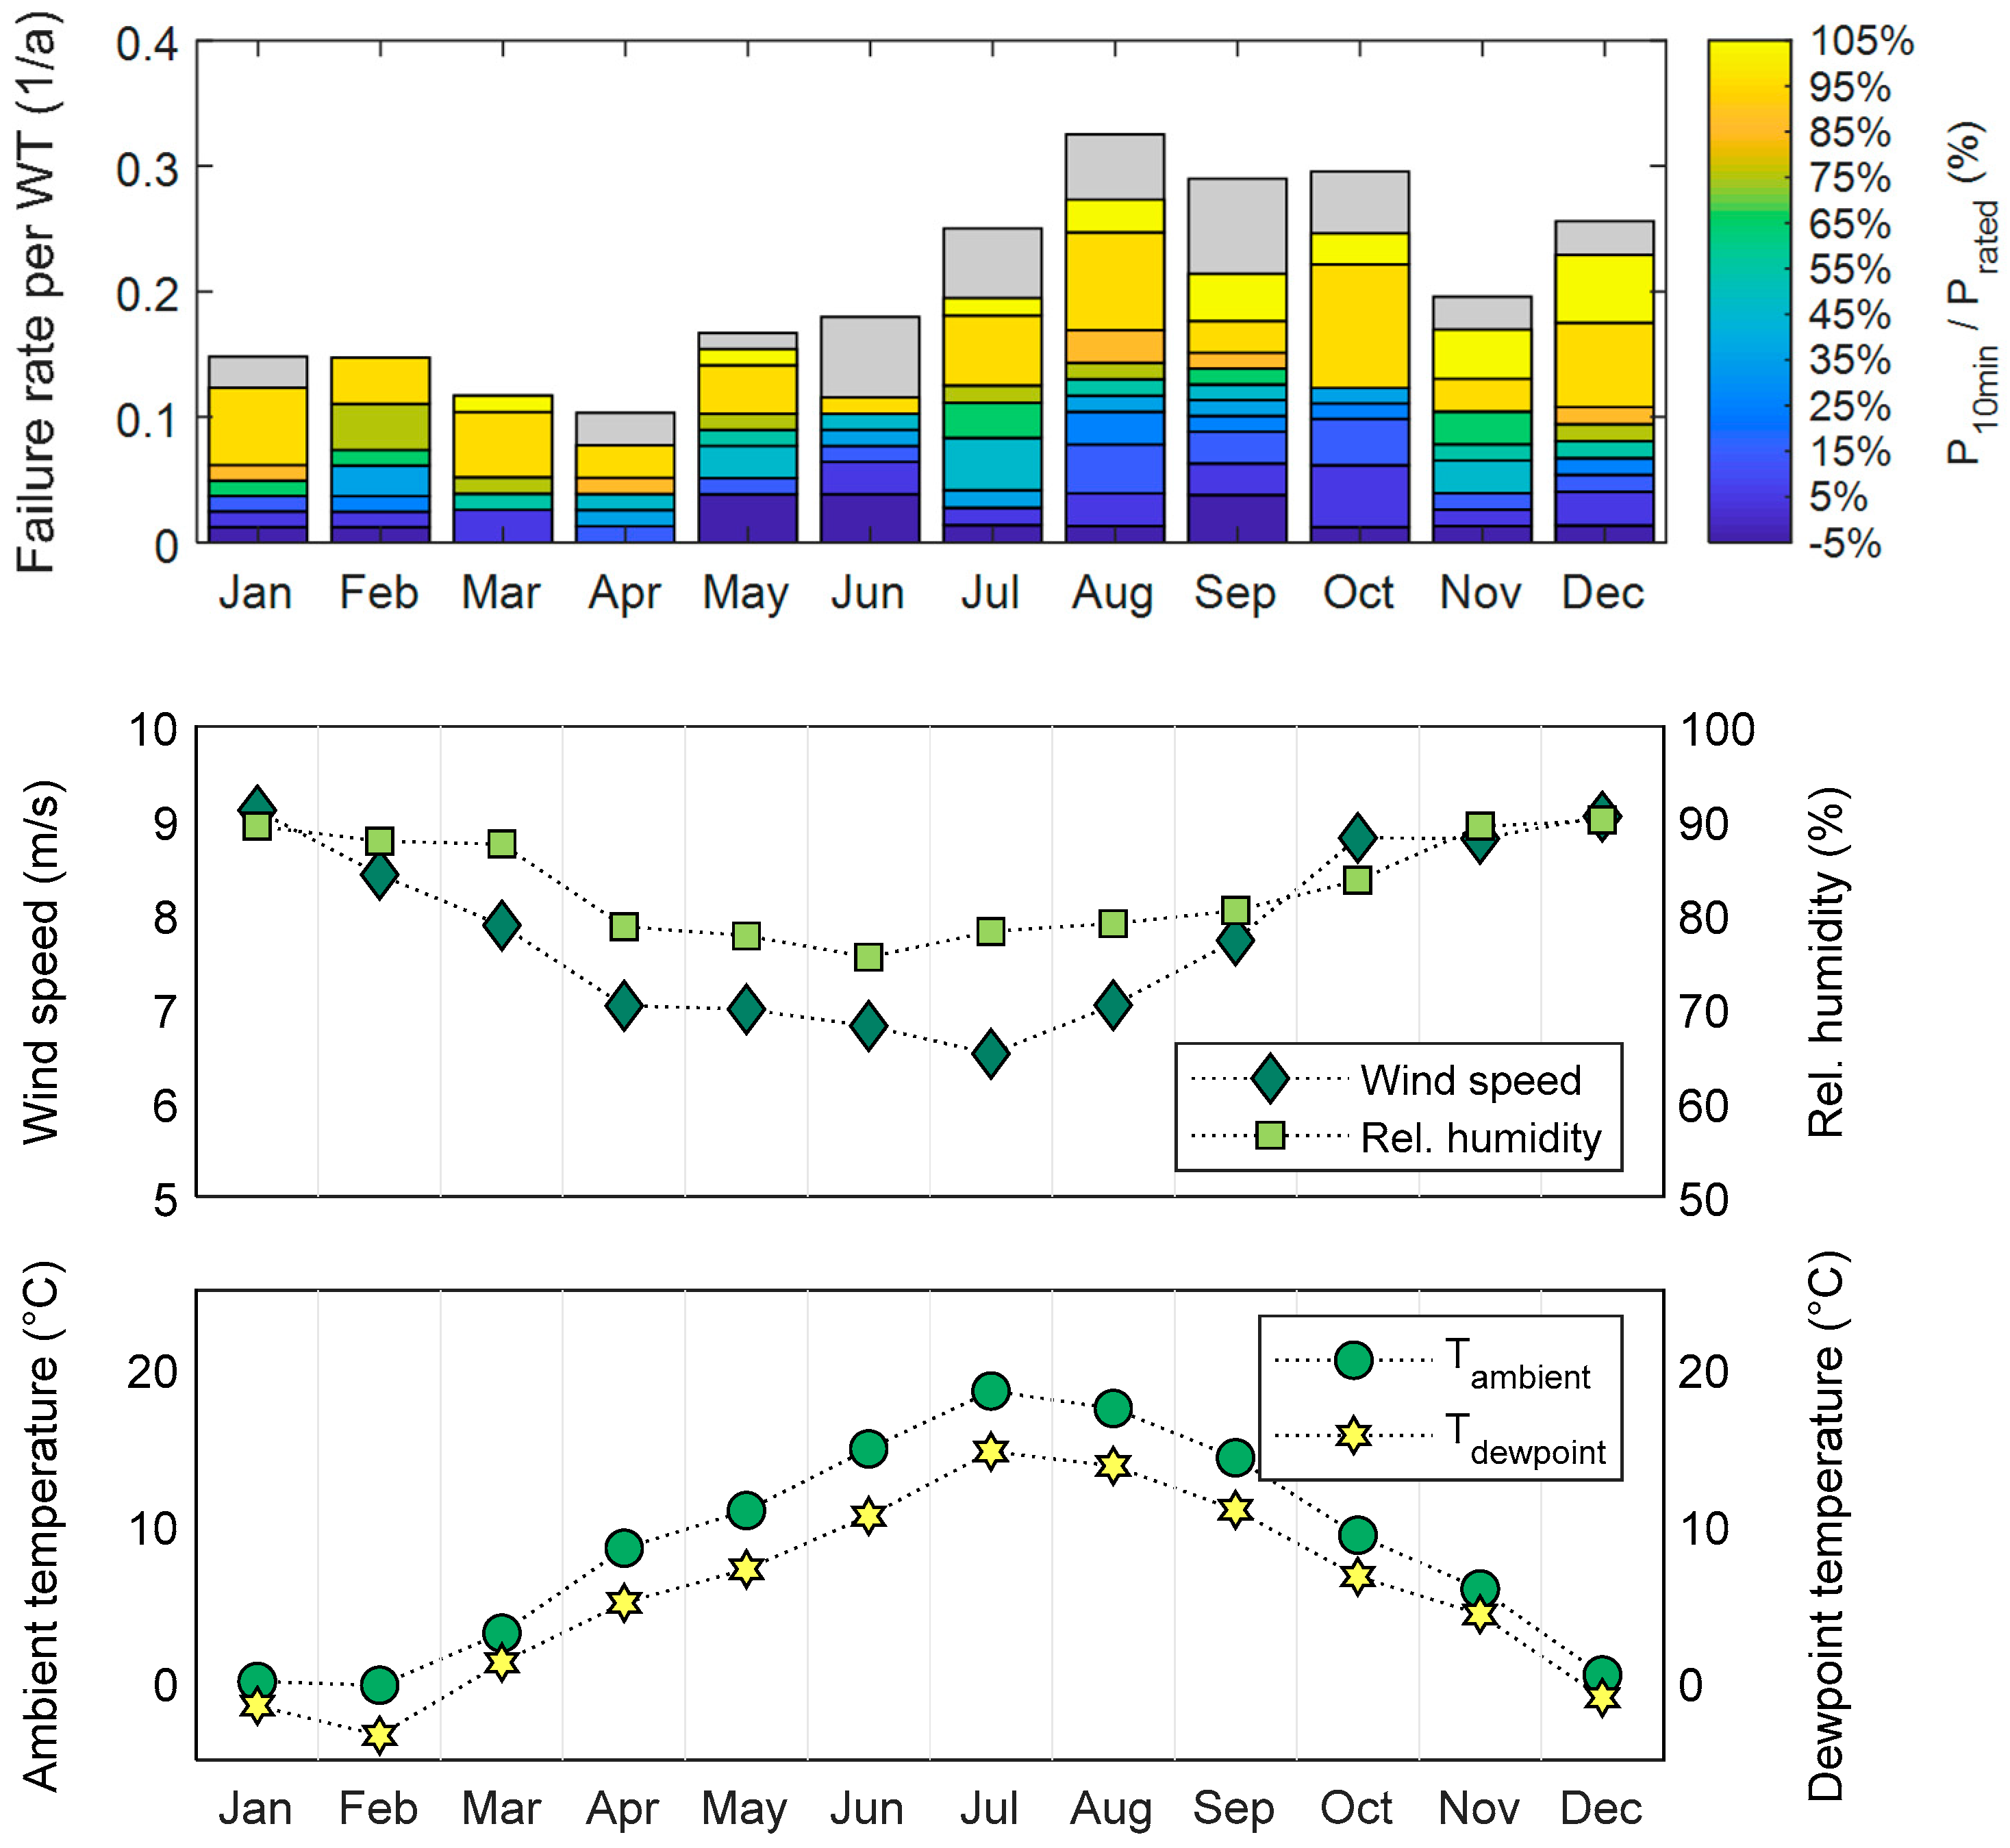
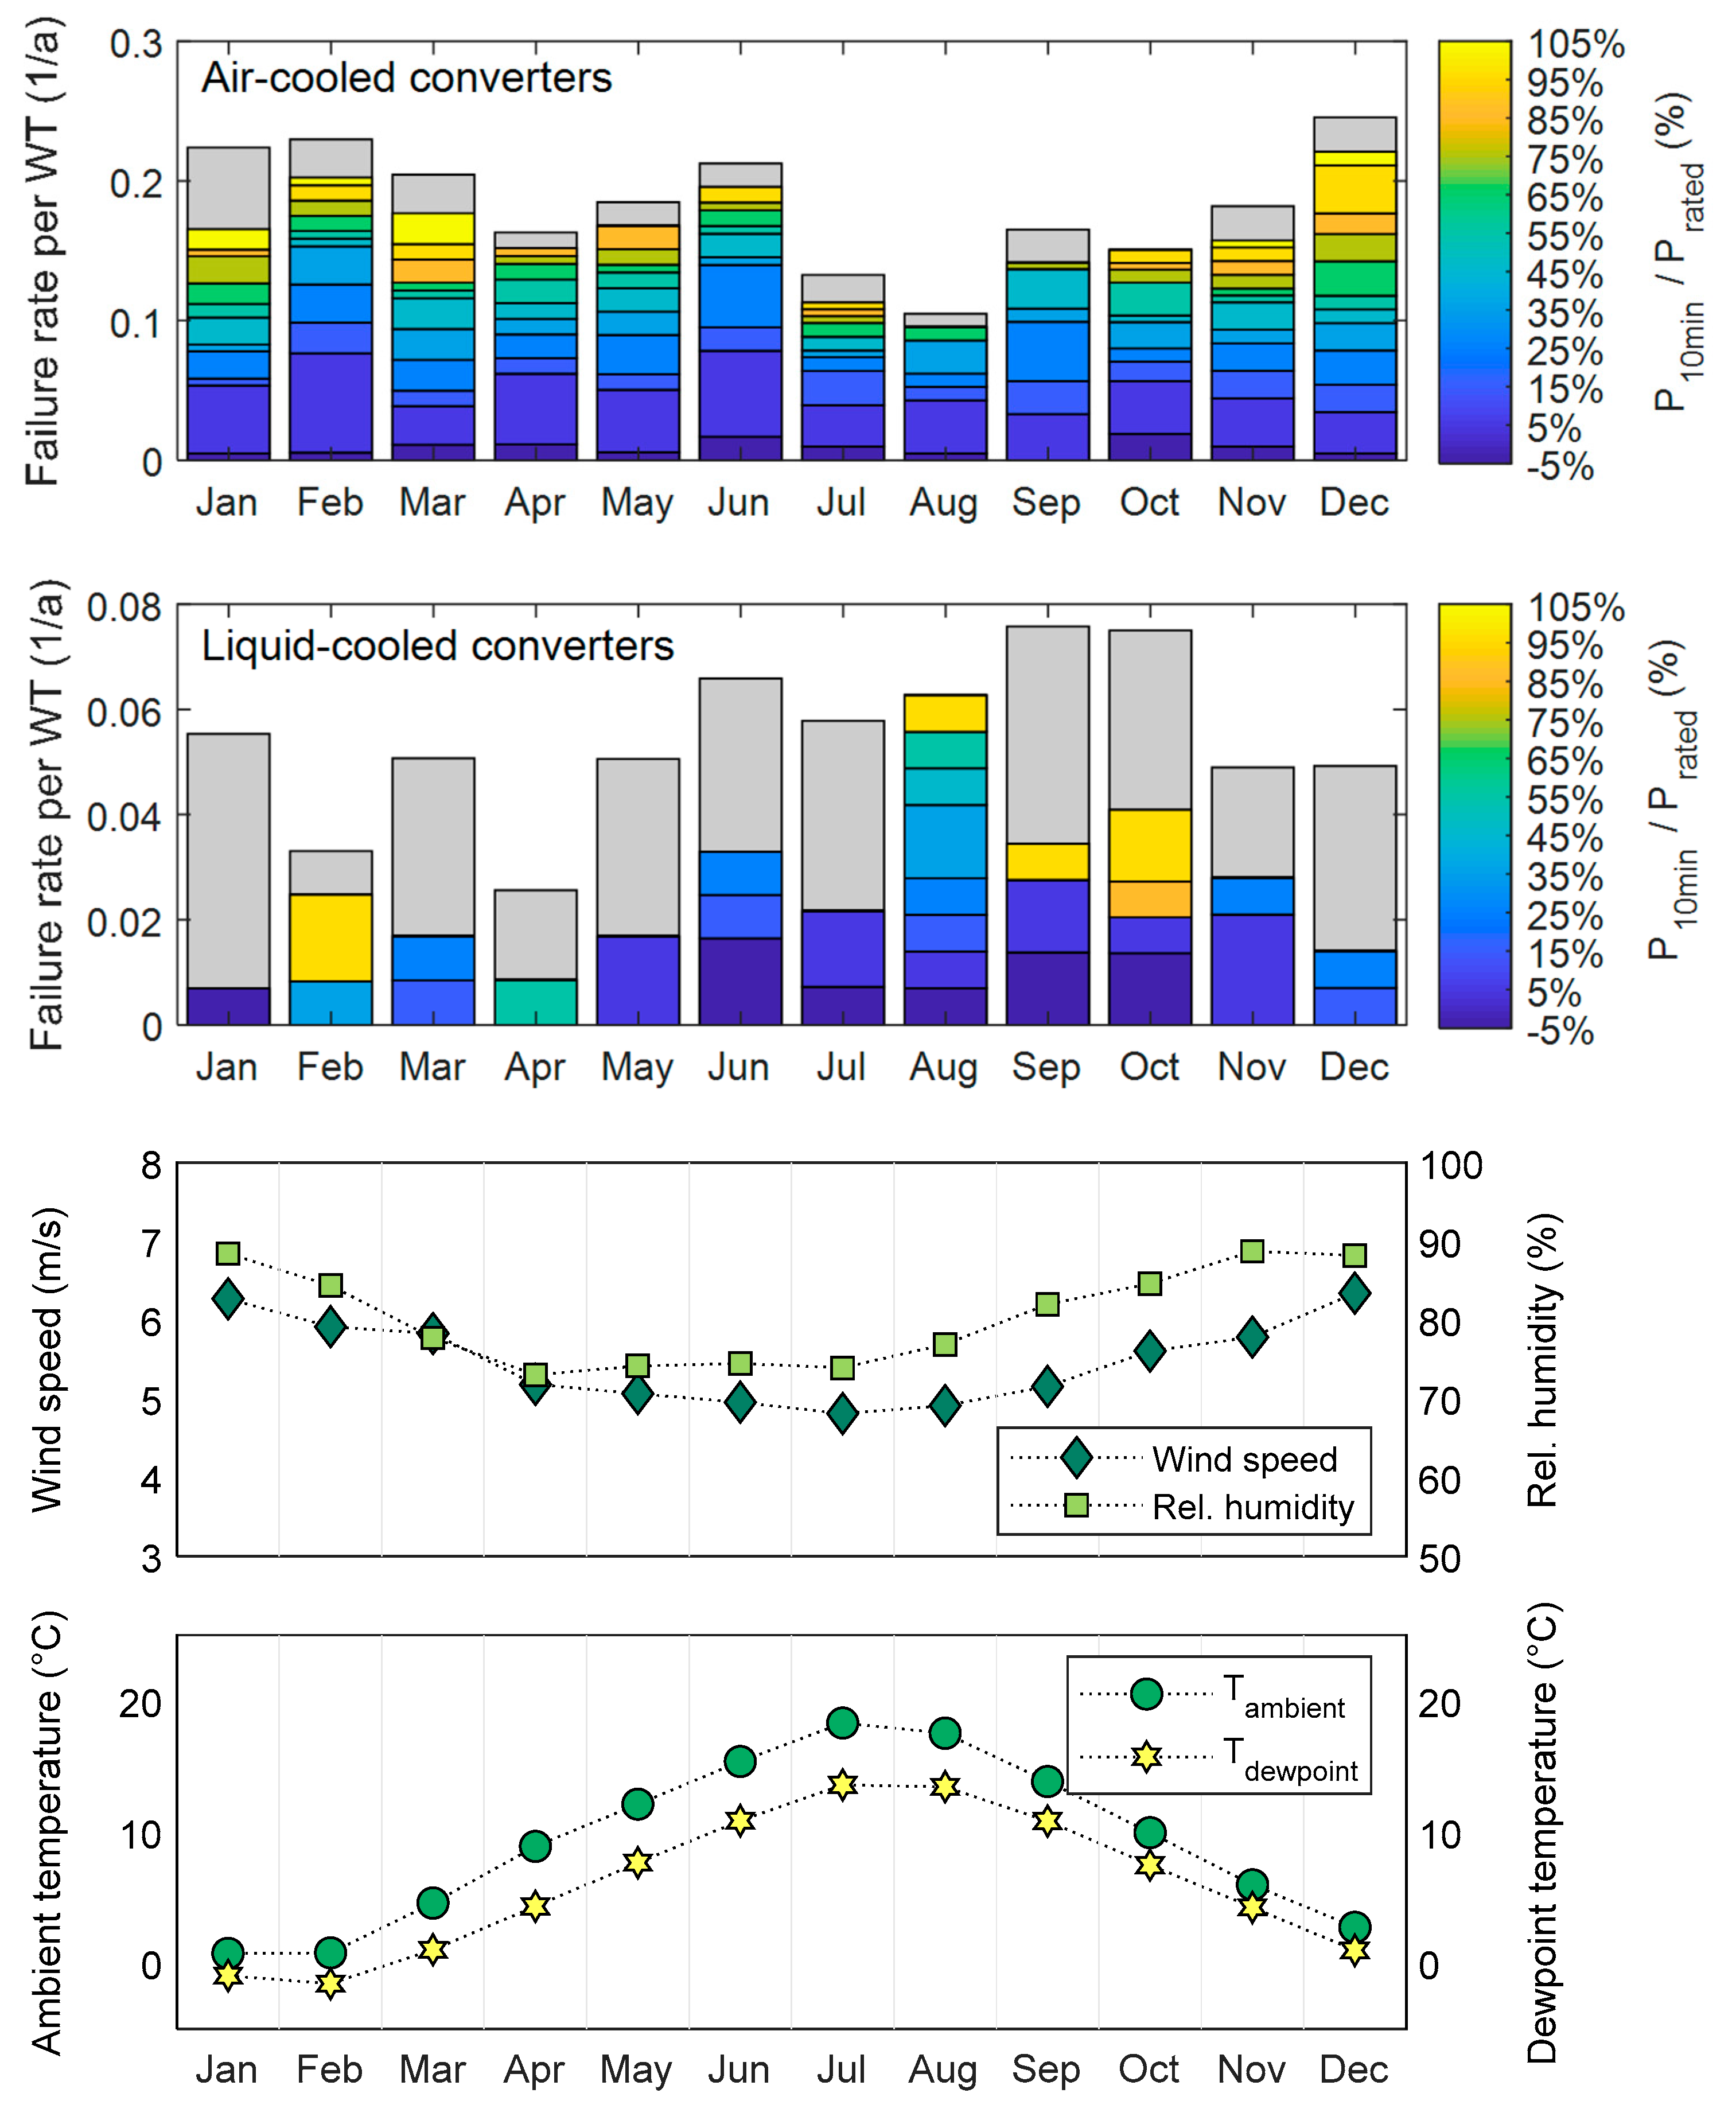
3.1.2. Seasonal Variation of Phase-module Failure Rates
3.2. Results of the Post-Mortem Analysis of Defect Components
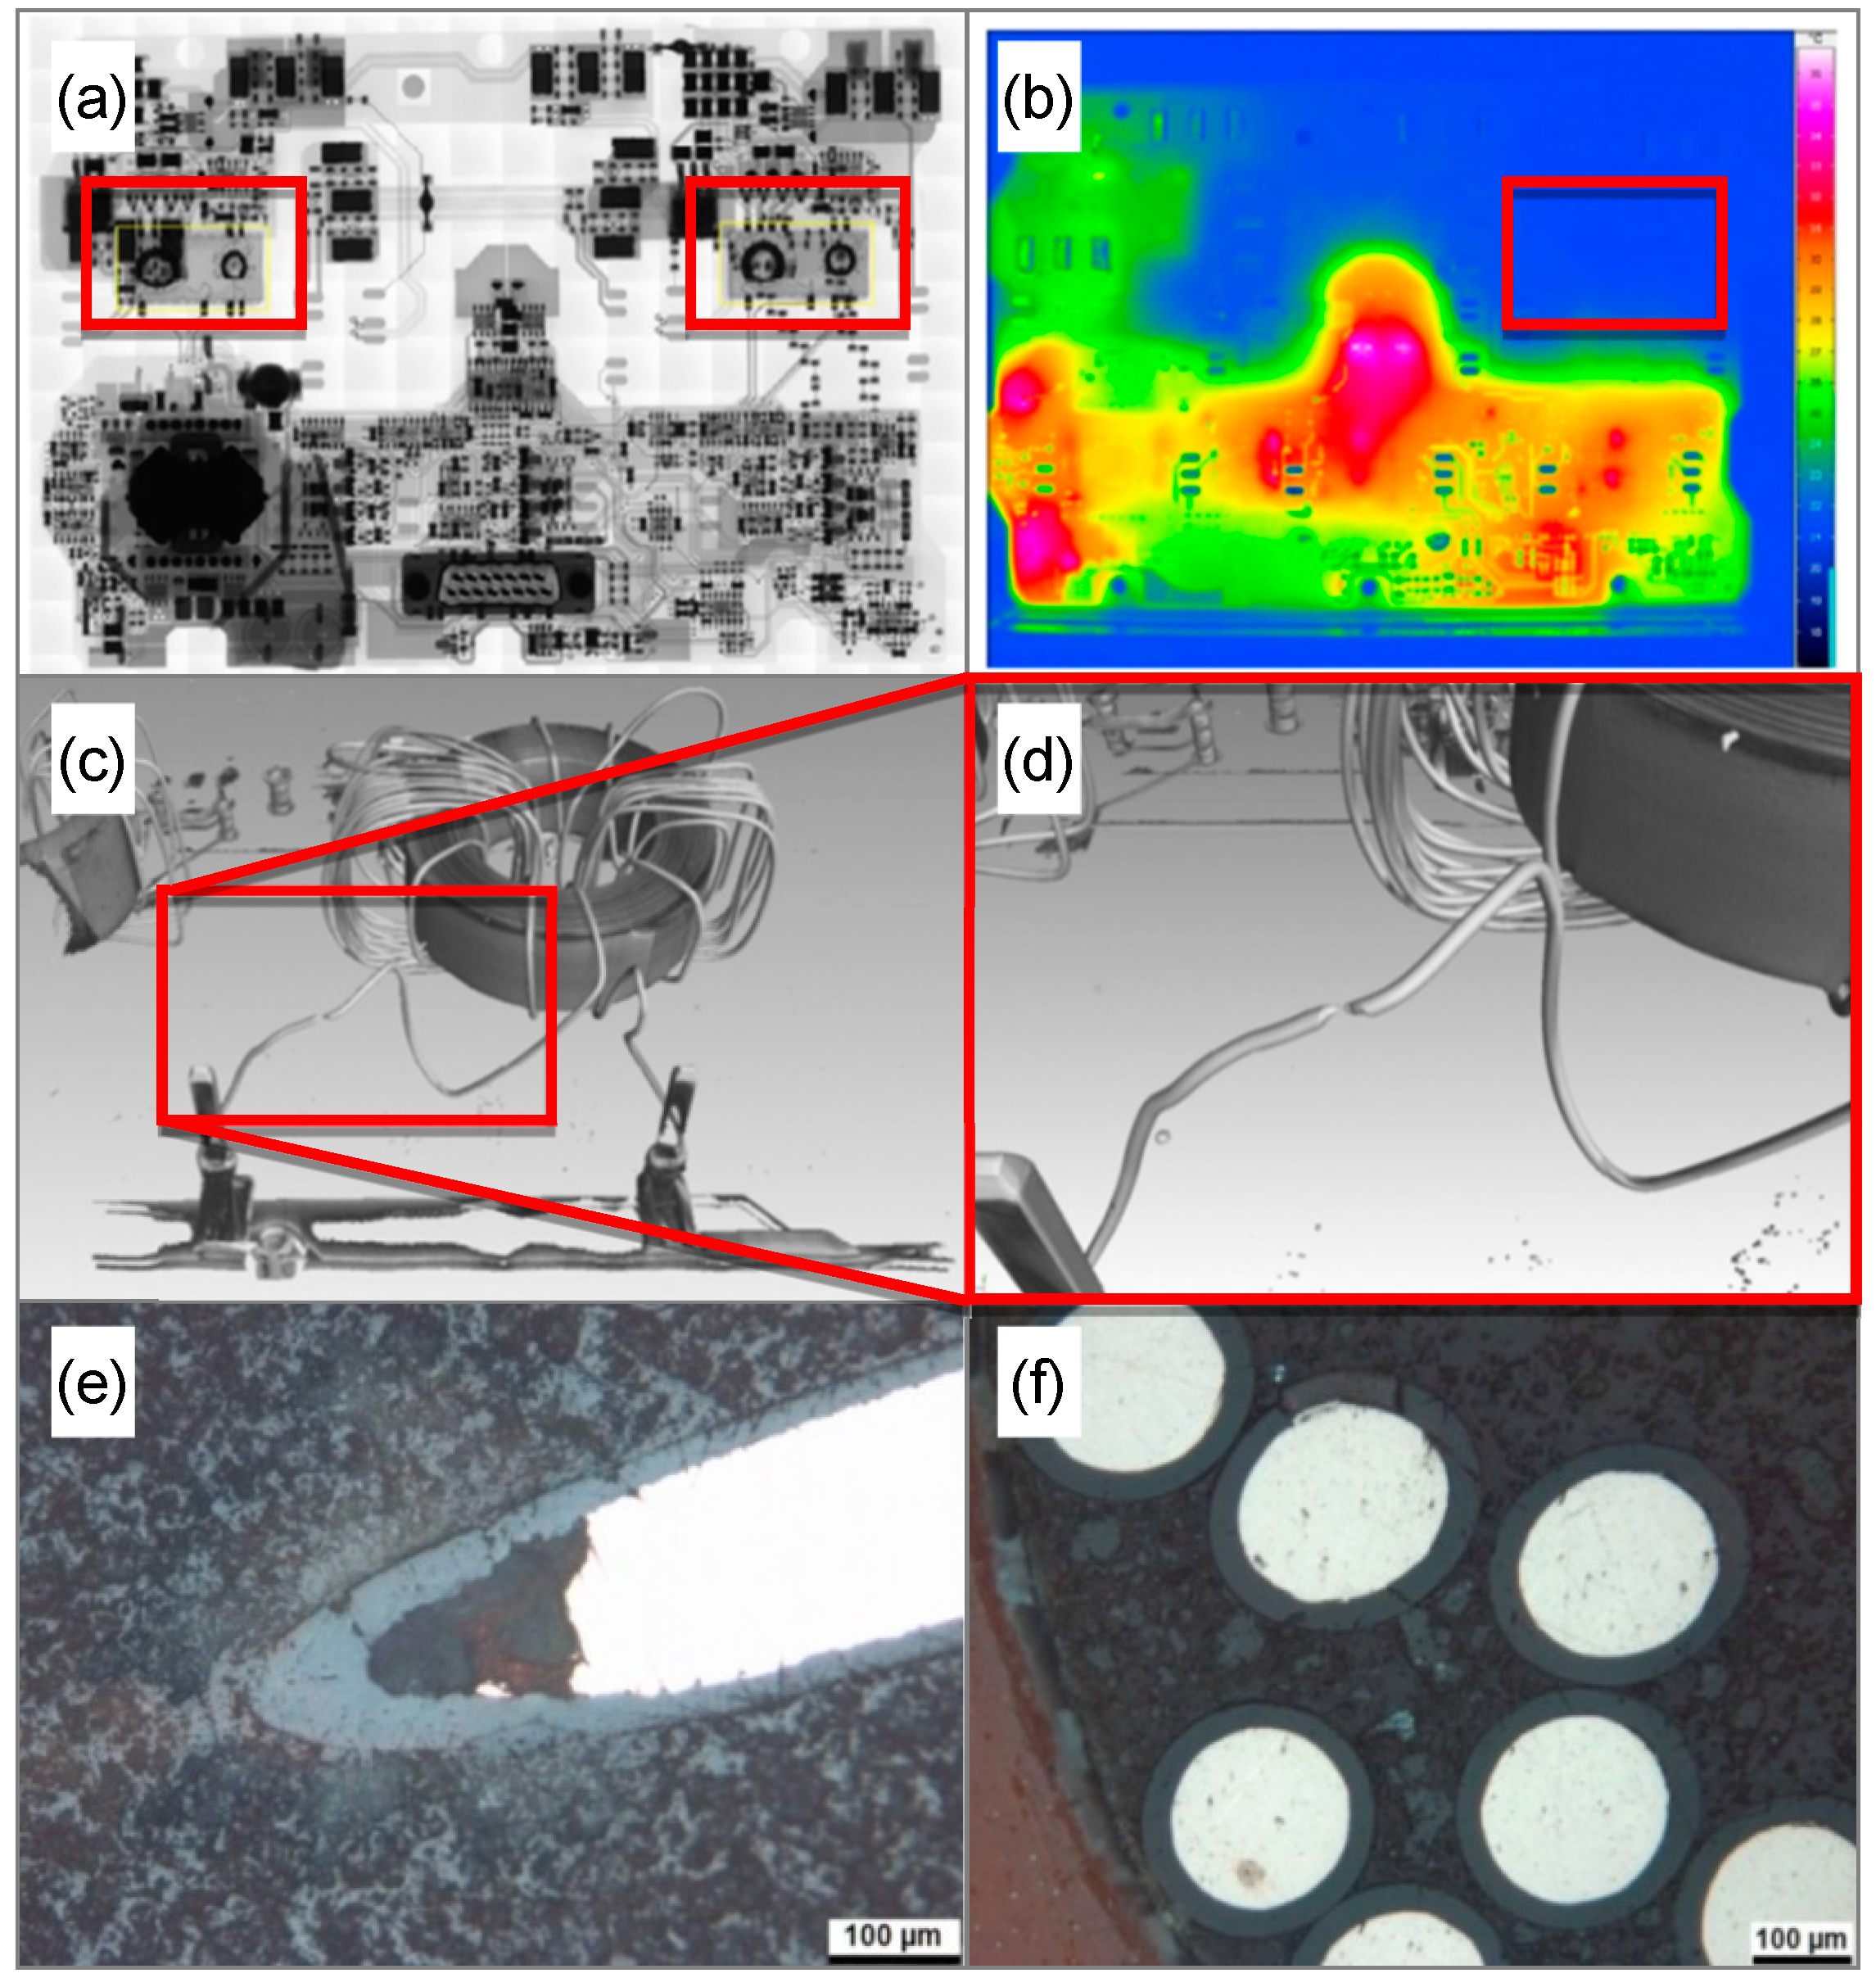
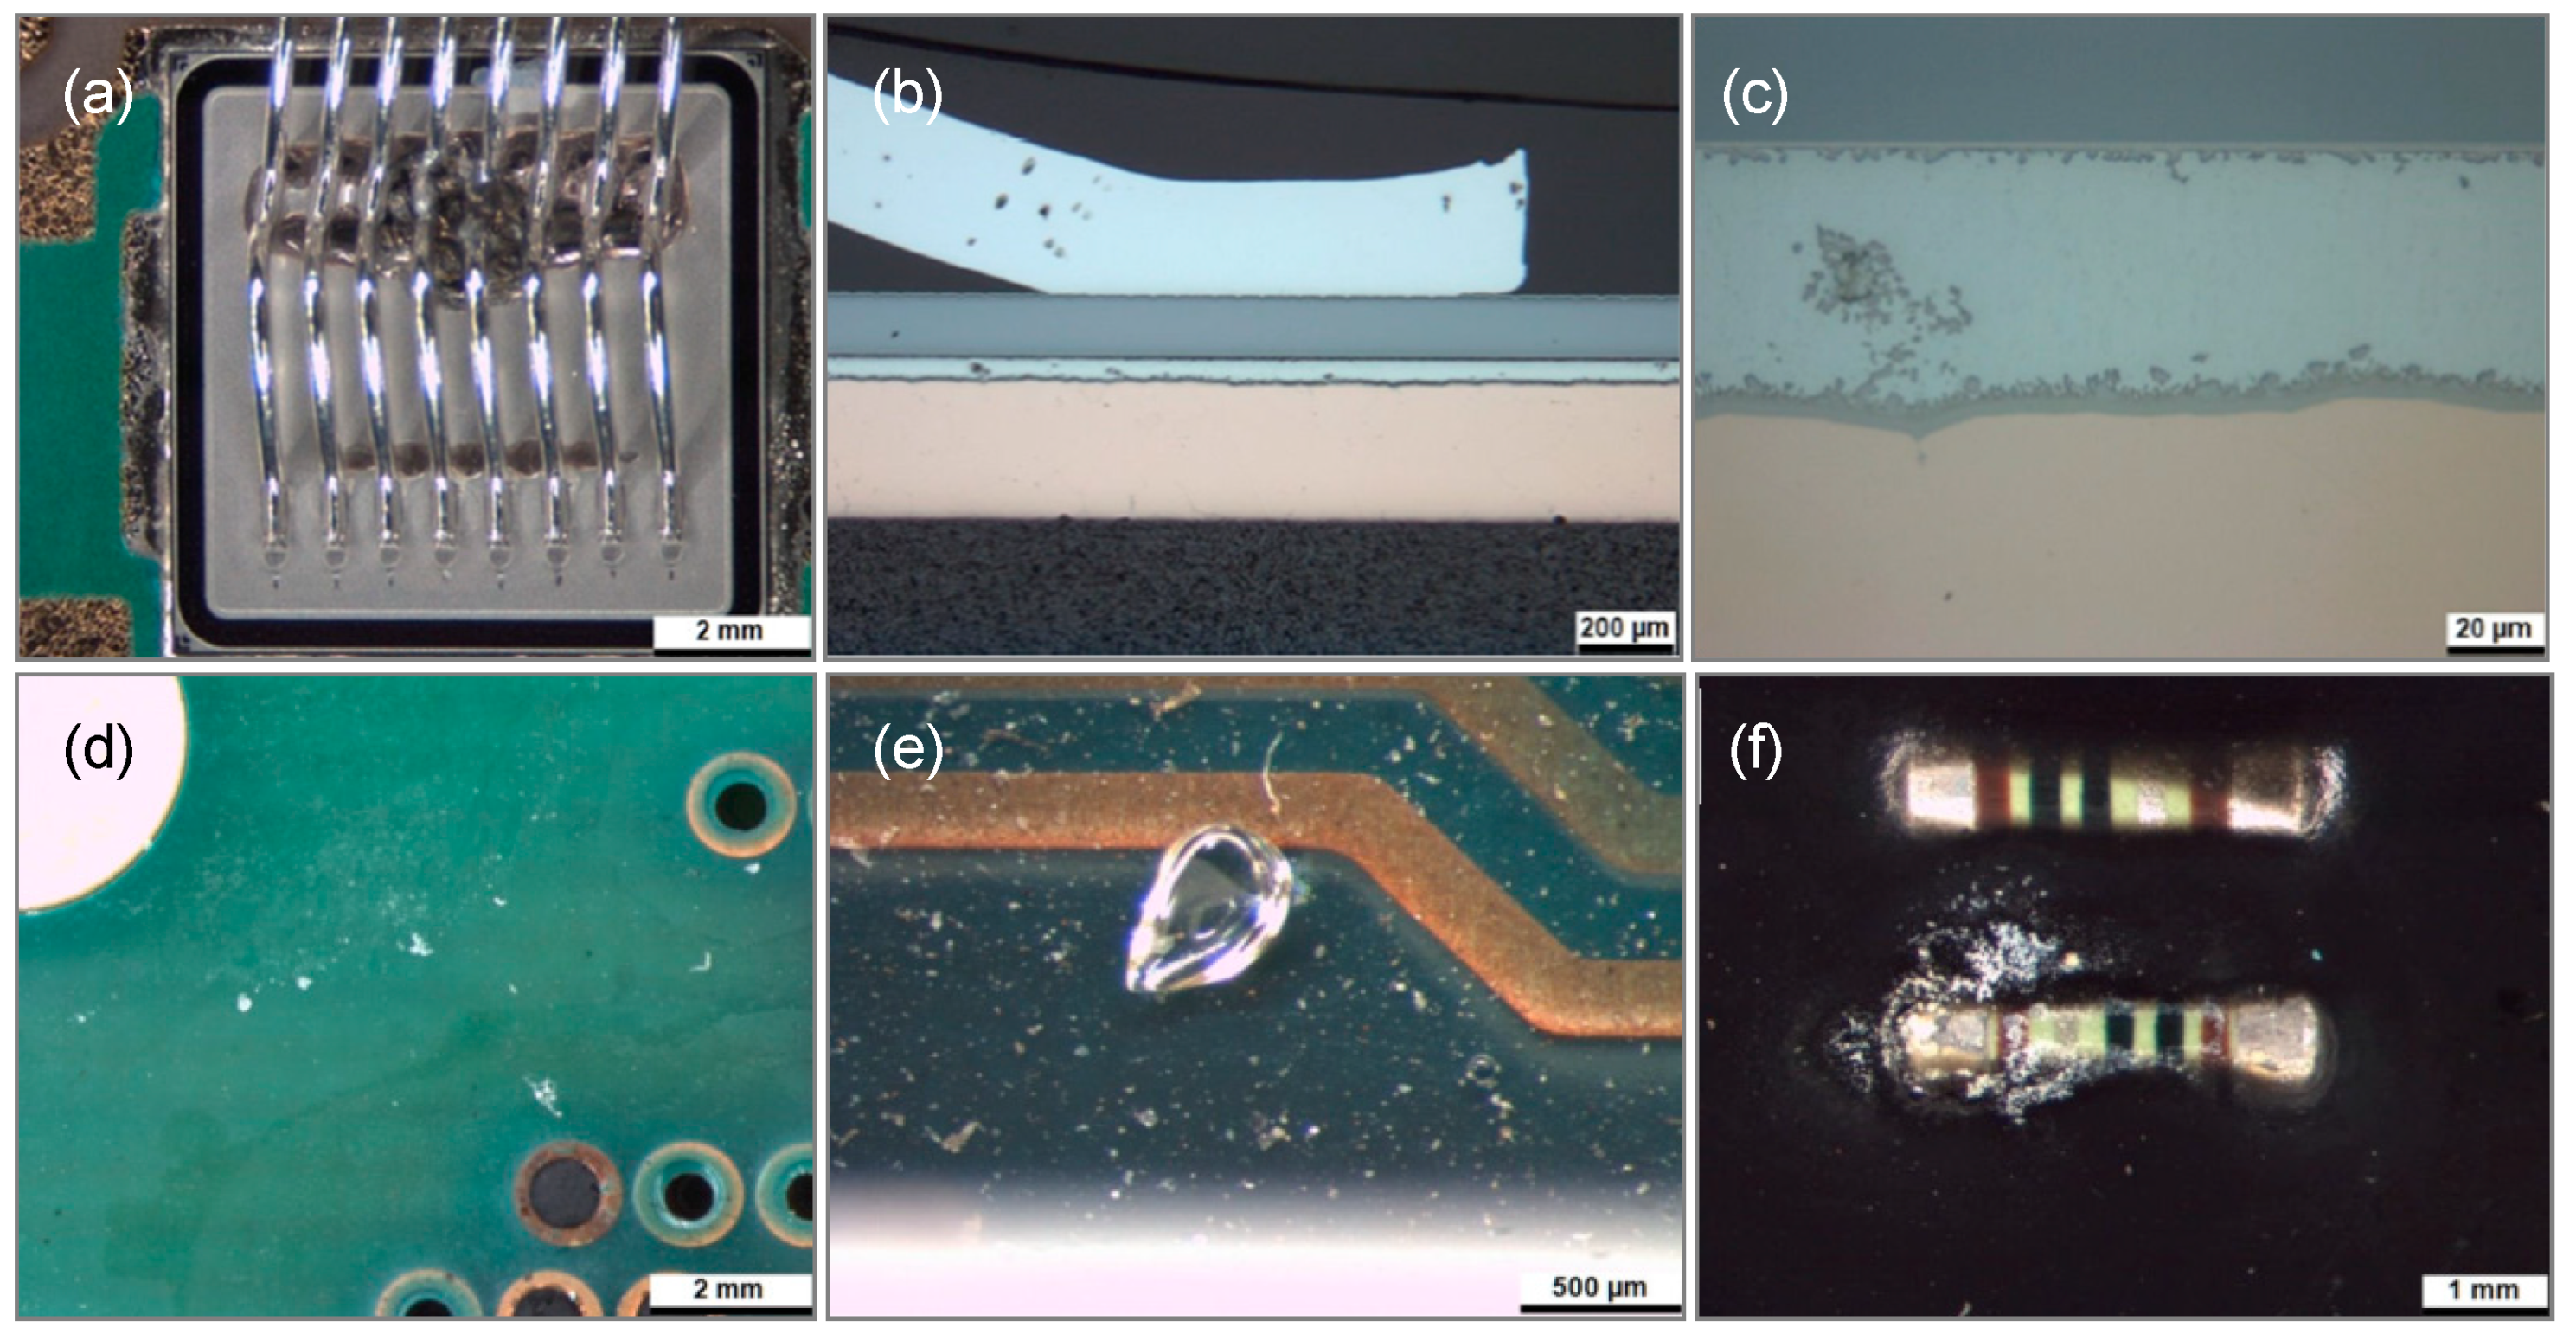
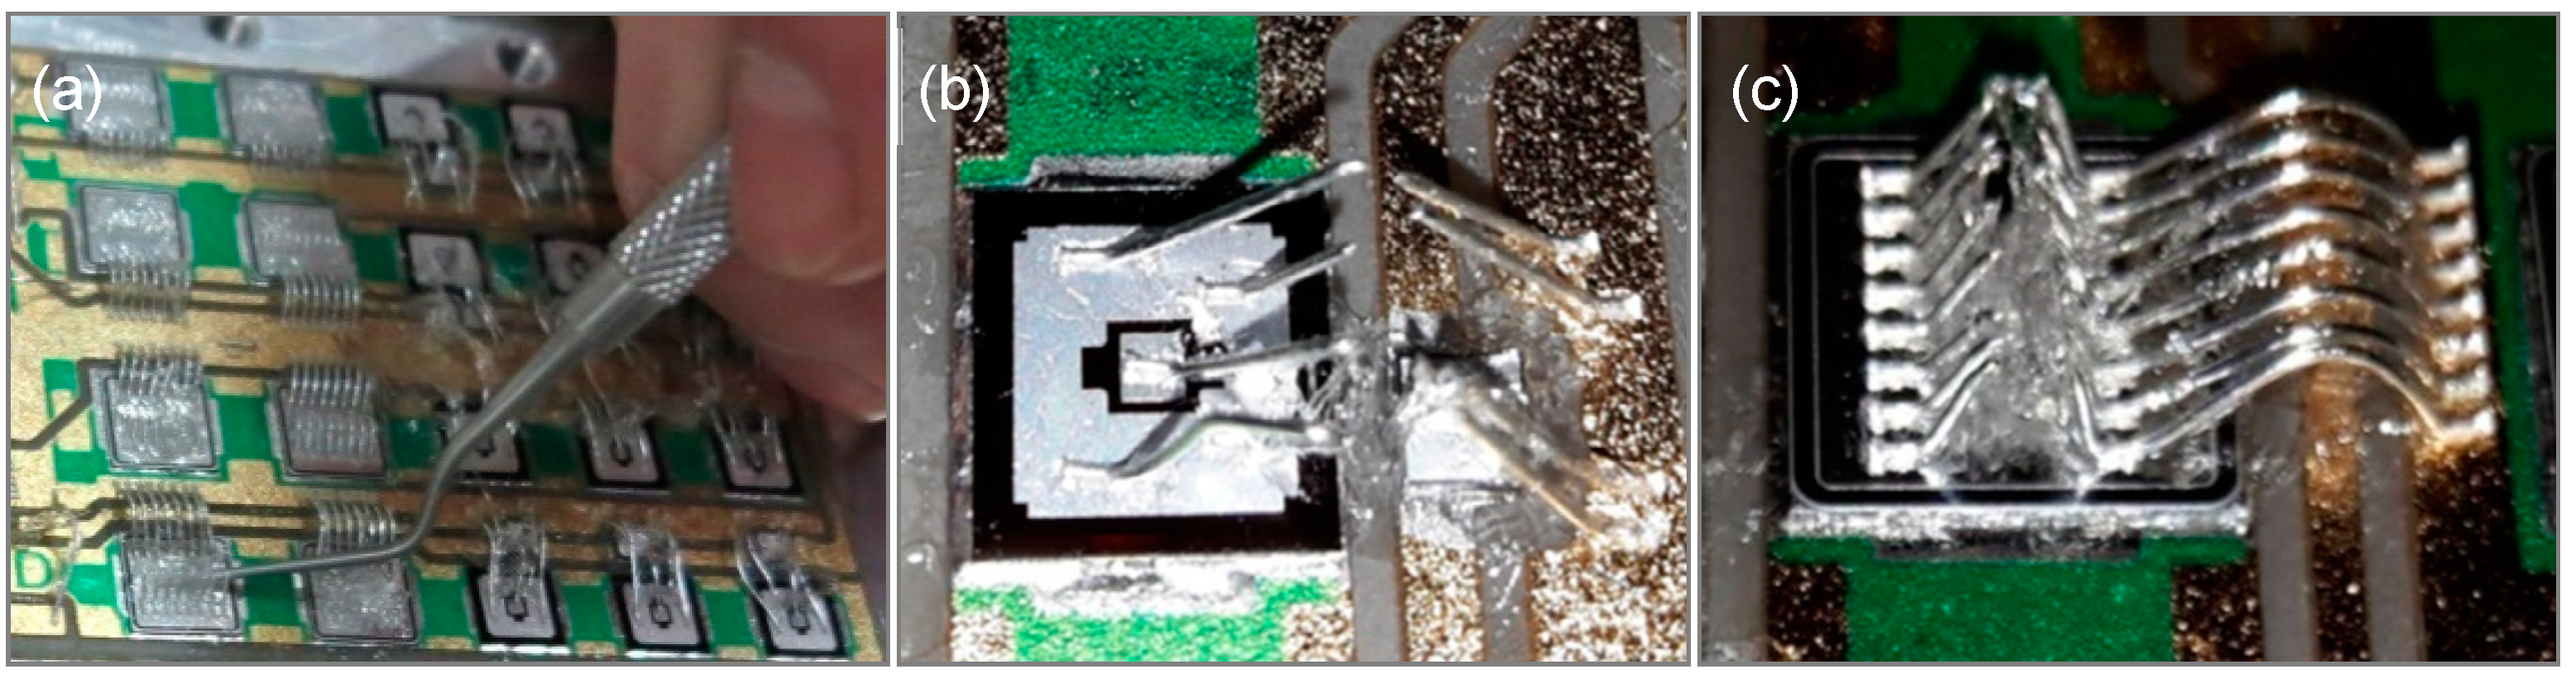
3.2.1. Analysis of IGBT Modules from a DFIG-based Turbine Type
3.2.2. Analysis of an IGBT Module from a Second DFIG-based Turbine Type
3.2.3. Analysis of a Generator-side Converter from a Turbine with PMSG
3.3. Results from Damage Analyses of Power-Converter and Power-Module Manufacturers
4. Discussion
- the research carried out within the Innovation Cluster,
- input from and discussion with various companies, including power-module and converter manufacturers, wind-turbine operators and maintenance service providers, as well as
- information from conferences and literature.
4.1. Factors with a Relevant Influence on Converter Failure
4.1.1. Humidity and Condensation
- insulation degradation in the DC-link busbars/laminates, but above all of the DC terminals and busbars of power modules, which leads to short-circuit failure and with that often to a damage of modules connected to the same DC link
- a reduction of the blocking capability of the power semiconductors due to electrochemical migration and aluminum corrosion, which was demonstrated by [43] under the combined influence of 85% relative humidity, a temperature of 85 °C and voltages above 65% of the nominal blocking voltage, and for which the occurrence even at lower humidity, temperature and voltage-stress levels is subject of further investigations
- the impairment of moisture-susceptible driver components by corrosion or electrochemical migration, which can, besides a full loss of function of the driver board, through an insufficient gate voltage lead to thermal damage of IGBTs (see Section 3.3).
4.1.2. Overheating
4.1.3. Weak Components
4.1.4. Asymmetric Current Sharing and Uncontrolled Switching of IGBTs
4.1.5. Contamination
- with coal dust (from generator brushes, especially in the absence of an extraction system),
- with dust from the environment (e.g., from agriculture, ore dust from mining),
- with salt (at offshore and nearshore locations),
- with and through insects.
4.1.6. Human Error and Maintenance Practice
- the leakage of coolant onto converter components leading to immediate short-circuit failure or time-delayed corrosion of the tracks and components of circuit boards in the converter [50],
- incorrectly wired converter heaters in systems without temperature feedback, which prevented converter preheating and in this way led to condensation failure during cold start-up,
- wrong valve positions in the converter cooling circuit, resulting in a permanent “overcooling” with subsequent failure due to condensation [44],
- short-circuit failure due to tools or screws remained in the converter after maintenance as well as due to insufficiently fastened cables, that subsequently loosened owing to vibration,
- too high or too low tightening torque for screw connections, e.g., at the power terminals of IGBT modules; the former case is a afflicted with enhanced mechanical stress inside the module, the latter case with the risk of hot spots and asymmetric load distribution due to the resulting high contact resistance.
4.2. Unlikely Causes of Converter Failure
4.2.1. Thermocycling-Induced Fatigue at Chip/Packaging Level
4.2.2. Transients during Connection to the Grid
4.2.3. Vibration
4.2.4. Cosmic Radiation
5. Conclusions
5.1. Summary and Main Conclusions of the Present Work
5.2. Future Work—Recommendations and Outlook
5.3. Recommendations for Documentation of Failure Events
- wind-turbine ID, type and location
- component position within the converter (e.g., grid side or generator side, phase)
- timestamp of the failure event
- wind speed and turbine power fed to the grid at the time of failure, possibly related conditions such as grid faults or thunderstorms preceding the failure event
- operating time until failure (for re-used components: including previous operating times in other turbines)
- further components damaged during the same failure event
Author Contributions
Funding
Acknowledgments
Conflicts of Interest
References
- Gayo, J.B. Final Publishable Summary of Results of Project ReliaWind; Gamesa Innovation and Technology: Egues, Spain, 2011. [Google Scholar]
- Matthews, P.; Ahmad, T. Improving Energy Yield Through Co-Ordinated Wind Farm Control. Presented at Wind Farm Data Management and Analysis Forum, Hamburg, Germany, 11–13 October 2016. [Google Scholar]
- Lin, Y.; Tu, L.; Liu, H.; Li, W. Fault analysis of wind turbines in China. Renew. Sustain. Energy Rev. 2016, 55, 482–490. [Google Scholar] [CrossRef]
- Portfolio Review 2016; System Performance, Availability and Reliability Trend Analysis. 2017. Available online: https://s3-eu-west-1.amazonaws.com/media.ore.catapult/wp-content/uploads/2017/03/28102600/SPARTAbrochure_20March-1.pdf (accessed on 29 November 2018).
- Busca, C.; Teodorescu, R.; Blaabjerg, F.; Munk-Nielsen, S.; Helle, L.; Abeyasekera, T.; Rodriguez, P. An overview of the reliability prediction related aspects of high power IGBTs in wind power applications. Microelectron. Reliab. 2011, 51, 1903–1907. [Google Scholar] [CrossRef]
- Musallam, M.; Johnson, C.M. Impact of different control schemes on the life consumption of power electronic modules for variable speed wind turbines. In Proceedings of the 2011 14th European Conference on Power Electronics and Applications, Birmingham, UK, 30 August–1 September 2011. [Google Scholar]
- Ikonen, M. Power cycling lifetime estimation of IGBT power modules based on chip temperature modeling. Ph.D. Thesis, Lappeenranta University of Technology, Lappeenranta, Finland, 11 December 2012. [Google Scholar]
- Ma, K.; Liserre, M.; Blaabjerg, F.; Kerekes, T. Thermal Loading and Lifetime Estimation for Power Device Considering Mission Profiles in Wind Power Converter. IEEE Trans. Power Electron. 2015, 30, 590–602. [Google Scholar] [CrossRef]
- Bartram, M.; Bloh, J.; von Doncker, R.W.D. Doubly-fed-machines in wind-turbine systems: is this application limiting the lifetime of IGBT-frequency-converters? In Proceedings of the 2004 IEEE 35th Annual Power Electronics Specialists Conference (IEEE Cat. No.04CH37551), Aachen, Germany, 20–25 June 2004; Volume 4, pp. 2583–2587. [Google Scholar]
- Wang, H.; Liserre, M.; Blaabjerg, F.; de Place Rimmen, P.; Jacobsen, J.B.; Kvisgaard, T.; Landkildehus, J. Transitioning to Physics-of-Failure as a Reliability Driver in Power Electronics. IEEE J. Emerg. Sel. Top. Power Electron. 2014, 2, 97–114. [Google Scholar] [CrossRef]
- Wei, L.; Kerkman, R.J.; Lukaszewski, R.A.; Lu, H.; Yuan, Z. Analysis of IGBT Power Cycling Capabilities Used in Doubly Fed Induction Generator Wind Power System. IEEE Trans. Ind. Appl. 2011, 47, 1794–1801. [Google Scholar] [CrossRef]
- Fuchs, F.; Mertens, A. Steady state lifetime estimation of the power semiconductors in the rotor side converter of a 2 MW DFIG wind turbine via power cycling capability analysis. In Proceedings of the 2011 14th European Conference on Power Electronics and Applications, Birmingham, UK, 30 August–1 September 2011; pp. 1–8. [Google Scholar]
- Pittini, R.; D’Arco, S.; Hernes, M.; Petterteig, A. Thermal stress analysis of IGBT modules in VSCs for PMSG in large offshore Wind Energy Conversion Systems. In Proceedings of the 2011 14th European Conference on Power Electronics and Applications, Birmingham, UK, 30 August–1 September 2011; pp. 1–10. [Google Scholar]
- D’Arco, S.; Undeland, T.; Bohlländer, M.; Lutz, J. A simplified algorithm for predicting power cycling lifetime in direct drive wind power systems. In Proceedings of the 9th International Multi-Conference on Systems, Signals and Devices (SSD), Chemnitz, Germany, 20–23 March 2012; pp. 1–6. [Google Scholar]
- Zhou, Q.; Xue, S.; Li, J.; Xiang, C.; Chen, S. Evaluation of wind power converter reliability considering multi-time scale and mission profiles. In Proceedings of the 2016 IEEE International Conference on High Voltage Engineering and Application (ICHVE), Chengdu, China, 19–22 September 2016; pp. 1–4. [Google Scholar]
- Smith, C.J.; Crabtree, C.J.; Matthews, P.C. Impact of wind conditions on thermal loading of PMSG wind turbine power converters. IET Power Electron. 2017, 10, 1268–1278. [Google Scholar] [CrossRef]
- Baygildina, E.; Peltoniemi, P.; Pyrhönen, O.; Ma, K.; Blaabjerg, F. Thermal loading of wind power converter considering dynamics of wind speed. In Proceedings of the IECON 2013—39th Annual Conference of the IEEE Industrial Electronics Society, Vienna, Austria, 10–13 November 2013; pp. 1362–1367. [Google Scholar]
- Zhou, D.; Blaabjerg, F.; Franke, T.; Tønnes, M.; Lau, M. Comparison of Wind Power Converter Reliability with Low-Speed and Medium-Speed Permanent-Magnet Synchronous Generators. IEEE Trans. Ind. Electron. 2015, 62, 6575–6584. [Google Scholar] [CrossRef]
- Zhang, G.; Zhou, D.; Blaabjerg, F.; Yang, J. Mission profile resolution effects on lifetime estimation of doubly-fed induction generator power converter. In Proceedings of the 2017 IEEE Southern Power Electronics Conference (SPEC), Puerto Varas, Chile, 4–7 December 2017; pp. 1–6. [Google Scholar]
- Konrad, S. Ein Beitrag zur Auslegung und Integration Spannungsgespeister IGBT-Wechselrichter (A cContribution to the Design and Integration of IGBT-Based Voltage Source Converters). Ph.D. Thesis, Technische Universität Ilmenau, Ilmenau, Germany, 1997. [Google Scholar]
- Zhu, P.; Liu, Y.; Robert, R.; Hao, X. Offshore wind converter reliability evaluation. In Proceedings of the 8th International Conference on Power Electronics—ECCE Asia, Jeju, Korea, 30 May–3 June 2011; pp. 966–971. [Google Scholar]
- Wu, R.; Reigosa, P.D.; Iannuzzo, F.; Wang, H.; Blaabjerg, F. A comprehensive investigation on the short circuit performance of MW-level IGBT power modules. In Proceedings of the 2015 17th European Conference on Power Electronics and Applications (EPE’15 ECCE-Europe), Geneva, Switzerland, 8–10 September 2015; pp. 1–9. [Google Scholar]
- Rannestad, B.; Maarbjerg, A.E.; Frederiksen, K.; Munk-Nielsen, S.; Gadgaard, K. Converter Monitoring Unit for Retrofit of Wind Power Converters. IEEE Trans. Power Electron. 2018, 33, 4342–4351. [Google Scholar] [CrossRef]
- Zhou, D.; Blaabjerg, F. Reliability evaluation of power capacitors in a wind turbine system. In Proceedings of the 2018 IEEE Applied Power Electronics Conference and Exposition (APEC), San Antonio, TX, USA, 4–8 March 2018; pp. 3264–3269. [Google Scholar]
- Holzke, W.; Brunko, A.; Groke, H.; Kaminski, N.; Orlik, B. A Condition Monitoring System for Power Semiconductors in Wind Energy Plants. In Proceedings of the PCIM Europe 2018; International Exhibition and Conference for Power Electronics, Intelligent Motion, Renewable Energy and Energy Management, Nuremberg, Germany, 5–7 June 2018; pp. 1–7. [Google Scholar]
- Falck, J.; Felgemacher, C.; Rojko, A.; Liserre, M.; Zacharias, P. Reliability of Power Electronic Systems: An Industry Perspective. IEEE Ind. Electron. Mag. 2018, 12, 24–35. [Google Scholar] [CrossRef]
- Fischer, K.; Stalin, T.; Ramberg, H.; Thiringer, T.; Wenske, J.; Karlsson, R. Investigation of Converter Failure in Wind Turbines; Elforsk Report for Chalmers University of Technology, Elforsk: Stockholm, Sweden, 2012. [Google Scholar]
- Fischer, K.; Stalin, T.; Ramberg, H.; Wenske, J.; Wetter, G.; Karlsson, R.; Thiringer, T. Field-Experience Based Root-Cause Analysis of Power-Converter Failure in Wind Turbines. IEEE Trans. Power Electron. 2015, 30, 2481–2492. [Google Scholar] [CrossRef]
- Bartschat, A.; Morisse, M.; Mertens, A.; Wenske, J. Analysis of Dynamic Interactions between Different Drivetrain Components with a Detailed Wind Turbine Model. J. Phys. Conf. Ser. 2016, 753, 082022. [Google Scholar] [CrossRef]
- Morisse, M.; Bartschat, A.; Wenske, J.; Mertens, A. Dependency of the lifetime estimation of power modules in fully rated wind turbine converters on the modelling depth of the overall system. In Proceedings of the 2016 18th European Conference on Power Electronics and Applications (EPE’16 ECCE Europe), Karlsruhe, Germany, 5–9 September 2016; pp. 1–9. [Google Scholar]
- Morisse, M.; Bartschat, A.; Wenske, J.; Mertens, A. Converter Lifetime Assessment for Doubly-Fed Induction Generators Considering Derating Control Strategies at Low Rotor Frequencies. J. Phys. Conf. Ser. 2016, 753, 112003. [Google Scholar] [CrossRef]
- Fischer, K.; Wenske, J. Towards reliable power converters for wind turbines: Field-data based identification of weak points and cost drivers. In Proceedings of the Proceedings of EWEA Conference, Paris, France, 7–20 November 2015. [Google Scholar]
- Pelka, K.; Fischer, K. Failure Behaviour of Power Converters in Wind Turbines. In Proceedings of the 13th German Wind Energy Conference DEWEK, Bremen, Germany, 17–18 October 2017. [Google Scholar]
- Bartschat, A.; Broer, C.; Coronado, D.; Fischer, K.; Kucka, J.; Mertens, A.; Meyer, R.; Moriße, M.; Pelka, K.; Tegtmeier, B.; et al. Zuverlässige Leistungselektronik für Windenergieanlagen. Abschlussbericht zum Fraunhofer-Innovationscluster Leistungselektronik für regenerative Energieversorgung; Fraunhofer Verlag: Stuttgart, Germany, 2018; ISBN 978-3-8396-1326-9. [Google Scholar]
- Fischer, K.; Pelka, K.; Bartschat, A.; Tegtmeier, B.; Coronado, D.; Broer, C.; Wenske, J. Reliability of Power Converters in Wind Turbines: Exploratory Analysis of Failure and Operating Data from a Worldwide Turbine Fleet. IEEE Trans. Power Electron. 2018, 1. [Google Scholar] [CrossRef]
- Pelka, K.; Fischer, K. Reliability Analysis of Power Converters in Wind Turbines: Assessing the Effect of Time and Design. Wind Energy 2019. under review for publication. [Google Scholar]
- Bain, L.J.; Engelhardt, M. Statistical Analysis of Reliability and Life Testing Models: Theory and Methods, 2nd ed.; Marcel Dekker Inc.: New York, NY, USA, 1991. [Google Scholar]
- Weatherbase, Weather Averages. Available online: http://www.weatherbase.com/ (accessed on 30 January 2019).
- Danish Meteorological Institute (DMI). 2011. Available online: https://www.dmi.dk/brug-dmis-data/ (accessed on 12 February 2019).
- Swedish Meteorological and Hydrological Institute (SMHI). 2011. Available online: https://www.smhi.se/en (accessed on 29 November 2018).
- Deutscher Wetterdienst (DWD); Weather-data and Statistics Express (WESTE-XL). Available online: www.dwd.de/EN (accessed on 29 November 2018).
- Su, C.; Hu, Z. Reliability assessment for Chinese domestic wind turbines based on data mining techniques. Wind Energy 2018, 21, 198–209. [Google Scholar] [CrossRef]
- Zorn, C.; Kaminski, N. Temperature–humidity–bias testing on insulated-gate bipolartransistor modules—Failure modes and acceleration due to high voltage. IET Power Electron. 2015, 8, 2329–2335. [Google Scholar] [CrossRef]
- Krogh Nielsen (Vestas), C. Smart Data. Presented at the workshop Advancements In Condition Monitoring Across A Whole Fleet, Hamburg, Germany, 11 October 2016. [Google Scholar]
- Deutsche Windtechnik Upgrade for Vestas: Cooling for inverter control unit. Available online: https://www.deutsche-windtechnik.com/upgrades-retrofits/upgrade/10-Cooling-for-Inverter-Control-Unit (accessed on 30 January 2019).
- Dodson, B.; Nolan, D. Reliability Engineering Handbook; Marcel Dekker, Inc.: New York, NY, USA, 1999. [Google Scholar]
- Bayerer, R. Parasitic inductance hindering utilization of power devices. In Proceedings of the CIPS 2016—9th International Conference on Integrated Power Electronics Systems, Nuremberg, Germany, 8–10 March 2016; pp. 1–8. [Google Scholar]
- Bayerer, R.; Domes, D. Parasitic inductance in gate drive circuits. In Proceedings of the PCIM 2012, Nuremberg, Germany, 8–10 May 2012. [Google Scholar]
- Bayerer, R. Streuinduktivität, ein Problem der Leistungselektronik. Presented at Bauelemente der Leistungselektronik und ihre Anwendungen, Bad Nauheim, Germany, 6–7 April 2017. [Google Scholar]
- Fukui, R.; Dvorak, P. How to Safeguard AEBI Control Boards against Corrosion. Available online: http://www.windpowerengineering.com/maintenance/how-to-safeguard-aebi-control-boards-against-corrosion/ (accessed on 29 November 2018).
- Steinhilber, F.; Abreu, J.A.; Beer, J.; Brunner, I.; Christl, M.; Fischer, H.; Heikkilä, U.; Kubik, P.W.; Mann, M.; McCracken, K.G.; et al. 9400 years of cosmic radiation and solar activity from ice cores and tree rings. Proc. Natl. Acad. Sci. USA 2012, 109, 5967. [Google Scholar] [CrossRef] [PubMed]
- VGB-Standard RDS-PP Application Guideline Part 32: Wind Power Plants; VGB PowerTech: Essen, Germany, 2014; ISBN 978-3-86875-693-7.


| Number of WTs with a main converter | 2734 |
| Converter failure data from years | 2003–2017 |
| Total number of evaluated WT operating years | 7399 |
| Evaluated dataset covers WTs of the manufacturers | DeWind, Enercon, Fuhrländer, Gamesa, General Electric, Kenersys, Nordex, Senvion, Suzlon, Siemens, Vestas |
| Rated power of WTs | 500–3600 kW |
| Year of commissioning of the WTs | 1997–2015 (unknown for 114 WT) |
| WTs located on continents | Europe, Asia, North America, South America |
| Generator-converter concepts of WTs |
|
| Investigated Factor | Converter Component | Relevance | |
|---|---|---|---|
| High | Low | ||
| Contamination | All | X | |
| Cosmic radiation | Power modules | X | |
| Current asymmetries, uncontrolled IGBT switching | Power modules | X | |
| Human errors | All | X | |
| Moisture and condensation | All | X | |
| Overheating | All | X | |
| Thermal-cycling induced fatigue on chip/packaging level | Power modules | X | |
| Transients during grid coupling | Power modules | X | |
| Vibration | All | X | |
| Weak single components | Driver boards, power modules | X | |
© 2019 by the authors. Licensee MDPI, Basel, Switzerland. This article is an open access article distributed under the terms and conditions of the Creative Commons Attribution (CC BY) license (http://creativecommons.org/licenses/by/4.0/).
Share and Cite
Fischer, K.; Pelka, K.; Puls, S.; Poech, M.-H.; Mertens, A.; Bartschat, A.; Tegtmeier, B.; Broer, C.; Wenske, J. Exploring the Causes of Power-Converter Failure in Wind Turbines based on Comprehensive Field-Data and Damage Analysis. Energies 2019, 12, 593. https://doi.org/10.3390/en12040593
Fischer K, Pelka K, Puls S, Poech M-H, Mertens A, Bartschat A, Tegtmeier B, Broer C, Wenske J. Exploring the Causes of Power-Converter Failure in Wind Turbines based on Comprehensive Field-Data and Damage Analysis. Energies. 2019; 12(4):593. https://doi.org/10.3390/en12040593
Chicago/Turabian StyleFischer, Katharina, Karoline Pelka, Sebastian Puls, Max-Hermann Poech, Axel Mertens, Arne Bartschat, Bernd Tegtmeier, Christian Broer, and Jan Wenske. 2019. "Exploring the Causes of Power-Converter Failure in Wind Turbines based on Comprehensive Field-Data and Damage Analysis" Energies 12, no. 4: 593. https://doi.org/10.3390/en12040593
APA StyleFischer, K., Pelka, K., Puls, S., Poech, M.-H., Mertens, A., Bartschat, A., Tegtmeier, B., Broer, C., & Wenske, J. (2019). Exploring the Causes of Power-Converter Failure in Wind Turbines based on Comprehensive Field-Data and Damage Analysis. Energies, 12(4), 593. https://doi.org/10.3390/en12040593