1. Introduction
Economic growth and environmental protection issues are often a conflicting trend, and China’s rapid economic development in recent years has resulted in significant increases of particle matters (PM
2.5 and PM
10) and undesirable gas emissions (CO
2, SO
2, O
3, etc.). The China Statistics Bulletin [
1] reported that the gross domestic product (GDP) of China grew from 673 to 827 trillion CNY per year in 2014–2017, and total energy consumption yearly rose from 425 to 449 billion tons of standard coal energy (MTSCE), while undesirable gas emissions moved downward at 57.9, 52.4, 35.0, and 29.3 million tons, respectively over the four years. Jin and Wan [
2] used the six levels of air quality from China’s Ministry Environmental Protection (MEP) (level 1: excellent (0–50), level 2: good (51–100), level 3: lightly polluted (101–150), level 4: moderately polluted (151–200), level 5: heavily polluted (201–300), and level 6: severely polluted (>300)) to explore the issue of reducing air pollution during 2013–2016 and noted the pollutants emitted by coal and oil-based heating and electricity generation are the most direct dangers to public health. Therefore, the China government is now reflecting on the resulting environmental damage and destruction after decades of GDP growth-driven decisions. The Individual Air Quality Index (IAQI) of pollutant item p is contained Cp (mass concentration), BpHi and BpLo (the air quality sub-index of the corresponding area and the high and low value of the pollutant concentration limit similar to Cp in the corresponding pollutant item concentration index table), IAQIHi and IAQILo (the air quality sub-index corresponding to BpHi and BpLo in the air quality sub-index of the corresponding area and the corresponding pollutant project concentration index table), therefore, IAQIp and AQI can be calculated by Equations (1) and (2):
The primary energy consumption of China in 2017–2018 [
3] rose from 3047 to 3132 million tons of oil equivalent (MTOE), resulting in its Environmental Performance Index (EPI) to respectively be 45.13 and 50.74 and ranking 136th and 120th in the world for 2016 and 2017. BP Energy Outlook [
4] predicted that China’s oil import dependence would increase from 63% in 2016 to 72% in 2040, with gas dependence going from 34% to 43% over the same period. China’s energy consumption (EC) in 2017 accounted for 23.2% of global energy consumption (GEC), ranking first in global energy growth for 17 consecutive years, but it has also caused carbon emissions to rise significantly. This indicates that the country’s energy policy must consider the proper balance between economic development and environmental efficiency.
The International Energy Agency [
5,
6] has warned that the continued growth of the global population number (PN) and gross capital formation (GCF) would lift energy demand in the next 20–25 years. As China’s PN rose from 1.38 to 1.39 billion people in 2016–2017, it has helped lead to the aforementioned increase in EC. In order to understand the problem of economic development and carbon emissions, Mulgan and Salem [
7] proposed the 3E concept of green economics for energy, environment, and the economy. Qckwell [
8] used policy-relevant contributions for achieving a transition to a low-carbon economy. Therefore, energy and environmental efficiencies are important issues worth studying, making it necessary to understand the relationship between economic development and environmental protection. Mardani et al. [
9] proposed the data envelopment analysis (DEA) approach to evaluate energy and environmental performances, using undesired and desired outputs at the same time.
The DEA approach is quite popular, because it can deal with multiple inputs and outputs at the same time and can discover the reasons for efficiency and inefficiency. Previous research on energy and environmental performances focus on following: (1) using traditional stochastic frontier analysis [
10]; (2) using super DEA and undesirable outputs to solve the problem of the maximum efficiency value being equal to 1 [
11,
12,
13]; (3) using network DEA and undesirable outputs to divide into energy and environmental groups [
14]; (4) using dynamic DEA to find the difference across multiple periods [
15,
16]; and (5) using two-stage dynamic network DEA to divide into air pollutants and health [
17], these show in
Table 1. However, these articles lack an analysis of the relationship between energy using efficiency and environment performance at the same period or across multiple periods.
Tone and Tsutsui [
18] proposed the dynamic network DEA (DN-DEA) approach to find overall efficiency, period efficiency, and dynamic change of divisional efficiency, as this method is very suitable for issues of energy and environmental performances. Therefore, our present study refers to previous research [
14,
16,
17,
18] and employs the DN-DEA approach on the two divisions of energy performance (D1) and environment performance (D2). We also consider the inputs and outputs of energy and economic growth factors in D1, the cross division link between D1 and D2 is used Air Quality Index (AQI) as bad link (LB), because energy can improve economic growth, and it may also affect environmental degradation. The carry-over of energy and environmental divisions are respectively GDP as a good output and undesirable emission gas (UEG) as a bad output within cross periods. The inputs, outputs, link, and carry-over are PN, energy consumption (EC), power consumption (PC), energy investment (EI), energy production (EP), power generation (PG), AQI, and GDP in the energy using division and motor vehicle number (MVN), environmental protection expenses (EPE), particulate matter (PM
10, PM
2.5), and UEG in the environmental division in China’s provincial level for the period 2014–2017. The particulate matters (PM
10, PM
2.5) are bad outputs, but this study uses the largest emissions of all decision making units (DMUs) as the base, and the adjustment value equals (maximum value of particulate matter emissions of DMUs - original emissions value of each DMU) + 1, to become good outputs. These results will help us to understand the relationship between rapid economic growth, energy policy, and environmental degradation in China’s provincial level, and under sustained economic growth conditions to provide local governments with assistance to make a careful assessment of an appropriate energy policy while actively development their regional economy. The DMUs we employ are the provinces and municipalities in China, shown in
Table 2.
2. Literature Review
IEA [
6] proposed that an energy use policy is always an important issue for environmental protection and economic development, especially as fossil energy had been widely used over the past 100 years. In recent years, environmental research groups have warned that countries’ governments must propose a more specific low-carbon energy policy to solve widespread environmental degradation problems. China is a very large emerging market and a region with high energy demand, and thus research must pay more attention to its energy using policy and environmental performance. These research divide into environmental efficiency and energy efficiency, (1) environmental efficiency: Yang et al. [
11] evaluated environmental efficiency in China with super SBM-DEA and found that Beijing and Shanghai have more efficiency, while Qinghai showed worse performance. Zhang and Choi [
12] used SBM-DEA to assess environmental energy efficiency of China’s regional economies and proposed that stricter environmental regulations can improve efficiency and encourage innovation, and that undesirable outputs have a significant effect on energy efficiency measurements. Gau et al. [
19] used the DEA approach, incorporating PM
2.5 and PM
10 as undesirable outputs, to evaluate the environmental performance and the regional differences of strictly-environmental-monitored cities in China, noting that the gap between the level of economic development and environmental protection among cities in China is large, and the scale efficiency of big cities is better than that of smaller cities. Yaser et al. [
14] analyzed the energy and CO
2 emissions efficiencies of economies with the network DEA approach, presenting that in aggregate 85% of energy consumption and 89% of CO
2 emissions are due to economic and distributive inefficiencies. They proposed that China is the largest user of excess energy due to economic inefficiency, and the U.S. is the largest user of excess energy due to distributive inefficiency. (2) energy efficiency: Xie et al. [
10] used stochastic frontier analysis DEA approach to evaluate provincial energy efficiencies in China’s transport sector and found that the transport industry’s national average energy input has a relatively large degree of non-efficiency. Li and Lin [
20] used super SBM-DEA to assess energy performance in China and found that energy intensity respectively fluctuates around 21%, 7.5%, and 12% for the eastern, central, and western regions, suggesting that China must reduce the gap for improvement in energy intensity across regions. Yu et al. [
13] used super SBM-DEA to evaluate industrial eco-efficiency of 30 Chinese provinces in the period 2001–2015 and proposed that relevant authorities must take effective measures to encourage the central and western regions to adopt clean energy technologies. Zheng et al. [
21] evaluated the energy conservation performance of energy service companies in China, finding that reconstruction of industrial boiler furnaces is the most energy-efficient measure in the manufacturing sector, while energy management systems are the most efficient measure in the building sector.
The literature has also looked at issues of cross period and/or cross divisions. Wang and Feng [
15] used the DEA approach to assess the energy, environmental, and economic performances in China in the period 2002–2011, finding that China performs well on the economic front, but its energy and environmental performances are not optimistic. Li et al. [
22] used inputs and outputs of EC, employees, government expenditure, GDP, and AQI, and assets as the carry-over to explore 31 cities in China with the dynamic SBM-DEA approach. Li et al. [
16] proposed that rapid economic growth in China has resulted in a significant increase in particulate matter (PM
2.5) and sulfur dioxide (SO
2), the reduction of which has become a primary government focus. They also found that energy consumption and air pollutant emissions in Chinese cities exhibit very significant regional characteristics. Sueyoshi [
23] used the DEA approach to evaluate dynamic environmental performance and then paid attention to Damages to Return (DTR) in the global issue of effective decision on eco-technology innovation and its influence on sustainability. Because the DEA approach can deal with multiple inputs and outputs over single or multiple periods, this study utilizes the DN-DEA approach to assess the energy efficiency and rankings in China’s provincial level. Our results obtain data that are more in line with the interaction effects between actual energy policy and environmental performance.
3. Research Method
Farrell [
24] proposed DEA approach to assess performance, and then it was developed further into the CCR and BCC models [
25,
26]. These models are unable to process undesirable outputs, but energy or environmental performance may be affected by undesirable outputs such as PM
10, PM
2.5, UEG, etc. Tone and Tsutsui thus proposed approach of dynamic and DN-SBM DEA to deal with the problems of bad linkages and carry-over [
18,
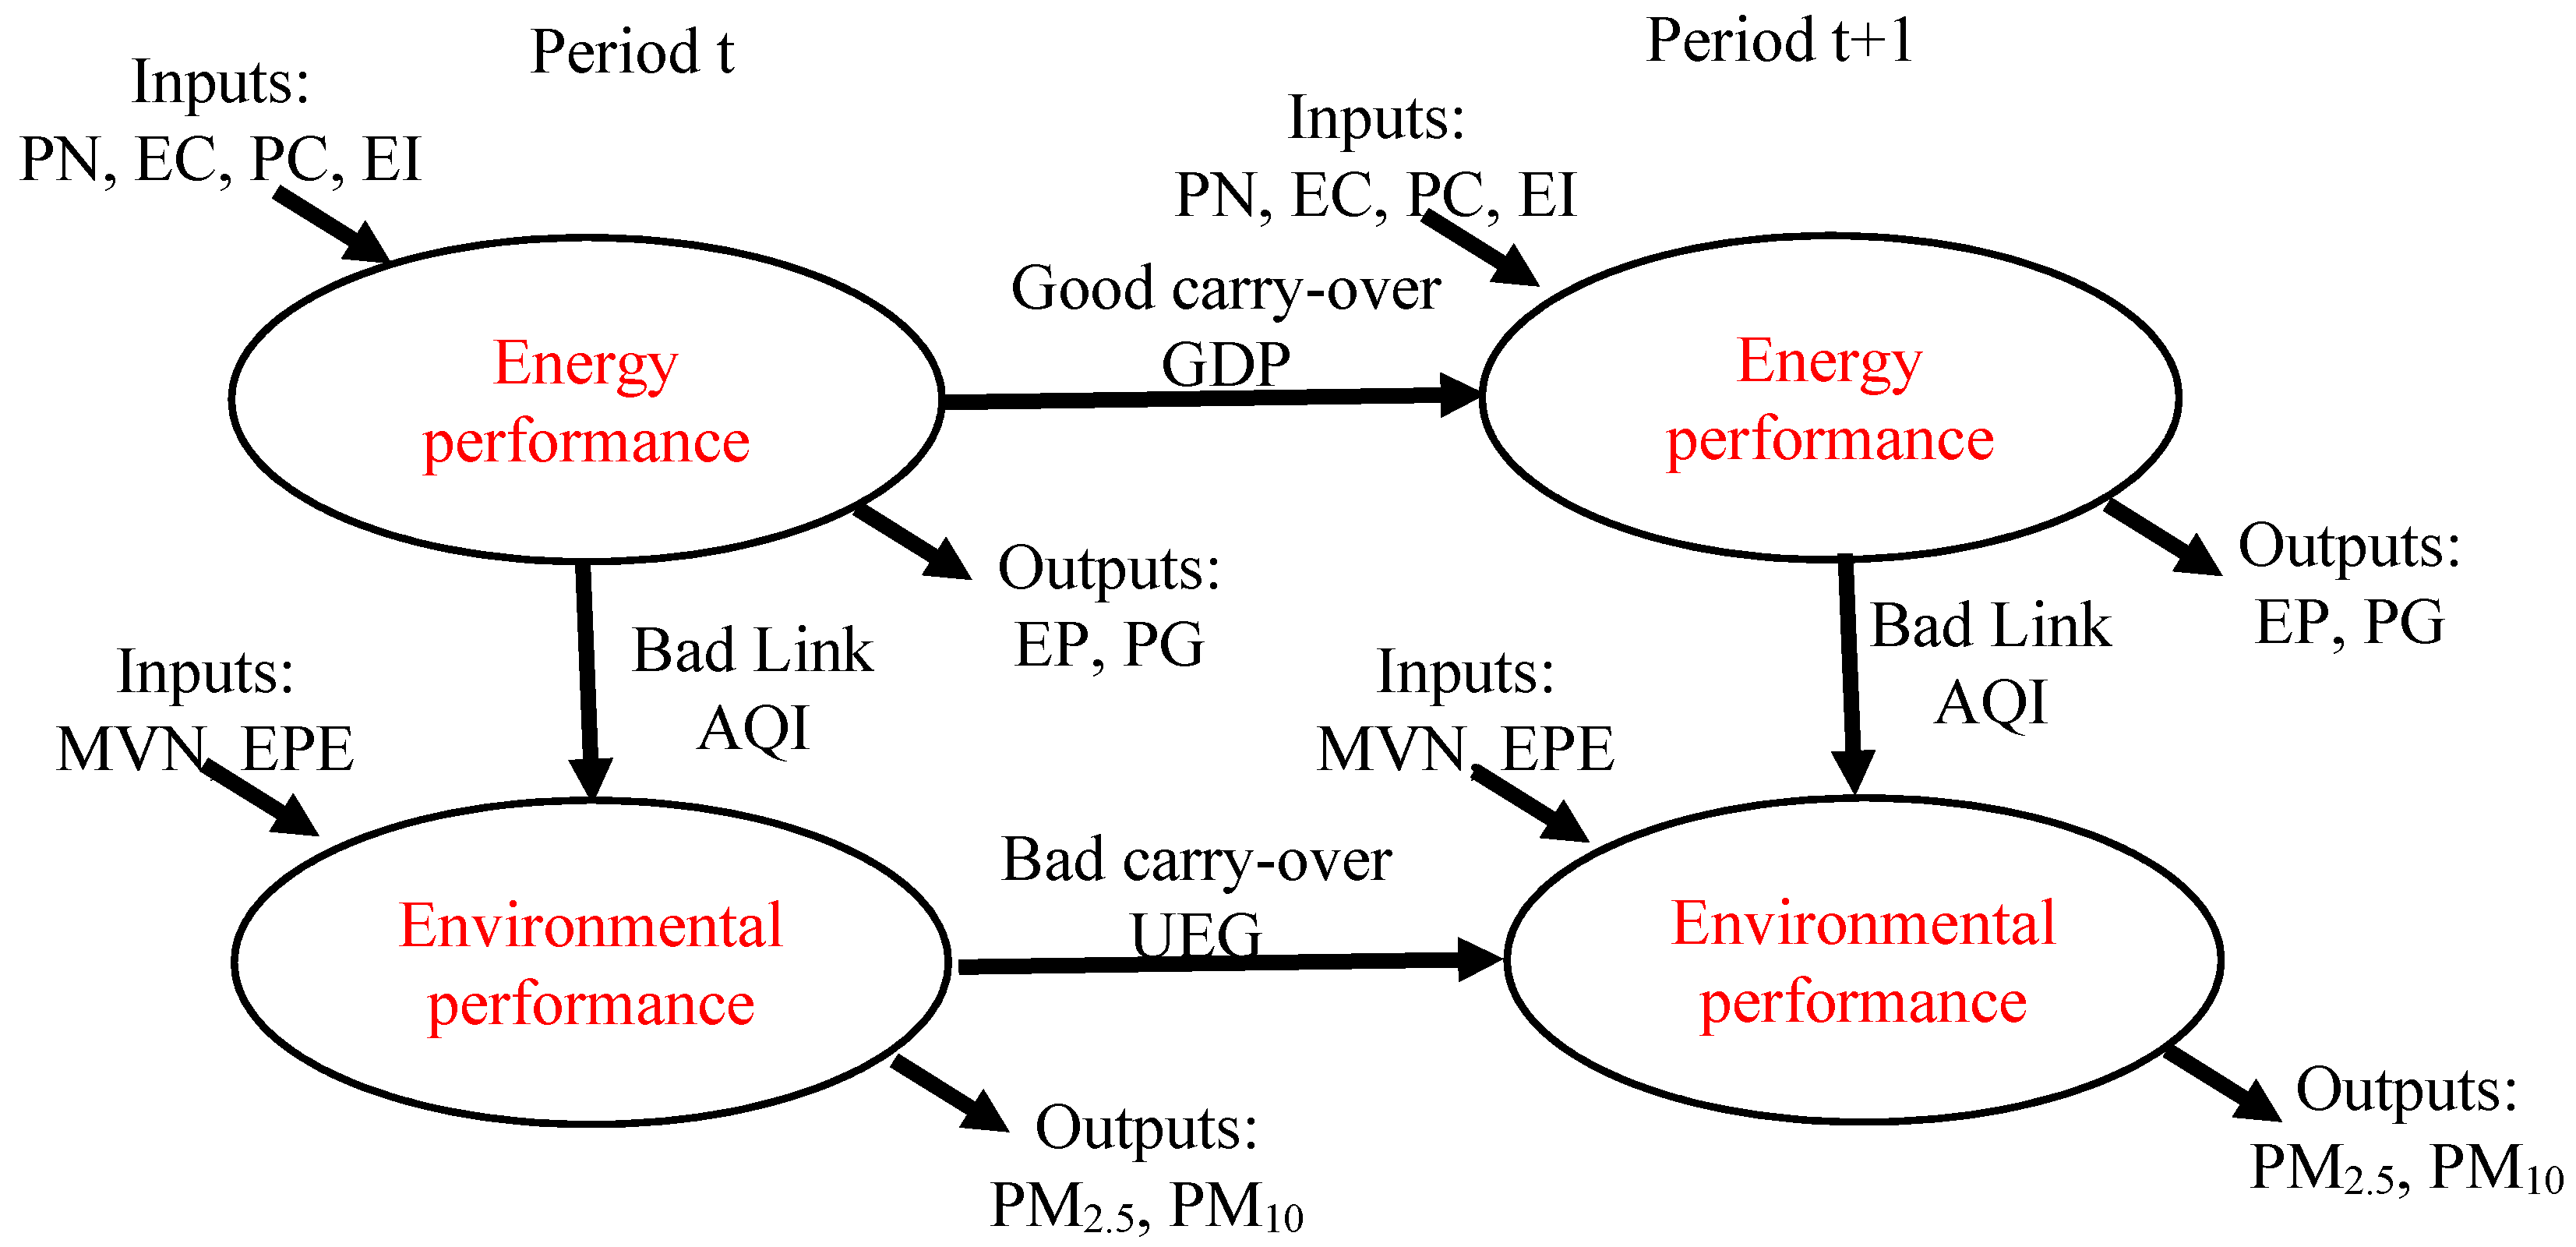
27]. Our study utilizes the DN-DEA approach to evaluate energy efficiency and environmental performance. The structure of DN-DEA herein is in
Figure 1, which we separate into two divisions: energy performance (D1) and environmental performance (D2). The inputs and outputs are PN, EC, PC, EI, EP, and PG in D1 and MVN, EPE, PM
2.5, and PM
10 in D2; AQI is the bad link in D1 and D2, GDP is a good carry-over in D1, and UEG is a bad carry-over in D2. These inputs and outputs had been justified as key variables that affect energy and environmental performance in previous research [
11,
12,
13,
14,
15,
16,
17,
19,
20,
21,
22], but these are not separated into independent and influential division concepts to explore energy and environmental efficiency, we comprehensive use dynamic and network to explore the effects of the overall energy efficiency, division efficiency and periods efficiency cross energy/environment and periods in this study. Though these input and output variables are difficult to accurately define an independent source of energy, economics or environment, it is a complex issue in rapid economic growth countries, DN-DEA approach can solve independent and influential problem in this study, energy investment and consumption create energy needs and economic growth in D1, we hope to bring good economic growth to the next year, therefore GDP is as good carry-over. The inputs of environmental protection expect to reduce undesirable outputs such as PM
10, PM
2.5 in D2, UEG may bring environmental pollution problems into the next year, it is a bad carry-over. It also produces bad air quality bad impact on the environment in D1 and links to D2, AQI is overall air quality index as a bad link from D1 to D2.
The overall efficiency, period (term) efficiency and division efficiency are calculated by Tone and Tsutsui [
18,
27]. The Malmquist productivity index (MPI) is a total factor productivity growth index for each DMU, divided into catch-up and frontier-shift effects. These values show the tendency of progress, status quo, and regress with >1, =1, and <1. They are a ratio of the efficiency of period-division between t and t + 1. The equations are the same as in Tone and Tsutsui [
18], this study does not show.
4. Empirical Result and Discussion
Effective energy policy usually is a result of positive economic development and negative environmental degradation. Previous studies mainly focused on energy density, energy consumption, net labor, fixed capital, etc. to assess energy efficiency [
10,
11,
12,
13,
14,
15,
16,
17], with a lack of comprehensive analysis of input and output variables are contained undesirable and cross division and periods for the effects of economic development and environmental performance when evaluating energy efficiency. This study sets up two divisions of energy performance (D1) and environmental performance (D2) and uses AQI as a bad link between the two divisions, GDP as a good carry-over in D1, and UEG as a bad carry-over in D2, so as to evaluate energy efficiency with the DN-DEA approach. We define these variables as follows:
- (a)
PN (unit, million people): Total population of current period in China’s provincial level; the values shown are mid-year estimates.
- (b)
EC (unit, million tons of standard coal energy, MTSCE): Total amounts of primary energy consumption in the current period, such as coal consumption, petroleum consumption, gaseous fuels consumption, etc.
- (c)
PC (unit, billion KWh): Total amount of power consumption in the current period, using non-renewable energy.
- (d)
EI (unit, billion CNY): Total investment in coal, oil, electricity, and gas in the current period.
- (e)
EP (unit, ten thousand tons of standard coal energy, TTSCE): Total electricity production in the current period, containing coal, crude oil, and natural gas.
- (f)
PG (unit, billion KWh): Total amount of power generation in the current period, using non-renewable energy.
- (g)
AQI (unit, ppm): Average AQI level for current year in China’s provincial level, equal to (overall emission amounts of all cities or counties in current year)/[(number of cities and counties) × 12]; data come from the Ministry of Environmental Protection (MEP), which monitors daily pollution levels in 163 major cities in China.
- (h)
GDP (unit, billion CNY): The monetary value of all the finished goods and services produced within a country’s borders in the current year.
- (i)
MVN (unit, ten thousand): Total number of motor vehicles in the current year.
- (j)
EPE (unit, billion CNY): Annual expenditure on environmental protection.
- (k)
PM10 (unit, ppm): Total annual value of particle matter, equal to (overall emission amounts of all cities or counties in current year)/(number of cities and counties); overall emission amounts are the sum of the monthly averages.
- (l)
PM2.5 (unit, ppm): Total annual value of fine particle matter, equal to (overall emission amounts of all cities or counties in current year)/(number of cities and counties); overall emission amounts are the sum of the monthly averages.
- (m)
UEG (unit, ppm): Total annual value of undesired emission gases that contain SO2, CO, NO2, or O3, equal to (overall emission amounts of all cities or counties in current year)/(number of cities and counties); overall emission amounts are the sum of the monthly averages.
Table 3 lists the descriptive statistics of the inputs, outputs, link, and carry-over in this study. Except for the environmental variables of AQI, PM
2.5, PM
10, and UEG, the standard deviations are greater than the minimum value, and so the environmental impact is comprehensive in China. These results indicate that environmental performance must be improved within economic development for the energy policy in China’s provincial level.
This study uses the DN-DEA approach to assess the energy efficiency of China provincial level in 2014–2017 with the results in
Table 4.
The best annual efficiency is 0.79 for 2016, and the worst is 0.59 in 2014. This study finds that energy efficiency is significantly greater than environmental efficiency in all years for 2014–2017, indicating that the energy policy creates a large amount of energy demand and consumption to achieve the country’s economic growth goals, but it has an adverse impact on the environment. BP Energy Outlook [
4] noted that China’s energy consumption has increased by 3.1% from the previous year in 2017, its renewable energy generation rose 2500 TTSCE, its nuclear power rose 800 TTSCE, its hydropower is in a downward trend, and its carbon emissions increased 1.6%. These combined results indicate that China must be more active in promoting low-carbon green energy as its energy policy.
Chongqing has the worst overall energy efficiency, because its energy efficiency and environmental performance are also poor for all years in the period 2014–2017. Guizhou exhibits energy efficiency that is less than environmental efficiency for all years in 2014–2017. The average value of overall efficiency for the provinces is 0.70 in 2014–2017, and energy performance is relatively good (>0.70), they are Beijing, Shanghai, Tianjin, Zhejiang, Hunan, Yunnan, Hebei, Henan, Gansu, Ningxia, Qinghai, Hainan, Inner Mongolia, Liaoning, Jilin, Heilongjiang and Xinjiang, etc. 17 DMUs. It is relatively poor (<0.70) that they are Chongqing, Jiangsu, Anhui, Jiangxi, Hubei, Sichuan, Fujian, Guangdong, Guangxi, Guizhou, Shangdong, Shanxi and Shaanxi, etc. 13 DMUs. These results show that energy efficiency is greatly affected by the region’s location. This study uses good and bad carry-overs to find the mutual influence relationship between the economy and the environment. This shows that the problem of environmental degradation caused by economic growth is very obvious in China’s provincial level. Most DMUs must improve their energy using policy to be better control the outputs of PM
10, PM
2.5, and UEG. Thus, a future energy policy should choose low-carbon and low-pollution energy to improve energy using efficiency in China’s provincial level. This study auxiliary uses AQI to explore the relationship with energy efficiency. The AQI values come from China’s Ministry of Environmental Protection (MEP), which monitors daily pollution levels in 163 of its major cities. The values are integrated and computed from sulfur dioxide (SO
2), nitrogen dioxide (NO
2), PM
10, PM
2.5, carbon monoxide (CO), and ozone (O
3) measured at monitoring stations throughout each city; the six level is defined the same as in Jin and Wan [
2]. In order to understand the average AQI level for the current year in China’s provincial level, this study takes AQI to be equal to (overall emission amounts of all cities or counties in current year)/[(number of cities and counties) × 12], with the results in
Table 5. We also use the value equal to 100 as the separation criterion for good (<100) or pollution (>100) level, this value refers to six levels of AQI in Jin and Wan [
2], good is excellent and good of level 1 and 2, pollution is from lightly polluted to severely polluted of level 3–6. The average values with polluted levels belong to Hebei, Beijing, Shangdong, Henan, Tianjin, and Xinjiang. This study also finds that Beijing and Tianjin have good energy efficiency and polluted level of AQI. Thus, it is necessary for them to adjust into low-carbon and low-pollution energy as their main energy policy. Shangdong has poor energy efficiency and polluted level of AQI, and thus it is necessary to its adjust overall economic development and energy policy. Hubei, Shanxi, and Shanxi are close to the polluted level of the AQI value at 96.05, 96.52, and 96.28, but have relatively poor energy performance at separately 0.3237, 0.6876, and 0.6882. They must hence adjust their overall economic development and energy policy.
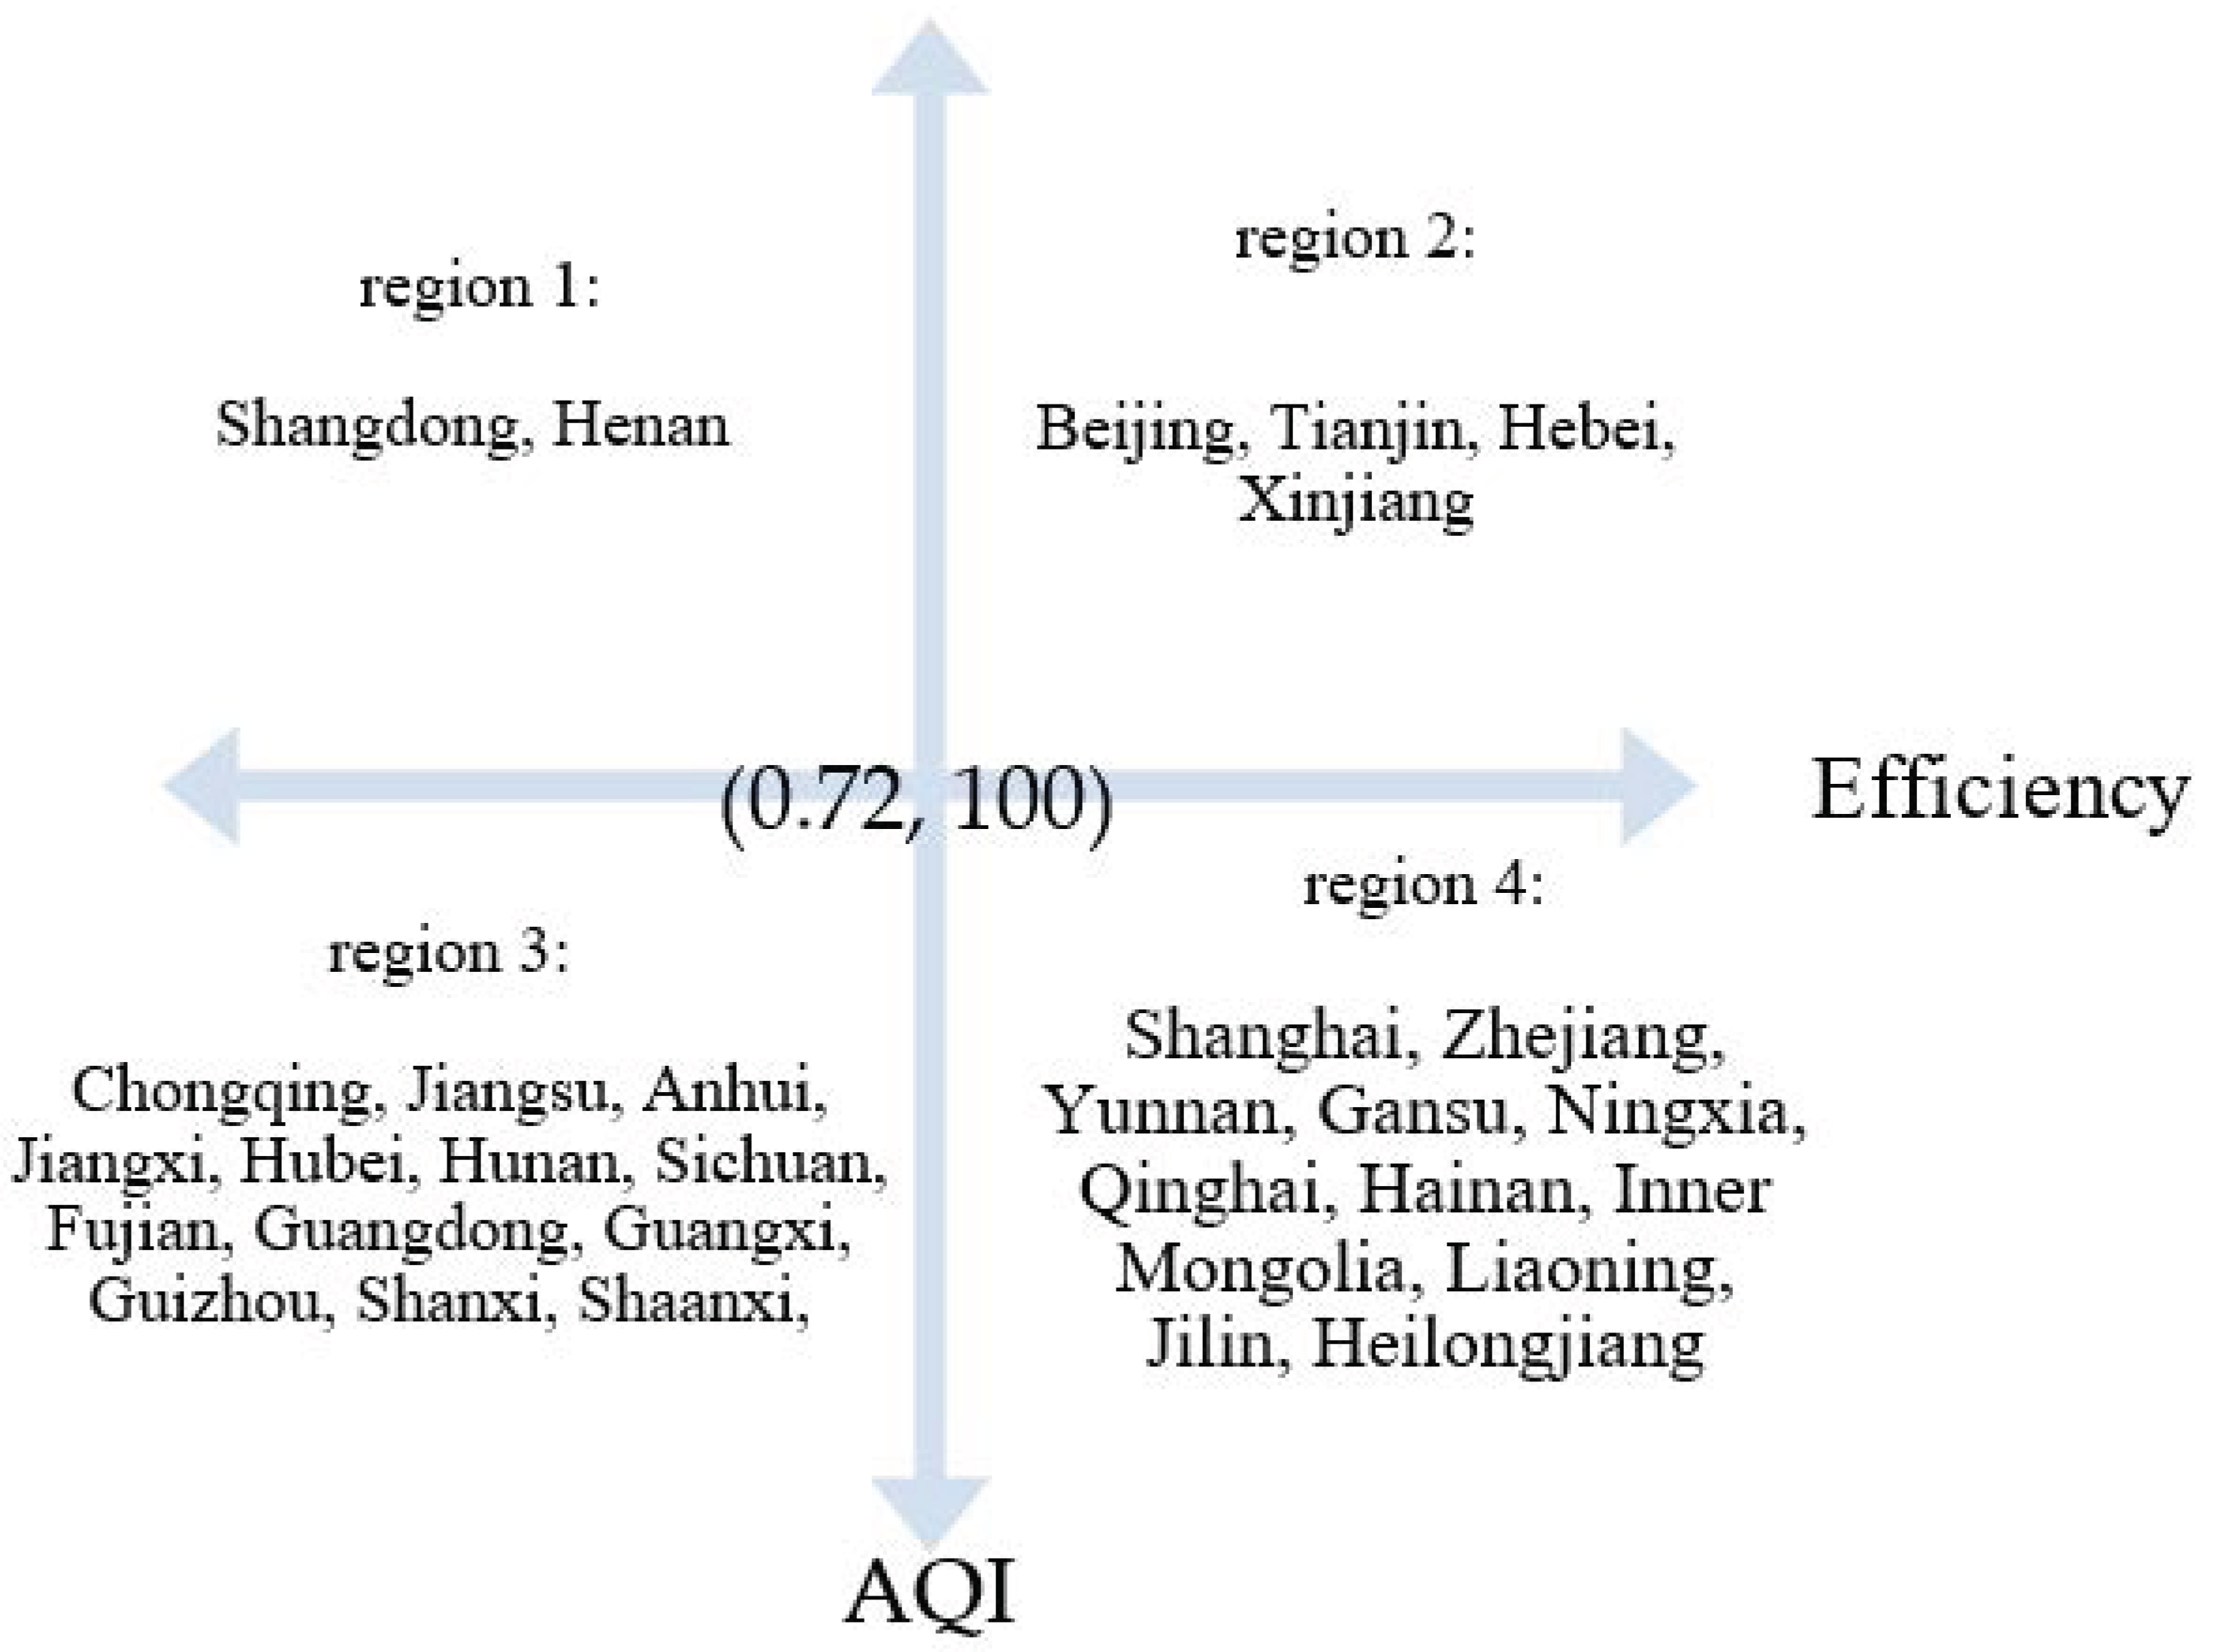
This study uses the policy-oriented matrix to show the relationship between energy efficiency and AQI level for all DMUs in
Figure 2. The center point of the coordinate axis is AQI = 100 and energy efficiency = 0.72 (median). Region4 belongs to the high energy efficiency and good AQI level groups. These DMUs must continuously control the balance between economic development and energy using a policy that maintains good economic and energy performance. These DMUs are Shanghai, Zhejiang, Yunnan, Gansu, Ningxia, Qinghai, Hainan, Inner Mongolia, Heilongjiang, Liaoning, and Jilin. Region3 belongs to the poor energy efficiency and good AQI level groups. These DMUs must promote an economic development policy under the current good AQI level. The DMUs are Chongqing, Jiangsu, Anhui, Jiangxi, Hubei, Hunan, Sichuan, Fujian, Guangxi, Guangdong, Guizhou, Shanxi, and Shaanxi. Region2 belongs to the good energy efficiency and higher polluted level groups. These DMUs must gear their energy using policy toward low carbon and low pollution and to decrease their AQI. The DMUs are Beijing, Tianjin, Hebei, and Xinjiang. Region1 belongs to the poor energy efficiency and higher polluted level groups. These DMUs must employ a two-pronged approach to improve economic development and energy using policy for better economic and energy performance. These DMUs are Shangdong and Henan. Economic development and energy using policy are not completely conflicting issues. A local or city government can choose to set up a low-carbon or low-pollution energy policy and still maintain economic growth. This is an important reference indicator for China’s provincial level.
This study uses the Malmquist productivity index (MPI) to find the trends of progress, status quo, and regress across time period, with the results shown in
Table 6. We find that the overall MPI exhibits a progress trend, but energy efficiency and environmental performance have regress trends for 2016–2017. Thus, a more stable and sustainable energy policy must be developed in China’s provincial level.
This study mainly focuses on the relationship between energy policy and economic and environmental performance, by utilizing the Wilcoxon test to check the variables of GDP, EC, AQI, and UEG, the results show in
Table 7. The Higher of classification is indicated that the group of their values are larger than average value of overall, The Others is called the group of their values are less than average value, these results are a significant difference GDP, AQI and UEG,
p-value < 0.01 **, indicate that these are a big impact between economic growth and environmental issues in China’s provincial level within 2014–2017. Therefore, a future energy policy should gradually use regeneration and green energy, so as to reduce the impact of environmental degradation from China’s healthy economic growth.
5. Conclusions and Policy Implications
Energy efficiency is related to economic development, energy using policy, and environmental performance. Thus, this study comprehensively considers these factors under dynamic network data envelopment analysis (DN-DEA). The first stage is energy and economic performance (D1), and the second stage is environmental performance (D2). Because energy is used in large quantities to create economic growth that may result in a deterioration of air quality, we use Air Quality Index (AQI) as a bad link from D1 to D2 in this study. The carry-overs of D1 and D2 are respectively gross domestic product (GDP) in D1 and undesirable emission gas (UEG) in D2 from period t to t + 1. We then utilize an interval figure to analyze the relationship between energy efficiency and environmental performance in China’s provincial level for the period 2014–2017. This study finds energy efficiency is greater than environmental efficiency for each year in 2014–2017. The DMUs with relatively poor energy efficiency are mainly due to emission of suspended particle matter (PM
2.5 and PM
10), AQI, and UEG. Therefore, the key factor of energy using policy is how to decrease the negative influence factor of environmental pollution. From the results combining the relationship between energy using policy and environment performance with DEA and AQI, we can see that energy policy and environmental performance have a very close relationship in China’s provincial level for our period of study, 2014–2017. The results of energy efficiency show in
Table 8.
We therefore suggest that China adjust its future energy using policy to utilize low-carbon or low-pollution energy. At the local provincial level, Beijing, Tianjin, Jiangsu, Zhejiang, Hubei, Hebei, Shangdong, Henan, Shanxi, Shaanxi, and Xinjiang must continuously control their balance between economic development and energy using policy to maintain good economic and energy performance. Shanghai, Zhejiang, Yunnan, Gansu, Ningxia, Qinghai, Hainan, Inner Mongolia, Liaoning, Jilin, and Heilongjiang must promote an economic development policy under an energy using policy of low pollution. Chongqing, Jiangsu, Anhui, Jiangxi, Hubei, Hunan, Sichuan, Fujian, Guangdong, Guangxi, Guizhou, Shanxi, and Shaanxi must improve energy using policy toward low carbon and low pollution and decrease their AQI. Henan and Shangdong must carefully review their energy using polices to maintain economic development while decreasing AQI. This study tries to divide into energy and environmental performance divisions, and to explore the effects of the interaction between energy and environmental efficiency from a single and integrated point, this is harder to describe in detail in all variables, we hope that there will be more audit data assistance in the future research related topics, and more favorable energy efficiency analysis data.


