Article

Equivalent Circuit Model Construction and Dynamic Flow Optimization Based on Zinc–Nickel Single-Flow Battery

1
School of Energy and Power Engineering, Jiangsu University of Science and Technology, Zhengjiang 212000, China
2
Zhangjiagang Zhidian Fanghua Storage Research Institute, Zhangjiagang 215600, China
*
Author to whom correspondence should be addressed.
Energies 2019, 12(4), 582; https://doi.org/10.3390/en12040582
Submission received: 15 January 2019 / Revised: 11 February 2019 / Accepted: 11 February 2019 / Published: 13 February 2019
(This article belongs to the Special Issue Energy Storage and Management for Electric Vehicles)

Abstract

:
Based on the zinc–nickel single-flow battery, a generalized electrical simulation model considering the effects of flow rate, self-discharge, and pump power loss is proposed. The results compared with the experiment show that the simulation results considering the effect of self-discharge are closer to the experimental values, and the error range of voltage estimation during charging and discharging is between 0% and 3.85%. In addition, under the rated electrolyte flow rate and different charge–discharge currents, the estimation of Coulomb efficiency by the simulation model is in good agreement with the experimental values. Electrolyte flow rate is one of the parameters that have a great influence on system performance. Designing a suitable flow controller is an effective means to improve system performance. In this paper, the genetic algorithm and the theoretical minimum flow multiplied by different flow factors are used to optimize the variable electrolyte flow rate under dynamic SOC (state of charge). The comparative analysis results show that the flow factor optimization method is a simple means under constant charge–discharge power, while genetic algorithm has better performance in optimizing flow rate under varying (dis-)charge power and state of charge condition in practical engineering.

1. Introduction

The shortage of primary energy and environmental problems have led to increased development of renewable energy in all countries of the world. However, renewable energy has the characteristics of discontinuity, instability, and uncontrollability. Large-scale integration of renewable energy into power grids will bring serious impact on the safe and stable operation of power grids, resulting in a large number of abandoned light and wind [1]. Large-scale energy storage technology is one of the effective methods to solve this problem [2,3,4]. Among them, the liquid flow battery has attracted wide attention in the home and abroad because of its independent capacity, flexible location, safety, and reliability. In view of the problems of ion cross-contamination and high cost of ion exchange membrane in traditional dual-flow batteries, Professor Pletcher of Cape Town University had proposed single-flow lead–acid batteries [5,6,7,8] in 2004. Due to the obvious advantages of single-flow batteries over dual-flow batteries, different series of single-flow batteries have been developed at home and abroad, such as zinc–nickel single-flow batteries [9], lead dioxide/copper single-flow batteries [10], and quinone/cadmium [11] single-flow batteries. Among them, zinc–nickel single-flow batteries have attracted wide attention due to their long life, high energy efficiency, safety, and environmental protection [9]. In recent years, the research and development of zinc–nickel single-flow batteries have been mainly based on experiments, including the selection and testing of key materials [12,13,14], electrolyte composition addition [15,16,17,18], and flow structure design [19,20,21,22] to improve the performance of zinc–nickel single-flow batteries and promote large-scale zinc–nickel single-flow battery systems (ZNBs) to form an energy storage system for engineering applications [23].
Establishing a general electrical model that can accurately reflect the external characteristics of the stack is the premise of predicting and analyzing the parameters of ZNBs energy storage system and optimizing its operation, and then building an efficient battery stack management system. At present, there are few studies on the electrical model construction of zinc–nickel single-flow battery stacks, and the development of more complete vanadium redox flow batteries can be referred to. Barote et al. [24,25] and Chahwan et al. [26] proposed the basic equivalent circuit model of the vanadium redox flow battery. The model used a controlled current source and a fixed resistance to represent parasitic loss, reaction resistance, and electrode capacitance, and a voltage source to represent stack voltage. However, their models do not take into account the dynamic characteristics of batteries and lack of experimental verification. Recently, Ankur et al. [27] aimed to make vanadium redox flow batteries further oriented to renewable energy sources, and built an equivalent circuit model of vanadium redox flow batteries considering electrolyte flow rate, pump loss, and self-discharge. Accurate estimation of battery stack terminal voltage and dynamic SOC was achieved, and the optimal range of variable electrolyte flow under dynamic SOC was investigated, which provided support for the design of flow controller. On the basis of the above, reference [28] further estimated the parameters of the internal electrical components of the equivalent circuit of the vanadium redox flow battery under different electrolyte flow rates, charge–discharge current densities, and charge states, and coupled the obtained parameters with the simulation model. The comparison with the experimental results showed that the accuracy of the model has been significantly improved. For the zinc–nickel single-flow battery stack studied in this paper, Yao Shou-guang et al. [29,30], based on the working principle of zinc–nickel single-flow batteries, built the PNGV (the Partnership for a New Generation Vehicles) equivalent circuit model, and further obtained the PNGV model parameters by parameter identification based on the experimental data of the pulse discharge of the battery at 100 A. Then, the high-order polynomial and exponential function fitting method was used to obtain the analytical formula of each model parameter. Xiao M. et al. [31] proposed an improved Thevenin equivalent circuit model of the zinc–nickel single-flow battery, based on the principle of parameter identification and the least-squares curve-fitting method to obtain the parameters of the improved model, and then the discrete mathematical model of each parameter in the improved model was obtained by discretization. However, the above equivalent circuit model established for the zinc–nickel single-flow battery does not consider the effects of self-discharge, electrolyte flow, and pump loss.
Based on the preliminary work, a general electrical model considering the factor of flow rate, self-discharge, and pump loss which can accurately reflect the external characteristics of the stack is proposed in the paper. In addition to this, another significant contribution of this paper is to use flow factor multiplied by the theoretical minimum flow and genetic algorithm to determine an optimal flow rate for minimum loss in the ZNBs system, considering both the internal power loss and pump power loss. Such a comprehensive modeling of zinc–nickel single-flow batteries has not been reported in the literature available at home and abroad. The general electrical model is simulated in MATLAB/Simulink and is verified by a zinc–nickel single-flow battery stack composed of 23 single batteries in parallel. The simulation model can support the design of efficient battery management systems for large-scale ZNBs energy storage system.

2. Equivalent Circuit Model

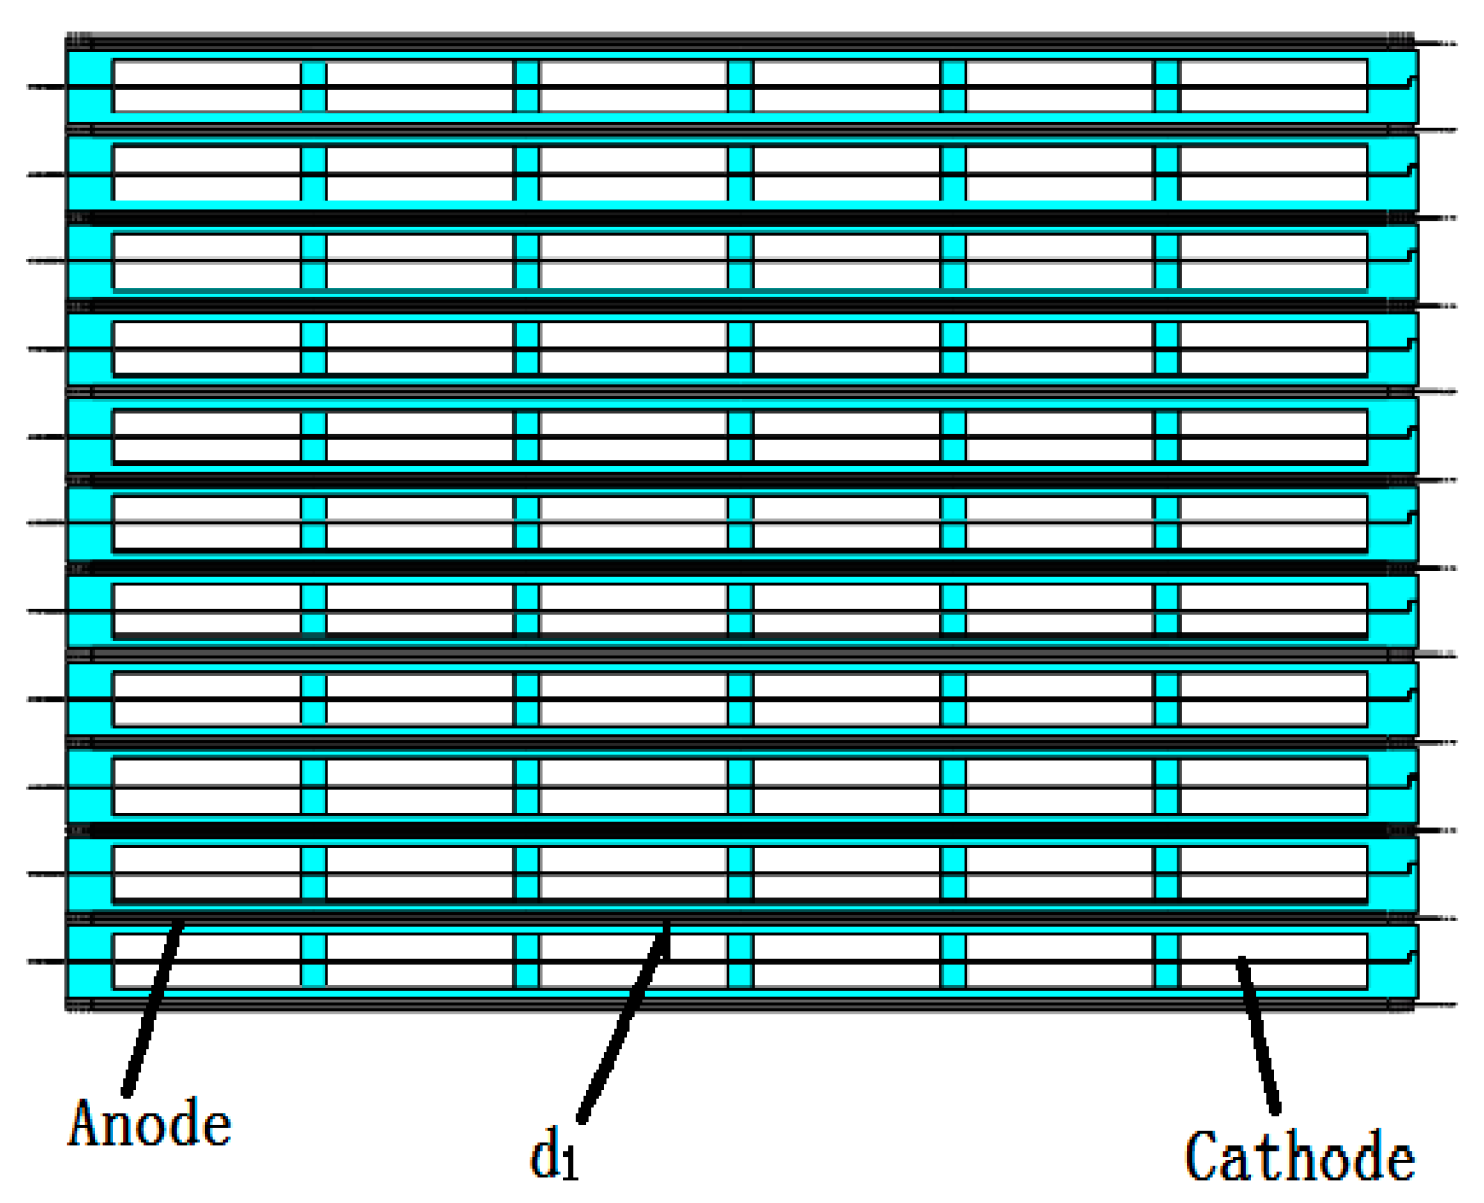
The positive electrode of the zinc–nickel single-flow battery adopts a nickel oxide electrode used in a secondary battery; the negative electrode is an inert metal current collector (nickel-plated steel strip), and 10 mol/L KOH + 5 g/L LiOH + 0.5 mol/L ZnO solution is used as the base electrolyte. The positive electrode reaction is completed in the porous nickel positive electrode, and the negative electrode reaction is a surface deposition/dissolution reaction. Figure 1 is a schematic diagram of the basic structure of a zinc–nickel single-flow battery stack (300 Ah), which comprises 23 parallel cells, and the electrolyte is driven by a pump to flow through the stack from the bottom during the charge and discharge cycle. Figure 2 is a schematic structural view of a partially parallel single cell, and d1 is an interval between the positive and negative electrodes. The specific structural parameters of the model are shown in Table 1.
The active substance in the nickel oxide electrode undergoes a chemical reaction during charge and discharge. The charge–discharge reaction process is as shown in Equation (1). The zinc negative electrode is accompanied by deposition and dissolution during charge and discharge. The charge–discharge reaction process is as shown in Equation (2). The total reaction in the zinc–nickel single-flow battery is shown in Equation (3).
2 NiOOH + 2 H 2 O + 2 e 2 Ni ( OH ) 2 + 2 OH    E 0 = 0.49   V
Zn + 4 OH Zn ( OH ) 4 2 + 2 e      E 0 = 1.215   V
2 NiOOH + 2 H 2 O + Zn 2 Ni ( OH ) 2 + Zn ( OH ) 2    E 0 = 1.705   V
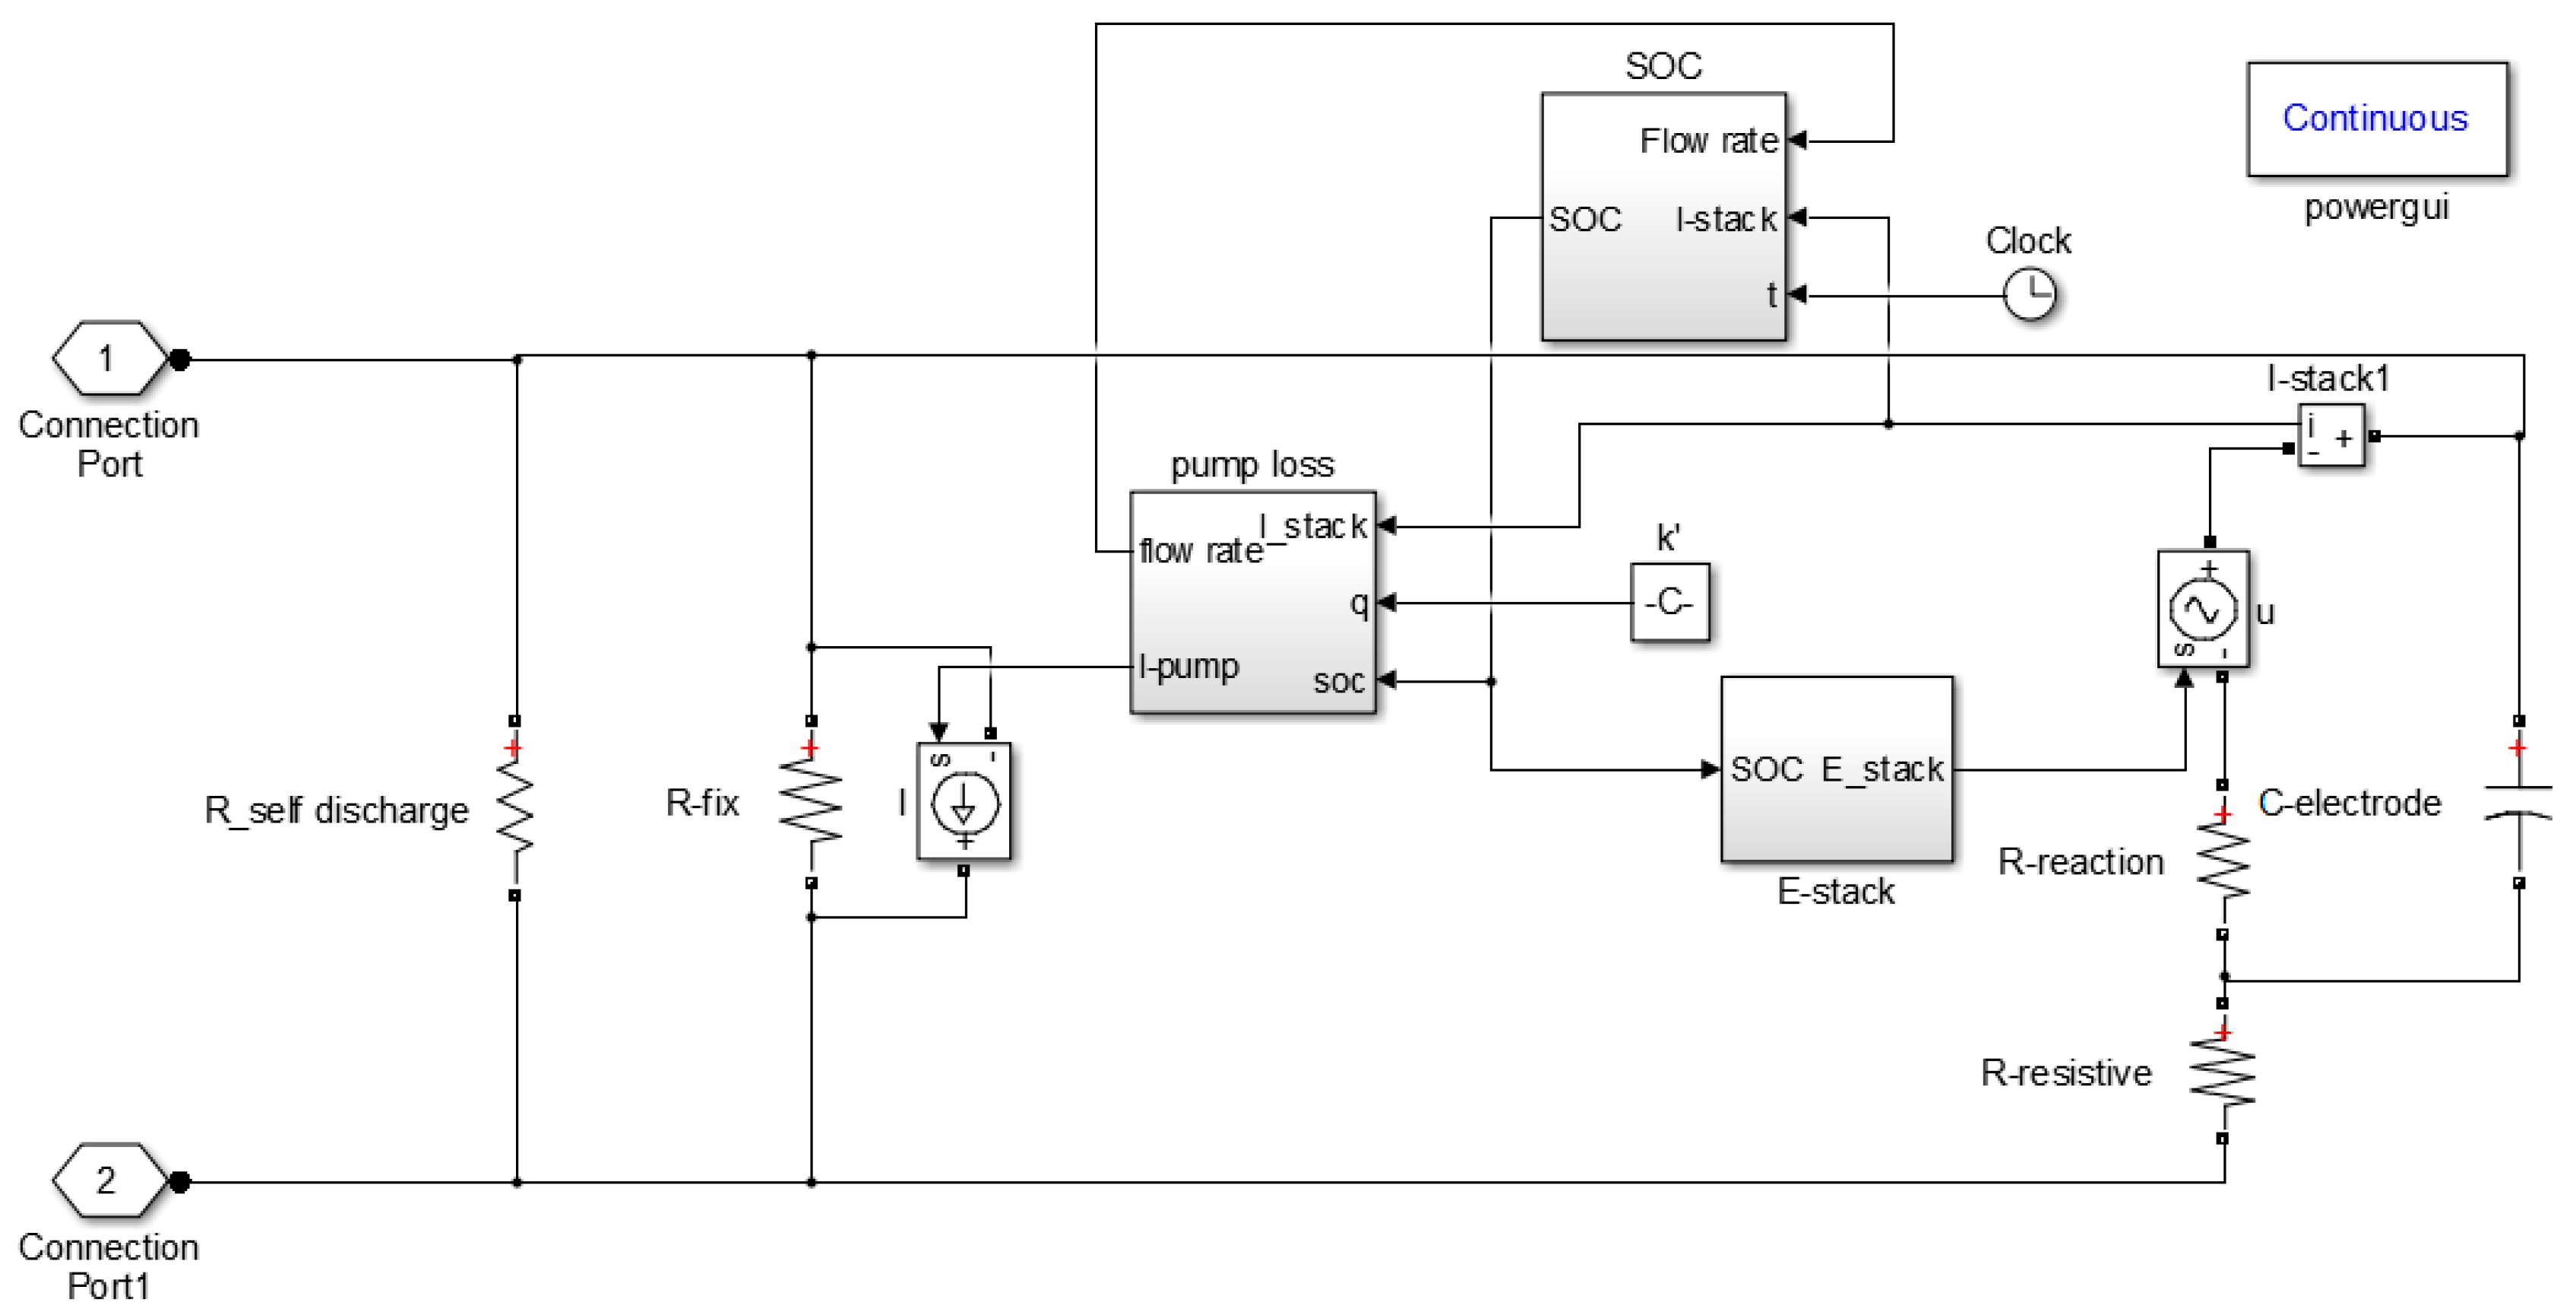
Taking the above-mentioned zinc–nickel single-flow battery stack (300 Ah) as the research object, the equivalent circuit model considering the flow rate, pump power loss, and self-discharge is built. The final general electrical model of the zinc–nickel single-flow battery stack is shown in Figure 3. The following Section 2.1, Section 2.2, Section 2.3, Section 2.4 and Section 2.5 elaborate on each module of the general electrical simulation model of the zinc–nickel single-flow battery.

2.1. Internal Loss

Experimental tests show that the system efficiency of the zinc–nickel single-flow battery stack (300 Ah) is about 69% when the charge–discharge current is 100 A, and the remaining 31% is internal loss. The actual power inside the stack can be calculated by Equation (4). The internal loss of the stack can be divided into ohmic loss and polarization loss. The effect on the stack can be reflected in the equivalent circuit model as ohmic loss resistance ( R resistive ) and polarization loss resistance ( R reaction ), which can be calculated by Equation (4) [32].
P stack = P rate η system
R = K P stack I max 2
In Equation (4), P rate is rated power and η system is system efficiency. In Equation (5), K is power loss coefficient, I max is the maximum charge–discharge current of the battery stack, and R is the internal loss resistance (ohmic loss resistance or polarization loss resistance). Equivalent circuit model parameters are calculated under very bad conditions [32], that is, when the charge–discharge current is the maximum current and SOC is 0.2. This paper is based on the function expression of the ohmic loss resistance ( R resistive ) and the polarization loss resistance ( R reaction ) of the zinc–nickel single-flow battery stack (300 Ah) proposed in reference [29]. When the SOC is 0.2, the values of R resistive and R reaction are respectively 0.623 mΩ and 0.2504 mΩ, and then the ohmic loss coefficient ( K resistive ) and polarization loss coefficient ( K reaction ) are calculated by Equation (5) to be 10.8% and 4.35%, respectively, and the parasitic loss is about 15.85% of the total loss.

2.2. Pump Loss Model

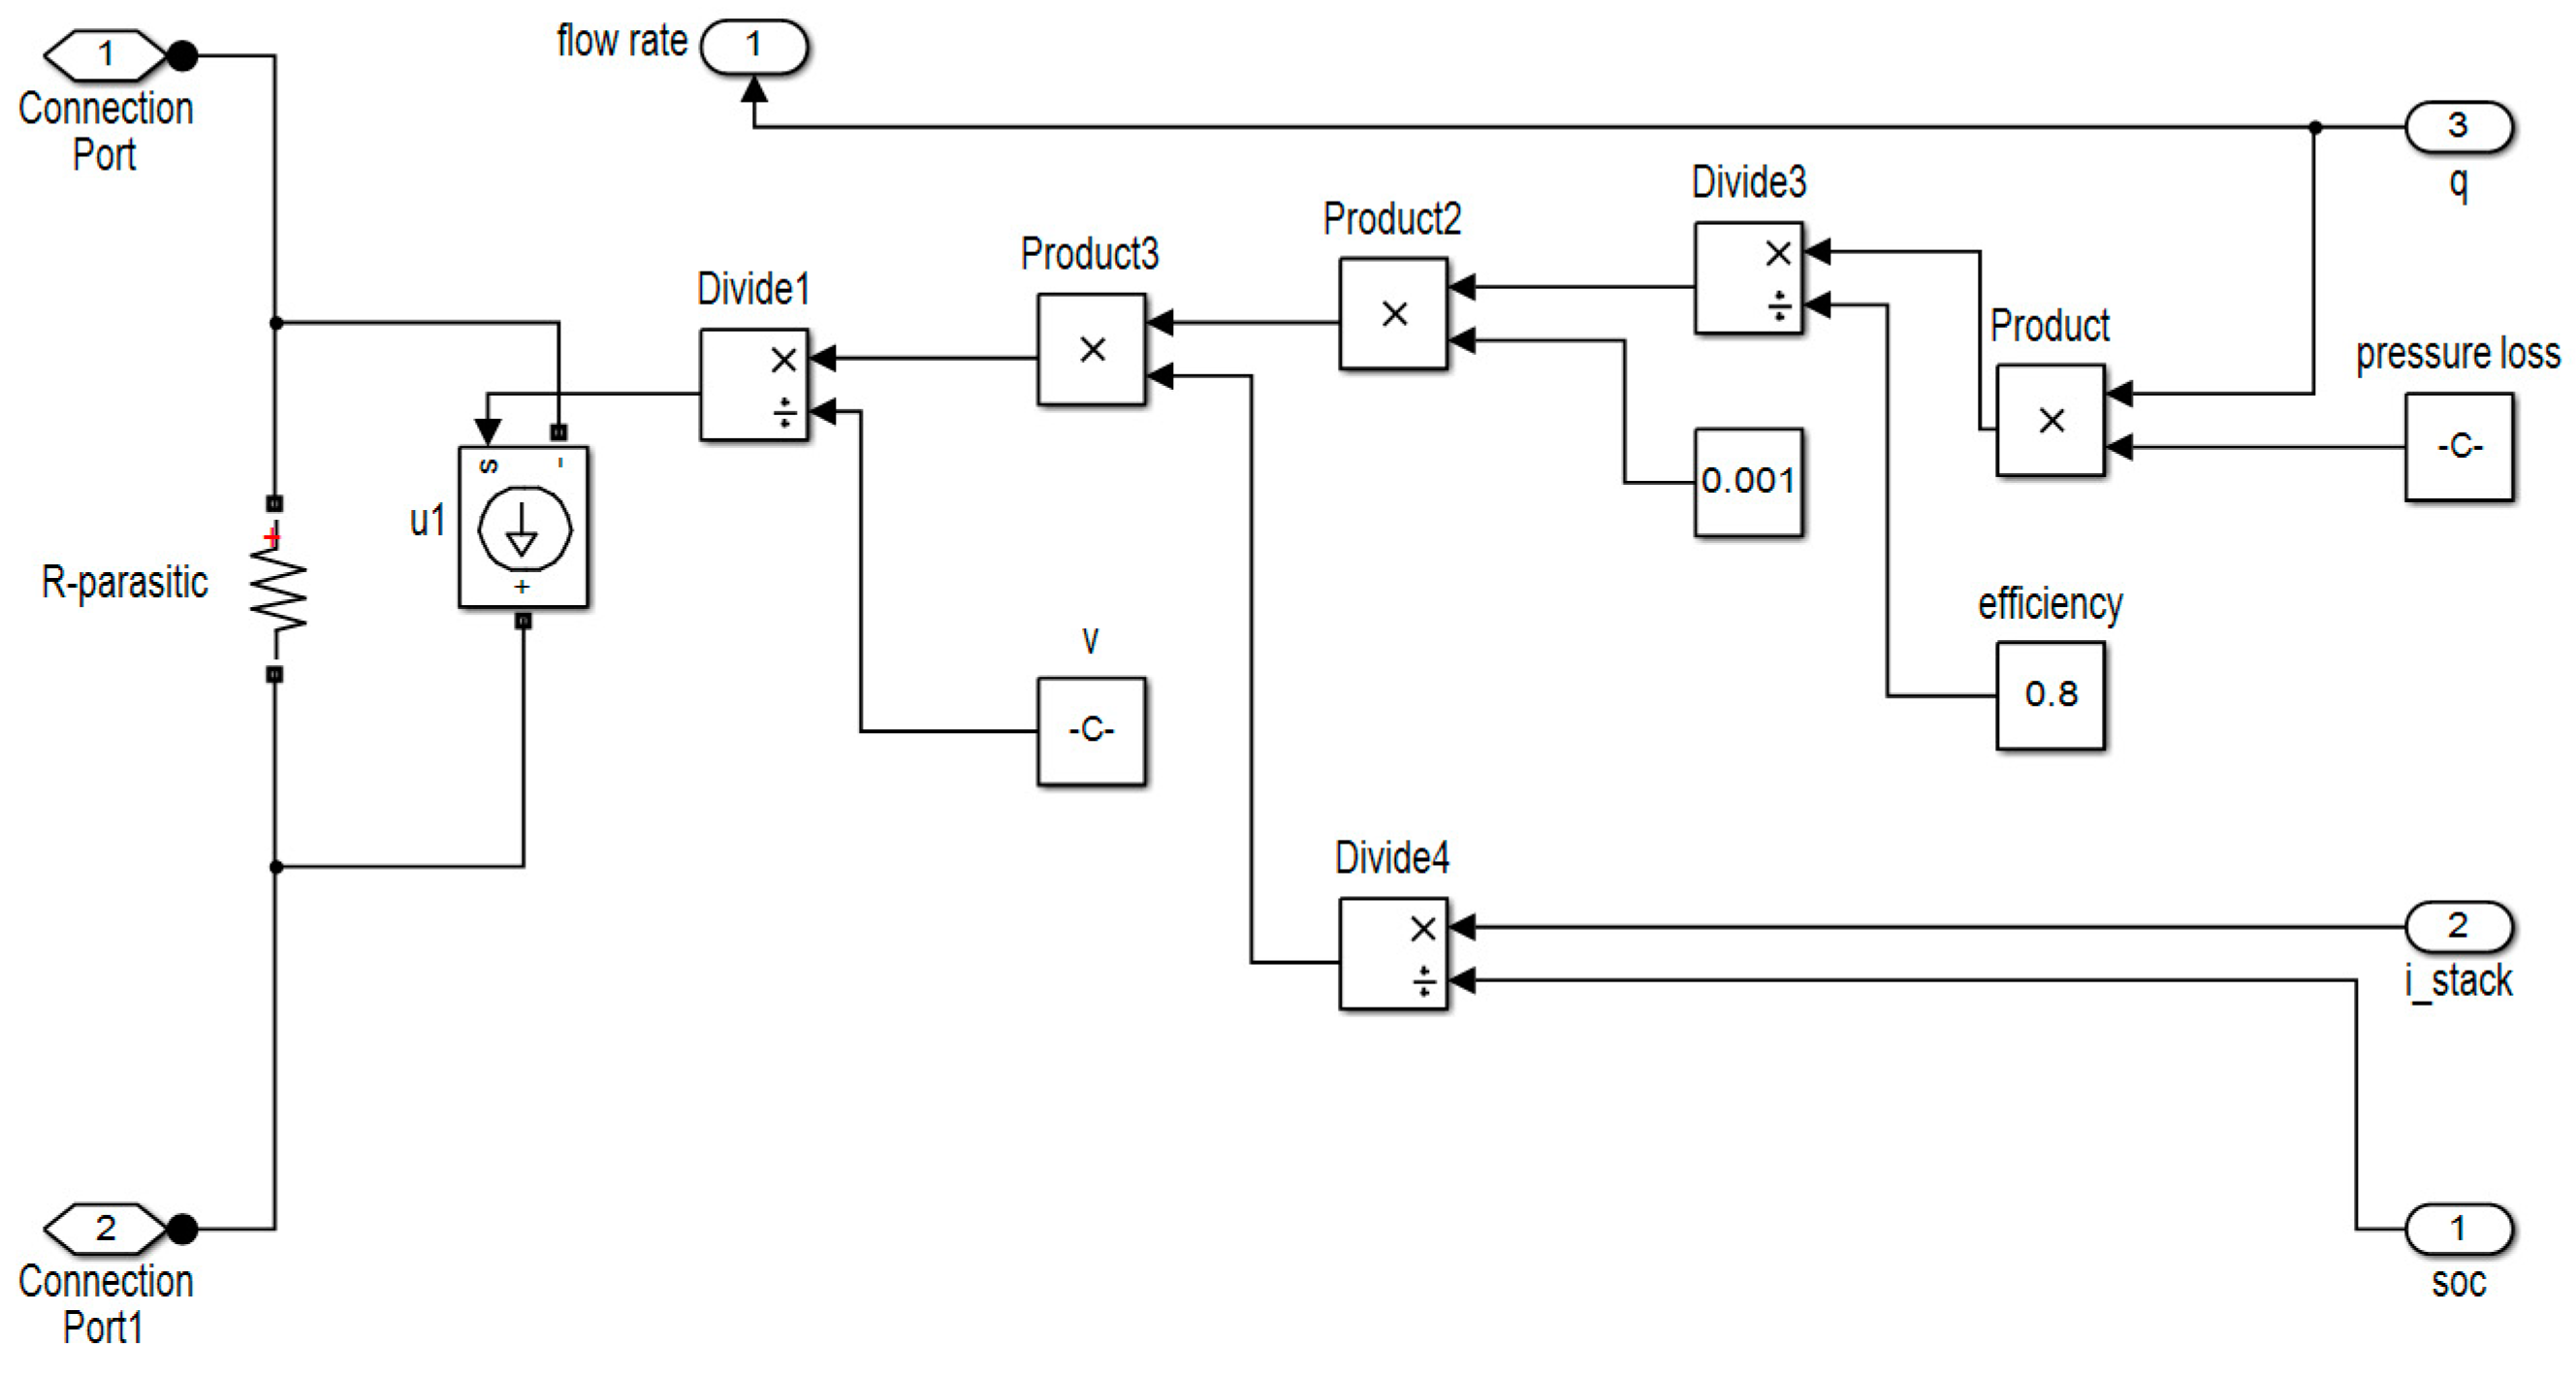
The pump loss model of the zinc–nickel single-flow battery is shown in Figure 4. The pump loss is characterized by fixed loss ( R fix ) and pump current loss ( I pump ). Fixed loss resistance ( R fix ) is calculated by Equation (6), in which U min is the minimum voltage of the stack and P fix is the fixed loss power, which is experimentally measured to account for about 2% of P stack .
R fix = U min 2 P fix
The function relationship between pump loss current ( I pump ) and pump power ( P mech ) in the electrical model is shown in Equation (7). The pump loss coefficient ( M ) is related to pump loss power. Definition of M see Equation (8).
I pump = P mech _ loss U stack = M · ( I stack SOC ) U stack
M = P mech · SOC worse I max
The mechanical loss ( P mech _ loss ) includes two parts: the mechanical loss ( P pipe _ loss ) caused by the electrolyte flowing through the pipeline connecting the stack and the external storage tank, and the mechanical loss ( P stack _ loss ) caused by the electrolyte flowing through the stack. The total loss ( P mech _ loss ) is shown in Equation (9).
P mech _ loss = P stack _ loss + P pipe _ loss
When the electrolyte of the zinc–nickel single-flow battery flows through pipes, valves, and liquid storage tanks, it will cause a certain pressure drop, which is collectively called pipeline pressure drop. The pressure drop equation of the pipeline can be obtained by the Bernoulli equation, which is related to electrolyte flow rate, loss along the pipeline, local loss, and height difference between inlet and outlet of the pipeline. Pipeline pressure drop and mechanical loss can be expressed as Equations (10) and (11). The pressure drop of the tube outside the stack is estimated to be about 65.5 kPa.
Δ P pipe = γ ( Δ V s 2 2 g + Δ Z + h f + h m )
P pipe = Δ P pipe × Q
The pressure drop in the stack is determined by the flow rate of the electrolyte and the resistance of the electrolyte, so the expressions of pressure drop and mechanical loss in the stack are as follows:
Δ P stack = Q × R ˜
P stack = Δ P stack × Q
In Equation (12), R ˜ is the hydraulic resistance of the stack, and its value can be seen in the previous research work of our group [33]. The formula for calculating P stack is shown in Equation (13).Considering the pump efficiency, the total mechanical loss of the battery system can be defined as Equation (14).
P mech _ loss = P pipe _ loss + P s t a c k _ l o s s η p u m p

2.3. Self-Discharge Loss

The self-discharge of the zinc–nickel single-flow battery is mainly caused by the negative reaction of the negative electrode, which forms a microprimary battery on the surface of the negative electrode, which has a significant influence on the attenuation of the battery capacity. In this paper, the self-discharge effect is equivalent to the loss resistance ( R self ) in the equivalent circuit model. The calculation formula is shown in Equation (15), where P self is the power loss caused by self-discharge, and its expression is given by Equation (16). For the self-discharge power loss coefficient ( f ), the calculation formula is shown in Equation (17), where U 1 and U 2 are the changes of battery voltage with time in the charge–discharge process without considering self-discharge effect and considering self-discharge effect, respectively.
R self = U min 2 P self
P self = f · P stack
f = t 1 t 2 U 1 I 1 dt t 1 t 2 U 2 I 2 dt t 1 t 2 U 1 I 1 dt

2.4. Voltage Estimation Model

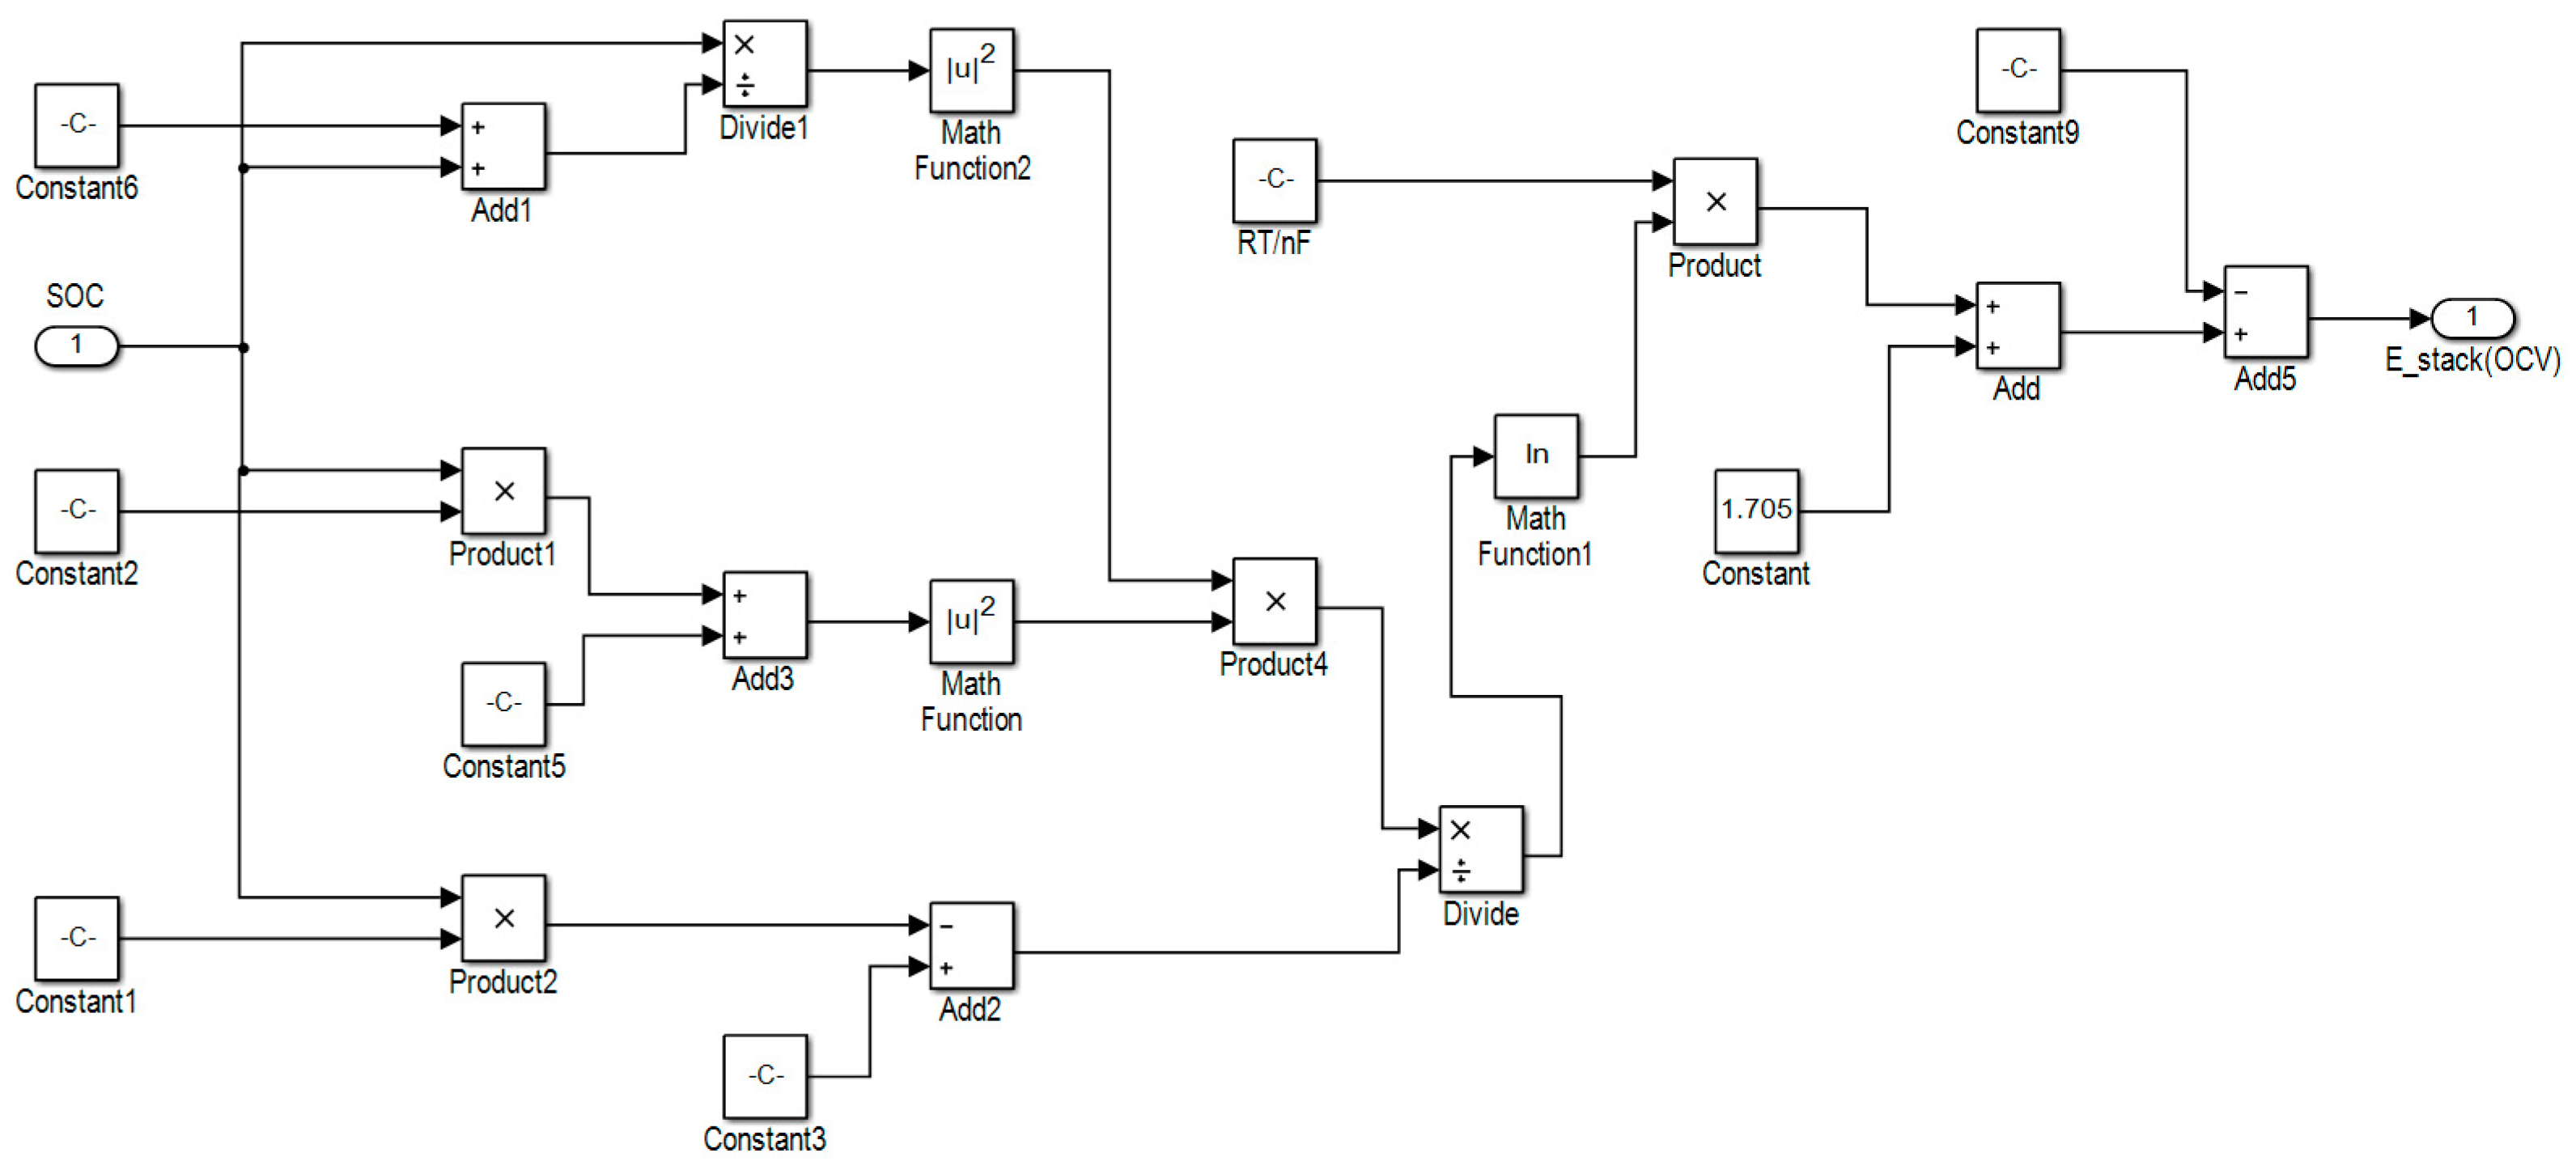
The voltage estimation module of the zinc–nickel single-flow battery stack is shown in Figure 5. The ion activity should be used when calculating the battery electromotive force using the Nernst equation. When the ionic strength is not large, and the valence state of the oxides and the reductants is not high, the battery electromotive force can be directly calculated by using the ion concentration. In the zinc–nickel single-liquid battery, the valence states of the hydroxide ion and zincate ion are −1 and −2, respectively. The active material nickel oxide of the positive electrode is not present in the battery in the form of ions, and its ion activity cannot be further measured. Only the proton concentration of hydrogen can be used to indicate the content of nickel hydroxide. Whether it is theoretical analysis or comparison with experimental results, it is shown that the error caused by the calculation of the voltage of the stack using the ion concentration is small and within an acceptable range. The potentials of the positive and negative electrodes are as follows:
Positive   electrode   potential :   E + = E + 0 + RT nF ln ( C NiOOH C Ni ( OH ) 2 · C O H ) 2
Negative   electrode   potential :   E = E 0 + RT nF ln ( C Zn ( OH ) 4 2 C O H 4 )
E + is the positive equilibrium potential, E is the negative equilibrium potential, T is the ambient temperature, and n is the electron transfer number in the electrode reaction. The concentration of positive active substance can be replaced by H proton concentration. Equation (18) can be rewritten as follows:
Positive   electrode   potential :   E + = E + 0 + RT nF ln ( C max H C H C H · C O H ) 2
The battery stack potential is as follows:
E stack = E 0 + RT F ln ( C max H C H C H × C O H C Zn ( OH ) 4 2 1 / 2 )
Based on the above-mentioned calculations in Equations (18)–(21) for the potential of the zinc–nickel single-flow battery stack, combined with the range of concentration of each substance in Table 2, the battery potential can be further expressed by SOC as Equation (22), where E 0 is 1.705 V. Under different operating conditions, the terminal voltage is affected by internal loss and self-discharge. The terminal voltage is estimated by Equation (23), where “±” indicates the charging process and the discharging process. E self discharge is the average voltage drop caused by the self-discharge during charge and discharge, which is 3.65 mV and 6.9 mV, respectively [33].
E stack = E 0 + RT nF ln ( ( SOC 1 SOC ) 2 × ( 1.4 SOC + 9.6 ) 2 1 0.7 SOC )
E terminal = E stack ( OCV ) ± I stack ( R reaction + R resistive ) E self discharge

2.5. SOC Estimation Model

SOC is used to characterize the state of charge of batteries. Its estimation module is shown in Figure 6. Based on the change of concentration of Zn ( OH ) 4 2 , the dynamic SOC value of the zinc–nickel single-flow battery is reflected in Equation (24). “±” indicates the charging and discharging process. The value of C max Zn ( OH ) 4 2 can be obtained as 1 mol/L from Table 2.
SOC = 1 C initial Zn ( OH ) 4 2 ± C variable Zn ( OH ) 4 2 C max Zn ( OH ) 4 2
The SOC of the zinc–nickel single-flow battery stack storage system is divided into SOC tank in the tank and SOC stack in the stack. The SOC in the stack is given by Equation (25). To simplify the estimation of the SOC, the formula for calculating the dynamic SOC of the stack is shown in Equation (26). Equation (27) is a formula for calculating the SOC stack . When charging, b takes a value of 1, and when discharged, it is −1. The simulation parameters involved in the model are shown in Table 3.
SOC stack = SOC stack _ in + SOC stack _ out 2 = SOC tank + SOC tank + I stack F × Q × C 2
SOC stack _ t = SOC tank _ t + I stack 2 × F × Q × C
SOC tank _ t = SOC tank _ initial + b × t 1 t 2 I stack _ t dt F × V × C

3. Results and Discussions

3.1. Terminal Voltage Estimation and Error Analysis of the Charging

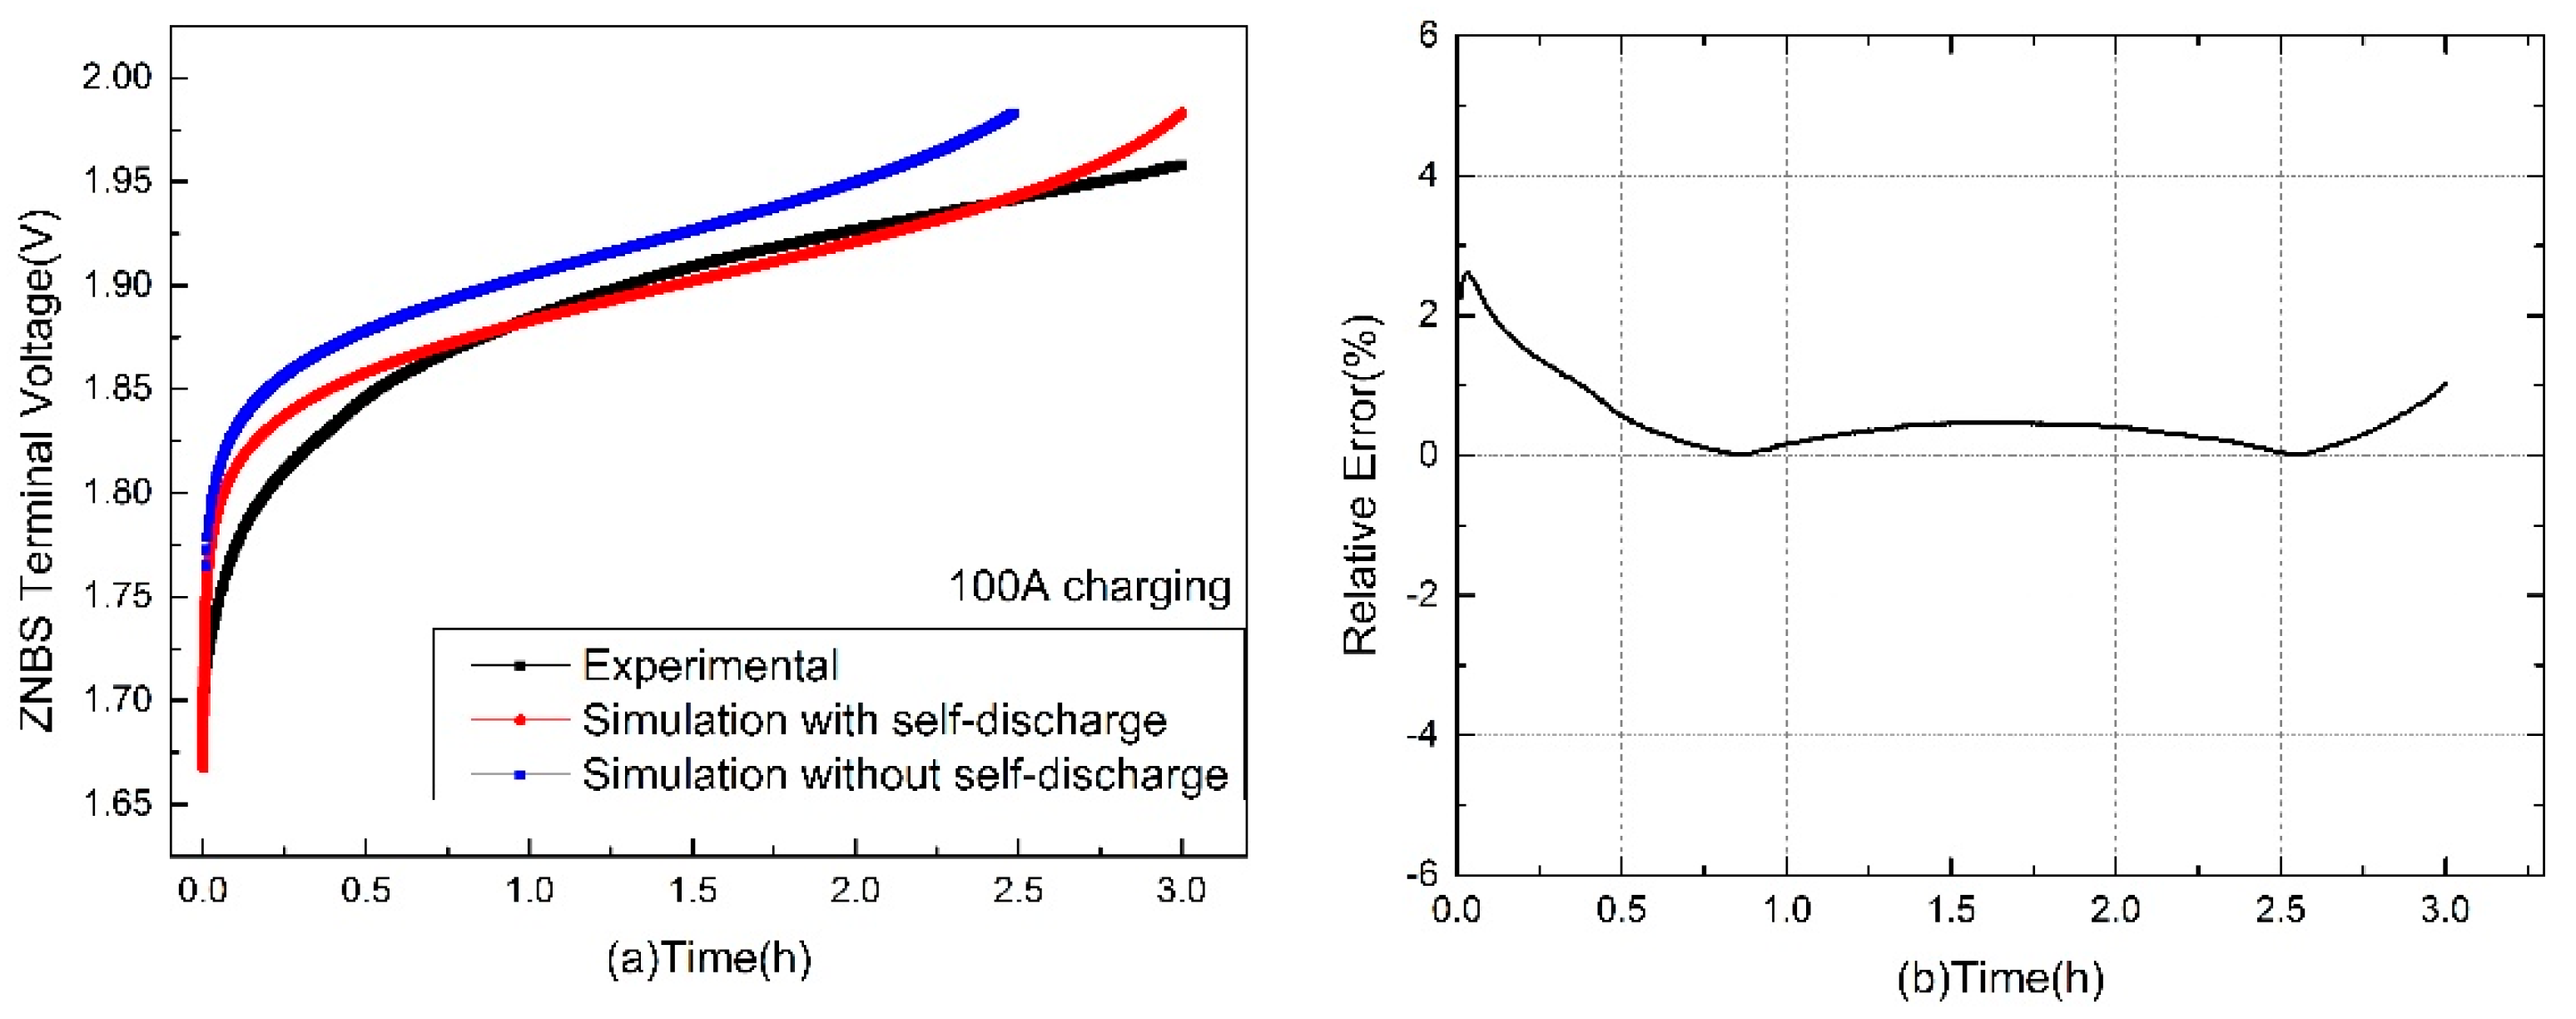
This section compares the voltage values of the zinc–nickel single-flow battery stacks obtained from experimental and simulation models at different charging currents (50 A, 100 A, 150 A). Figure 7a shows the comparison between the terminal voltage value of the stack obtained by the experiment and the voltage of the stack of the equivalent circuit model (considering self-discharge and without considering self-discharge) when the charging current is 100 A. The results show that the simulation results without considering the self-discharge effect have a large error with the experimental values. When the model considers the capacity loss and voltage drop caused by self-discharge, the charging time and voltage value obtained by the simulation are more consistent with the experimental values, so as to avoid the undercharge phenomenon caused by the large voltage estimation error. Figure 7b is a relative error analysis of the model simulation voltage value considering the self-discharge effect and the experimental value, and the error range is between 0.001% and 2.61%.
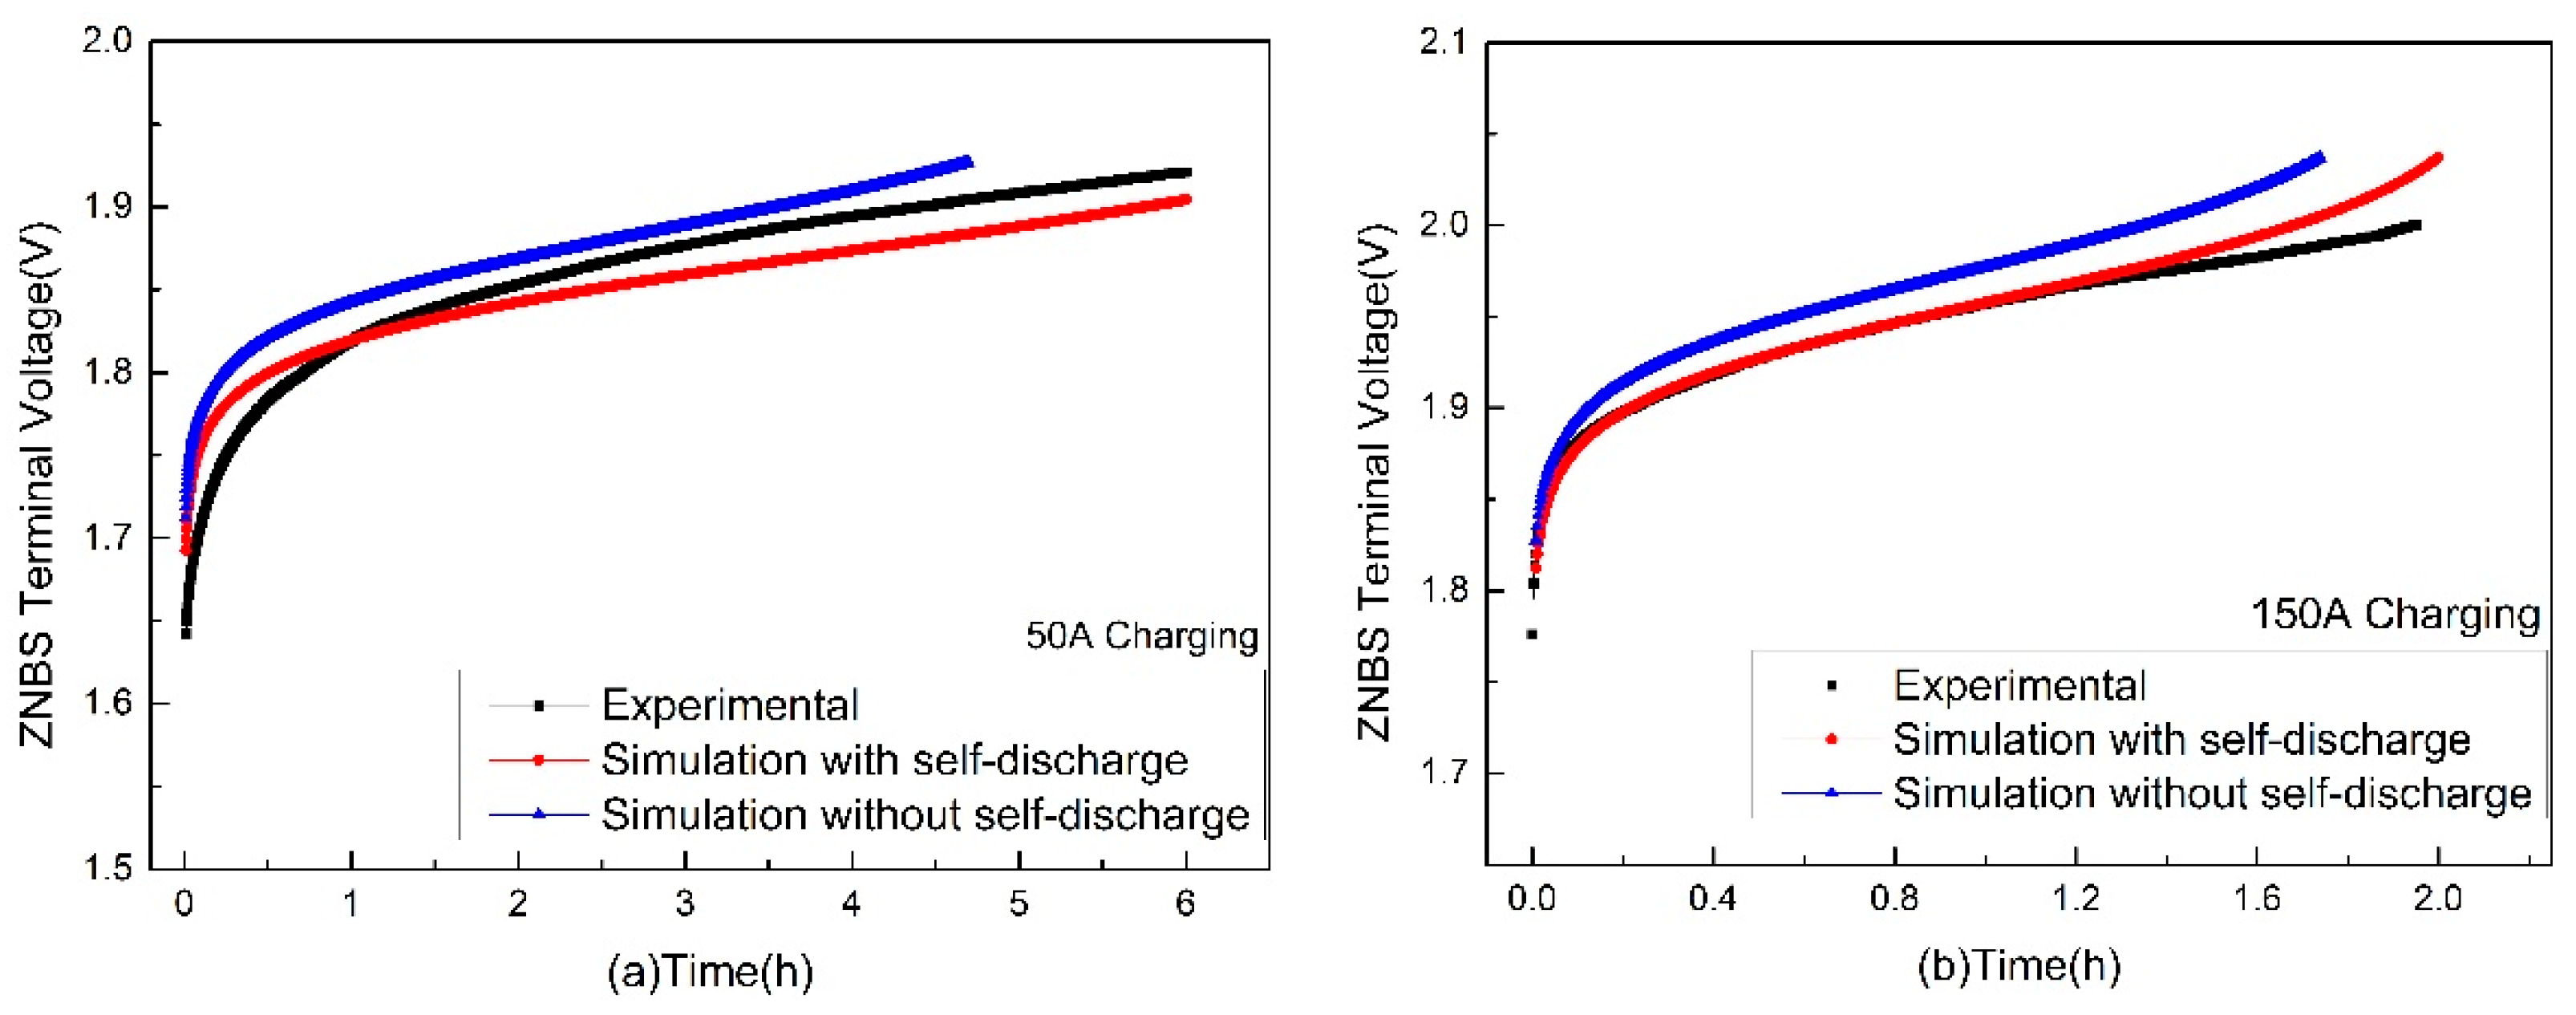
Figure 8 is a comparison of simulated voltage values obtained from electrical models (considering self-discharge and without considering self-discharge) with experimentally obtained voltage values at 50 A and 150 A. The results show that the simulation results considering the self-discharge are more accurate, and the error analysis is shown in Table 4.

3.2. Terminal Voltage Estimation and Error Analysis of the Discharging

Similar to Section 3.1, this section analyzes and validates the simulated voltage values obtained from the equivalent circuit model of the zinc–nickel single-flow battery stack under different discharge currents (50 A, 100 A, 150 A) and the experimentally obtained voltage values. Figure 9a shows the terminal voltage estimation of a zinc–nickel single-flow battery stack under different conditions (experiment, simulation of self-discharge, simulation without self-discharge) when the discharge current is 100 A. The results show that the simulation results without considering the self-discharge effect have a large error with the experimental values. When the model considers the capacity loss and voltage drop caused by self-discharge, the discharge time and voltage value obtained by the simulation are more consistent with the experimental values, so as to avoid the overdischarge phenomenon caused by the large voltage estimation error. Figure 9b is a relative error analysis of the model simulation voltage value considering the self-discharge and the experimental value, and the error range is between 0.004% and 3.75%.
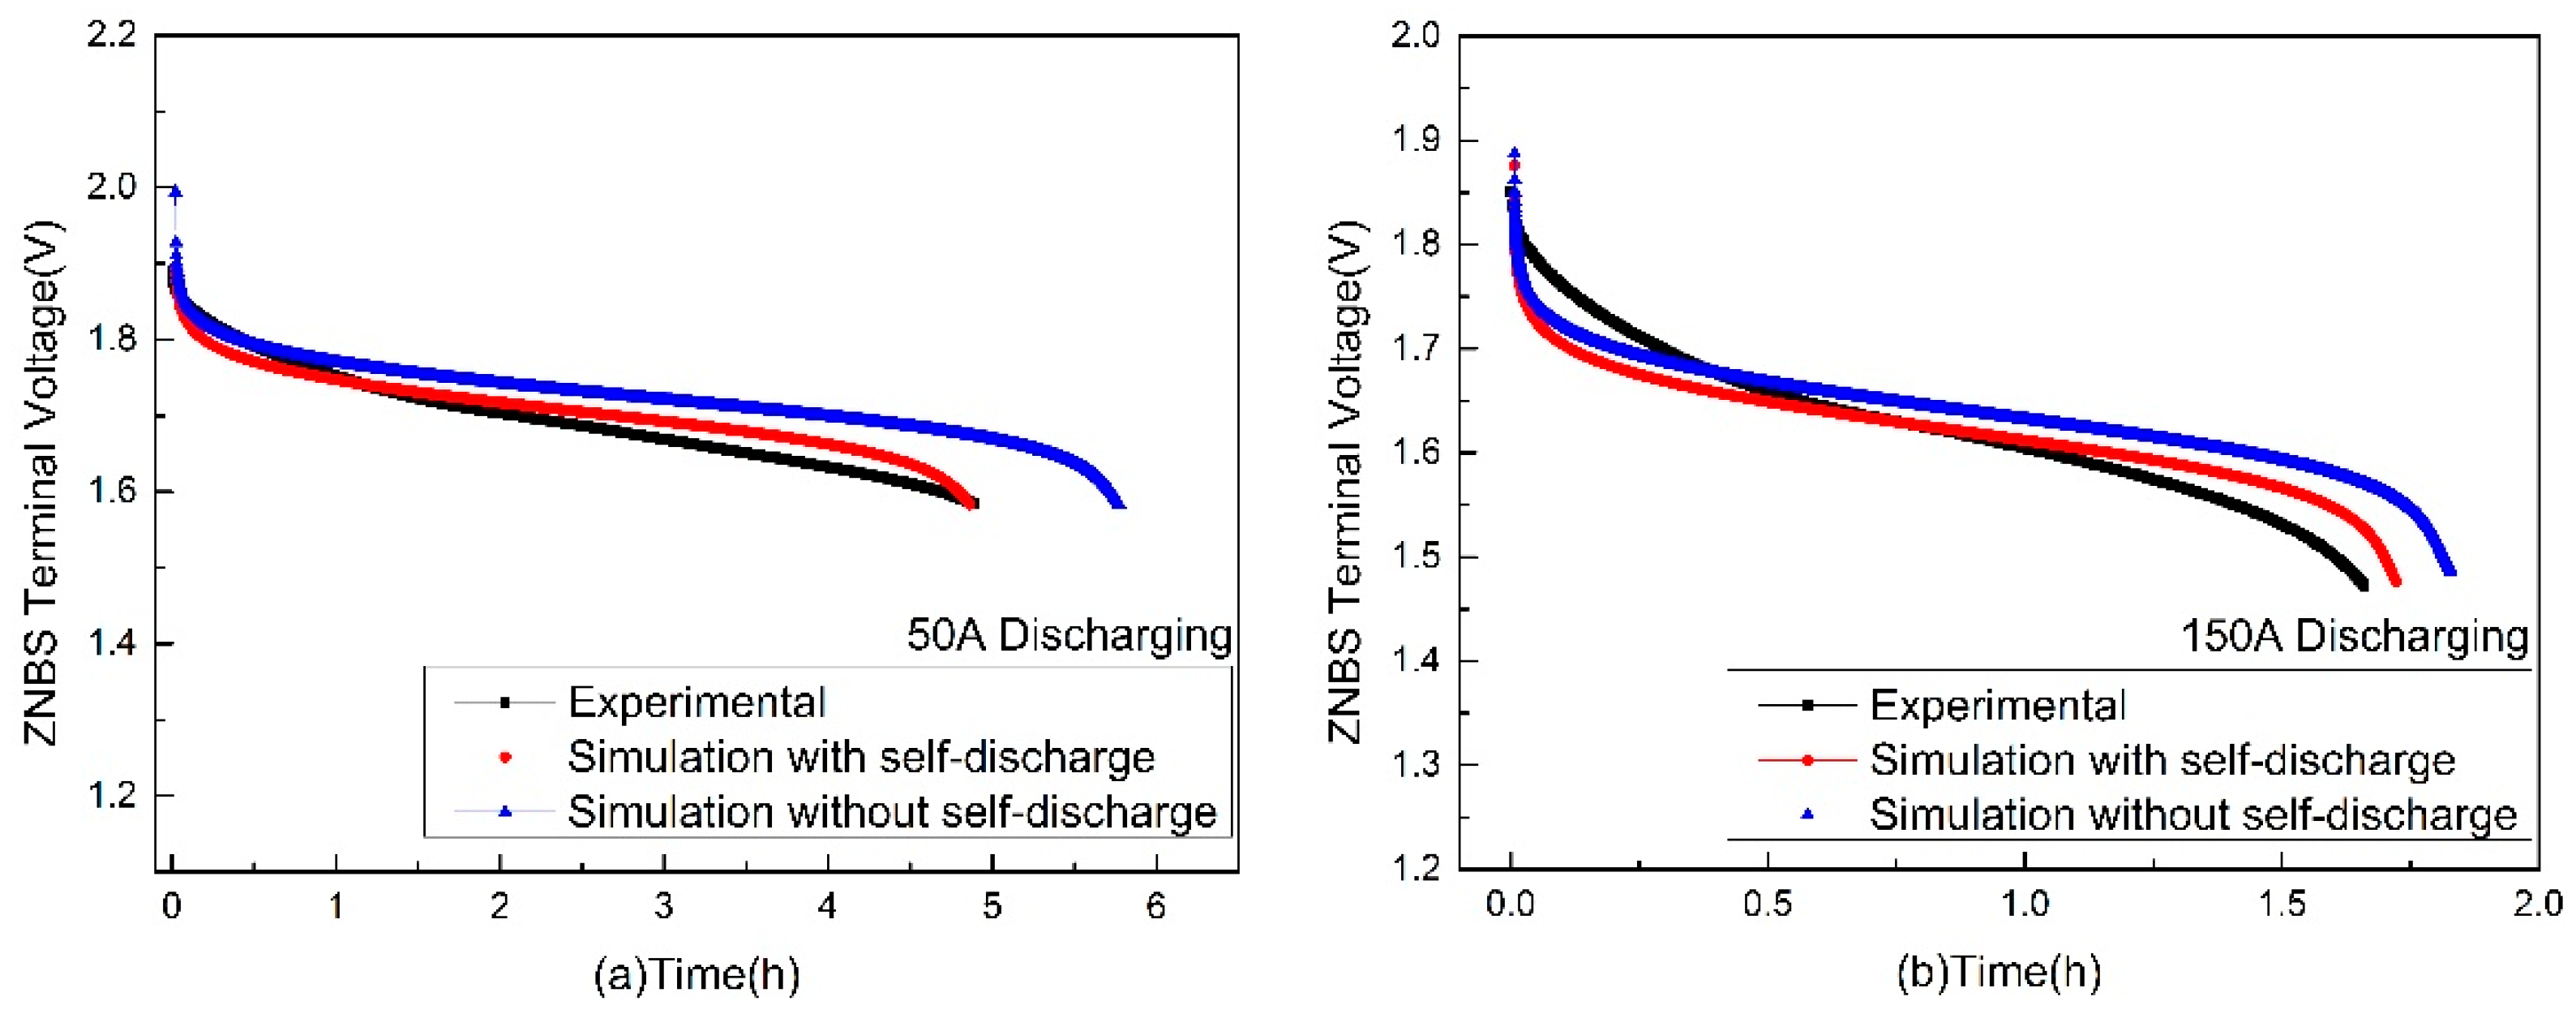
Figure 10 is a comparison of simulated voltage values obtained from electrical models (considering self-discharge and without considering self-discharge) with experimentally obtained voltage values at 50 A and 150 A. The results show that the simulation results considering the self-discharge are more accurate, and the error analysis is shown in Table 5.

3.3. Coulomb Efficiency Analysis

This section evaluates the Coulomb efficiency of a complete charge–discharge cycle for a zinc–nickel single-flow battery stack. Charging current is 100 A, discharge current is 50 A, 100 A, 150 A, and Coulomb efficiency ( η coulombic ) is defined as Equation (28).
η coulombic = 0 t d i dicharge dt 0 t c i charge dt
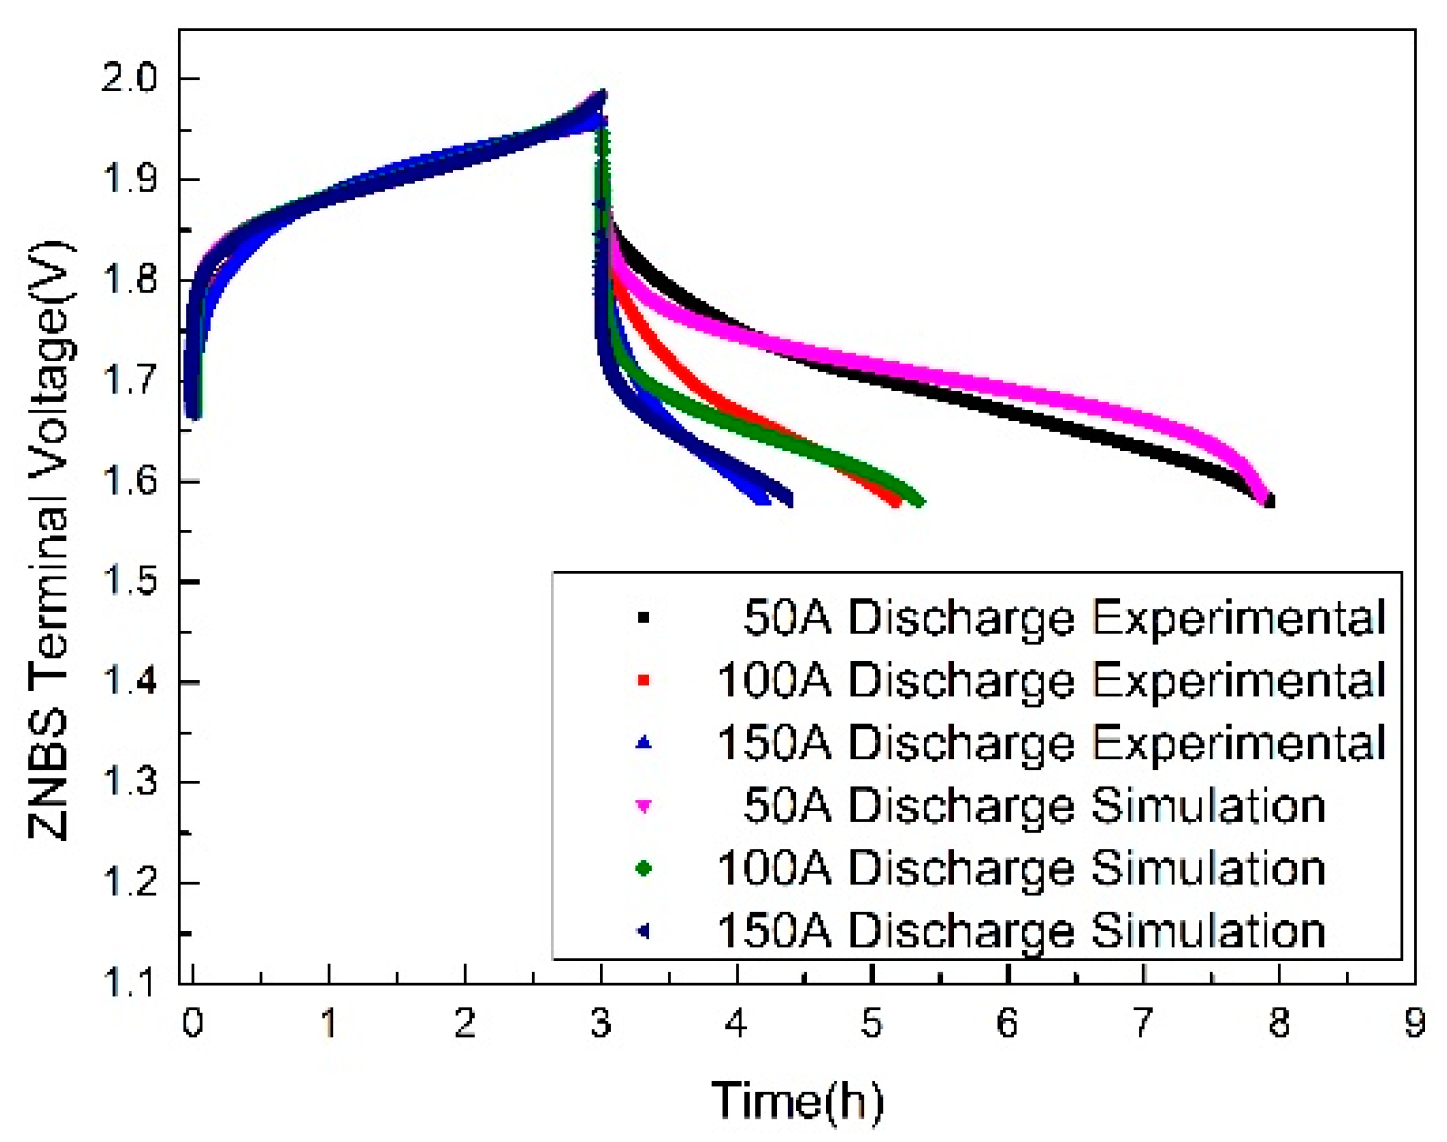
Figure 11 shows the Coulombic efficiency of the ZNBs energy storage system under the same charging current and different discharge currents. Under the operating conditions of 50 A, 100 A, 150 A discharge, the Coulomb efficiency calculated by the experiment is 89%, 89.9%, and 88%, respectively, and the Coulomb efficiency calculated by the simulation model is close to the experimental values, at 88.1%, 90.3%, and 88.6%, respectively. Therefore, the model can be used to estimate the Coulombic efficiency of a zinc–nickel single-flow battery stack under different operating conditions.

3.4. Dynamic Flow Rate Optimization

Electrolyte flow rate is one of the parameters that have a great influence on the performance of the flow battery stack energy storage system, and is closely related to its internal mass transfer, temperature distribution, and system loss. For the concentration overpotential, Ma X. et al. [35] first proposed the theoretical minimum electrolyte flow rate ( Q min ) based on Faraday’s law; see Equations (29) and (30). On this basis, relevant scholars use the theoretical minimum flow multiplied by different flow factors to optimize the electrolyte flow. Fu et al. [36] found that the minimum flow of the stack system should consider the concentration overpotential and pump power loss; Tang et al. [37] found that the system efficiency is the highest when the electrolyte flow rate is 7.5 times the theoretical minimum flow rate (factor = 7.5). In this paper, with reference to the optimization method proposed by the predecessors, the overall power loss (pump loss and internal loss) of the system is taken as the objective function. Firstly, the theoretical minimum flow multiplied by different flow factor (factor) is used to optimize the flow. The expression of flow rate can be seen in Equation (31).
Charge :   Q min = I F × n × c × ( 1 SOC )
Discharge :   Q min = I F × n × c × SOC
Q = factor · Q min
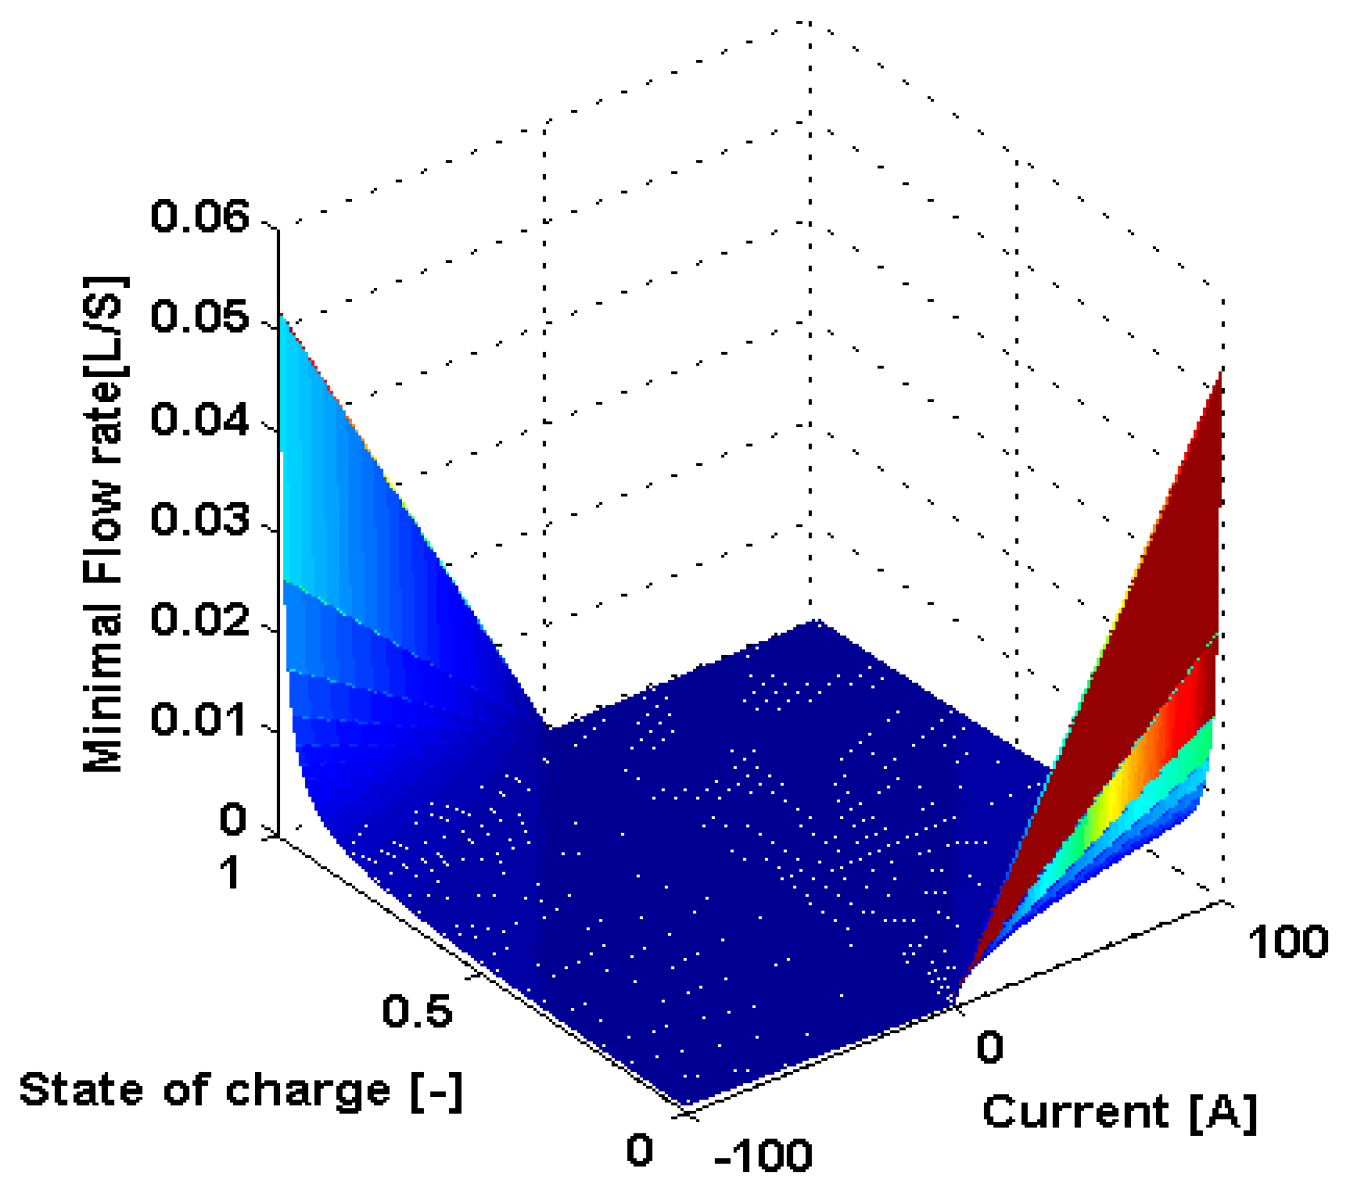
Figure 12 shows the theoretical minimum electrolyte flow rate of the zinc–nickel single-flow battery stack (300 Ah) as a function of SOC and current. The results show that the theoretical minimum flow rate of the electrolyte is large at the end of charge and at the end of discharge to avoid a large concentration overpotential [34].
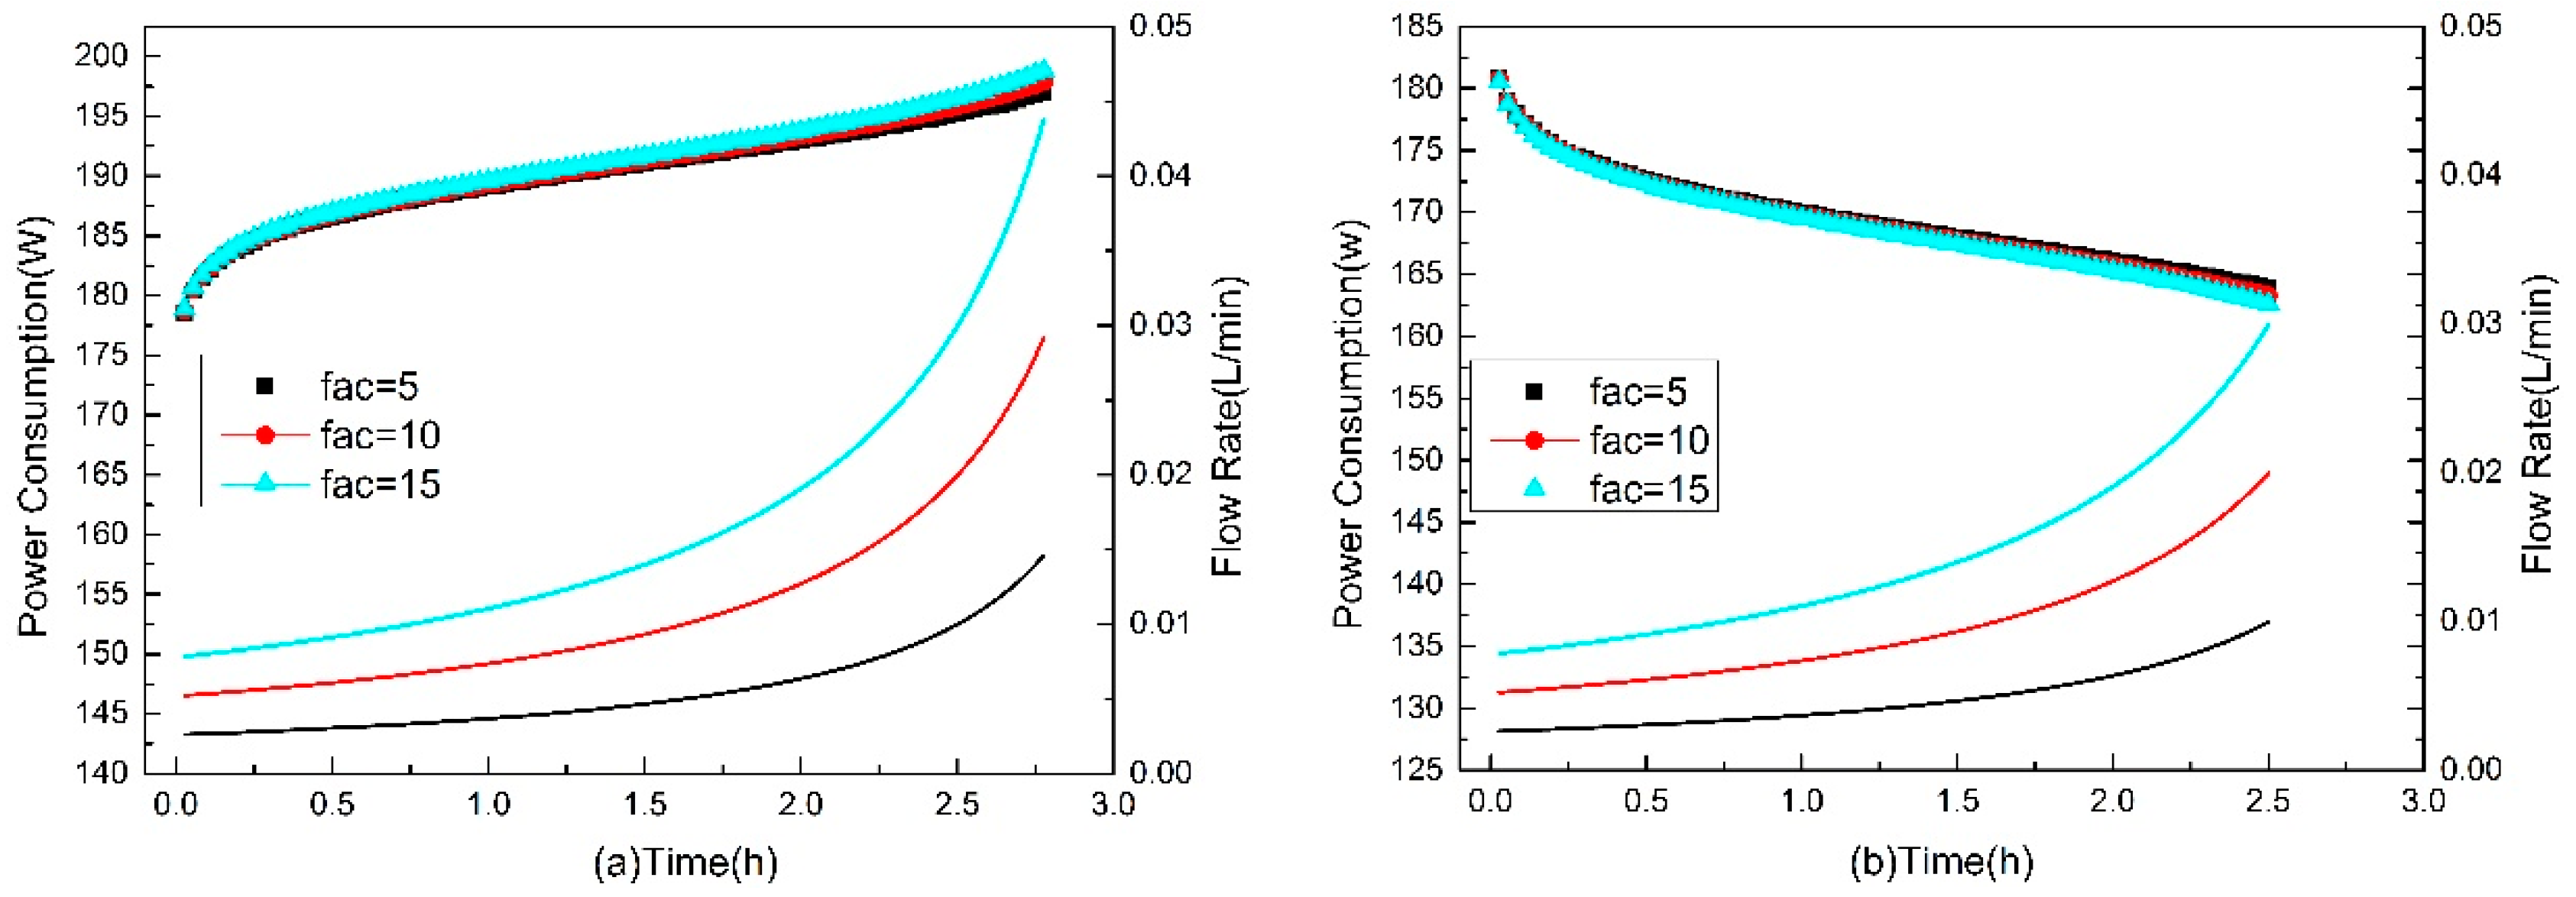
Figure 13 shows the power consumption and output of the system under different flow factors (factor = 5, factor = 10, factor = 15) and charging and discharging currents of 100 A. The simulation results show that with the increase of the flow factor, the power consumption of the stack system is slightly improved, and the power output of the stack system has a small decrease.
In the face of the phenomenon of charge and discharge "peak and valley" in actual engineering, there is a time-varying optimal flow factor corresponding to different charge and discharge powers under the corresponding state of charge. If a fixed flow factor is used, it may not reach the expected optimization effect. Tao W. et al. [38] combined dichotomy with the flow factor optimization method to realize real-time optimization of electrolyte flow under dynamic charging and discharging power, but this method is only applicable to single-parameter optimization, and the objective function must be a single peak function. Compared with the traditional optimization algorithm, genetic algorithm has good optimization ability for nonlinear problems, and can optimize multiobjective and multiparameter simultaneously. Therefore, the genetic algorithm is introduced as an optimization method in this paper. The constant charge–discharge power condition is taken as an example to optimize the electrolyte flow rate of the zinc–nickel single-flow battery stack in real time, which provides theoretical support for multiparameter and multiobjective optimization under dynamic charge–discharge power.
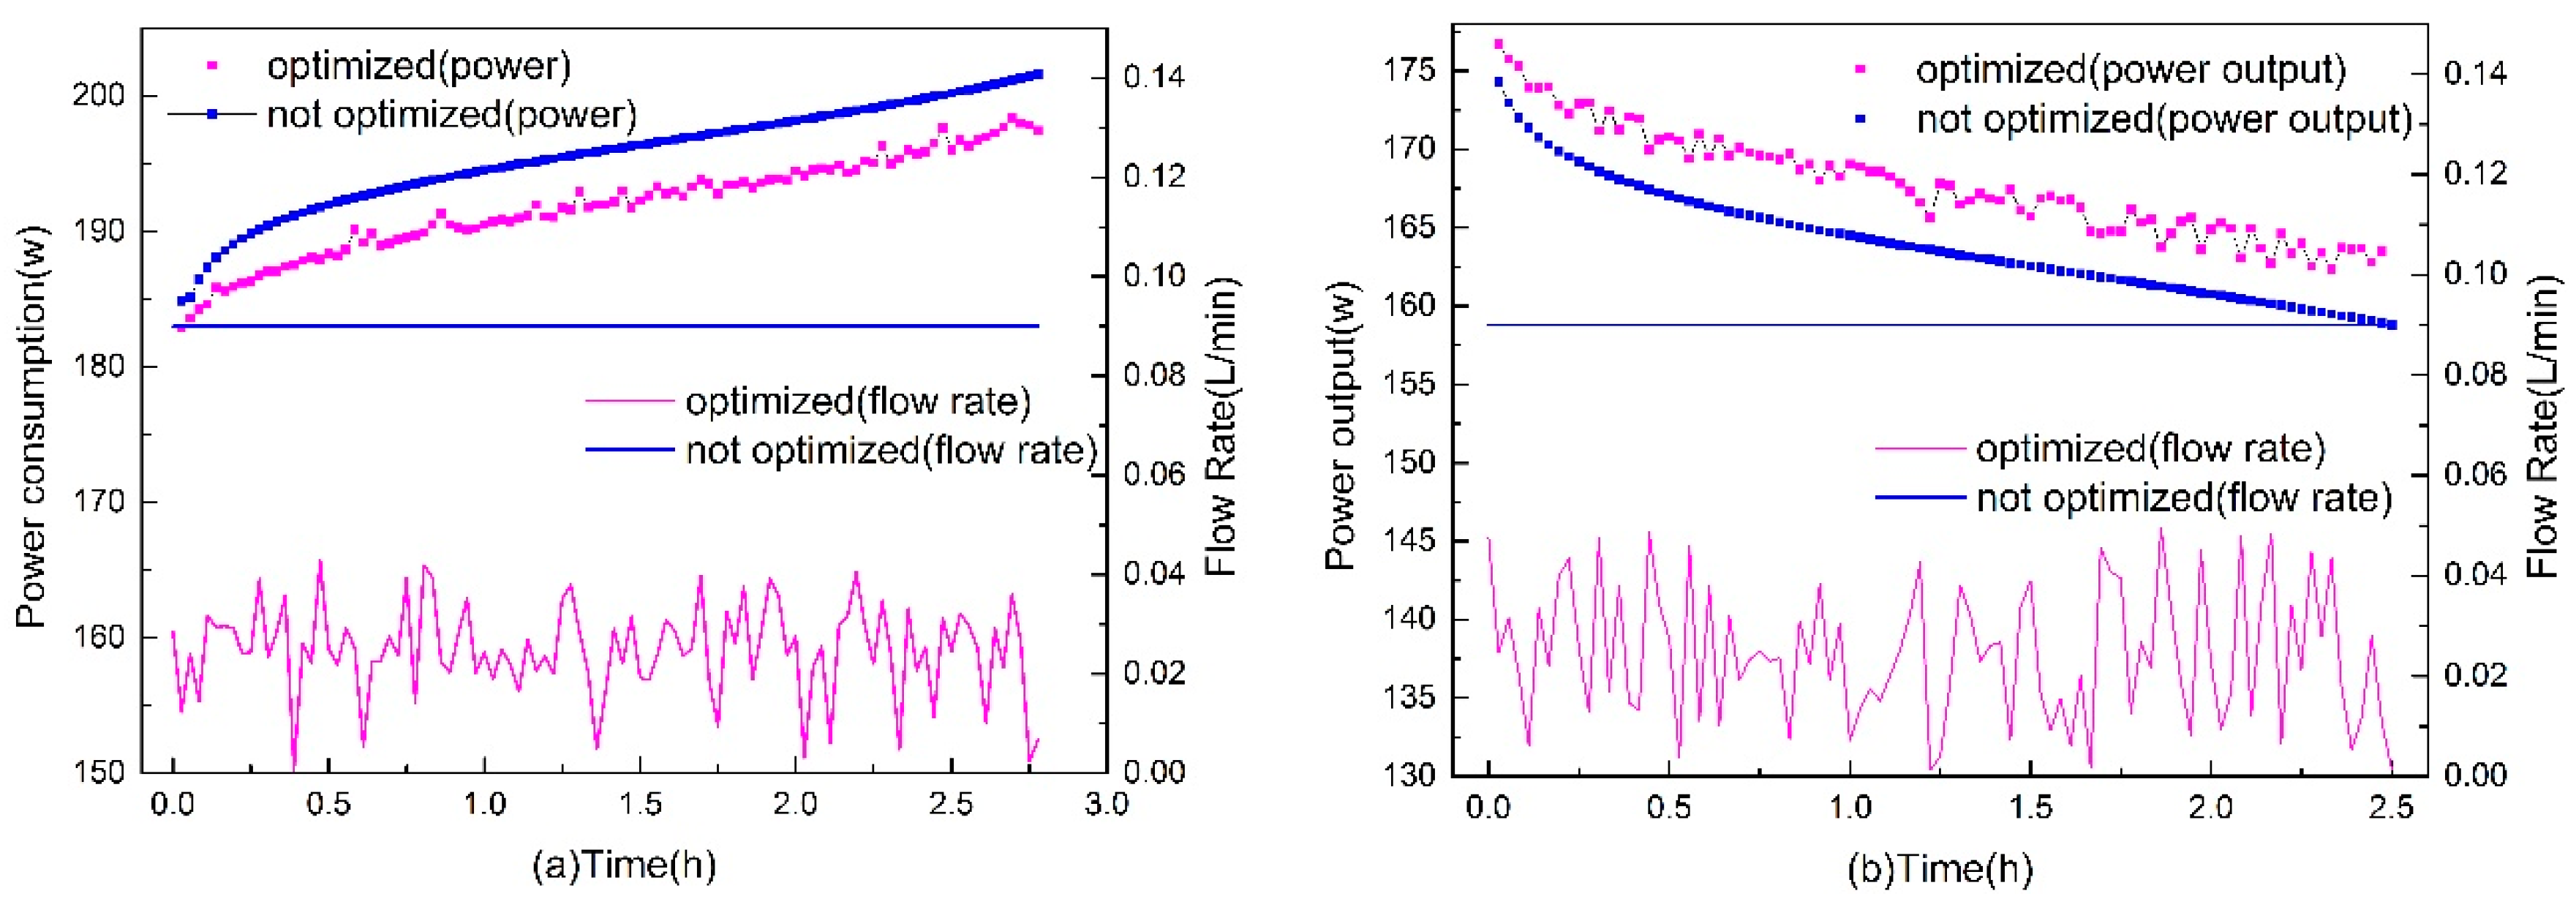
In this paper, the total loss (internal loss and pump loss) of the zinc–nickel single-flow battery stack (300 Ah) energy storage system during charging and discharging process is taken as objective function, and the electrolyte flow rate was optimized at each time step in the simulation model. Figure 14a,b show the system power under two different flow control strategies (not optimized flow rate 0.09 L/s and genetic algorithm optimized flow) during charging and discharging, respectively. The results show that under the optimized electrolyte flow rate, the power consumption of the charging process is significantly reduced, and the power output of the discharge process is significantly improved.
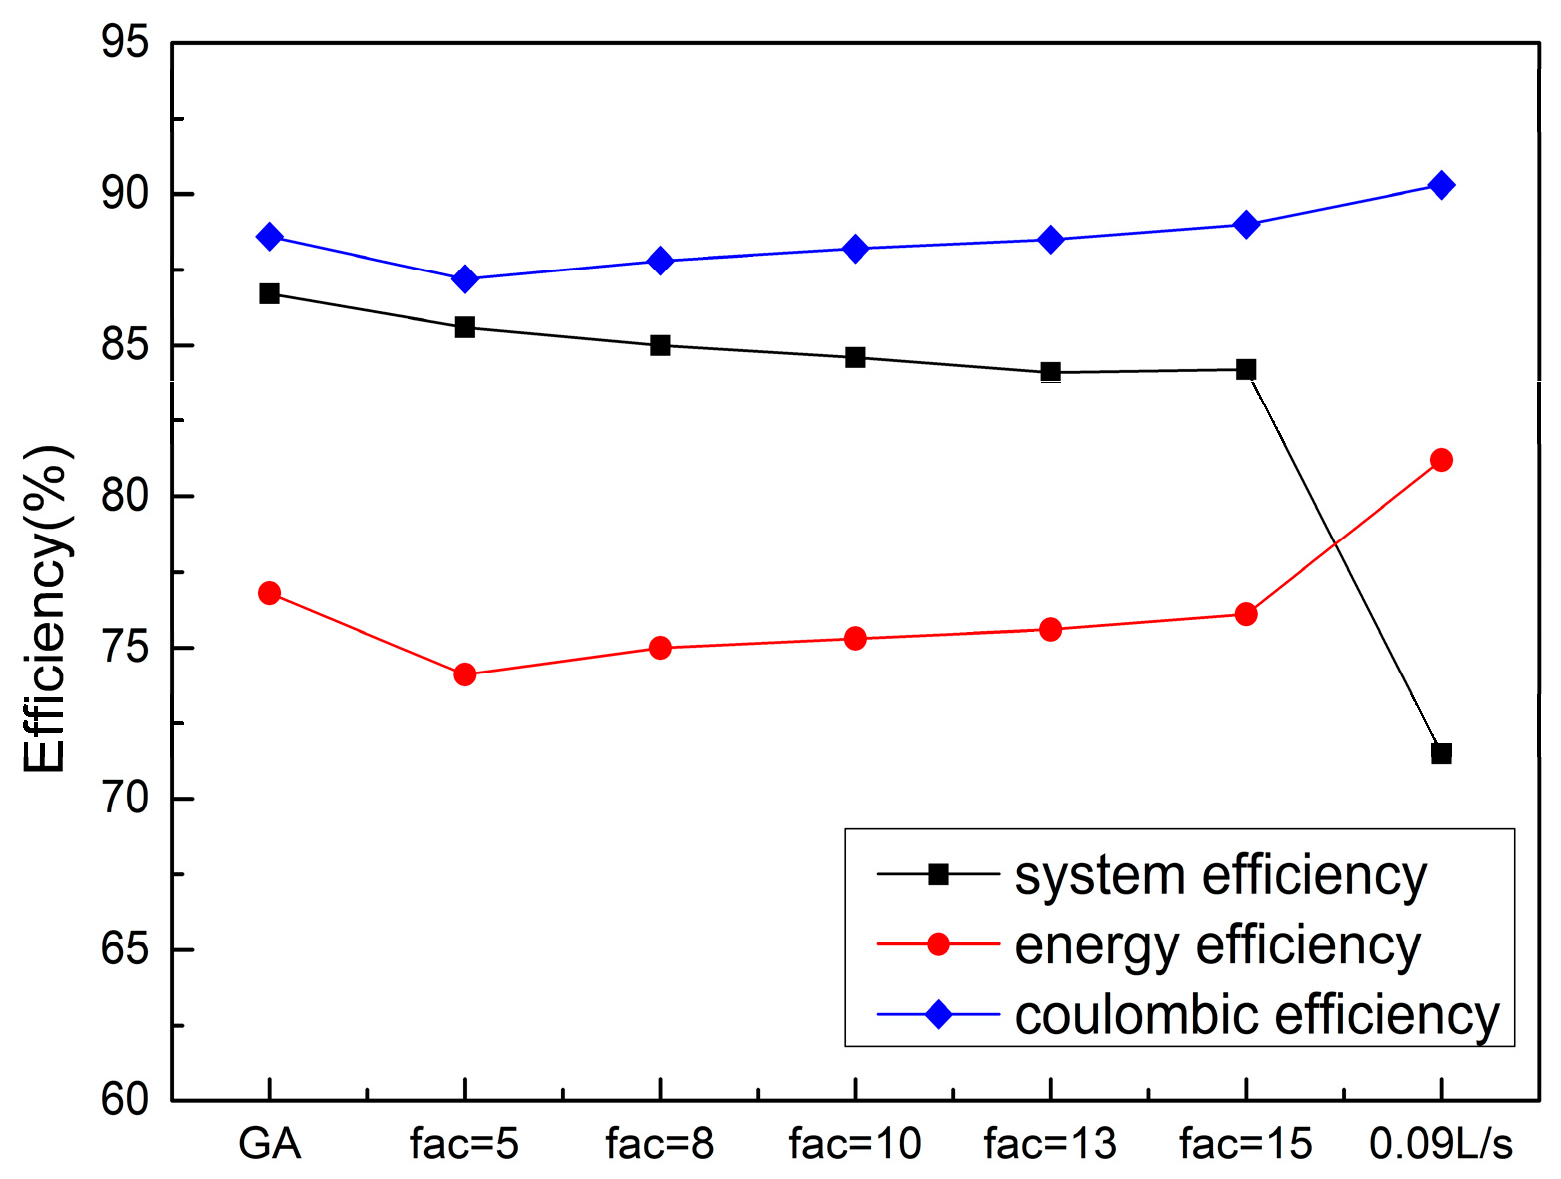
In addition, the overall performance (Coulomb efficiency, energy efficiency, and system efficiency) of the zinc–nickel single-flow battery stack (300 Ah) under 100 A charge–discharge current and different electrolyte flow control strategies (optimized electrolyte flow rate by genetic algorithm, electrolyte flow rate corresponding to different flow factors, and rated flow rate of 0.09 L/s) are compared and analyzed. The calculation formulas for Coulombic efficiency, energy efficiency, and system efficiency are as follows in Equations (32)–(34).
Coulombic   efficiency :   η Coulombic = 0 t d I discharge dt 0 t c I charge dt
Energy   efficiency :   η Eenergy = 0 t d I discharge E discharge dt 0 t c I charge E charge dt
System   efficiency :   η System = 0 t d ( P stack P loss ) dt 0 t c ( P stack + P loss ) dt
Figure 15 shows the performance parameters calculated by the complete charge and discharge cycle of the zinc–nickel single-flow battery stack under different flow control strategies with a current of 100 A. The results show that when the flow control strategy is optimized by the genetic algorithm, the system efficiency is the highest, reaching 86.7%. When the theoretical minimum flow is multiplied by different flow factors for flow optimization, it can be found that with the increase of factor, the system efficiency has a small decrease. The theoretical minimum flow multiplied by the different flow factor optimization method can make the system efficiency of the stack energy storage system reach a higher value, for example, when the factor value is 5, the system efficiency is 85.6%. From the trend of change, the factor value is smaller, which may further improve the system efficiency, but the optimization result of the flow factor is only suitable for a specific working condition. With the fluctuation of charging and discharging power, if a fixed flow factor is used, the expected optimization effect may not be achieved. However, the optimization method of genetic algorithm solves this problem well. In practical engineering applications, a superior flow control strategy can be derived by genetic algorithm when in the face of the “peak and valley” phenomenon of charge and discharge power caused by the discontinuous, unstable, and uncontrollable characteristics of renewable energy and uncontrollable changes in user demand.

4. Conclusions

In this paper, the zinc–nickel single-flow battery stack is taken as the research object, and a general electrical model considering self-discharge, pump loss, and flow is built by using MATLAB/Simulink software. The self-discharge module, pump loss module, SOC, and voltage estimation module in this model are described in detail in Section 2. In order to evaluate the accuracy of the electrical model, the charging and discharging experiments of the zinc–nickel single-flow battery stack (300 Ah) were carried out under different charging and discharging currents (50 A, 100 A, 150 A). The results are compared with the simulation values (considering self-discharging and without considering self-discharging). The results show that the simulation values obtained by the simulation model considering self-discharging are closer to the experimental results. The minimum error of voltage in charging is 0–0.02%, the maximum error is 1.1–2.61%, the minimum error of voltage in discharging is 0.002–0.02%, and the maximum error is 1.8–3.85%. In addition, the Coulombic efficiency of the complete charge and discharge cycle of the simulation model is estimated. Under the operating conditions of rated electrolyte flow rate (0.09 L/S), charging current 100 A, and discharge current 50 A, 100 A, and 150 A, the comparison with experimental data shows that the simulation model has high accuracy in estimating Coulomb efficiency. The flow rate of electrolytes is one of the most influential parameters in the operation of battery stacks. Excessive flow rate of electrolytes will cause high pump loss, and too low a flow rate of electrolyte will increase the internal loss of the battery stack. Therefore, there exists a time-varying optimal electrolyte flow rate to maximize the system efficiency of the zinc–nickel single-flow battery stack corresponding to the dynamic SOC. In this paper, the overall power loss (pump loss, internal loss) of the system is taken as the objective function, and two methods, genetic algorithm and theoretical minimum flow multiplied by different flow factors, are used to optimize the flow rate. The results show that, compared with the rated flow rate (0.09 L/s), the optimized flow rate of electrolytes improves the system efficiency significantly. The results show that under the constant charge and discharge power, the above two optimization methods have significantly improved the system performance, and the flow factor optimization method is more convenient. However, in the face of the “peak-valley” phenomenon of charge and discharge power in actual engineering, the optimization method of fixed flow factor may not achieve the expected effect, and the genetic algorithm can optimize the electrolyte flow in real time to provide better flow control strategy.

Author Contributions

S.Y. provided financial support and put forward research ideas. X.S. completed model building and manuscript writing. M.X. put forward research ideas. J.C. and Y.S. designed the experiment.

Funding

This research was funded by National Natural Science Foundation of China (grant number: 51776092).

Acknowledgments

We would like to thank the School of Energy and Power Engineering of Jiangsu University of Science and Technology for its support. In addition, we would like to thank our colleagues in the laboratory for their technical assistance to the software problems encountered during the project.

Conflicts of Interest

The authors declare no conflict of interest.

Abbreviations

P stack Stack power h m Localized loss
P rate Stack power rating P self Self-discharge power loss
KPower loss coefficient R self Self-discharge resistance
I max Maximum charge and discharge currentVstackStack terminal voltage
RInternal loss resistanceEstackStack potential
VminStack minimum voltage SOC stack Stack stage of charge
P fix Fixed loss power SOC tank Tank stage of charge
R fix Fixed loss resistornNo. of electrons transferred per mole
P mech Mechanical lossQElectrolyte flow rate
P stack _ loss Internal mechanical loss of stack FFaraday constant
P pipe _ loss Mechanical loss in the pipefactorFlow rate factor
V s Velocity of the electrolyte inside the pipe η Coulombic Coulombic efficiency
ZHeight of the pipe η Eenergy Energy efficiency
h f Pipeline loss η System System efficiency
R ˜ Hydraulic resistance η pump Pump efficiency

References

  1. Xie, X.; Zheng, Q.; Li, X.; Zhang, H. Current advances in the flow battery technology. Energy Storage Sci. Technol. 2017, 6, 1050–1057. [Google Scholar]
  2. Ding, M.; Chen, Z.; Su, J.; Chen, Z.; Zhu, C. Optimal Control of Battery Energy Storage Based on Variables Smoothing Time Constant. Autom. Electr. Syst. 2013, 01, 19–25. [Google Scholar]
  3. Zhao, P.; Zhang, H.; Zhou, H. Research outline of redox flow cells for energy storage in china. Chin. Battery Ind. 2005, 10, 96–99. [Google Scholar]
  4. Jia, Z.; Song, S.; Wang, B. A critical review on redox flow batteries for electrical energy storage. Energy Storage Sci. Technol. 2012, 01, 50–57. [Google Scholar]
  5. Hazza, A.; Pletcher, D.; Wills, R. A novel flow battery: A lead acid battery based on an electrolyte with soluble lead (II) Part I. Chem. Phys. 2004, 6, 1773–1778. [Google Scholar] [CrossRef]
  6. Pletcher, D.; Wills, R. A novel flow battery: A lead acid battery based on an electrolyte with soluble lead (II) Part II. Chem. Phys. 2004, 6, 1779–1785. [Google Scholar]
  7. Pletcher, D.; Wills, R. A novel flow battery—A lead acid battery based on an electrolyte with soluble lead (II) III. J. Power Sour. 2005, 149, 96–102. [Google Scholar] [CrossRef]
  8. Hazza, A.; Pletcher, D.; Wills, R. A novel flow battery—A lead acid battery based on an electrolyte with soluble lead (II) IV. J. Power Sour. 2005, 149, 103–111. [Google Scholar] [CrossRef]
  9. Cheng, J.; Zhang, L.; Yang, Y.; Wen, Y.; Cao, G.; Wang, X. Preliminary study of single flow zinc–Nickel battery. Electrochem. Commun. 2007, 9, 2639–2642. [Google Scholar] [CrossRef]
  10. Pan, J.; Sun, Y.; Cheng, J.; Wen, Y.; Yang, Y.; Wan, P. Study on a new single flow acid Cu-Pb O2battery. Electrochem. Commun. 2008, 10, 1226–1229. [Google Scholar] [CrossRef]
  11. Xu, Y.; Wen, Y.; Cheng, J.; Cao, G.; Yang, Y. Study on a single flow acid Cd-chloranil battery. Electrochem. Commun. 2009, 11, 1422–1424. [Google Scholar] [CrossRef]
  12. Zhang, L.; Cheng, J.; Yang, Y.; Wen, Y.; Xie, Z. Preliminary Study of Single Flow Zinc-Nickel Battery. Electrochemistry 2008, 14, 248–252. [Google Scholar]
  13. Zhang, L.; Cheng, J.; Yang, Y.; Wen, Y.; Wang, X.; Cao, G. Study of zinc electrodes for single flow zinc/nickel battery application. J. Power Sour. 2008, 179, 381–387. [Google Scholar] [CrossRef]
  14. Cheng, J.; Wen, Y.; Xu, Y.; Cao, G.; Yang, Y. Effects of Substrates on Deposition of Zinc from flowing Alkaline Zincate Solutions. Chem. J. Chin. Univ.-Chin. 2011, 32, 2640–2644. [Google Scholar]
  15. Wang, J.; Zhang, L.; Zhang, C.; Xiao, Q.; Zhang, J.; Cao, C. The Influence of Bi3+ and Tetrabutylammonium Bromide on the Dendritic Growth Behavior of Alkaline Rechargeable Zinc Electrode. Funct. Mater. 2001, 32, 45–47. [Google Scholar]
  16. Wen, Y.; Cheng, J. The inhibition of the spongy electrocry stallization of zinc from dopedflowing alkaline zincate solutions. J. Power Sour. 2009, 193, 890–894. [Google Scholar] [CrossRef]
  17. Wen, Y.; Wang, T.; Cheng, J.; Pan, J.; Cao, G.; Yang, Y. Lead ion and tetrabutylammonium bromide as inhibitors of the growth of spongy zinc in single flow zinc/nickel batteries. Electrochim. Acta 2012, 59, 64–68. [Google Scholar] [CrossRef]
  18. Song, S. Study on Electrolyte of Zinc/Nickel Single Flow Battery. Ph.D. Thesis, Beijing University of Chemical Technology, Beijing, China, 2014. [Google Scholar]
  19. Cheng, Y.; Zhang, H. A high power density single flow zinc-nickel battery with three-dimensional porous negative electrode. J. Power Sour. 2013, 241, 196–202. [Google Scholar] [CrossRef]
  20. Cheng, Y.; Zhang, H. Performance gains in single flow zinc-nickel batteries through novel cell configuration. Electrochim. Acta 2013, 105, 618–621. [Google Scholar] [CrossRef]
  21. Cheng, Y.; Zhang, H. Effect of temperature on the performances and in situ polarization analysis of zinc-nickel single flow batteries. J. Power Sour. 2014, 249, 435–439. [Google Scholar] [CrossRef]
  22. Yao, S.; Ji, Y.; Wang, Y.; Song, Y.; Xiao, M.; Cheng, J. Optimization Analysis for the Internal Flow Field of Nickel-zinc Single Flow Energy Storage Battery with 32-Cell. Oxid. Commun. 2016, 39, 3223–3234. [Google Scholar]
  23. Zhao, P.; Cheng, J.; Xu, Y.; Wen, Y.; He, K.; Cao, G. Pilot Scale Development of Zn/Ni single flow redox battery. In Summary of the 29th Annual Academic Meeting of the Chinese Chemical Society—Chapter 24: Chemical Power; Peking University: Beijing, China, 2014. [Google Scholar]
  24. Barote, L.; Marinescu, C.; Georgescu, M. VRB modeling for storage in stand-alone wind energy systems. IEEE Powertech. Conf. 2009. [Google Scholar] [CrossRef]
  25. Barote, L.; Marinescu, C. A new control method for VRB SOC estimation in stand-alone wind energy systems. Intern. Conf. Clean Electr. Power. 2009, 253–257. [Google Scholar]
  26. Chahwan, J.; Abbey, C.; Joos, G. VRB modelling for the study of output terminal voltages, internal losses and performance. Electr. Power Conf. 2008. [Google Scholar] [CrossRef]
  27. Bhattacharjee, A.; Saha, H. Design and experimental validation of a generalised electrical equivalent model of Vanadium Redox Flow Battery for interfacing with renewable energy sources. J. Energy Storage 2017, 13, 220–232. [Google Scholar] [CrossRef]
  28. Bhattacharjee, A.; Roy, A.; Banerjee, N.; Patra, S.; Saha, H. Precision dynamic equivalent circuit model of a Vanadium Redox Flow Battery and determination of circuit parameters for its optimal performance in renewable energy applications. J. Power Sour. 2018, 396, 506–518. [Google Scholar] [CrossRef]
  29. Yao, S.; Liao, P.; Xiao, M.; Cheng, J.; He, K. Equivalent circuit modeling and simulation of the zinc-nickel single flow batteries. AIP Adv. 2017, 7, 1–10. [Google Scholar] [CrossRef]
  30. Xiao, M.; Liao, P.; Yao, S.; Cheng, J. Experimental study on charge/discharge characteristics of zinc-nickel single-flow battery. J. Renew. Sustain. Energy 2017, 9. [Google Scholar] [CrossRef]
  31. Yao, S.; Liao, P.; Xiao, M.; Cheng, J.; He, K. Modeling and simulation of the zinc-nickel single flow batteries based on MATLAB/Simulink. AIP Adv. 2016, 6. [Google Scholar] [CrossRef]
  32. Chi, X.; Zhu, M.; Wu, Q. Research on optimal operation control based on the equivalent model of VRFB system. Energy Storage Sci. Technol. 2018, 7, 530–538. [Google Scholar]
  33. Yao, S.; Liao, P.; Xiao, M.; Cheng, J.; Cai, W. Study on Electrode Potential of Zinc-nickel Single-Flow Battery during Charge. Energies 2017, 10, 1101. [Google Scholar] [CrossRef]
  34. Blanc, C. Modelling of Vanadium Redox Flow Battery Electricity Storage System. Ph.D. Thesis, Echole Polytechnique Federale De Lausanne, Lausanne, Switzerland, 2017. [Google Scholar]
  35. Ma, X.; Zhang, H.; Sun, C.; Zou, Y.; Zhang, T. An optimal strategy of electrolyte flow rate for vanadium redox flow battery. J. Power Sour. 2012, 203, 153–158. [Google Scholar] [CrossRef] [Green Version]
  36. Fu, J.; Zheng, M.; Wang, X.; Sun, J.; Wang, T. Flow-Rate Optimization and Economic Analysis of Vanadium Redox Flow Batteries in a Load-Shifting Application. J. Energy Eng. 2017, 143, 1–13. [Google Scholar] [CrossRef]
  37. Tang, A.; Bao, J.; Skyllaskazacos, M. Studies on pressure losses and flow rate optimization in vanadium redox flow battery. J. Power Sour. 2014, 248, 154–162. [Google Scholar] [CrossRef]
  38. Wang, T.; Fu, J.; Zheng, M.; Yu, Z. Dynamic control strategy for the electrolyte flow rate of vanadium redox flow batteries. Appl. Energy 2018, 227, 613–623. [Google Scholar] [CrossRef]
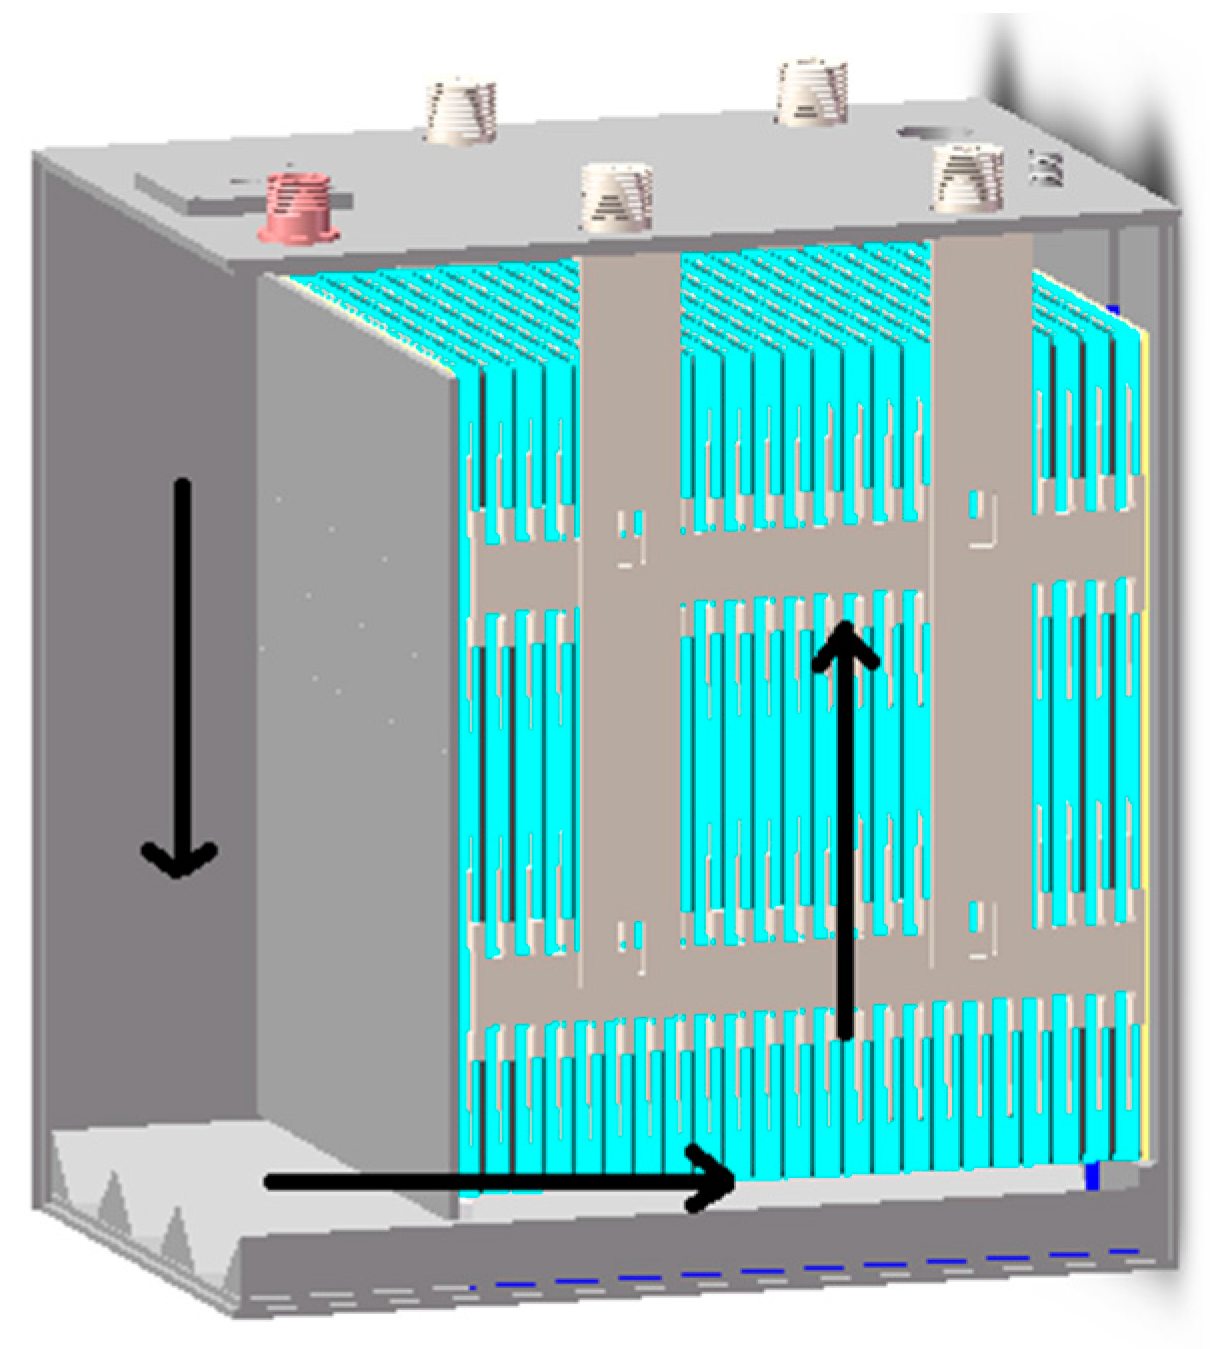
Figure 1. Basic structure of zinc–nickel single-flow battery.
Energies 12 00582 g001
Figure 2. Basic structure of partially parallel single cells.
Energies 12 00582 g002
Figure 3. Generalized electrical model of zinc–nickel single-flow battery stack.
Energies 12 00582 g003
Figure 4. Pump loss model of zinc–nickel single-flow battery stack.
Energies 12 00582 g004
Figure 5. Open-circuit voltage estimation model of zinc–nickel single-flow battery stack.
Energies 12 00582 g005
Figure 6. SOC estimation model of zinc–nickel single-flow battery stack.
Energies 12 00582 g006
Figure 7. (a) Simulation results and experimental verification of ZNBs voltage at 100 A charging current; (b) relative error between simulation results considering self-discharge and experimental results.
Energies 12 00582 g007
Figure 8. (a) Simulation results and experimental verification of the ZNBs terminal voltage when the charging current is 50 A; (b) simulation results and experimental verification of the ZNBs terminal voltage when the charging current is 150 A.
Energies 12 00582 g008
Figure 9. (a) Simulation results and experimental verification of ZNBs voltage at 100 A discharging current; (b) relative error between simulation results considering self-discharge and experimental results.
Energies 12 00582 g009
Figure 10. (a) Simulation results and experimental verification of the ZNBs terminal voltage when the discharging current is 50 A; (b) simulation results and experimental verification of the ZNBs terminal voltage when the discharging current is 150 A.
Energies 12 00582 g010
Figure 11. Coulombic efficiency estimation of 300 Ah zinc–nickel single-flow battery stack when charging at 100 A and discharging at three different currents (50 A, 100 A, 150 A).
Energies 12 00582 g011
Figure 12. The change of theoretical minimum flow rate with current (I) and charge state (SOC). (“-” denotes charging.)
Energies 12 00582 g012
Figure 13. (a) The change of power consumption with the flow factor during charging; (b) the variation of output power with the flow factor during discharging.
Energies 12 00582 g013
Figure 14. (a) System power consumption under different flow control strategies during charging process; (b) system output power under different flow control strategies during discharge process.
Energies 12 00582 g014
Figure 15. Performance analysis of the stack under different flow control strategies.
Energies 12 00582 g015
Table 1. Size parameters of the initial model.
Main ComponentsSize Parameters
Height of porous nickel electrode (mm)240
Width of porous nickel electrode (mm)186
Thickness of porous nickel electrode (mm)0.64
Height of negative pole (mm)240
Width of negative pole (mm)186
Thickness of negative pole (mm)0.08
Distance between anode and cathode(d1/mm)160
Electrolyte density (kg·m−3)1456.1
Electrolyte viscosity (kg·m−1·s−1)0.003139
No. of parallel cells in stack23
Inner diameter of the pipeline (mm)15
Length of pipeline (cm)40
Pipeline import and export height difference (cm)5
Number of bends3
Table 2. Range [28].
ParametersUnitRange
C H mol·m−30–35,300
C O H mol·m−39600–11,000
C Z n ( O H ) 4 2 mol·m−3300–1000
C m a x H mol·m−335,300
Table 3. Parameters [29,30,31,32,33,34].
ParametersUnitValue
Rated voltageV1.6
I m a x A200
U m i n V1.2
P r a t e W160
Stack capacityAh300
Number of parallel cells-23
Operating temperature range°C−40~40
Volume of electrolyte L8.5
R resistive Ω0.00064
R r e a c t i o n Ω0.00036
K resistive -10.8%
K reaction -4.35%
R f i x Ω0.313
C e l e c t r o d e F138
R s e l f Ω0.16
f-0.039
η p u m p -0.8
FC/mol−196485
S O C w o r s e -0.2
R ˜ Pa/m314186843
n-2
TK298
Cmol/L1
Table 4. Voltage error analysis of stack under different charging currents.
Charging Current (A)Maximum Relative Error (%)Minimum Relative Error (%)Charging Completion Time (h)
501.10.026
1002.610.0013
1501.4402
Table 5. Voltage error analysis of stack under different discharging currents.
Discharging Current (A)Maximum Relative Error (%)Minimum Relative Error (%)Discharging Completion Time (h)
501.80.0025.3
1003.750.0042.48
1503.850.021.78