1. Introduction
The photovoltaic (PV) industry is one of the fastest growing worldwide in the renewable energy sector. With 161 billion dollars of investment only in 2016 and a compound average growth rate of over 40%, it holds the top spot in the renewable energy market and in the political initiatives aimed at reducing emission and limiting fossil fuels [
1].
This scenario has increased the pressure on Operation and Maintenance (O&M) operators for efficiency, especially at a utility scale. However, residues of the incentives system and the inherent complexity of maintenance often results in plants being neglected, with considerable performance loss. In this context, a need for optimized monitoring and maintenance is becoming a crucial issue [
2].
In this context, regular monitoring of the plant’s status is a key factor for proper management during its entire lifespan, helping to properly evaluate the correct levelized cost of energy (LCOE) [
3]. Different systems have been analyzed, from the traditional inspection performed by O&M companies, to wireless sensor networks [
4] and drones [
5].
The data obtained from these inspections can be used to optimize the maintenance operations, and thus reduce overall O&M costs. Operations optimization is based on PV module degradation rates that can at times be obtained from validated models [
6] or from statistical analysis of the plant [
7].
In order to provide a valuable tool for all the possible stakeholders, a basic tool was introduced in [
8]. In that work, the concept of a digital map was introduced but no longer exploited to fulfil most of the market requirements.
In this paper, a more complex system that is capable of being extended and integrated with other existing software has been designed. This system is based on two mutually interacting parts: a complex, huge, various database called the Photovoltaic Indexed Database (PVID), and a user-friendly visual interacting tool, called the Digital Map, that can be used to have easy access to the database.
The information contained in the database is heterogeneous and obtained from different sources, such as drone inspection, I–V curve tests, electrical insulation tests, maintenance intervention, and remotely acquired data. All of them should be properly indexed to allow the user access to them at different levels.
An important source of information for medium–large and rooftop PV plants is the inspections with Unmanned Aerial Vehicles (UAVs) that generally provides two kind of images: visible images in the red-green-blue (RGB) channels, and infrared (IR) images. This source of information provides a large amount of unstructured data that should be properly indexed to make them valuable.
The Digital Map visualization tool can collect and gather all these data and give the user easy access to all of them. Due to the fact that this database can be enriched with other processing tools, the design of the proposed system is scalable at different layers.
A similar concept has already been implemented for civil engineering with the tool of Building Information Modelling (BIM) [
9]. As it occurred with civil engineering, this tool can change some design practices, and can lead to project benefits [
10].
In this paper, an overview on the PV plant inspection process is firstly provided in
Section 2. The database structure is described and analyzed in
Section 3, and then the basic aspect of the creation of this database is analyzed and a possible implementation is explained in
Section 4. In
Section 5, a test case is analyzed, and in
Section 6 some conclusions are drawn.
2. Generalities of PV Plant Monitoring
Among all the components of a PV plant, the most critical elements are inverters and modules. While for the inverters, remote data acquisition is quite well-developed, there is a lack of effective acquisition systems on the modules’ side. In this case, the number of modules is relevant (depending on the type, the number of modules ranges from 3500 to 4500 for MW) and generally, no monitoring technology is installed and no ad hoc IoT devices in the market are yet able to provide remote data to the O&M operator [
11]. Some fault diagnosis techniques have been provided in the literature for certain classes of problems [
12], but they are rarely implemented in industrial plants.
The natural consequence is that the inspection and data analysis related to modules is a critical point. In addition, the manual management of a large dataset for assessing the module’s condition may lead to errors and sub-optimal maintenance-related decisions. That said, modules should not be intended as the only part that may be subjected to significant improvements regarding inspection and maintenance activities.
Many degradation mechanisms due to aging can reduce the performance of PV modules [
13]. For monitoring plants without an already installed specific system, it is possible to extract valuable information from two different sources: pictures in the visible spectrum of light, and in IR [
14].
The collection of these kinds of images can be done via manual inspection or with drones. The first system, which is quite common in practice, is characterized by elevated inspection time (e.g., 8–12 h/MW), and is limited on ground plants. This system is typically cheaper because it is quite often included in standard maintenance. Generally, to reduce such time, a sub-sampling of the plant is done, and thus only a few numbers of modules are analyzed. On the other hand, inspection with drones is much faster (1 h/MW) and can also be performed on rooftop plants with additional advantages. The cost is generally higher, but the acquired information is more complete, and thus more valuable [
5].
After the data’s first acquisition, the next activity is data sorting and processing. Both these activities are generally performed manually, require a lot of time, and errors often occur. Data-sorting regards the classification of the acquired pictures with a plant-based criterion, such as according to the physical structure of the plant.
Data processing requires an expert user that is able to identify and classify defects in pictures. Once again, this activity is very time-consuming and is highly expensive due to the need for expert supervision. In the literature, several systems to automatically analyze the type and severity of the defects can be found, but they require the image of a single PV module as input, so a pre-processing activity is again required [
15]. Some systems were previously introduced for automating this activity, but were still at a preliminary design phase [
8].
At this point, a complete report of the plant can be written and given to the final user. Due to the low number of inspections, no history is generally reported, and no optimal planning for new inspections is performed.
This project aims at reducing the highlighted critical aspects by streamlining and automating the information-gathering process. The first step consists of the automatic management and sorting of the raw RGB and IR images captured by the drone. Then, data associated to the pictures are further processed to unequivocally identify each module. The second step consists in collecting a lot of other available information, form the plant history to other test results, such as the I–V curves, the insulation analysis, or the electroluminescence analysis [
16]. This tool was designed so as to be easily combined with other systems, like the ones devoted to the defect analysis in IR images.
There are many advantages of the proposed system—the flexibility in the combination with other tools, the capability to be enriched with other performance tests able to evaluate the impact of potential defects, the possibility to track the history of the plant, and to provide a user-friendly interface. Thus, the proposed interface can be conceived like a multi-layer digital map of the entire plant, where the user can easily access heterogeneous information at different scales, from the general aggregated data to the detailed information of the single module.
The system can be integrated in the entire photovoltaic plant system, composed of things such as the inspection, the maintenance, and the market data.
Figure 1 shows some of the possible relations between the designed tool and other existing systems.
3. Photovoltaic Indexed Database and Digital Map
The Photovoltaic Indexed Database (PVID) is intended to be a structured database. This can be accessed by means of a Digital Map that makes possible the visualization of the results, the insertion of sparse information in the database, and its assessment.
The bilateral relation between the Digital Map and the PV Indexed Database is depicted in
Figure 2, where three of the most important operations are shown: the first is the visualization of the information contained in the database where it is a monolateral interaction from the database to the digital map, while the second is the assessment of this information, and this is intrinsically bilateral because the information should be gathered from the database and then validated or corrected. The third is the insertion of additional data, and it is directed from the Digital Map to the database. It is important to remember the key role of the user in this whole process.
The Digital Map of the inspected plant represents a key aspect of the proposed system because it is the element in which all the information is sorted and available to the user. The access of the information is made available thanks to the indexing system of the database. Its generation is the toughest challenge, due to the different sources of information used and the lack of a strict common structure of them.
The formation of the raw database is based on two elements: a digital drawing PV plant, used for a correct identification of the rows, and the log file of the pictures taken from an inspection, used to associate at each module (and at its index in the plant map) its visible and IR-related picture. These are the fundamental data, otherwise the map cannot be filled with the essential information.
The clustering of available information can be performed with two criteria: the first one is done with geometrical considerations (the modules are clustered according to their position in the plant), and the second one is done with electrical considerations (inverters and strings or arrays).
The two clusterings have different scopes: the geometrical one is designed to simplify the interaction with maintenance operators and is very useful for the extraction of information from UAV inspections, while the electrical one is used in the performance evaluation, forecasting, and optimization of the plant.
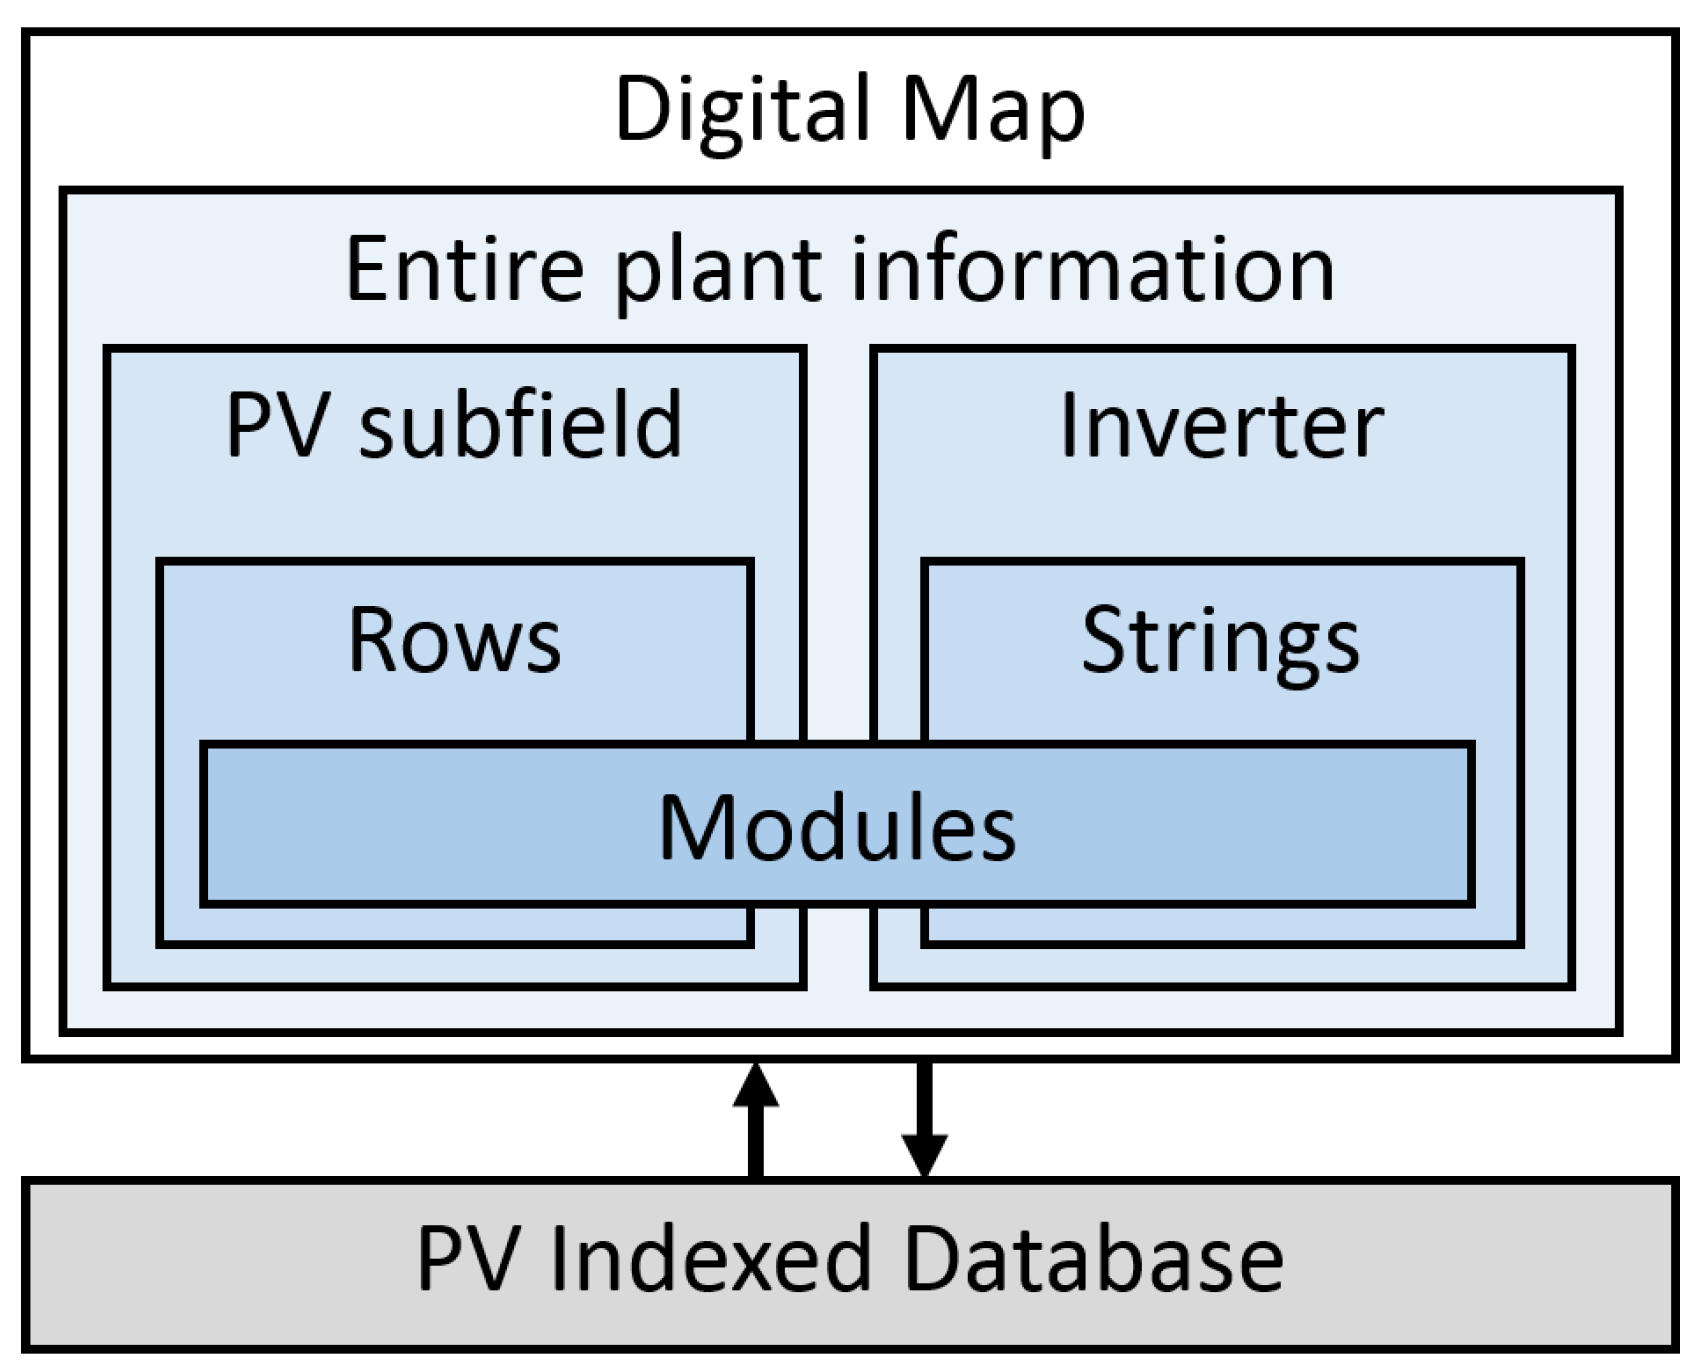
The information can be accessed by the user in different ways, according to the specific goal. The information has been classified according to the conceptual scheme proposed in
Figure 3—this has been obtained from the experience accumulated over years of inspections and interactions with different O&M operators. The left part of the image shows the clustering based on geometrical considerations, while the right side shows the clustering via electrical considerations. The number of layers available for the user depends on the size of the PV plant and the availability of information.
At the most general level, the plant is considered as a whole—it is possible to access general information, such as plant nominal data, plant location (that can be used to estimate the production of the plant for business analysis), aggregated information (such as the total production or performance ratio [
17]) and other macro-information, like measurements by in-field sensors.
Regarding the geometrical clustering, the first layer can be the subfield, that is, a part of the plant that can be easily individuated for its position. In this layer, only aggregated data are accessible—the total number of modules and the percentage of criticalities (the criticality level can be differentiated to have a set of alerts), and the inspection date, if different subfields are inspected on different days.
Subfields can be divided into rows, which should be easy to find both in the pictures and in the maintenance activities—they do not always correspond to the electrical strings. In this layer, it is possible to access the position of the row in the plant, where some are aggregated data, like the number of healthy and damaged modules in the row, and it is possible to find the identification (ID) index of all the modules of the row that can be exploited to give the user easy access to the single module information.
For what concerns the electrical clustering, a further layer can be created considering each single inverter and all the strings connected to it. The information available in this layer can be datasheet information of the inverter itself, the ID of the strings connected to the inverter, and electrical aggregated data measured with the inverter Supervisory Control and Data Acquisition (SCADA) control interface.
SCADA systems are aimed at acquiring data from remote devices—they are often used for managing the operations of assets, but their data can be processed for obtaining information of the health status of the plant and, thus, on its profitability. Traditional and innovative SCADA technology enables plant users to collect data from one or more facilities, and limited control instructions are sometimes implemented. The new IoT paradigm opens up great potential services (e.g., PV coupled with Storage and new features in the context of plant digitalization and the Industry 4.0 context—for example, also using optical character recognition (OCR) systems) [
18].
More detailed clustering with electrical consideration is composed of electrical strings. This layer can be relevant to evaluate the impact of each defect on plant productivity, and thus can be exploited in the further business analysis of the plant.
The basic layer of the database is represented by the modules. This is the most important level and the one in which most of the information are contained. The basic information contained is a module ID (it can be the serial number, if available, or a unique identifier in the plant), its position in the plant (that is, the indexing), visual and IR captured images at a certain time, and classification of the defectiveness, which can be obtained by image-processing and be approved or modified by the user. Other information can also be added, like datasheet information, the I–V curve if available, insulation test, electroluminescence data, and all other information that is available and related to the single module.
Another very important aspect of the database is the fact that most of the information described above depend on time—thus, it is possible to analyze the variation of the plant performance indexed with time.
The indexing of the images acquired by the UAV is a critical aspect, because a huge amount of information is gathered and their manual insertion can be a time-consuming process which may carry errors.
4. UAV Information Indexing
The creation of the database starts from the large set of images and inspection logs acquired by the UAV. This step is fundamental because it allows for correct indexing in the database, adding new information to update the status if a former aerial inspection already exists.
The acquired pictures should be mapped to the digital drawing of the plant, usually created by Computer-Aided Design (CAD) software and provided by the plant designer. This mapping is very useful, because it allows for the easy understanding of the position of the defects. The mapping procedure is based on the indexing of the modules recognized from the pictures with a proper identification procedure that avoids double-counting [
8].
In this procedure, the rows are automatically created, while the division of the rows in subfields should be forced by the user.
The indexing procedure is divided by the following steps:
Association of each picture to its row, exploiting the logs’ files containing GPS positioning and time. In this phase, the row is a generic one and is identified only by means of its relative position with the other rows;
Association of the created rows to the real rows of the PV plant, performed by means of the CAD file. This step is fundamental to create a map that is linked to the real PV plant;
Processing of all the pictures for the single module identification and counting.
The first two steps can be drastically improved and the user interaction eliminated if an automation system is added to implement a fully autonomous planning of the flight [
19].
4.1. Identification of the Rows
The first step of the indexing procedure is the identification of the rows. It is performed using the log file in which, for each picture, the GPS and time data are extracted and stored.
A combination of GPS and time information is used to cluster the pictures in rows: in fact, when the row is modified, a discontinuity appears in the data.
In this way, it is possible to associate at each row the pictures that contain its modules. Moreover, it is possible to approximately identify the barycentric position using the GPS coordinate system. The flow-chart of this step is shown in
Figure 4a.
This step makes the prior classification of the pictures in rows redundant (generally done during the inspection phase), thus shortening the inspection time and improving the overall efficiency.
This information has two different uses: firstly, it establishes the relative position between rows; secondly, it can be exploited in other inspections to completely avoid, or just to reduce, the user interaction in the next phase.
4.2. Association to CAD Information
After having grouped the pictures in rows according to the inspection data, it is required to map them to the PV plant coordinate system. This step improves the visualization of the data, helps the O&M companies, and allows for clustering in subfields.
This step creates a clear and unambiguous link between the PV plant and its digital representation. It requires, at least in the first inspection, an interaction with the users for finding the proper mapping parameters.
The first action performed by our system is to elaborate the CAD file aiming to find the barycentre positions of the rows in the plant coordinate system.
Once the transformation has been computed, each array is mapped to the CAD coordinates of the closest CAD array barycentre. This allows for the precise identification of each row. The flow-chart of this phase is described in
Figure 4b.
4.3. Module Identification
This is an important step of the procedure, because the pictures of the rows are processed further in order to identify the single module. In order to perform this identification, it is required to have a partial overlapping between the pictures. This overlapping, while fundamental to recognize the relative position between two pictures, can lead to the problem of multiple images for each module.
An accurate visual module identification is also a hard task for experienced operators. In fact, each image contains a variable number of modules in different positions depending on the drone’s height, pitch, roll, and yaw. Finally, each module is isolated, converted to an orthogonal view (rectification), and added to a separate database.
In theory, this phase should be repeated both for visible and IR images, but this can be drastically simplified if the pictures are taken with multi-spectral or synchronized cameras.
After this step, the indexing of the modules in the PV plant is created, and for each module it is associated with a high-resolution, non-distorted image, both in RGB and IR. With these data, it is possible to analyze the defectiveness status.
5. Test Case
The test case adopted for assessing this method was a PV plant in North Italy. The aim of this was to show and validate the indexing phase and to show some features of the Digital Map.
The plant was a 4.75 MW ground plant; during the inspection, only 2 MW was inspected by an exacopter UAV due to time constraints. The exacopter (shown in
Figure 5) was equipped with two synchronized cameras: an optical camera (Lumix DMC-G1) and a thermal camera (FLIR A65). Both these cameras were designed for UAV applications, and their sampling rate could be set by a proper controller. In the specific application tested, the sampling rate of 1 frame per second was used, because it guarantees a good trade-off between the overlapping required by the post-processing algorithm and the inspection time. The thermal camera had a resolution of 640 × 512 pixels, while the visual camera had a resolution of 4592 × 3448 pixels to guarantee a ground resolution of 10 pixels per centimetre at an average flight height of 10 m [
20]. These cameras guaranteed a very large temperature range, from −40° to +135°.
The inspection was done using UAV technologies with two synchronized cameras, one for the RGB and one for the IR images. The flight was performed with the following procedure: the UAV was kept at a height of around 10 m to have enough resolution in the images, each row was inspected within a flight, and between two rows, a certain time passed without any picture (the sampling time was one picture per s, while the empty time was between 20 s and 60 s).
The GPS log file contained the name of the IR picture, GPS information (date and time, longitude and latitude), and flight information, such as height, speed, and direction.
In this inspection, the total number of acquired pictures was 1788, which were randomly stored in a flight folder. The corresponding number of modules is 10,250.
Figure 6 shows a screenshot of the tool reporting the position of all the acquired pictures in the GPS reference systems. The tool was designed to have on the top-left the list of the action required: the actual one is with the orange circle, the actions done have the green dot, and the actions already done are in red. On the bottom-left, the status is of the action performed is shown—in this case, it details that 1788 images have been processed out of 1788 visual files and 1788 IR files. On the right of the image, the result of the activity performed is shown: each dot corresponds to a picture identified.
Considering the acquisition time of the pictures, it is possible to define the end of each row. In fact, between the final picture of a row and the first one of the following, there is a higher acquisition time. Thus, by calculating the time delay between two pictures in succession, it is possible to extract the peak’s delays that correspond to a row change.
The results of the row identification are shown in the tool, as shown in
Figure 7. The division of the screen is the same of
Figure 6, where in this case, the first dot on the top-left is green because that step has already been performed. In the results of the row identification, shown in the right side of the window, the different rows are identified with different colors and, for each row, the barycentre has been automatically evaluated (black circles).
In order to have a correspondence between the real position of the rows and the positions estimated from the GPS data, the CAD drawing of the plant was processed. The barycentre positions were estimated with a combination of image-processing techniques and ad hoc filters requested due to the specific plant configuration, that is, the horizontal division in two rows of the central part. This can be acceptable in the process, because this activity has to be done just once for each plant since its geometry is fixed.
The window of the CAD analysis in the tool is shown in
Figure 8, where 132 rows have been identified. In the right side of the window, the CAD file is shown—the colours represent the different kind of modules in the PV plant, and the black dots are the estimated barycentres.
Having this information, it is possible to estimate the geometrical affine transformation needed for mapping the rows in the PV plant [
21]. At this point, it is possible to analyze each row with image-processing techniques to identify the number of modules and to associate to each module its visible and IR pictures [
8].
At this point, all the modules are correctly indexed in the database. The division in the subfields can be done by the user: the software provides some suggestions, but further considerations can be included regarding the specific maintenance protocols used. For example, in the test case, the O&M operator decided to divide the central part of the PV plant into two subfields. The division in the subfield can be seen from the implemented tool in
Figure 9.
After having properly indexed the images in the dataset, they were processed to find the defects in the IR and visible images. This operation is independent from the previous one, and it makes the tool very flexible because it can be integrated with different processing software.
An important aspect that has been introduced with the Digital Map is the visualization of the results. In
Figure 10, the subfield 1 is shown. Some aggregated data are available and the rows are coloured proportionally to the defectiveness rate. Red rows are the ones in which there are more defects detected, while the green are healthier (a proper threshold, fo example, 1–3%, 3–5% can be selected by the operator). The software also detects dirty modules even if they are not proper failures.
From this layer of the digital map, the user can select the row by clicking on it. This opens a new window in which the details of the selected rows are shown, as presented in
Figure 11: on the top-right, there is a summary of the defects identified; on the bottom, there is the visual and IR view of the rectified modules.
The boundary of each module is representative of the defect identified: green means healthy modules, in the orange, the hot spot, in red, the bypass diode, and in black, the disconnected modules.
Then, it is possible to select each module and to show all its the detailed information, a larger view of the pictures, its history, and test information if available.
Figure 12 shows an example of the view of a single module.
The advantages of the proposed system can be quantified by the time saved in both the inspection phase and in the post-processing.
Table 1 shows a comparison between the time required by the different activities with manual inspection, UAV inspection, and the proposed technique.
In the data-collection phase, the performance improvement is due to the presence of the UAV. For the manual time, a complete sampling of a ground plant is considered—the time is drastically increased for rooftop plants.
The data indexing is much faster for manual inspection, because it is possible to keep track of the module order, while for standard UAV with human intervention, it is harder because several stochastic variables (wind speed, perturbation of the flights) are present.
Regarding the image-processing, it is usually performed by an operator in manual inspection, meaning the required time is higher and dependent on human experience, while the time required by the two UAV-based systems is comparable. Finally, the digital map provides a very effective data representation tool, so the preparation of reports is drastically faster.
The proposed system has been tested over a subsection (2 MW) of a 4.75 MW plant. The pictures, acquired by the UAV, were collected and processed by the implemented algorithm, and the results were checked by an operator. In this way, the results obtained by the tool have been compared with the expert’s ones.
Two types of accuracy have been measured: the first one is the accuracy of the indexing, that is, the capability of the software to properly associate to each module its the correct visible and IR images. The second one is the accuracy over the classification of the defects in the images. The amount of correctly indexed modules was 94.6%, while the defect recognition had an accuracy of 92.1%. For what concerns the indexing performances, it is important to notice that the software is robust, meaning that a mistake for a module does not affect the others.
6. Conclusions
The main focus of this paper was to propose an advanced tool to perform PV plant digitalization based on sensored UAV flights, mainly for monitoring and control actions in O&M and asset management activity. Certainly, such a tool represents a useful framework and data management source to perform additional services, like alarming or decision support systems, and can expand its potential usefulness if further technological sources are implemented in the specific plant, such as IoT-based SCADA systems and OCR software to convert typical paper documents produced during maintenance activities.
In this paper, an information system for photovoltaic plants was designed. The proposed system is made of two parts: the database, called the Photovoltaic Indexed Database (PVID), and the user interaction tool, called the Digital Map. The indexing of the information in the database was described and shown with a real test case.
The time saved and the accuracy were quantified with a real test case, in which the system was applied on a 2 MW PV plant.
Future developments of this project and critical aspects to be fixed are of different natures. Deep-learning can be exploited for improving the defect recognition, while the automation of the flight can improve the image indexing performances. Finally, the potentialities of additional information availability should be exploited for predictive and prescriptive maintenance and IoT-based SCADA system integration.


