Article

The Influence of Torrefaction Temperature on Hydrophobic Properties of Waste Biomass from Food Processing

by
Arkadiusz Dyjakon
1,*,
Tomasz Noszczyk
1 and
Martyna Smędzik
2
1
Institute of Agricultural Engineering, Wroclaw University of Environmental and Life Sciences, 51-630 Wroclaw, Poland
2
Student Science Association BioEnergy, Faculty of Environmental Science and Technology, Wroclaw University of Environmental and Life Sciences, 50-363 Wroclaw, Poland
*
Author to whom correspondence should be addressed.
Energies 2019, 12(24), 4609; https://doi.org/10.3390/en12244609
Submission received: 12 November 2019 / Revised: 30 November 2019 / Accepted: 2 December 2019 / Published: 4 December 2019
(This article belongs to the Section A4: Bio-Energy)

Abstract

:
The annual potential of waste biomass production from food processing in Europe is 16.9 million tonnes. Unfortunately, most of these organic wastes are utilized without the energy gain, mainly due to the high moisture content and the ability to the fast rotting and decomposition. One of the options to increase its value in terms of energy applications is to valorize its properties. Torrefaction process is one of the pre-treatment technology of raw biomass that increases the quality of the fuel, especially in the context of resistance to moisture absorption. However, little is known about the influence of torrefaction temperature on the degree of valorization of some specific waste biomass. The aim of this paper was to analyze the influence of the temperature of the torrefaction on the hydrophobic properties of waste biomass, such as black currant pomace, apple pomace, orange peels, walnut shells, and pumpkin seeds. The torrefaction process was carried out at temperatures of 200 °C, 220 °C, 240 °C, 260 °C, 280 °C, and 300 °C. The hydrophobic properties were analyzed using the water drop penetration time (WDPT) test. The torrefied waste biomass was compared with the raw material dried at 105 °C. The obtained results revealed that subjecting the biomass to the torrefaction process improved its hydrophobic properties. Biomass samples changed their hydrophobic properties from hydrophilic to extremely hydrophobic depending on the temperature of the process. Apple pomace was the most hydrophilic sample; its water drop penetration was under 60 s. Black currant and apple pomaces reached extremely hydrophobic properties at a temperature of 300 °C, only. In the case of orange peels, walnut shells, and pumpkin seeds, already at the temperature of 220 °C, the samples were characterized by severely hydrophobic properties with a penetration time over 1000 s. At the temperature of 260 °C, orange peels, walnut shells, and pumpkin seeds reached extremely hydrophobic properties. Furthermore, in most cases, the increase of torrefaction temperature improved the resistance to moisture absorption, which is probably related to the removal of hydroxyl groups and structural changes occurring during this thermal process.

Graphical Abstract

1. Introduction

Constantly growing demand for electricity and the limitation of fossil fuel resources increases the importance of new, renewable energy sources (RES). In order to ensure energy security and environmental protection, many types of research are focused on new and environmentally friendly fuels [1,2]. In past years, a lot of attention was paid on biomass having a third place in the world in terms of energy potential [3]. Poland is characterized by high biomass feedstock potential and low costs of biomass processing as in Romania, Bulgaria, Ukraine, and the other Baltic States. It is estimated that the Polish biomass potential by 2030 would amount to 1.5 EJ∙y−1, taking fourth place in Europe (EU) [4]. The data analysis performed by the European Commission (EC) within the European Union (EU) showed that around 88 million tonnes of food waste are generated annually with associated costs estimated at 143 billion euros. Food wastes generated during food processing have amounted to 20% (16.9 million tonnes) [5]. A part of the biomass comes as waste from the agri-food industry like pomace, peels, and shells. The recovery rate of this waste group is high and amounts very often more than 95% (e.g., 96% from the beverage industry or 84% from the sugar industry). In Poland, only 0.1% of the agri-food industry waste is stored. If possible, this kind of waste is most often used in biogas or a composting plant [6]. However, access to the biogas plant is very often limited (too long distance), and the biomass composting is related to the utilization costs. Biomass can be used in several other ways, such as combustion or co-combustion. However, direct use of fresh and unprocessed biomass is difficult in transport and storage, despite its friendly nature [7]. Raw biomass from food processing is characterized by high moisture content, low bulk density, low heating value, and heterogeneous structure [8,9,10]. Additionally, biomass has hydrophilic properties, which makes it sensitive to external weather conditions [10]. Raw biomass has a tendency to quickly decompose. Moreover, fresh biomass storage creates favorable conditions for the growth of microorganisms and the rotting of the material [7]. In order to valorize the waste biomass and to eliminate these properties causing problems during transport and storage, three types of processing of fresh biomass are in use [11]: mechanical treatment, thermal treatment, and chemical treatment (Figure 1).
However, biomass can be used also in the acquisition of other organic substances like furfurals and C5 sugars. Catalysis and addition of solid catalysts for biomass conversion is an alternative to torrefaction for its processing. Nguyen et al. [12] and Matsagar et al. [13] investigated the production of furfurals from lignocellulosic biomass. Dutta et al. [14] produced carbon nanomaterials from biomass for flexible energy storage and supply devices.
Torrefaction (also known as low-temperature pyrolysis or high-temperature drying) is one of the most promising biomass valorization processes [15,16]. The process is carried out in the temperature range from 200 °C to 300 °C [17,18], in an oxygen-free (neutral) atmosphere, at atmospheric pressure [19], and with a residence time reaching 90 min [20]. Lack of oxygen atmosphere inhibits the combustion process, enabling thermal decomposition of torrefied biomass [21,22]. The basic scheme of biomass transformation during torrefaction is shown in Figure 2.
Usually, the torrefied biomass is characterized by much better physical and chemical properties than raw biomass. Torrefaction process causes degradation of hemicellulose and dehydration of cellulose and lignin [25], increasing its grindability [16,17]. Studies have shown that the oxygen to carbon ratio is reduced while the energy value increases [26,27]. The energy concentration takes place as torrefied biomass has ca. 70% of initial weight and ca. 90% of initial energy content [28]. As a consequence, part of the initial mass (30%) and energy (10%) is released in the form of process gases [24]. During the torrefaction, the moisture content is significantly reduced in the biomass material; hence, the moisture content of the torrefied material is only ca. 1–3% [16,29]. Additionally, the torrefied biomass is deprived of hydroxyl groups responsible for binding and absorption of moisture [30,31]. As a result, the biomass properties change from hygroscopic to hydrophobic [32,33].
One of the main parameters affecting the hydrophobic properties of biomass is the temperature of the torrefaction process. The temperature is important from an energetic point of view as it influences both the energy input required to perform the process and the final economic balance (torrefaction costs). Prins et al. [34] showed that a higher temperature of the torrefaction process required more energy to maintain the temperature in the furnace chamber. To heat the chamber and maintain an internal process temperature of 250 °C for 30 min and 300 °C for 10 min, the furnace required 87 (±0.449 J) kJ and 124 (±0.4) kJ of energy, respectively. This energy demand was determined for laboratory-scale research, and the mass of the torrefied sample was from 5 g to 10 g.
There are many publications and studies on the influence of the torrefaction process on the change of the hydrophobicity of the typical biomass material, like woody materials (chips, sawdust) or straw. Moreover, different methods may be applied for determination of hydrophobic properties of organic material, namely: the moisture uptake ratio [27,35], equilibrium moisture content assay (EMC) [36], the contact angle measurement test (CAMT) [37] and water drop penetration time test (WDPT) [38].
Sathpathy et al. [27] determined the change in hydrophobic properties of wheat and barley straw by moisture uptake ratio (lower moisture uptake ratio signified higher hydrophobic properties). The research showed that higher temperatures (higher power of heating) of the torrefaction process improved the hydrophobicity of the material. Wheat straw and barley straw torrefied in the microwave oven with a power of 200 W, 250 W, and 300 W and 10 min residence time in the reactor achieved the moisture uptake ratio: for wheat straw 0.83, 0.83, 0.75, and barley straw 0.94, 0.76, 0.70, respectively. Moreover, the increase of the residence time in the reactor (in constant conditions) caused a further decrease in moisture uptake ratio.
The hydrophobic properties of another material, applying an equilibrium moisture content assay (EMC), was investigated by Chen et al. [39]. The raw and torrefied biomass stalk was investigated in the process temperature of 220 °C, 250 °C, and 280 °C. According to EMC test, the achieved values were 10.8%, 7.1%, 5.6%, and 4.3%, respectively. Similar studies performed by Yan et al. [36] and Acharjee et al. [40] also confirmed that higher torrefaction process temperature affected positively the hydrophobicity.
The influence of the torrefaction temperature on the hydrophobic properties of biomass material was confirmed by Alvarez et al. [41] using the CAMT method. CAMT method consisted of measuring the opening angle between the tangent of the water drop to the ground (a larger angle indicates better hydrophobic properties). A raw sample was compared to the torrefied eucalyptus wooden samples at a temperature of 200 °C, 225 °C, 250 °C, 275 °C, and 300 °C. Samples were characterized by the contact angle of 93° ± 3, 97° ± 5, 101° ± 3, 106° ± 4, 113° ± 2, 118° ± 3, respectively. Higher torrefaction temperature caused an increase in contact angle, thereby causing hydrophobicity [41].
The dependence of hydrophobic properties on biomass thermal treatment was investigated by Baronti et al. [42]. In this research, the WDPT method (with Doerr’s et al. [43] hydrophobic properties classification) was used to determine the hydrophobicity of raw biomass and biochar. Raw biomass was characterized by hydrophilic properties, and its water drop penetration time was <5 s, while biochar was characterized by slightly hydrophobic properties with a penetration time <10 s [42].
However, in the literature, there are not too much data related to the torrefaction process and hydrophobicity of post-processing agricultural residues coming from food production. The aim of the study was to determine the influence of the torrefaction temperature on the hydrophobic propensities of selected organic wastes from the agri-food processing sector using the water drop penetration time test. The knowledge about the valorization options of these organic materials might help in decision-making in terms of their further treatment and application in other alternative energy flow chains.

2. Materials and Methods

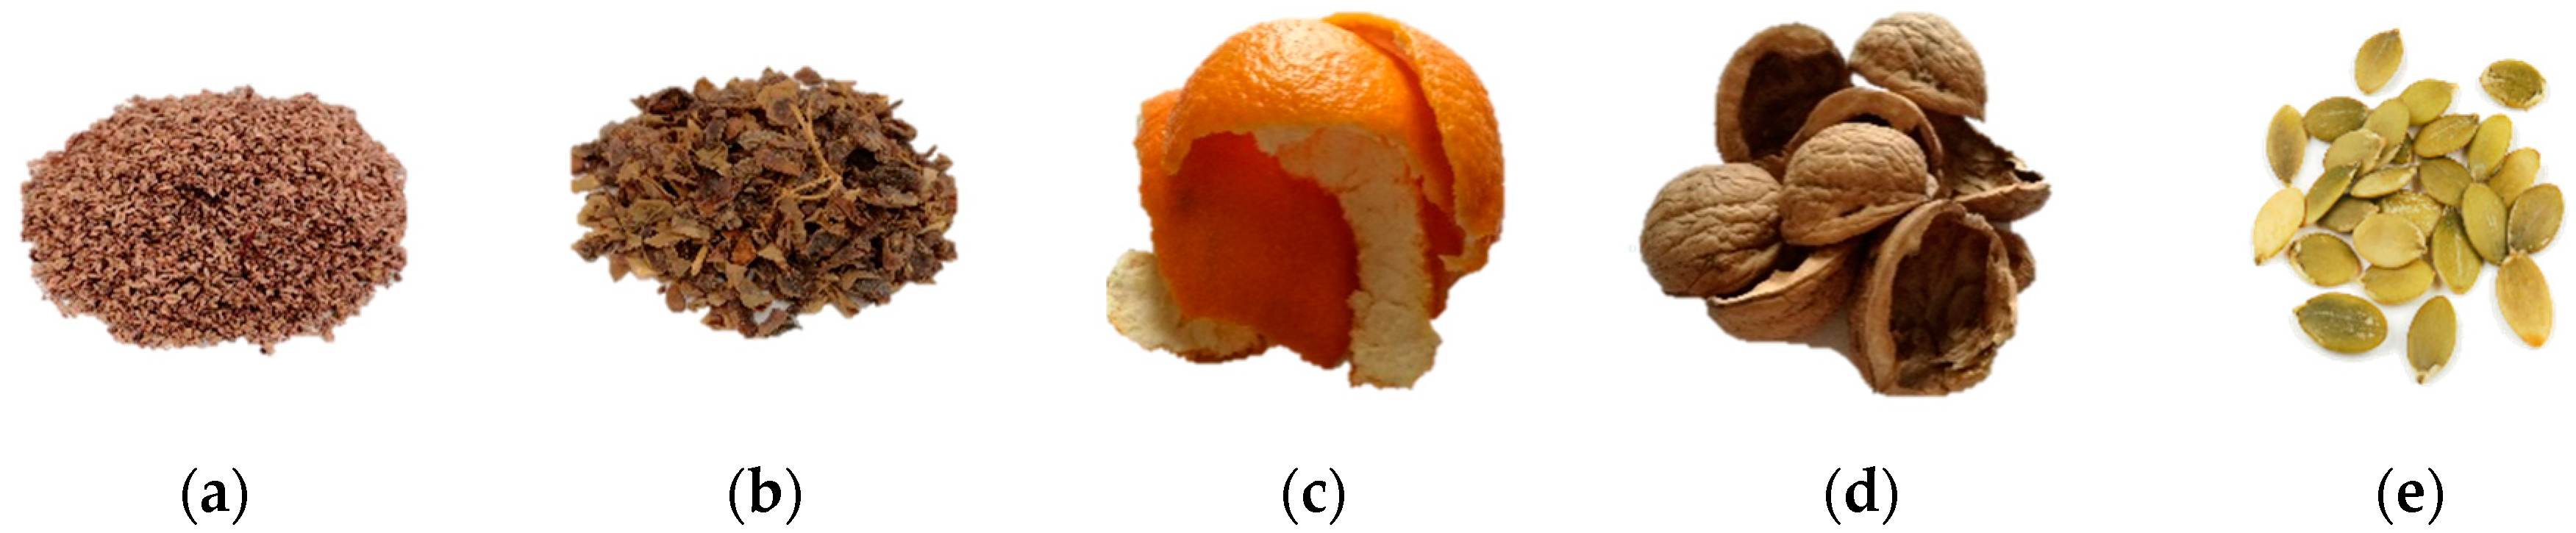
2.1. Materials Used in the Research

The aim of the work was to assess the effect of temperature of the torrefaction process on the hydrophobic properties of biomass wastes from food processing.
The subject of the research was different types of biomass wastes from food processing: fruit pomaces, peels, husks, and seeds. In detail, five types of food biomass waste were investigated (Figure 3): black currant pomace (a), apple pomace (b), orange peels (c), walnut shells (d), and pumpkin seeds (e).

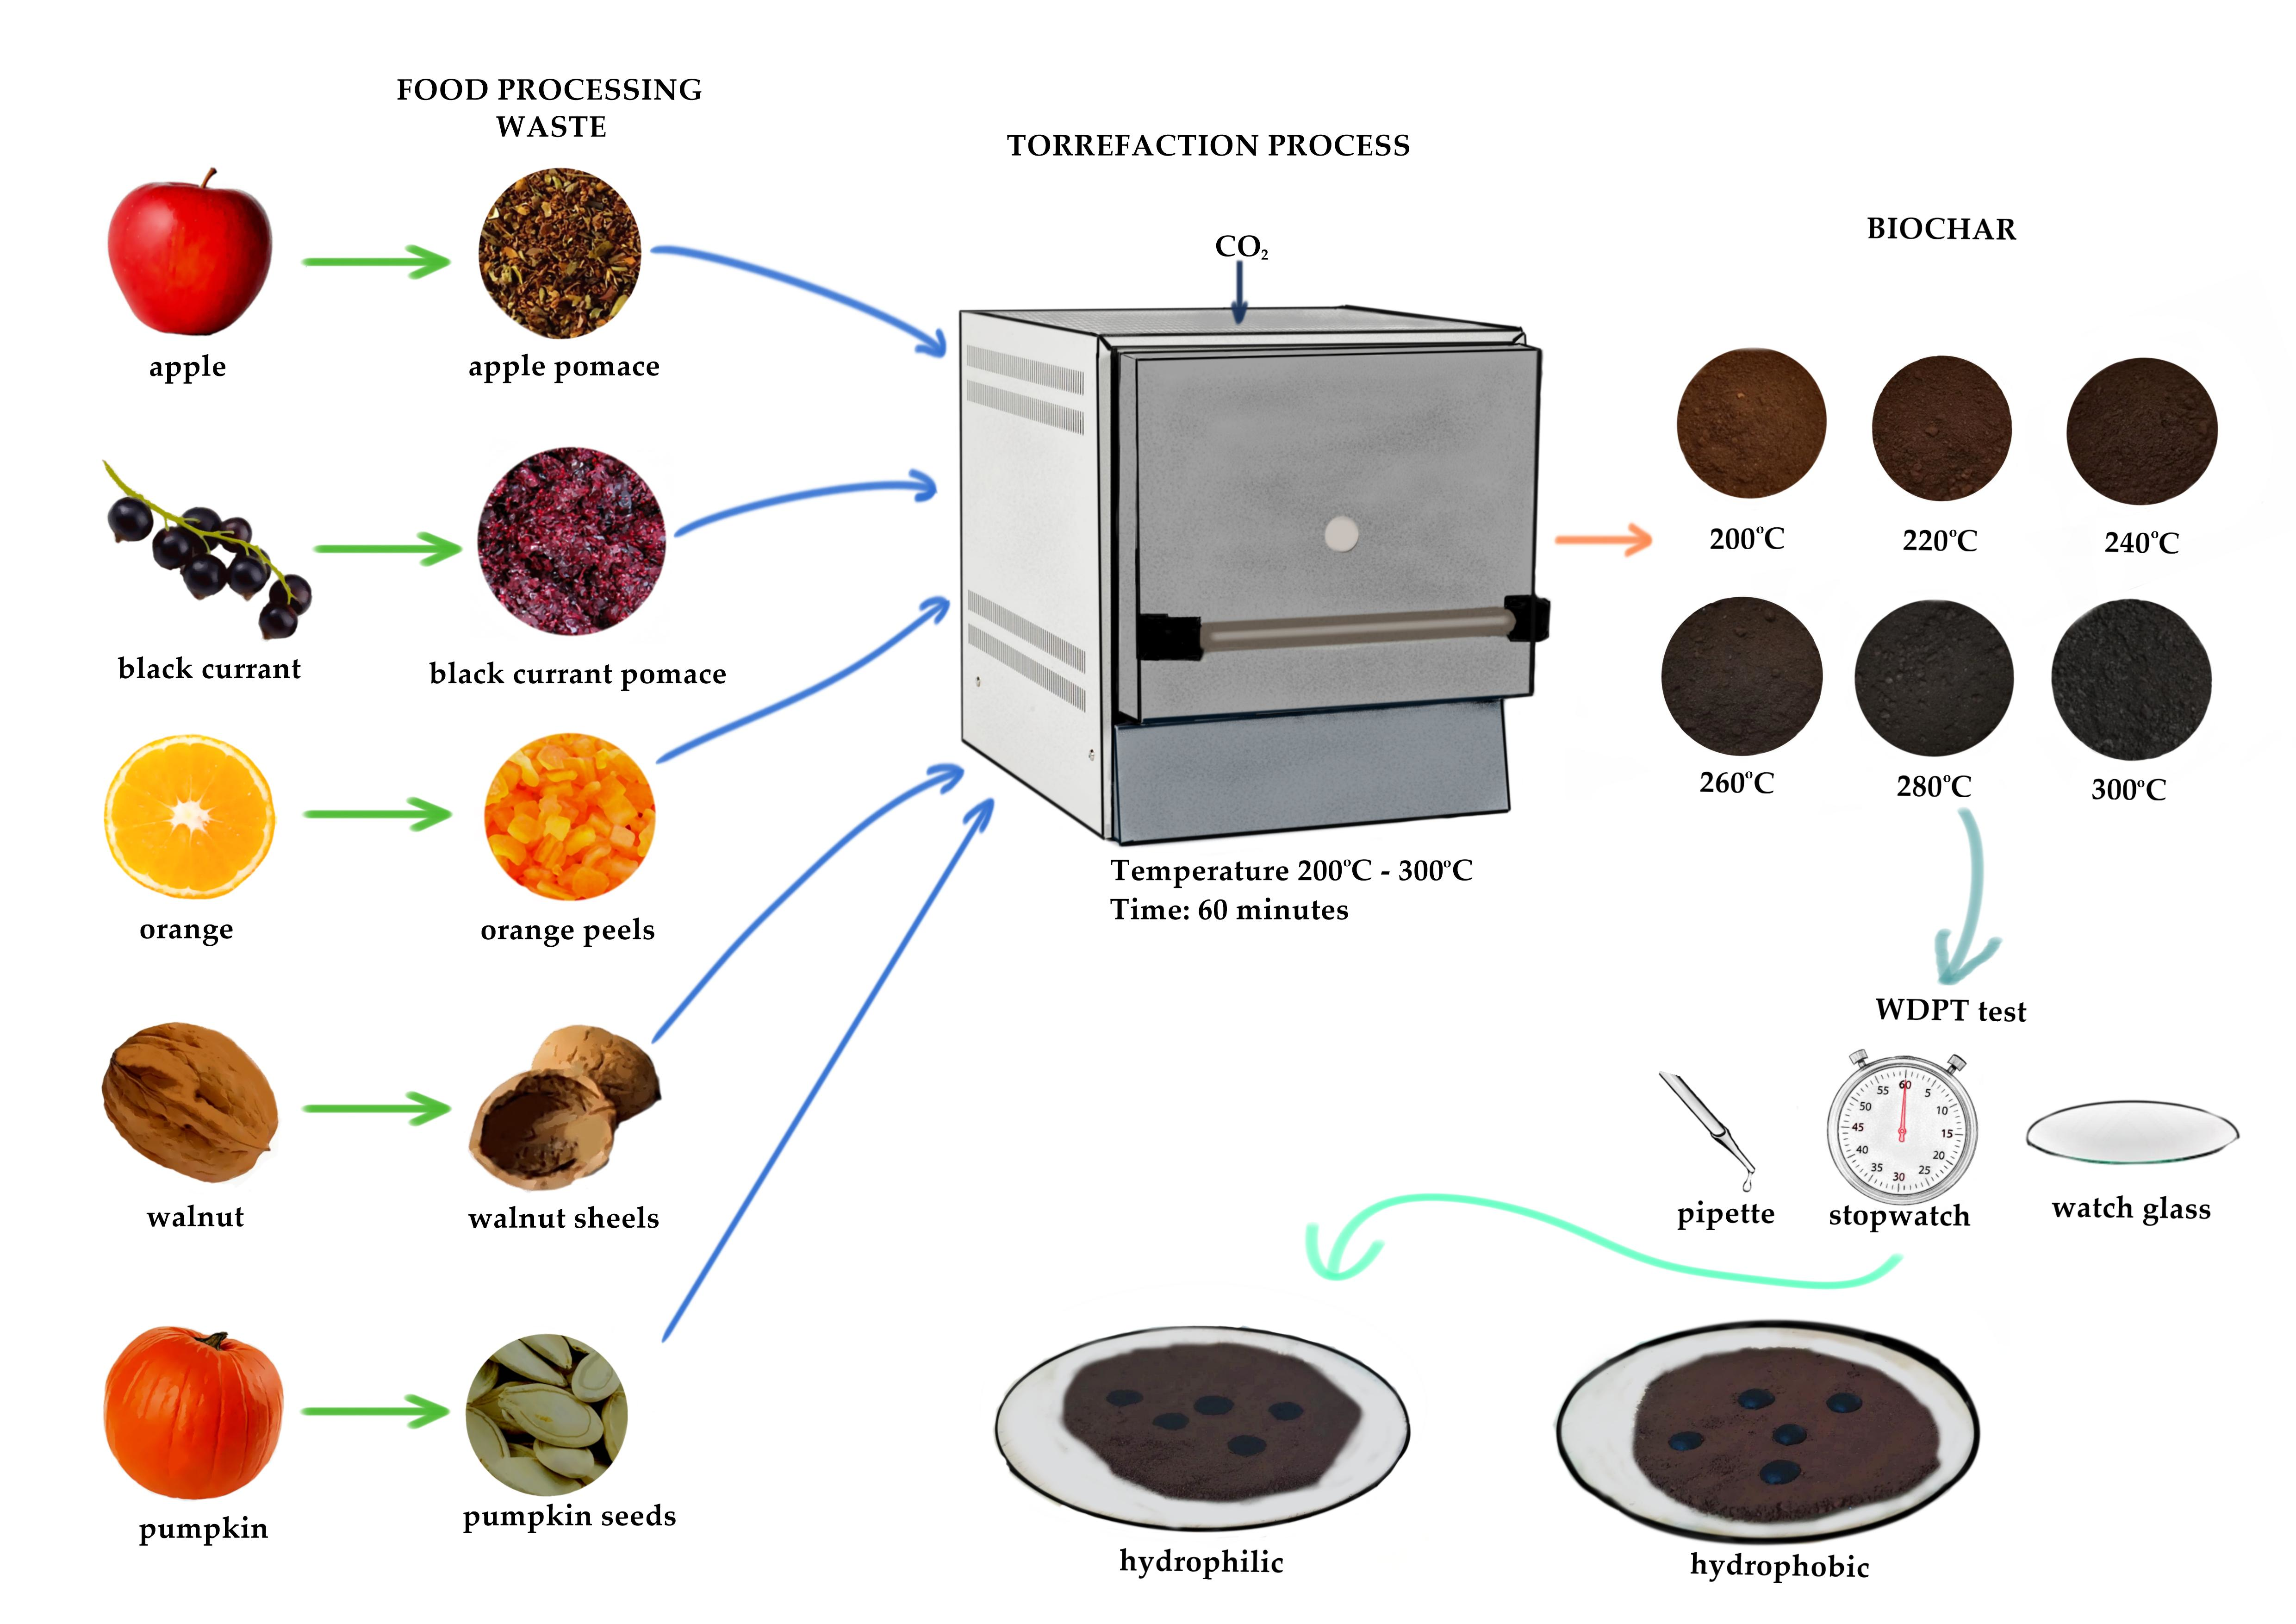
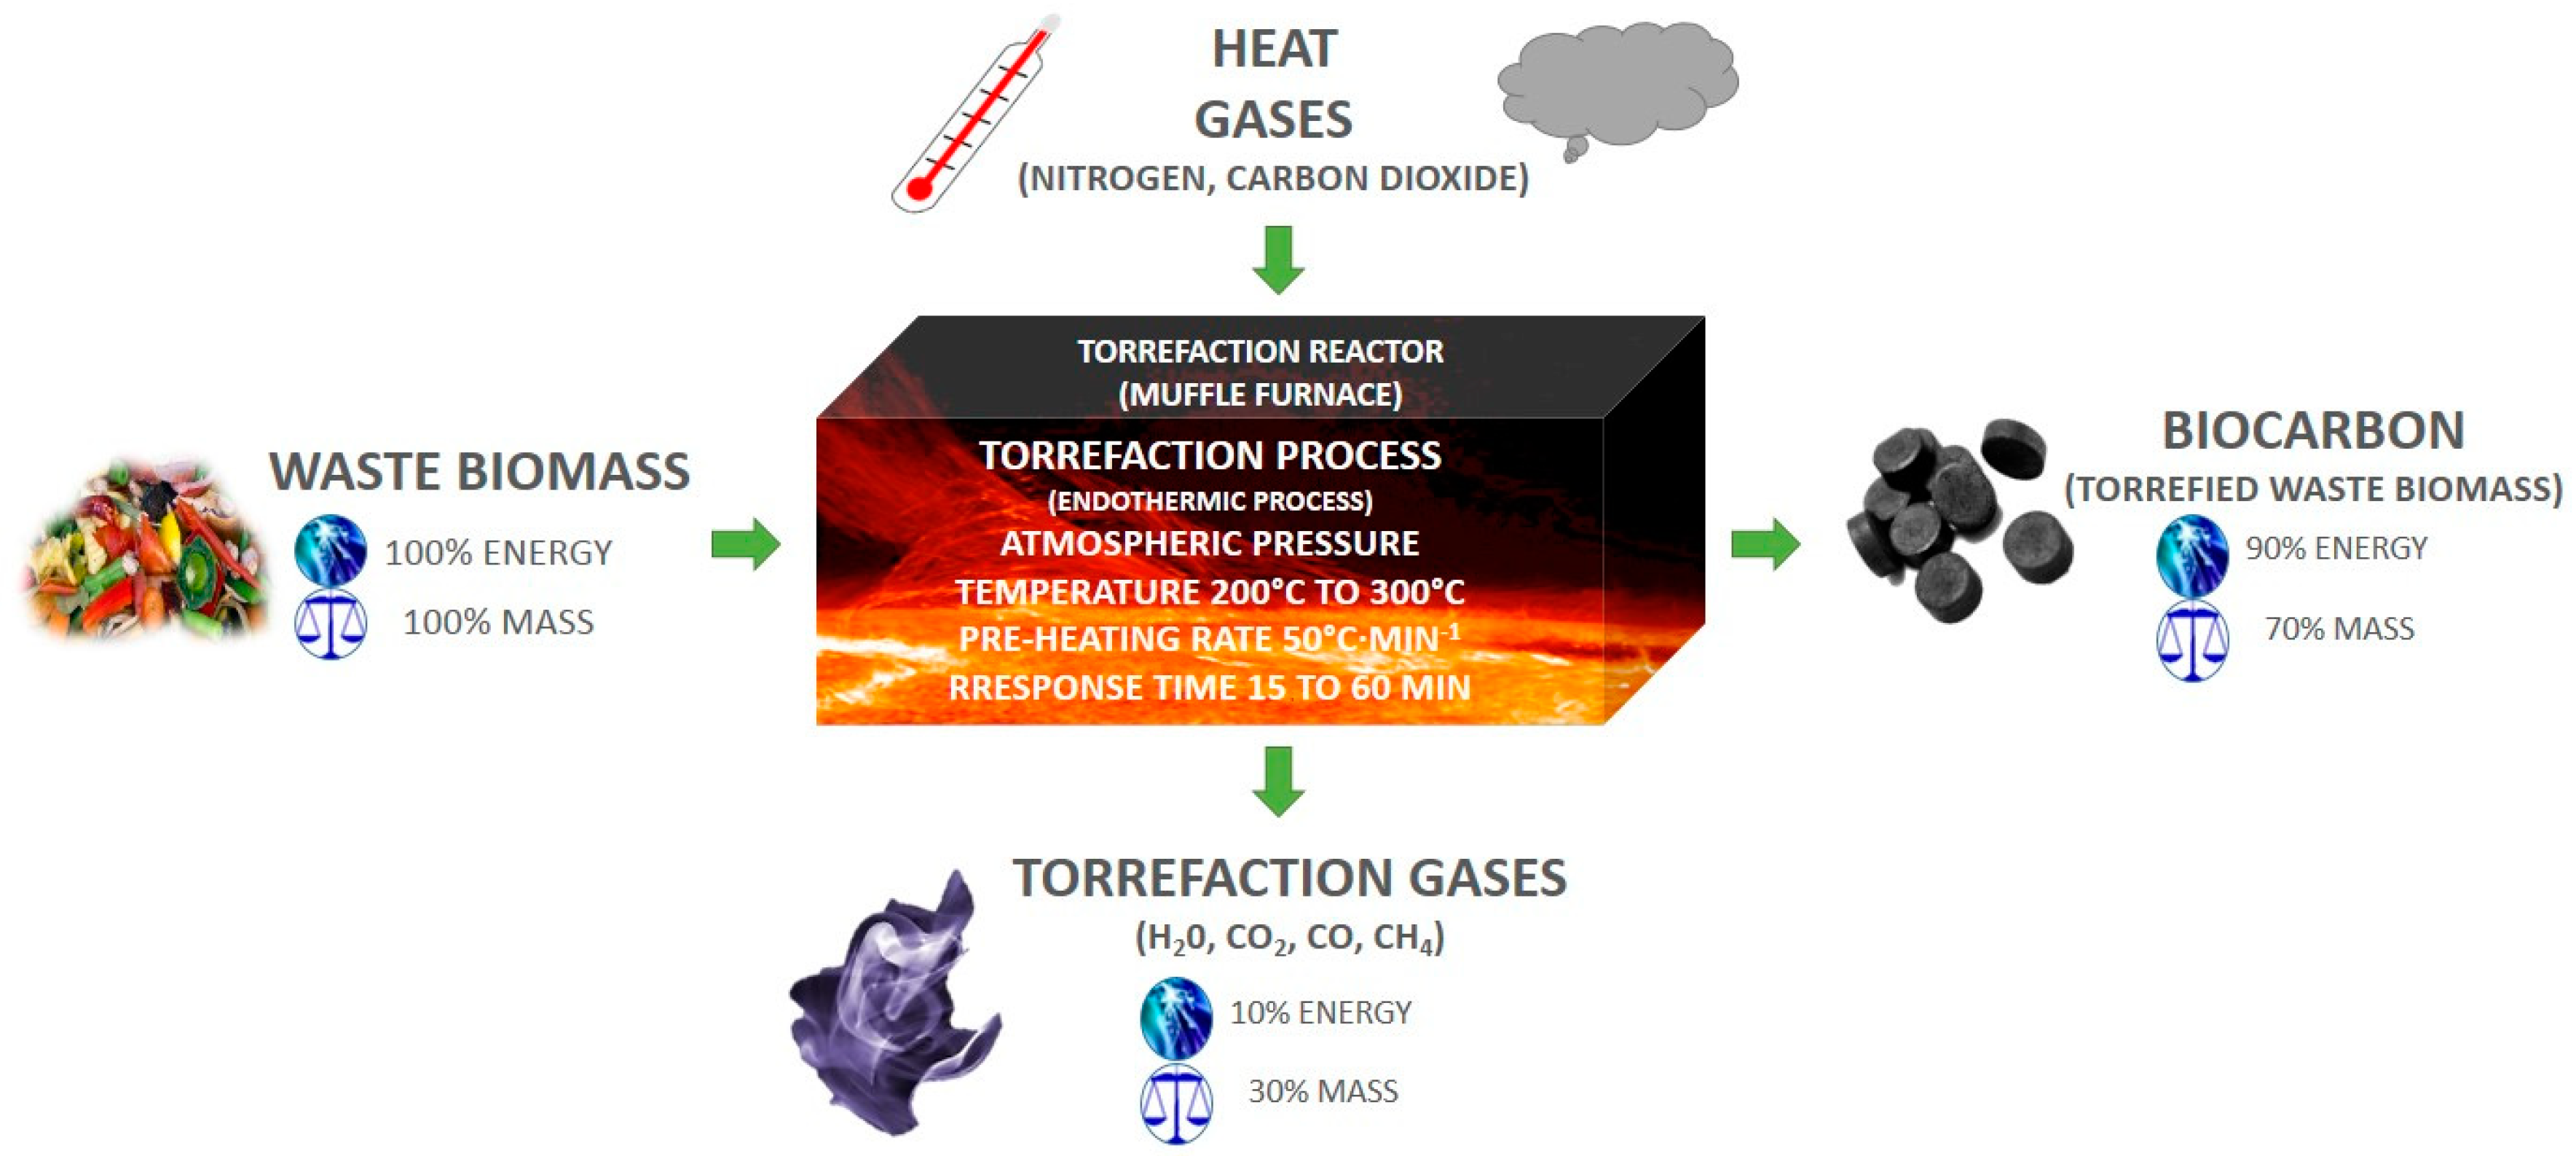
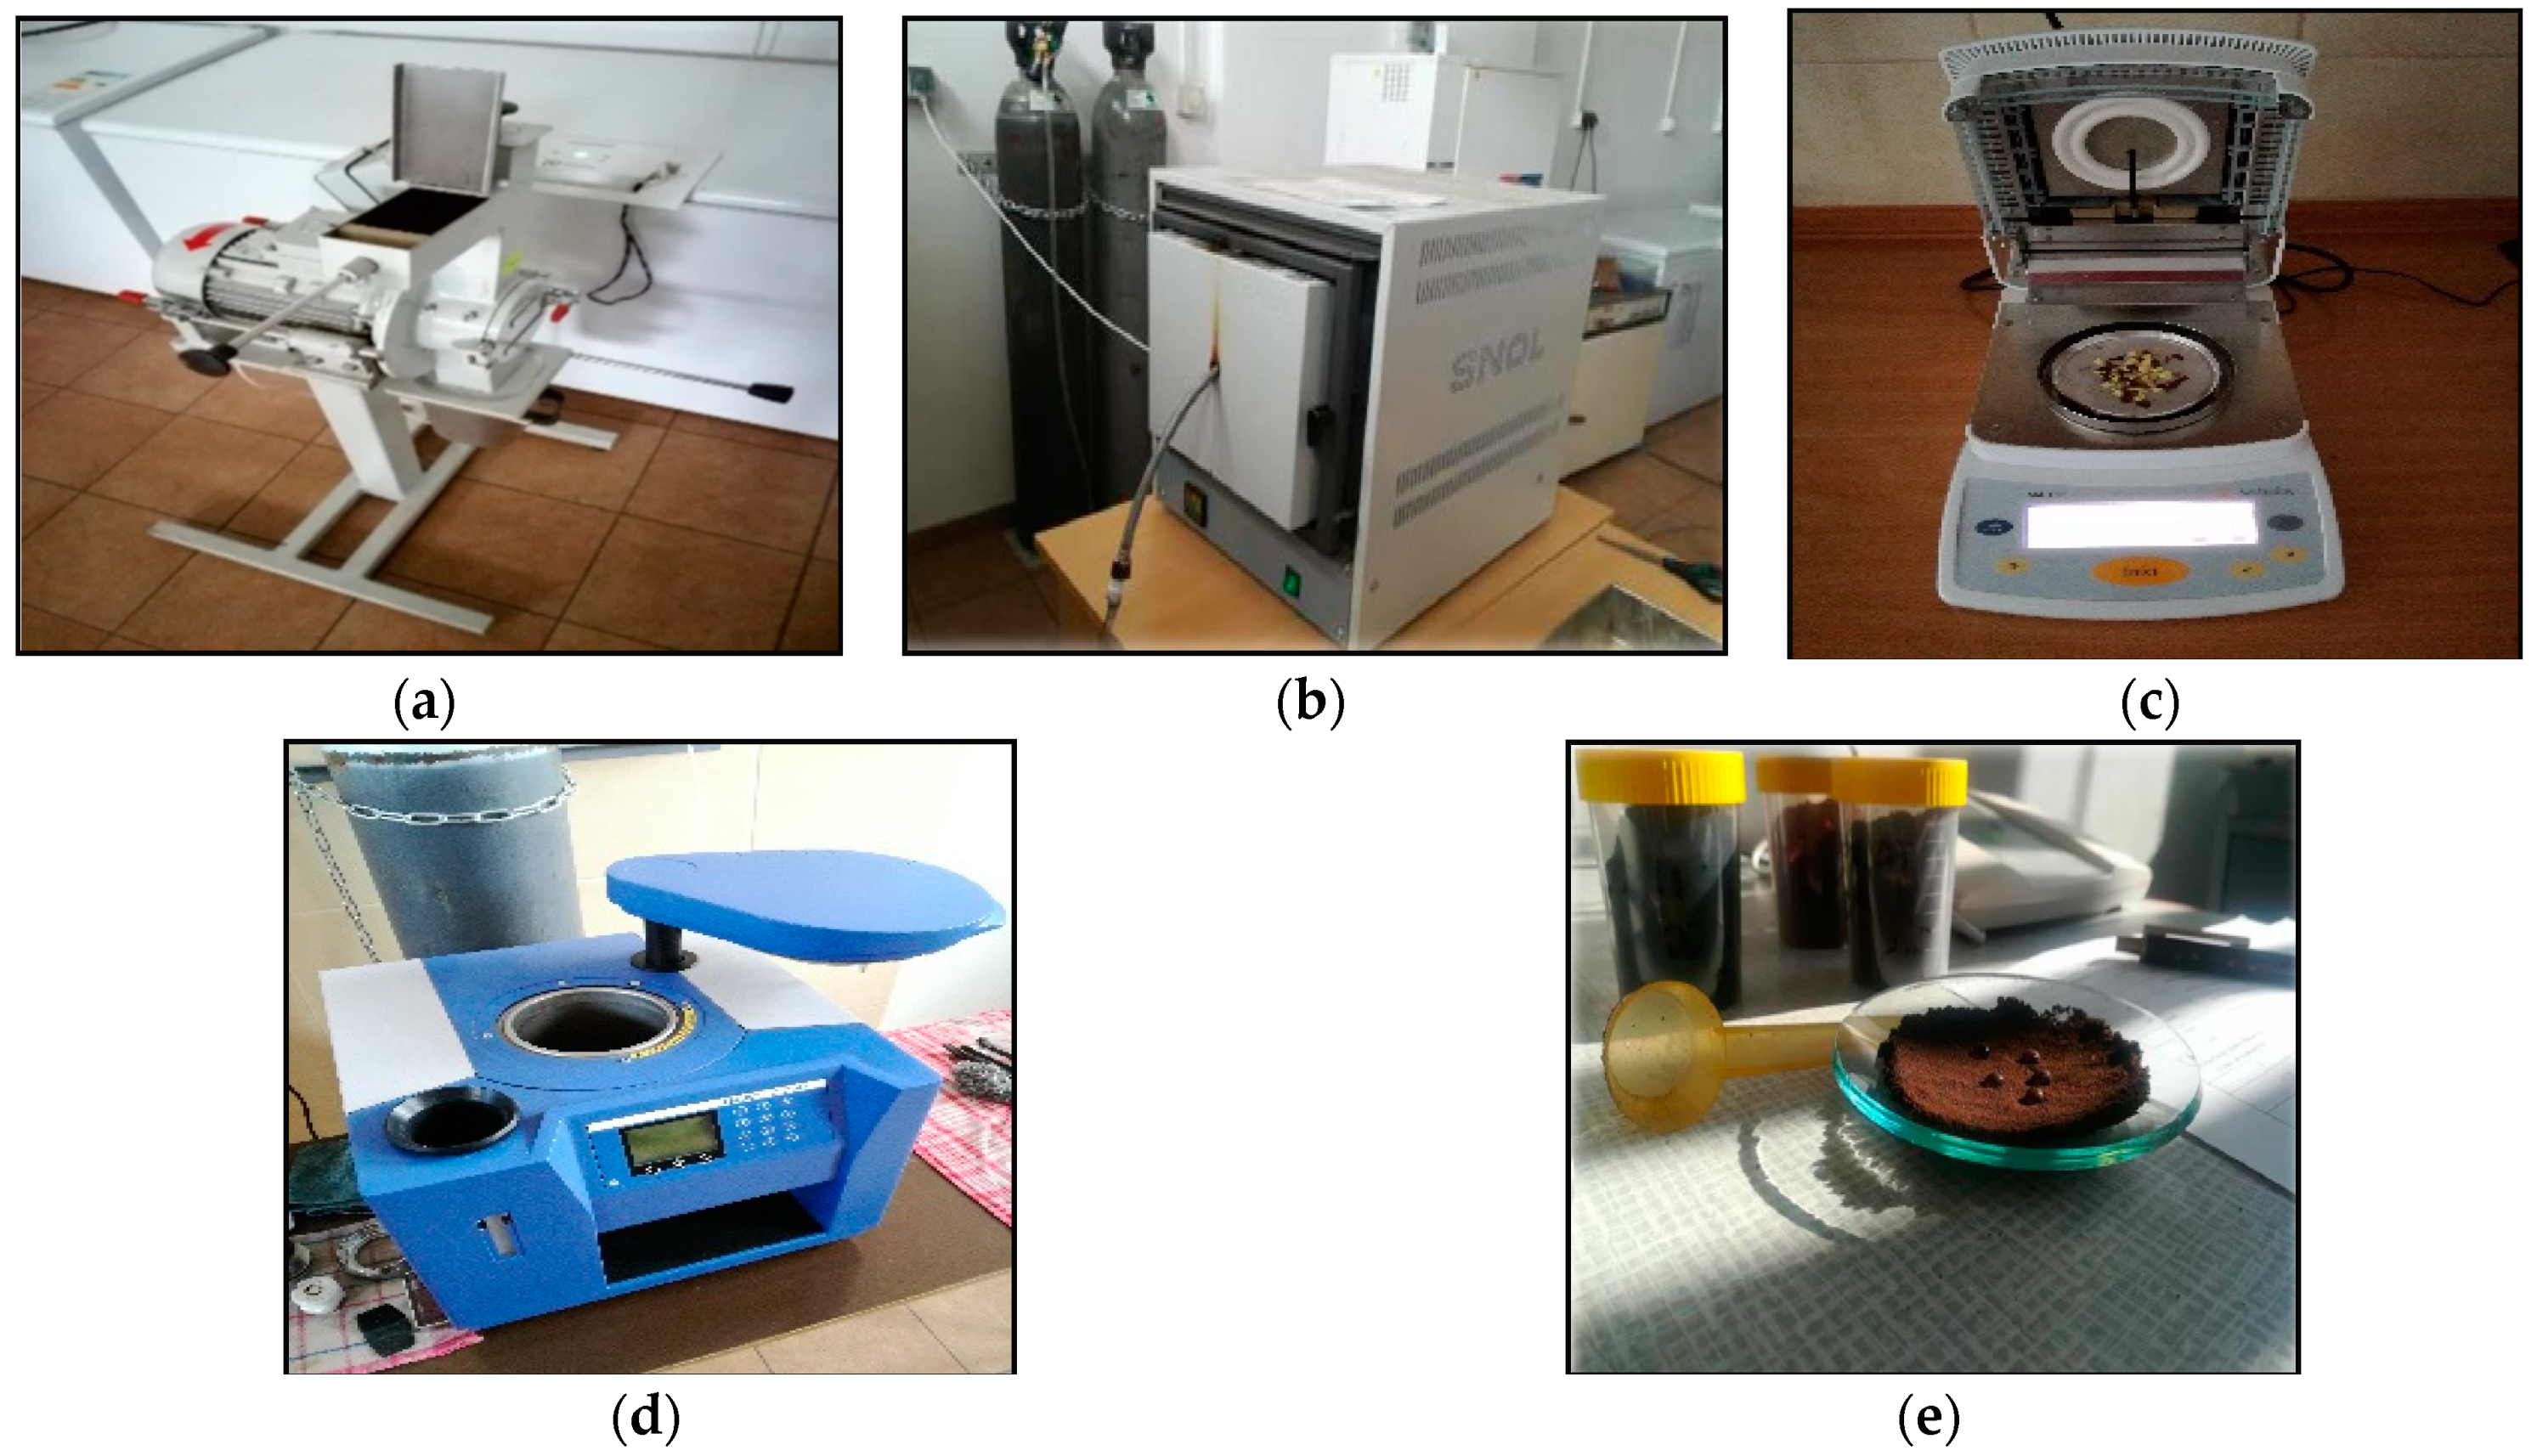
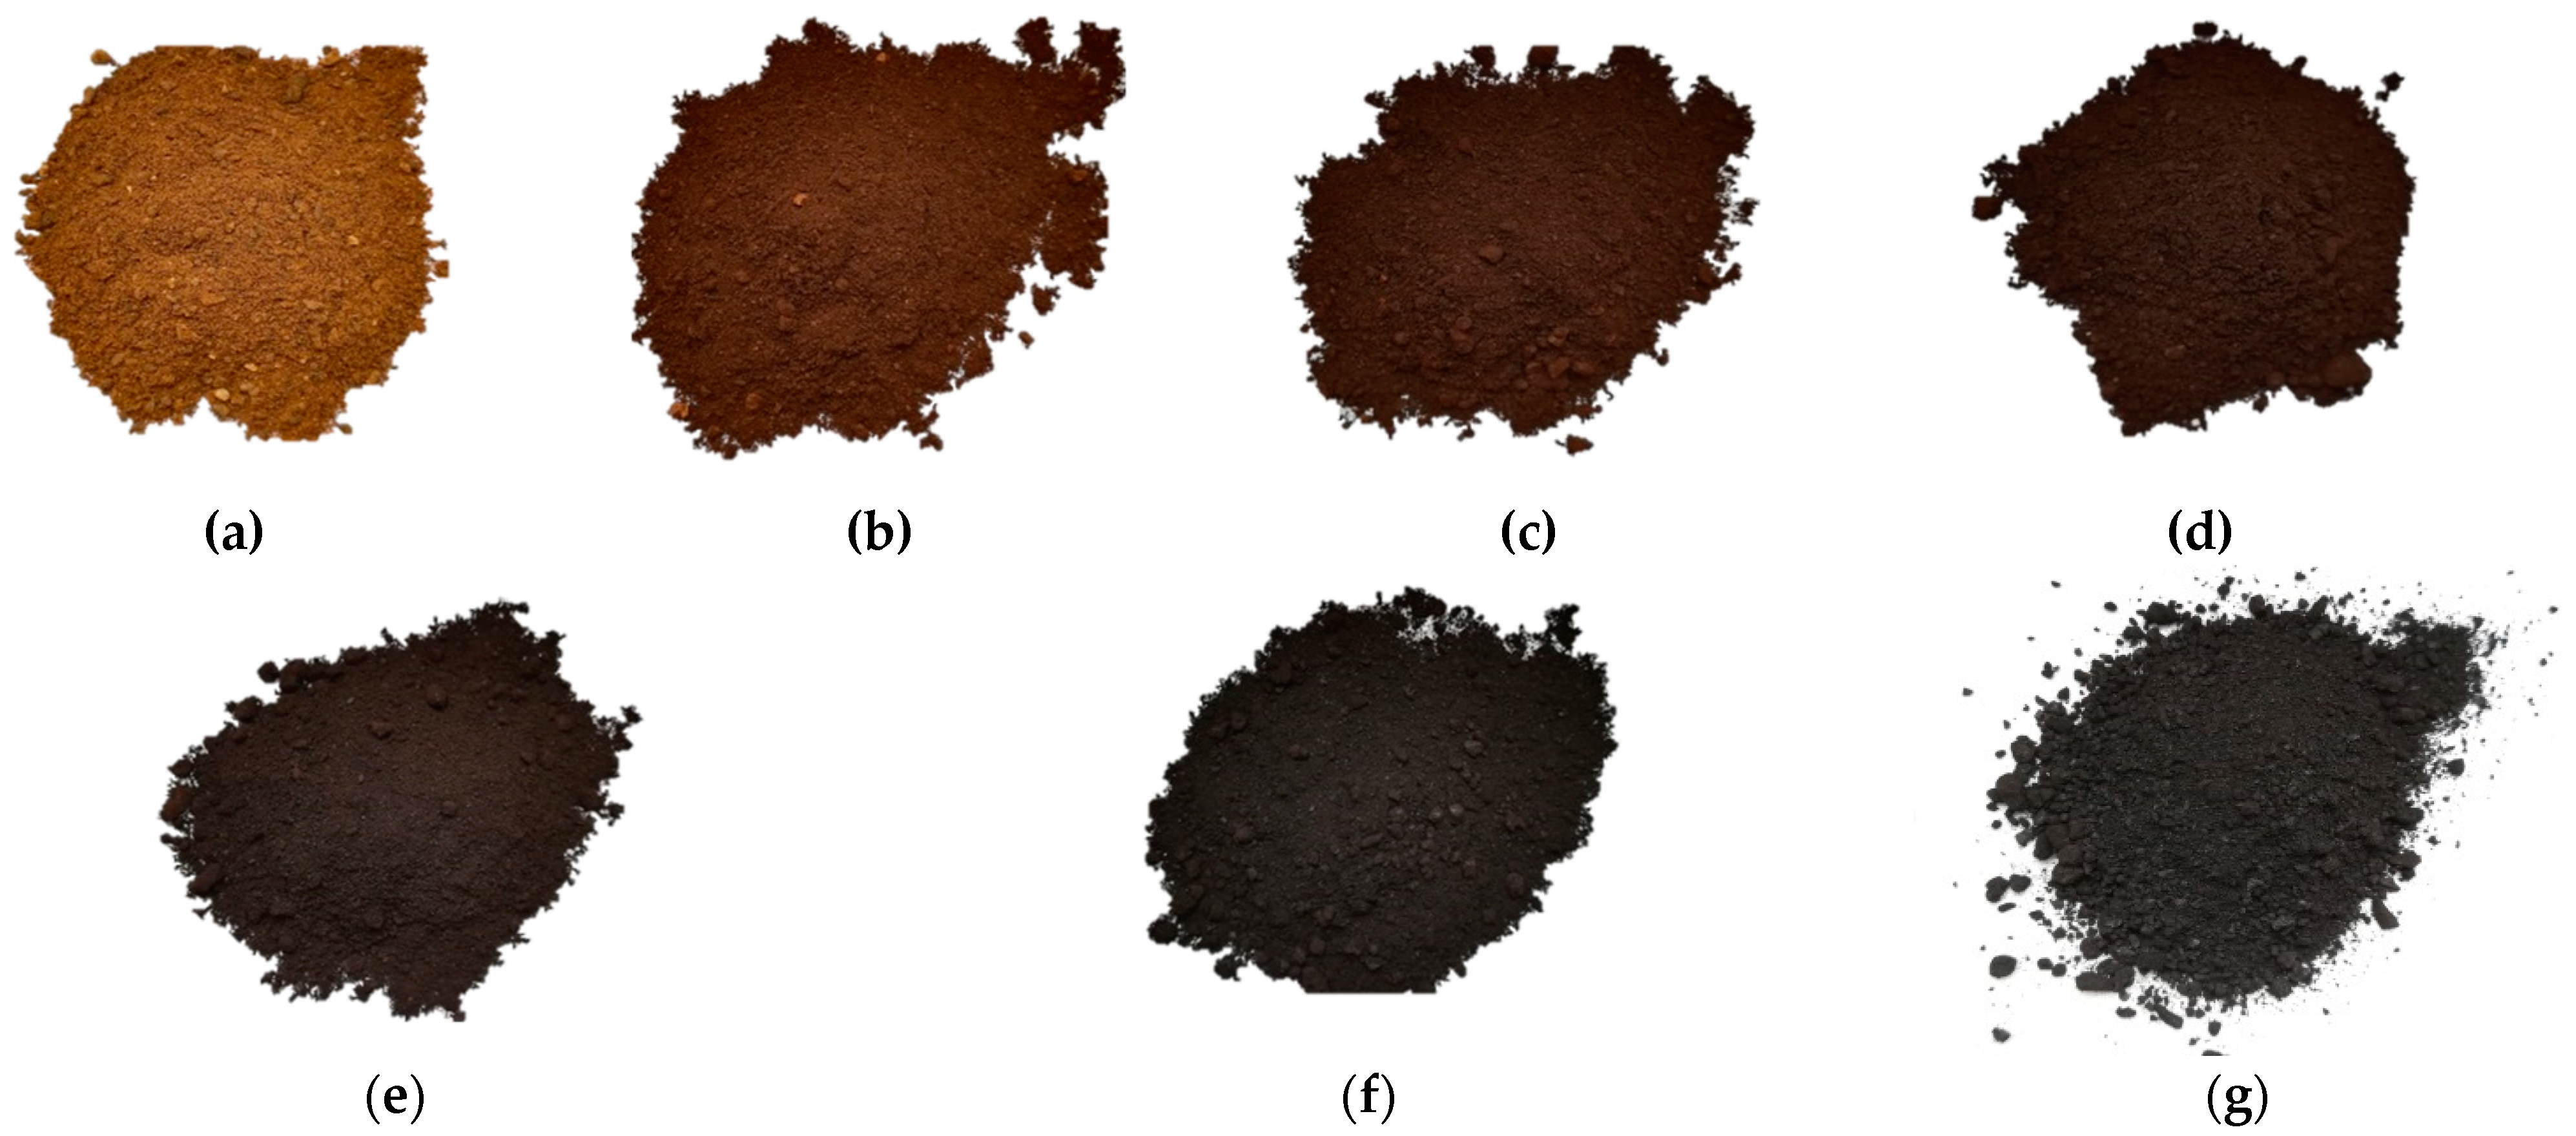
2.2. Samples Preparation and Torrefaction Procedure

All samples of research materials were initially dried before the torrefaction process in the drying chamber KBC–65 W (WAMED, Warszawa, Poland) for 24 h at the temperature of 105 °C. Samples were dried in order to achieve the same air-dry conditions of the investigated materials (analytical state). After the drying process, the samples were ground in the mill LMN 400 (TESTCHEM, Pszów, Poland) (Figure 4a) with a sieve size of 1 mm. Then, the prepared material (sample mass of 50 g) was put into the electric muffle furnace SNOL 8,2/1100 (SNOL, Utena, Lithuania) (Figure 4b). The mass of the samples was determined using the scale RADWAG AS 220.R2 (RADWAG, Radom, Poland). The torrefaction temperature was 200 °C, 220 °C, 240 °C, 260 °C, 280 °C, and 300 °C, accordingly. To maintain the inert atmosphere in the reactor chamber, the carbon dioxide from the gas cylinder was used. The duration time of the torrefaction process was 60 min. The number of replicates for each sample was n = 5. After the torrefaction process, the torrefied material was cooled down to the ambient temperature to avoid the combustion process (ca. 24 °C) and closed in an airtight plastic container to prevent the moisture absorption from the air.

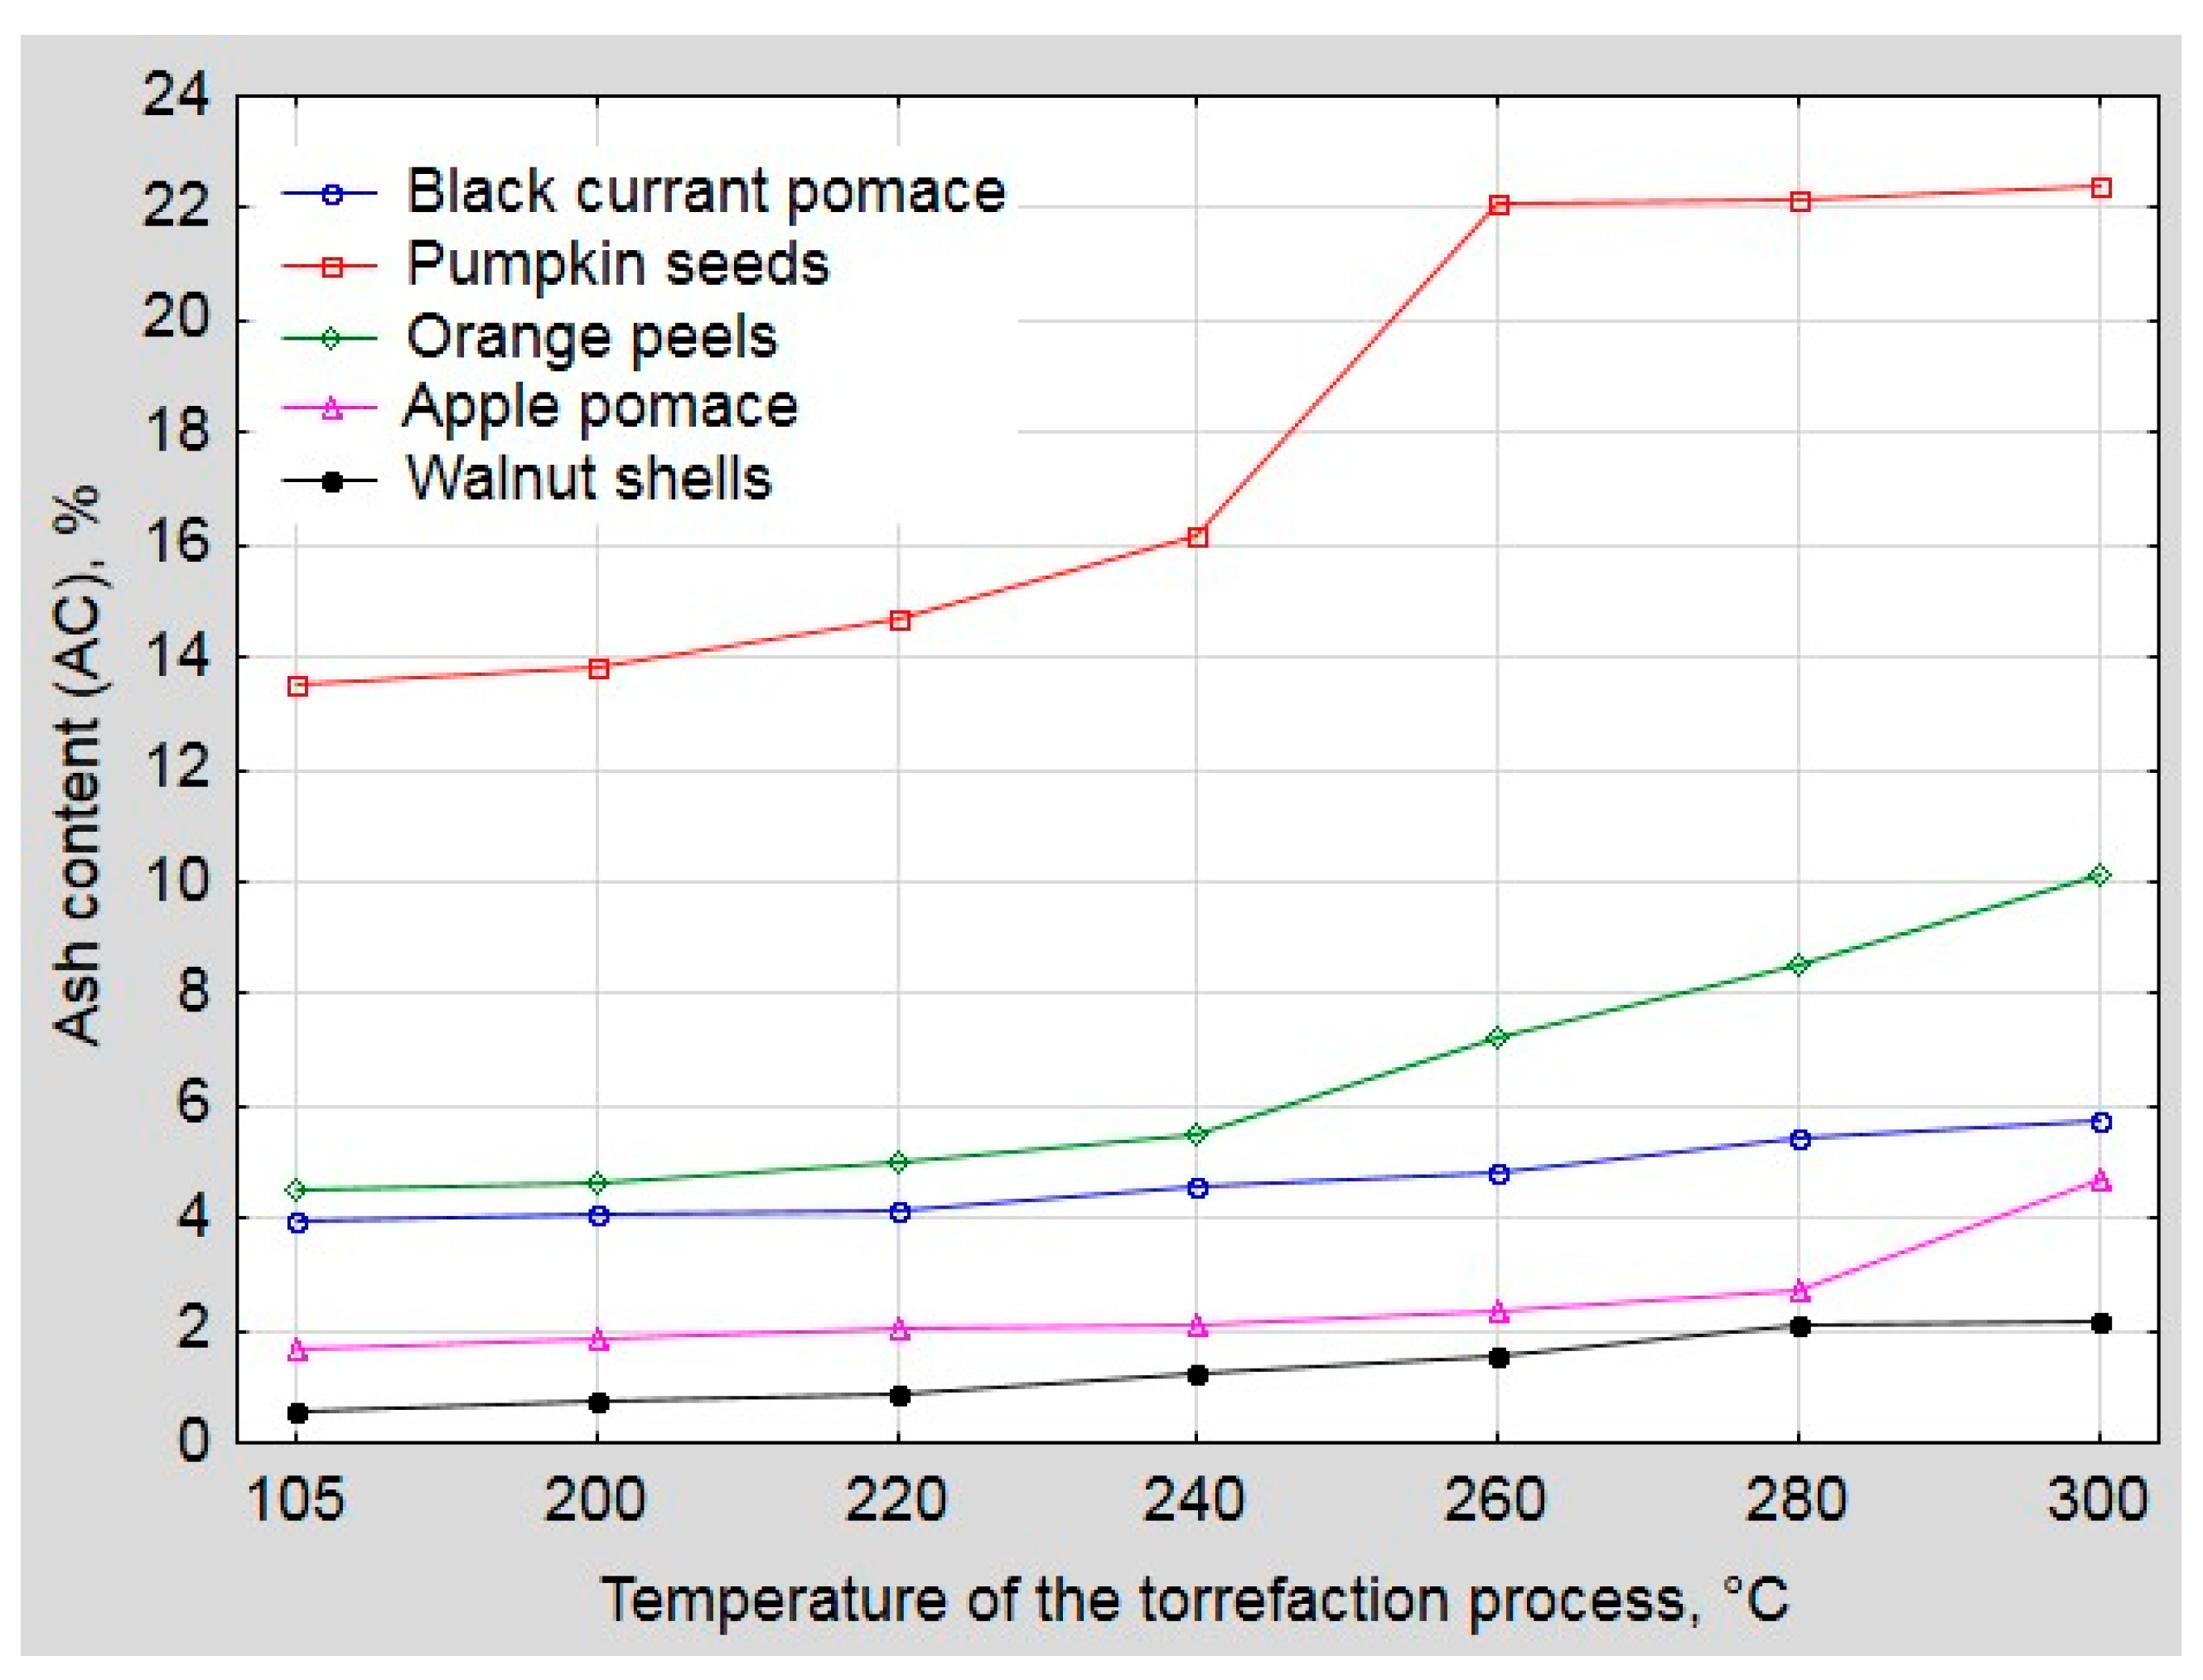
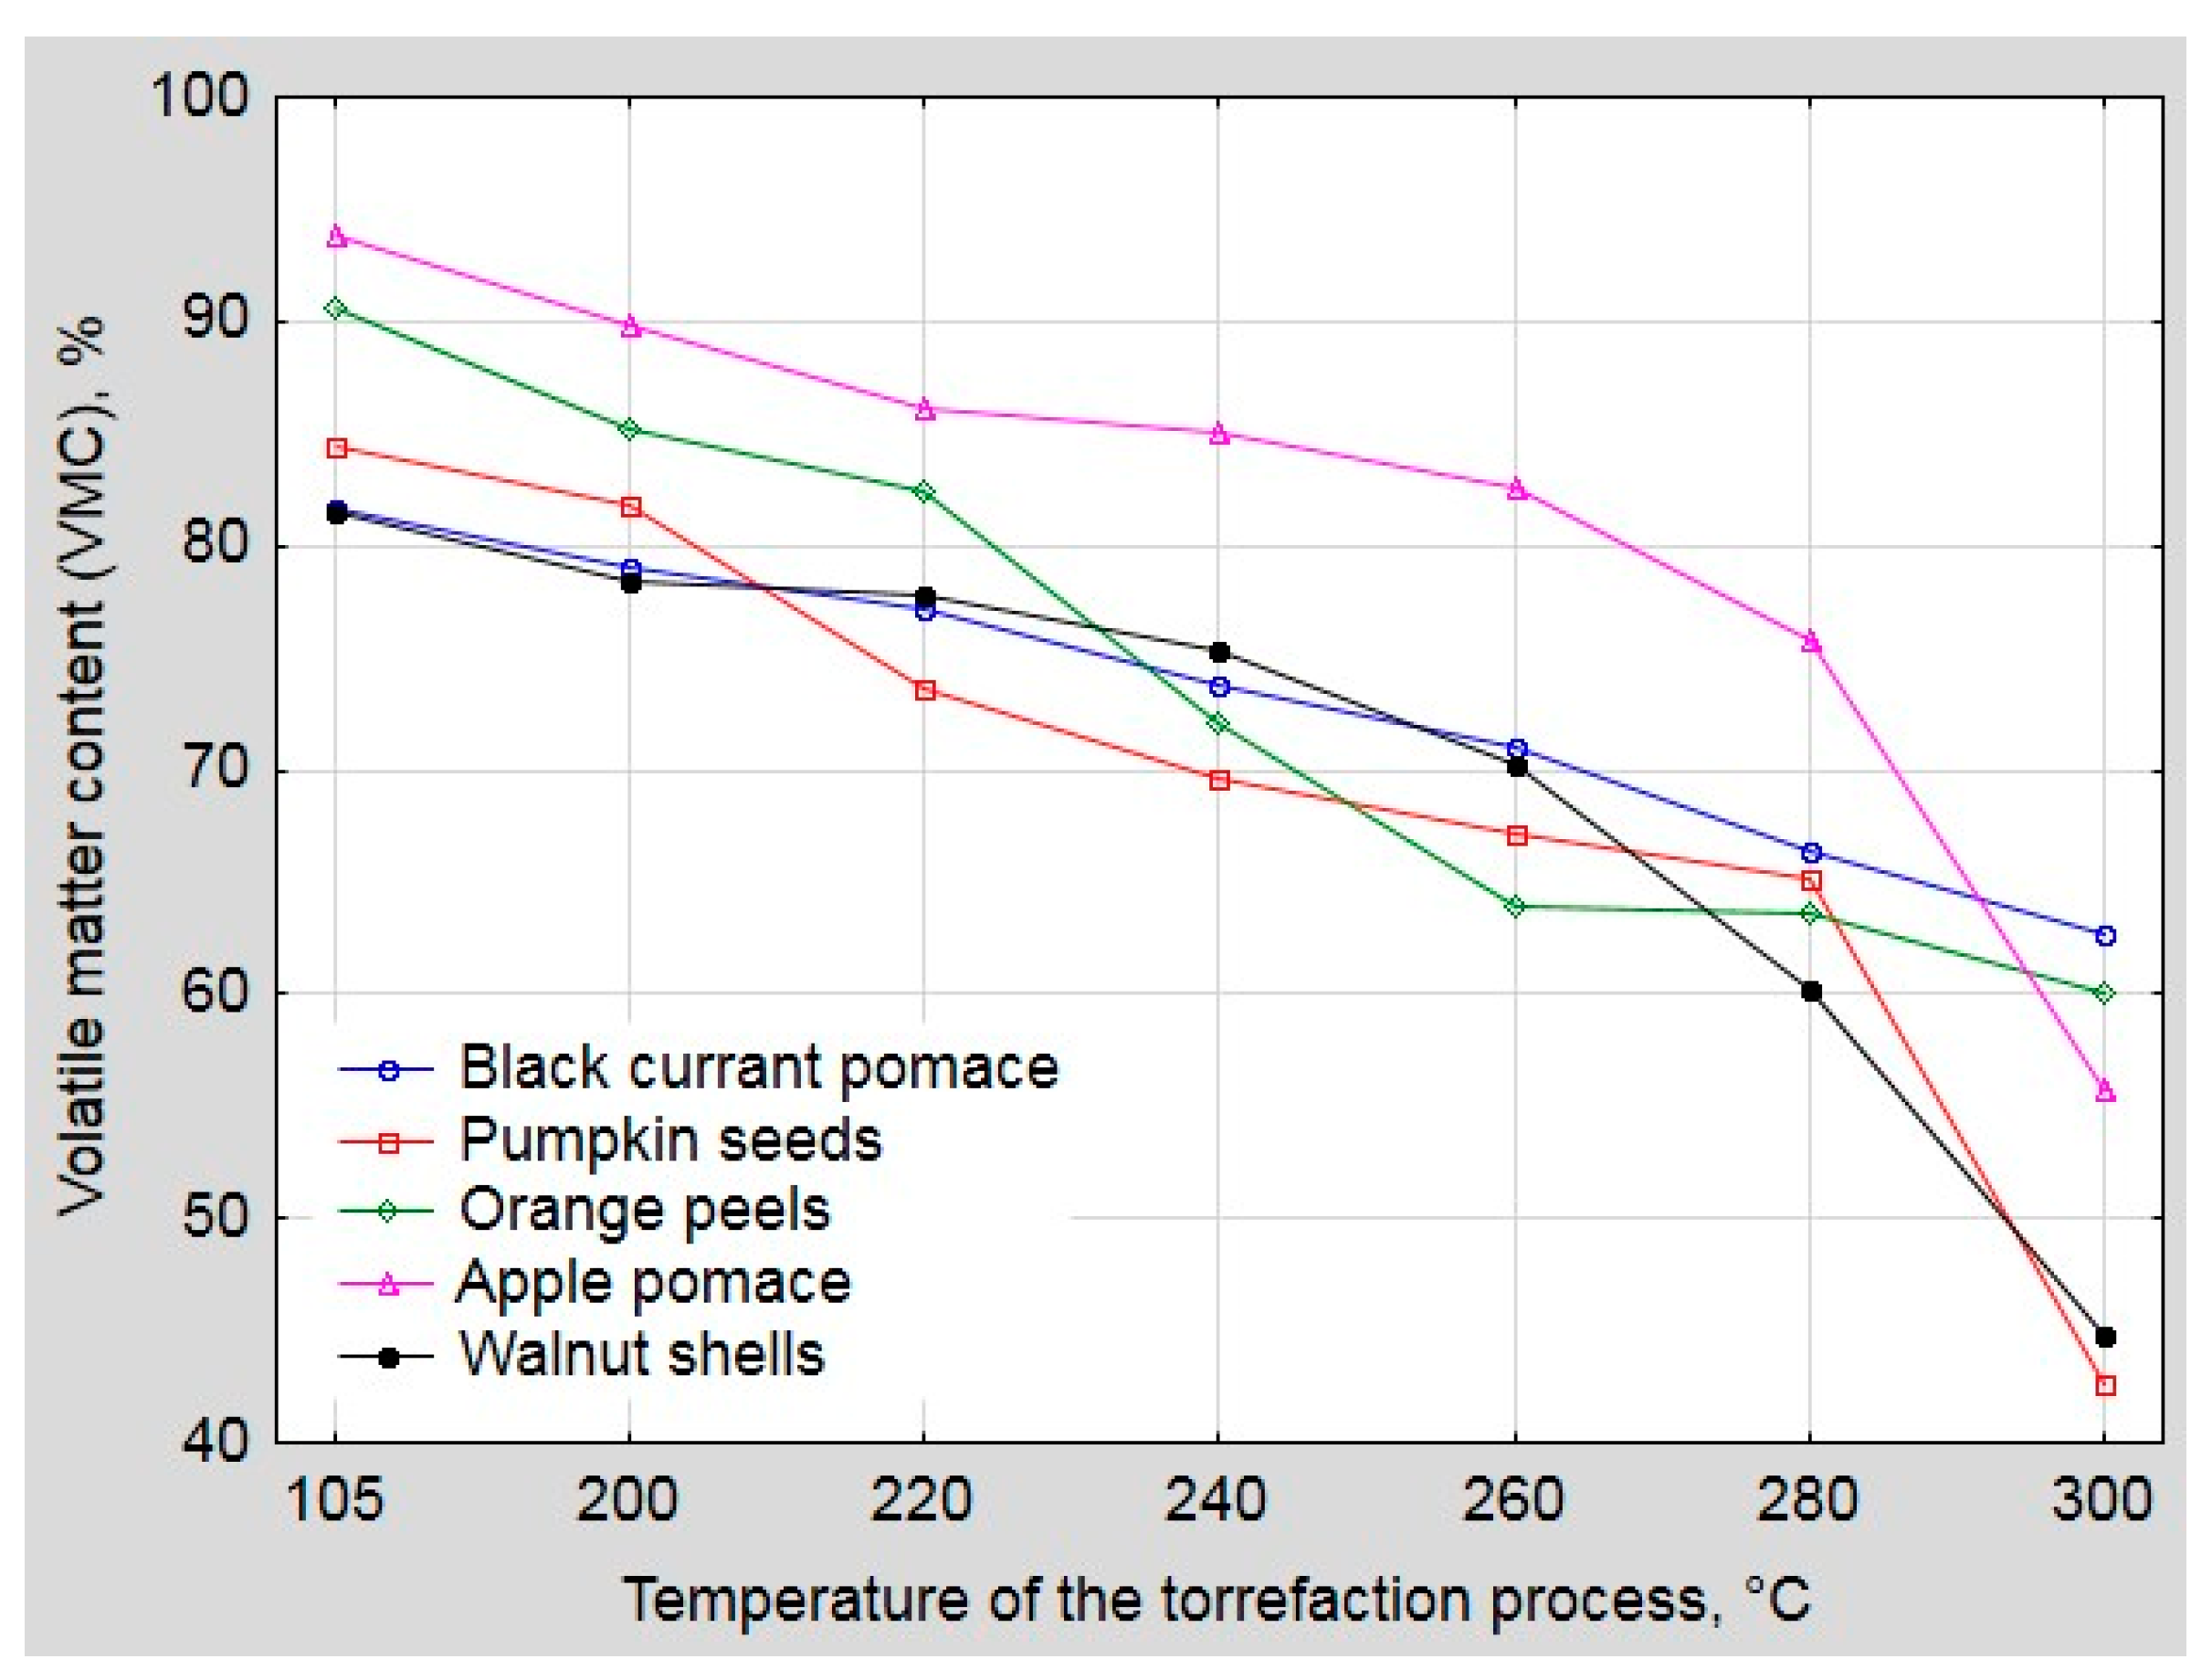
2.3. Proximate Analysis

In order to characterize the physical properties of the torrefied biomass, the proximate analysis was performed. The sampling procedure for analysis consisted of randomly taking an appropriate sample mass for further analyses (in accordance with applied ISO Standards). The proximate analysis included parameters, such as moisture content (MC), higher heating value (HHV), lower heating value (LHV), ash content (AC), and volatile matter content (VMC). All parameters were determined in five repetitions.
The moisture content was determined according to PN-EN ISO 18134-2:2017-03E [44] using a laboratory moisture analyzer SARTORIUS MA150 (Sartorius, Goettingen, Germany) (Figure 4c). The higher heating value (HHV) was determined in a calorimetric bomb IKA C200 (IKA, Lucknow, India) (Figure 4d) in accordance with PN-EN ISO 18125:2017-07 [45]. The lower heating value was determined using the following formula [46]:
L H V = H H V ( 1 M C a ) ( r · M C a )
where: LHV—lower heating value (kJ∙kg−1); HHV—higher heating value (kJ∙kg−1), r—latent heat of water vaporization (r = 2.44 MJ∙kg−1 for 1% moisture content in fuel) (kJ∙kg−1), MCa—moisture content in the fuel in analytical state (%).
Ash content in waste biomass was determined according to PN ISO 1171:2010 [47] using the muffle furnace SNOL 8.2/1100 (SNOL, Utena, Lithuania). The following formula was used:
A C = m A m C m M m C · 100 %
where: AC—ash content in waste biomass fuel in the analytical state (%), mA—a mass of the crucible with ash after heating (g), mC—a mass of the empty crucible (g), mM—a mass of the crucible with the material before heating (g).
The volatile matter content (VMC) in the waste biomass was determined according to PN-EN ISO 18123:2016-01 [48] and using the following formula:
V M C = 1 ( m S m C ) m M · 100 %
where: VMC—volatile matter content in waste biomass in the dry analytical state (%), mS—a mass of the crucible with fuel sample after heating (g), mC—a mass of the empty crucible (g), mM—a mass of the crucible with fuel sample before heating (g).

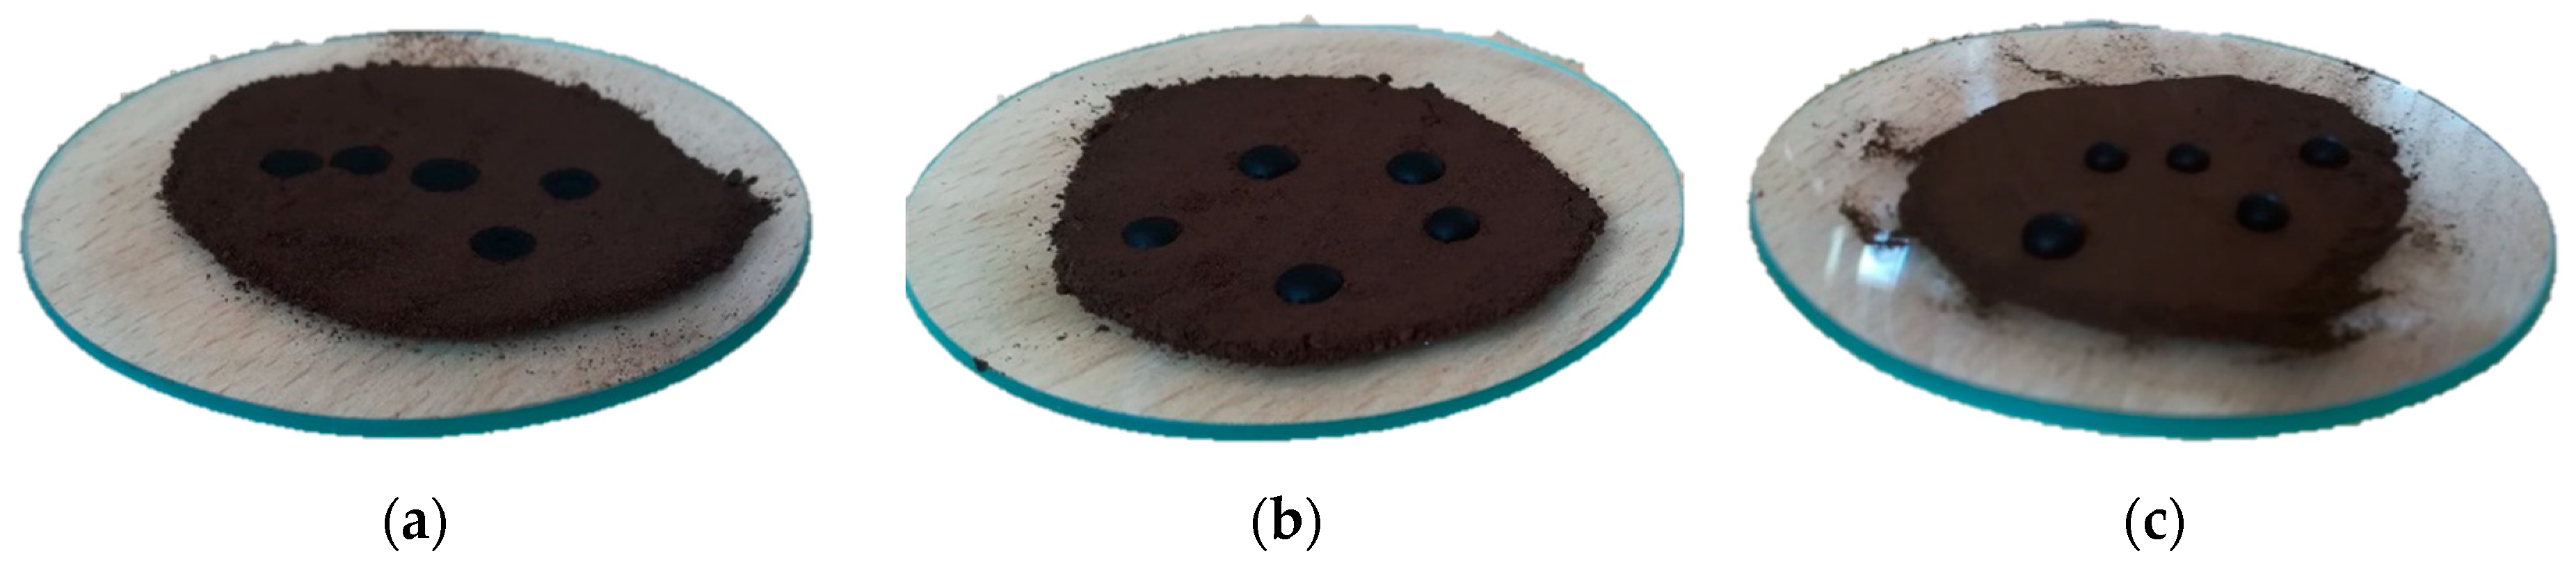
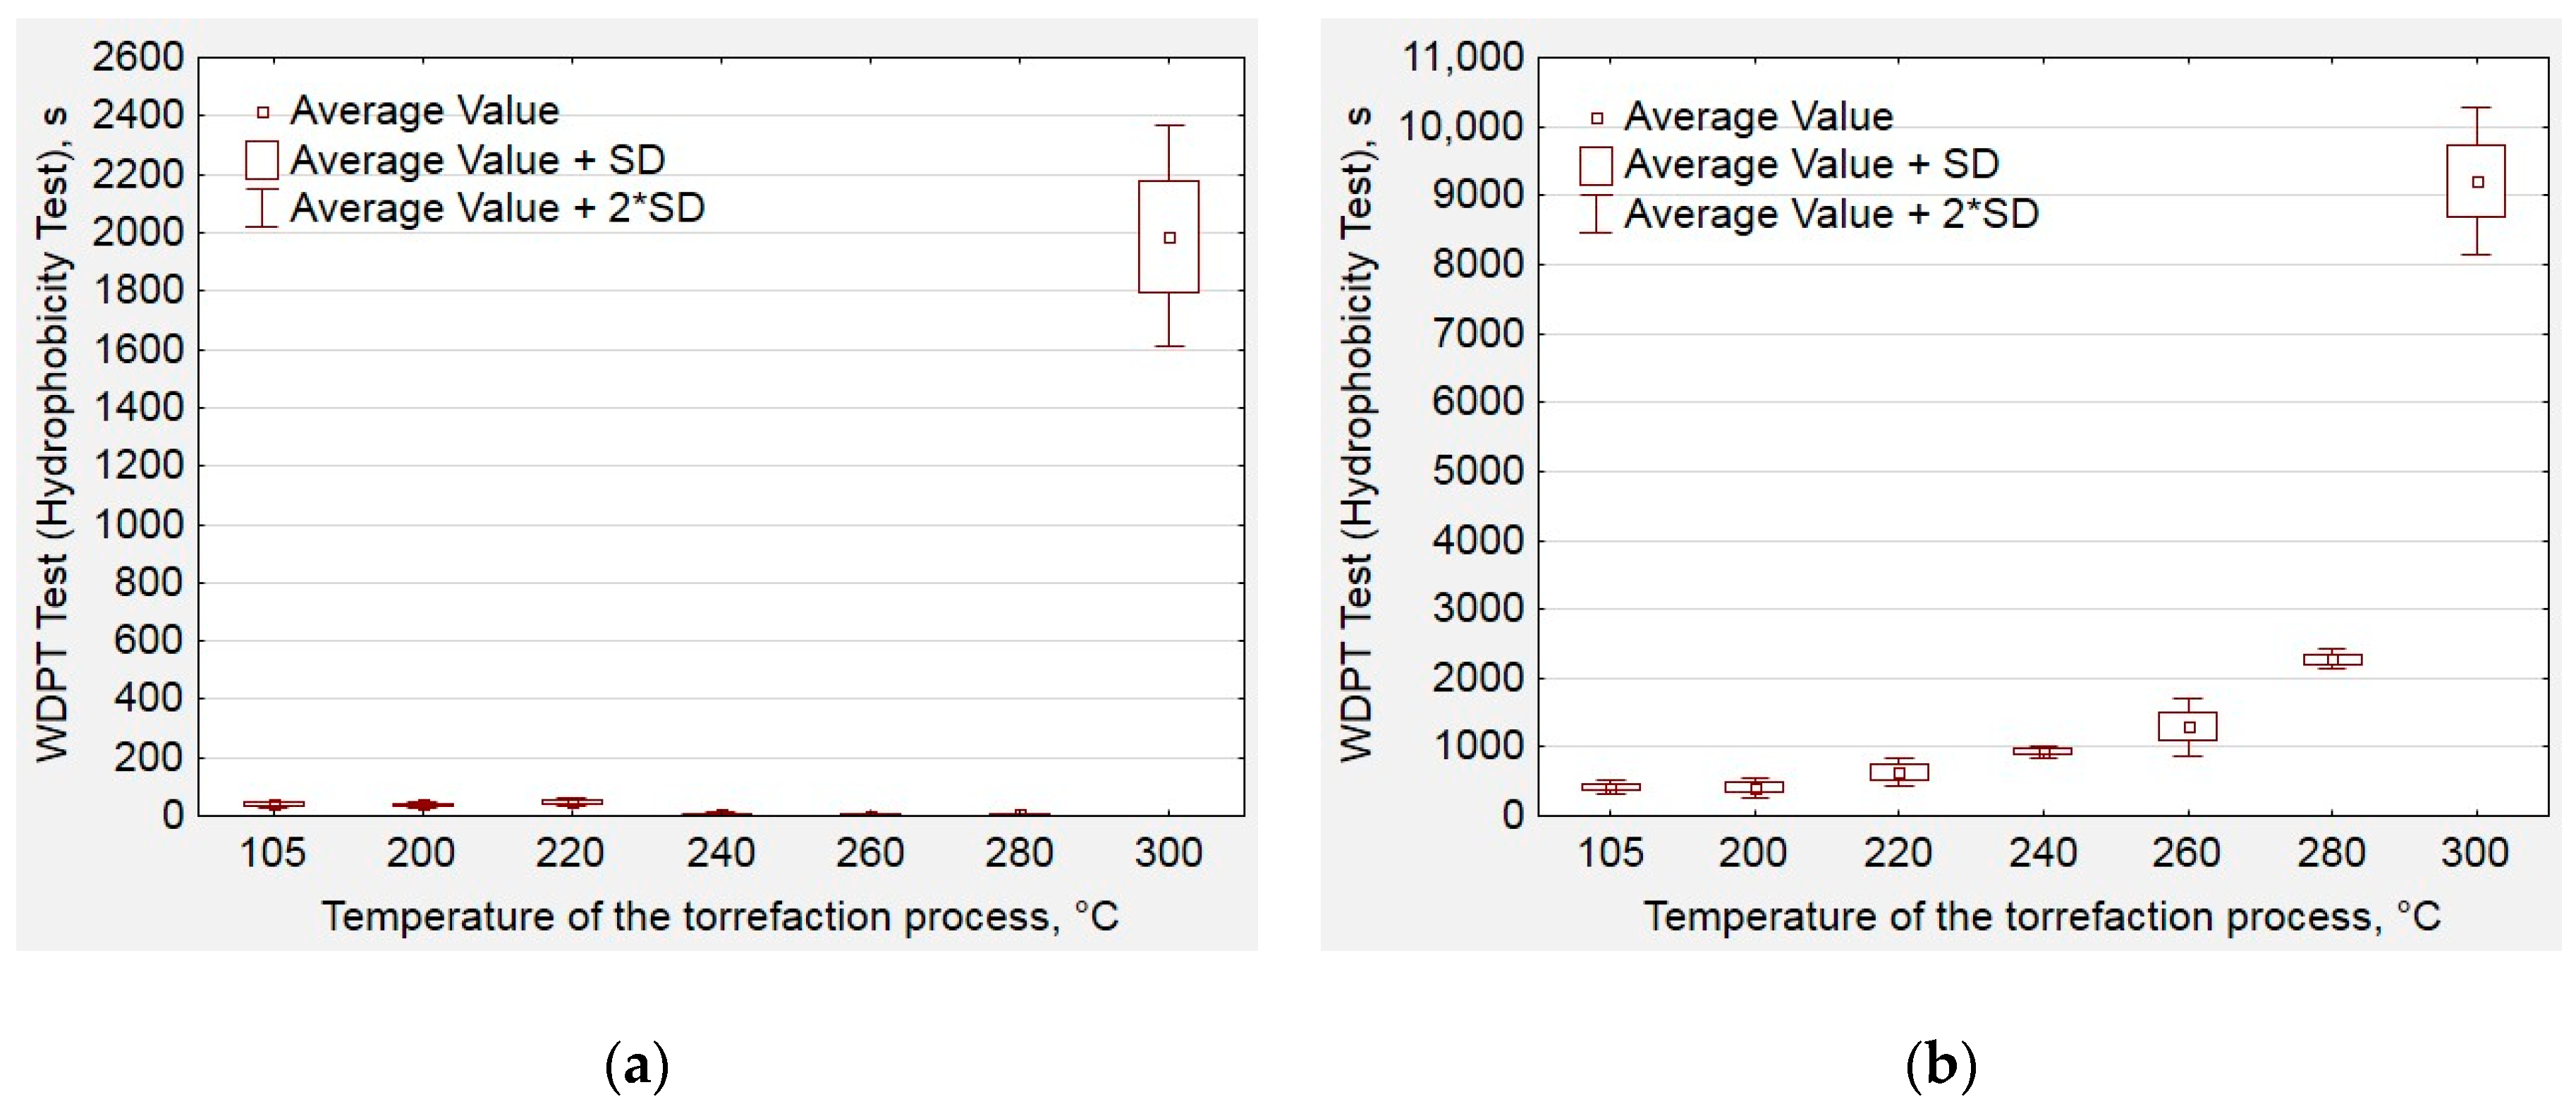
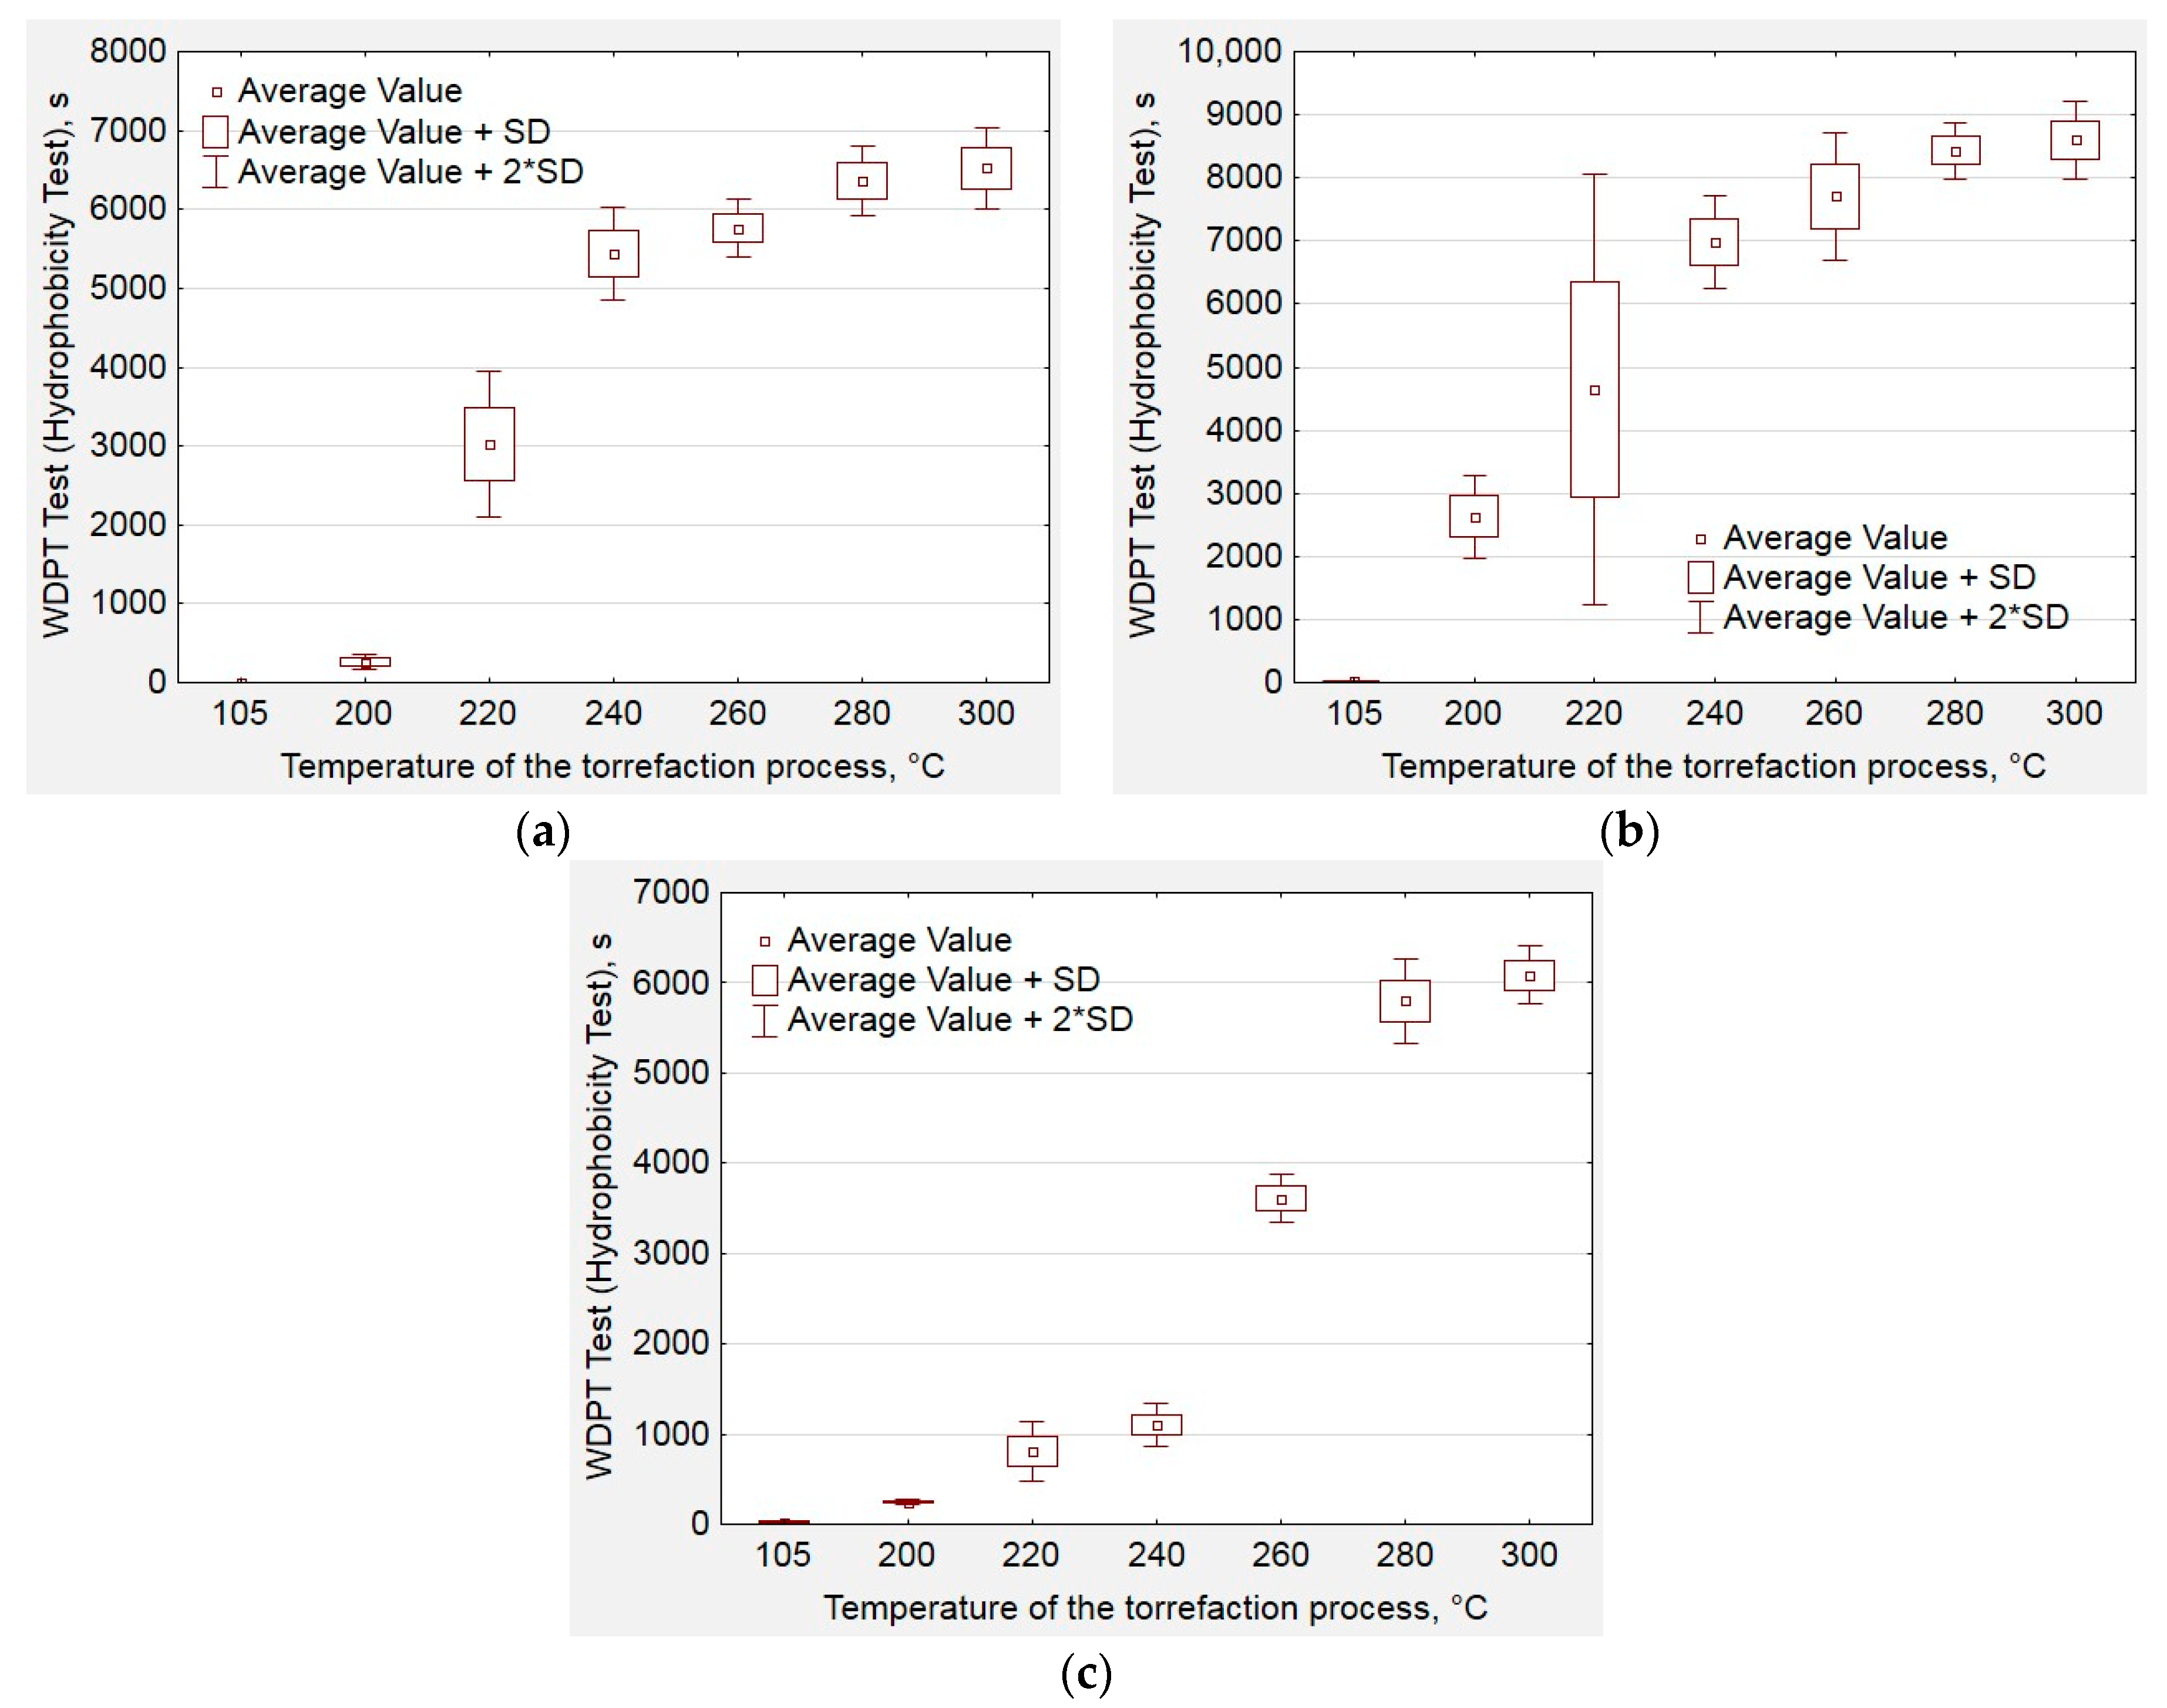
2.4. Hydrophobic Properties Analysis

The hydrophobic properties were determined by the water drop penetration time (WDPT) test [43]. Research material with a weight of 5 g was spread on a laboratory slide glass (Figure 4e). The thickness of the layer was 2 mm. The test consisted of applying five drops of distilled water (at a temperature of 20 °C) on the surface of the investigated material. Next, the penetration time of a drop of the water through the layer was measured using the stopwatch. The number of WDPT tests for each sample was n = 5. Based on the value of the drop penetration time, the torrefied material was classified in terms of its hydrophobic properties (Table 1).
Samples with penetration time of distilled water drop over 1 h were covered with the lids to avoid the influence of the evaporation process. The cover of the samples allowed for testing hydrophobicity for up to 5 h [43].
The results of the water drop penetration time test and diagrams were developed in statistical software STATISTICA ((StatSoft—DELL Software), TX, USA). The detailed results, including standard deviations, are enclosed in Supplementary Table S1.

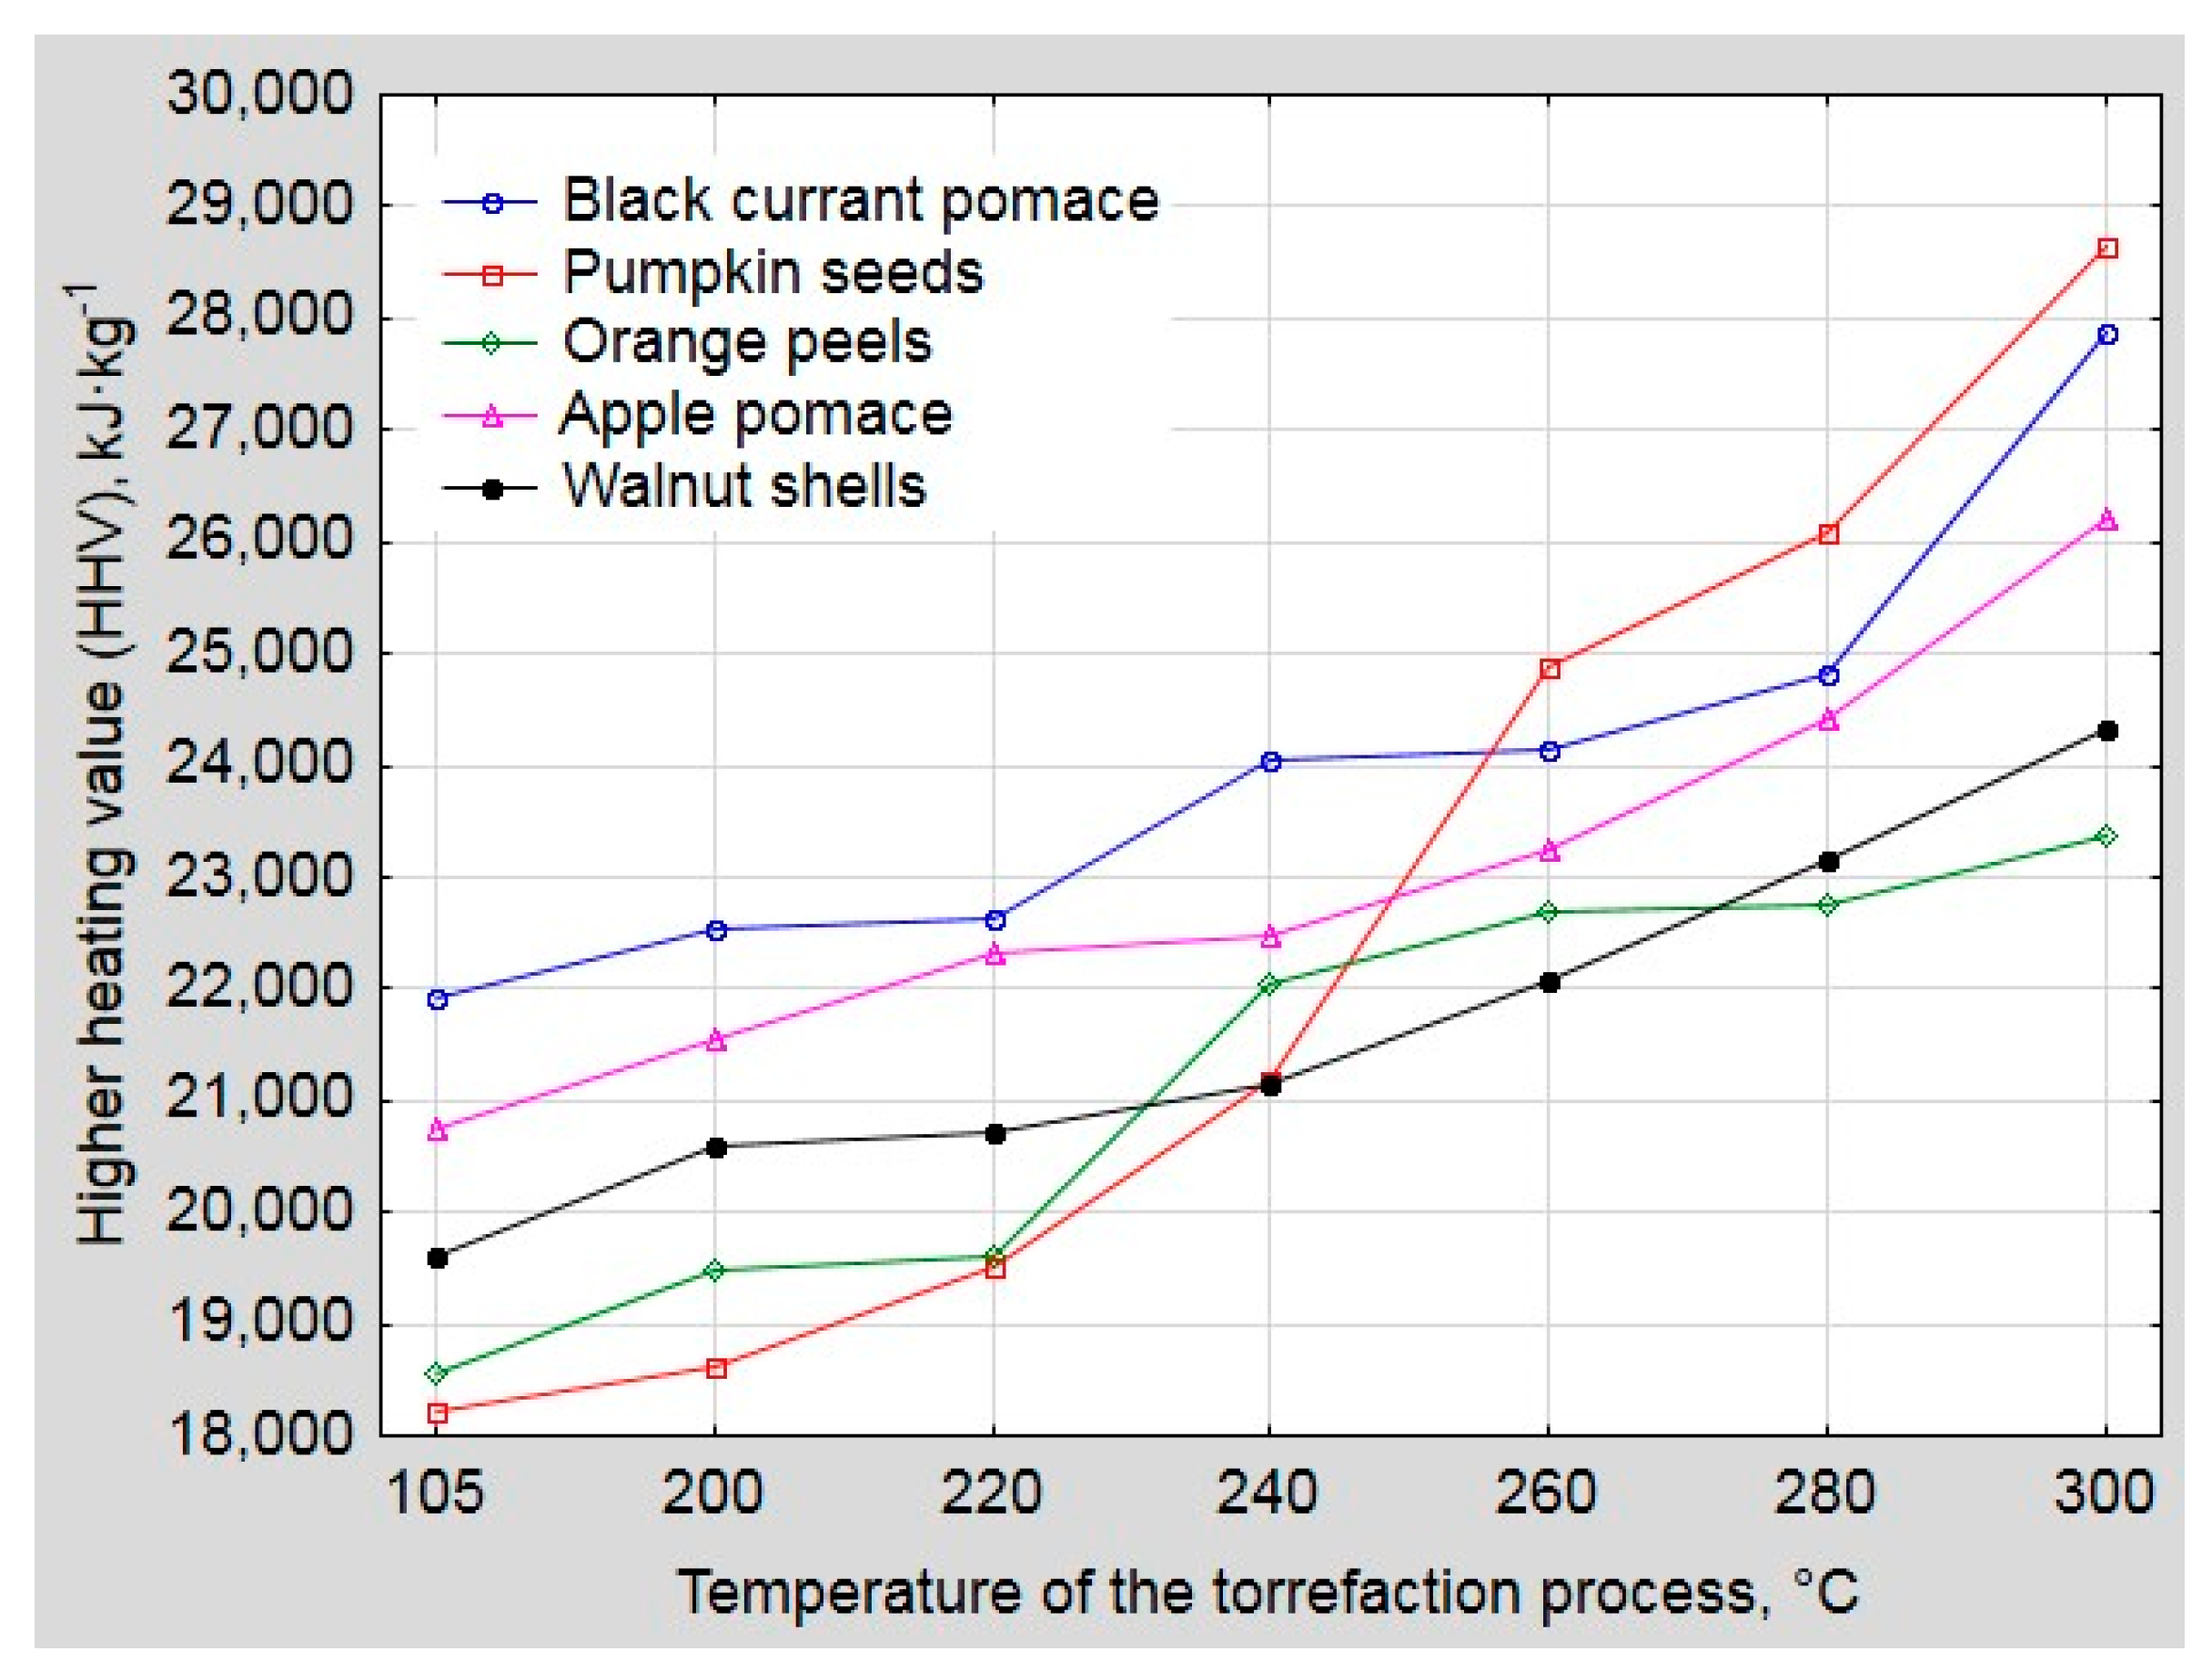
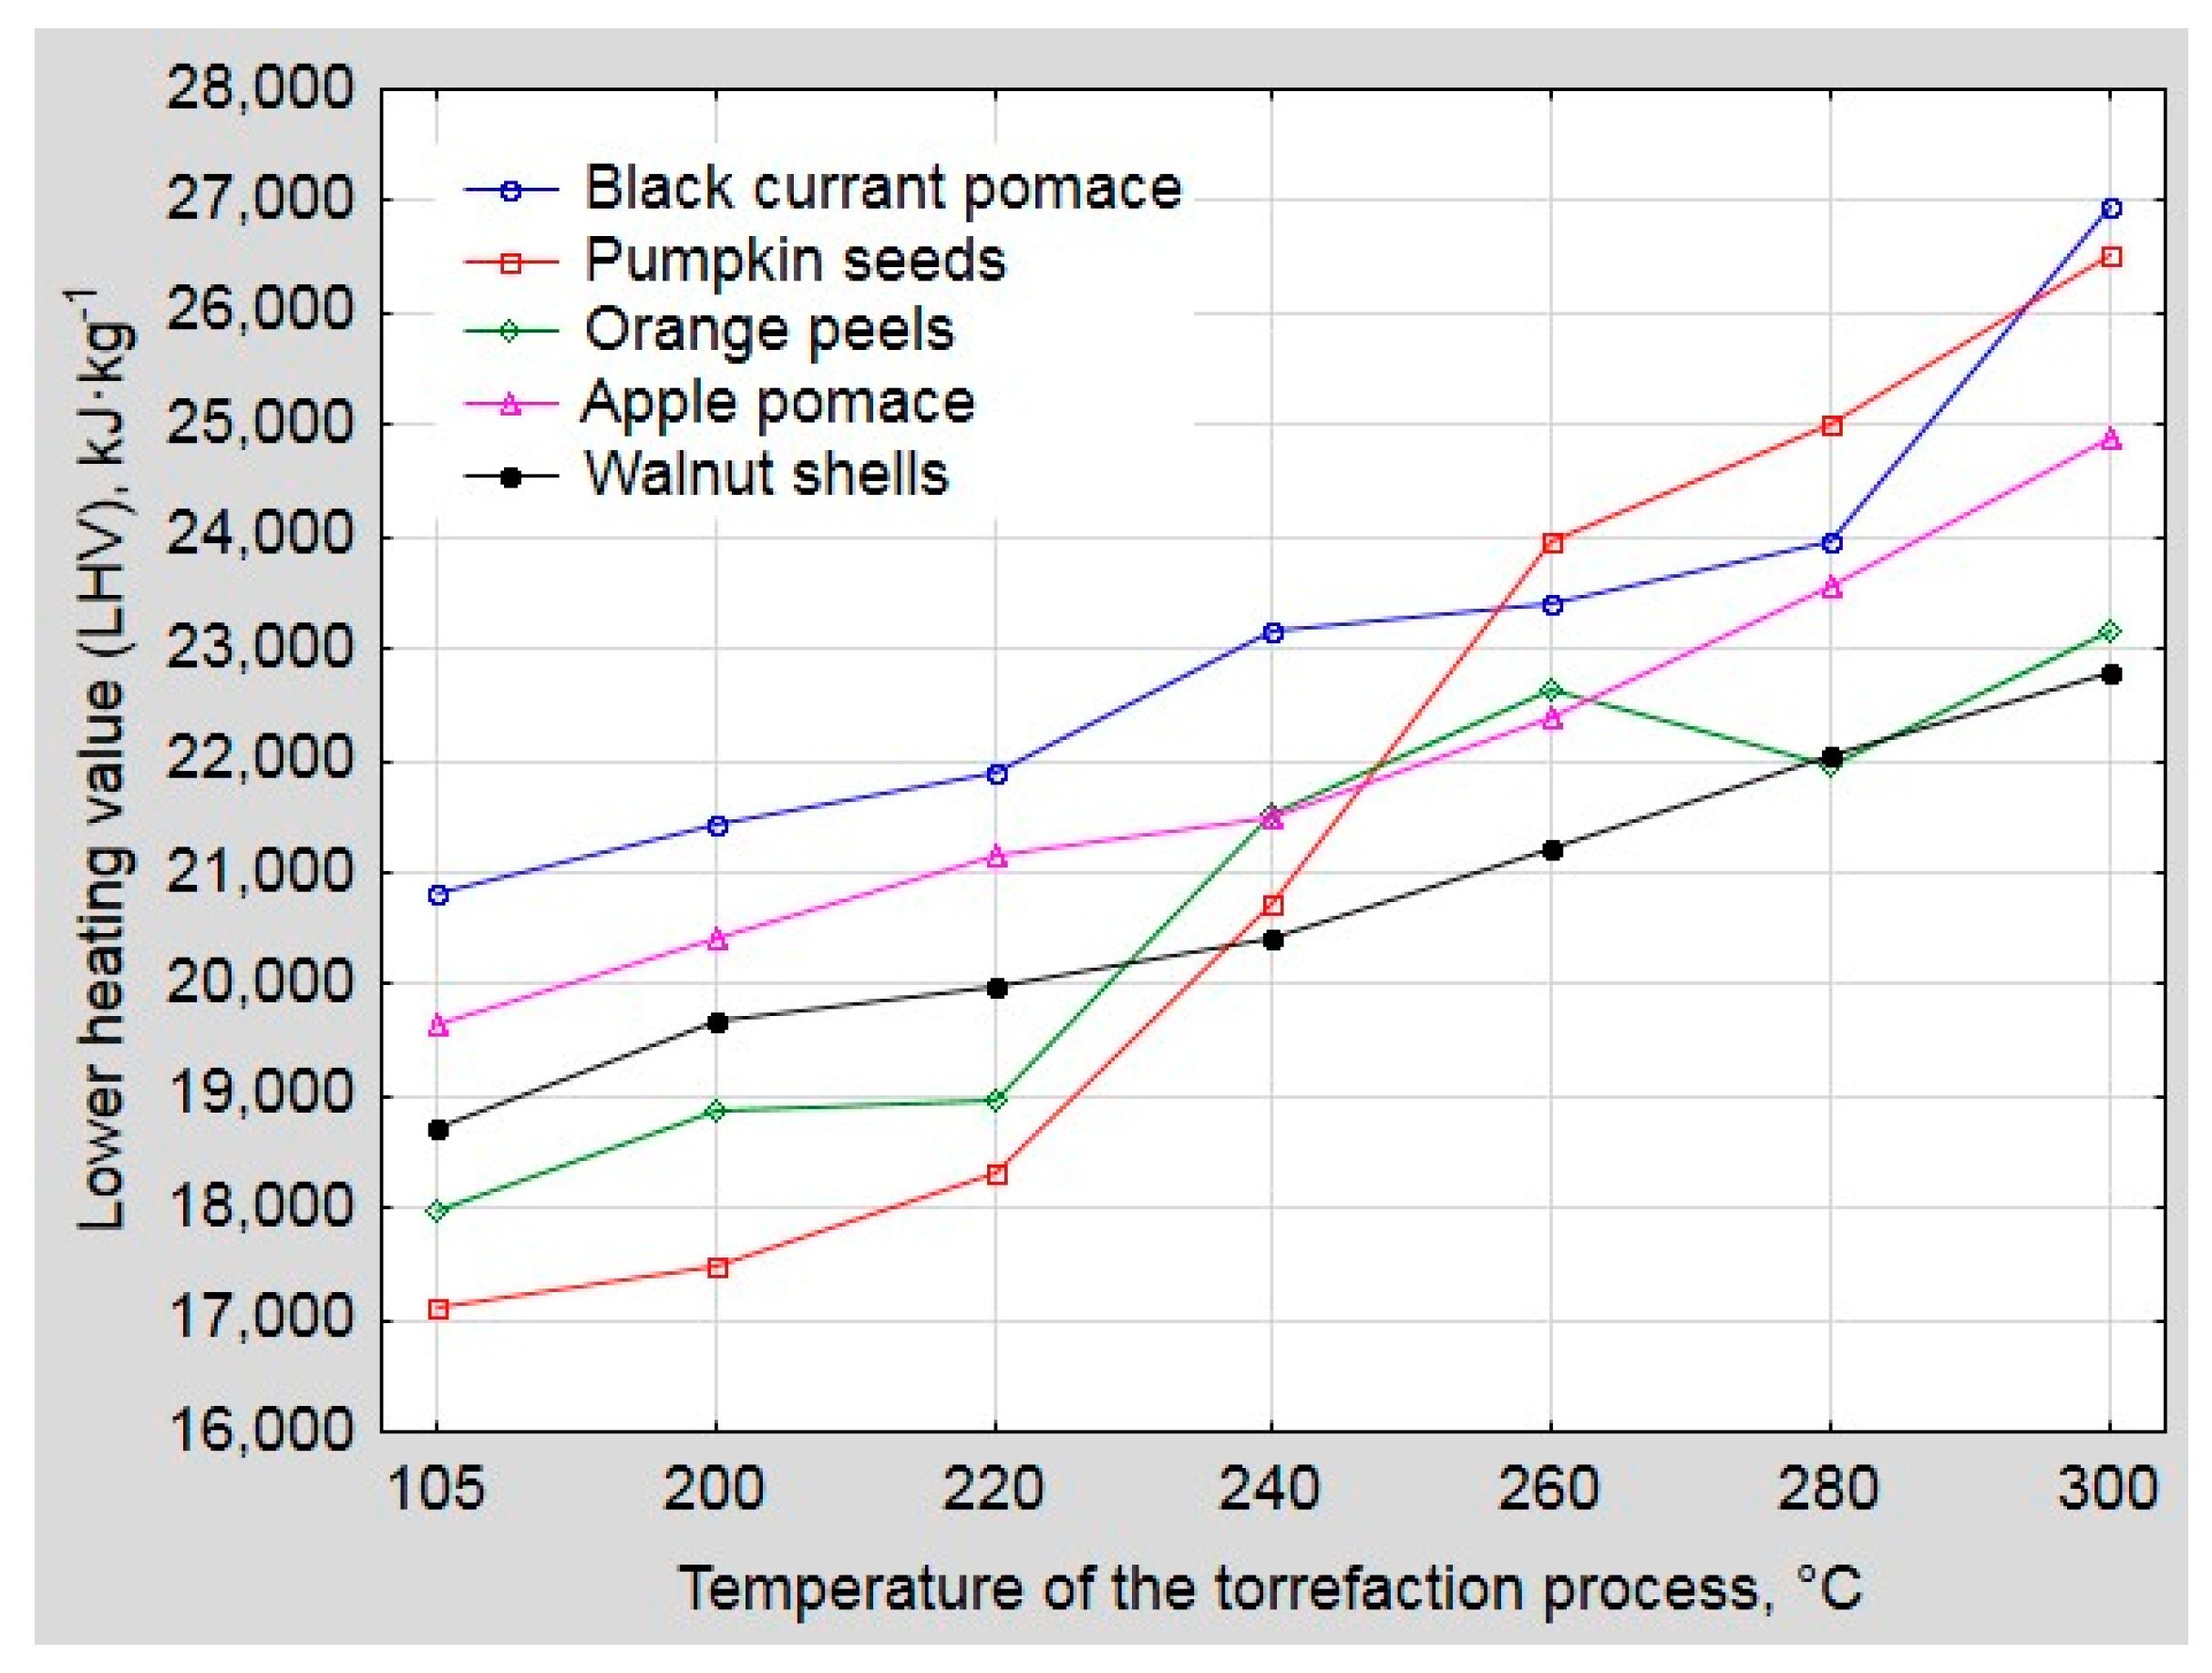
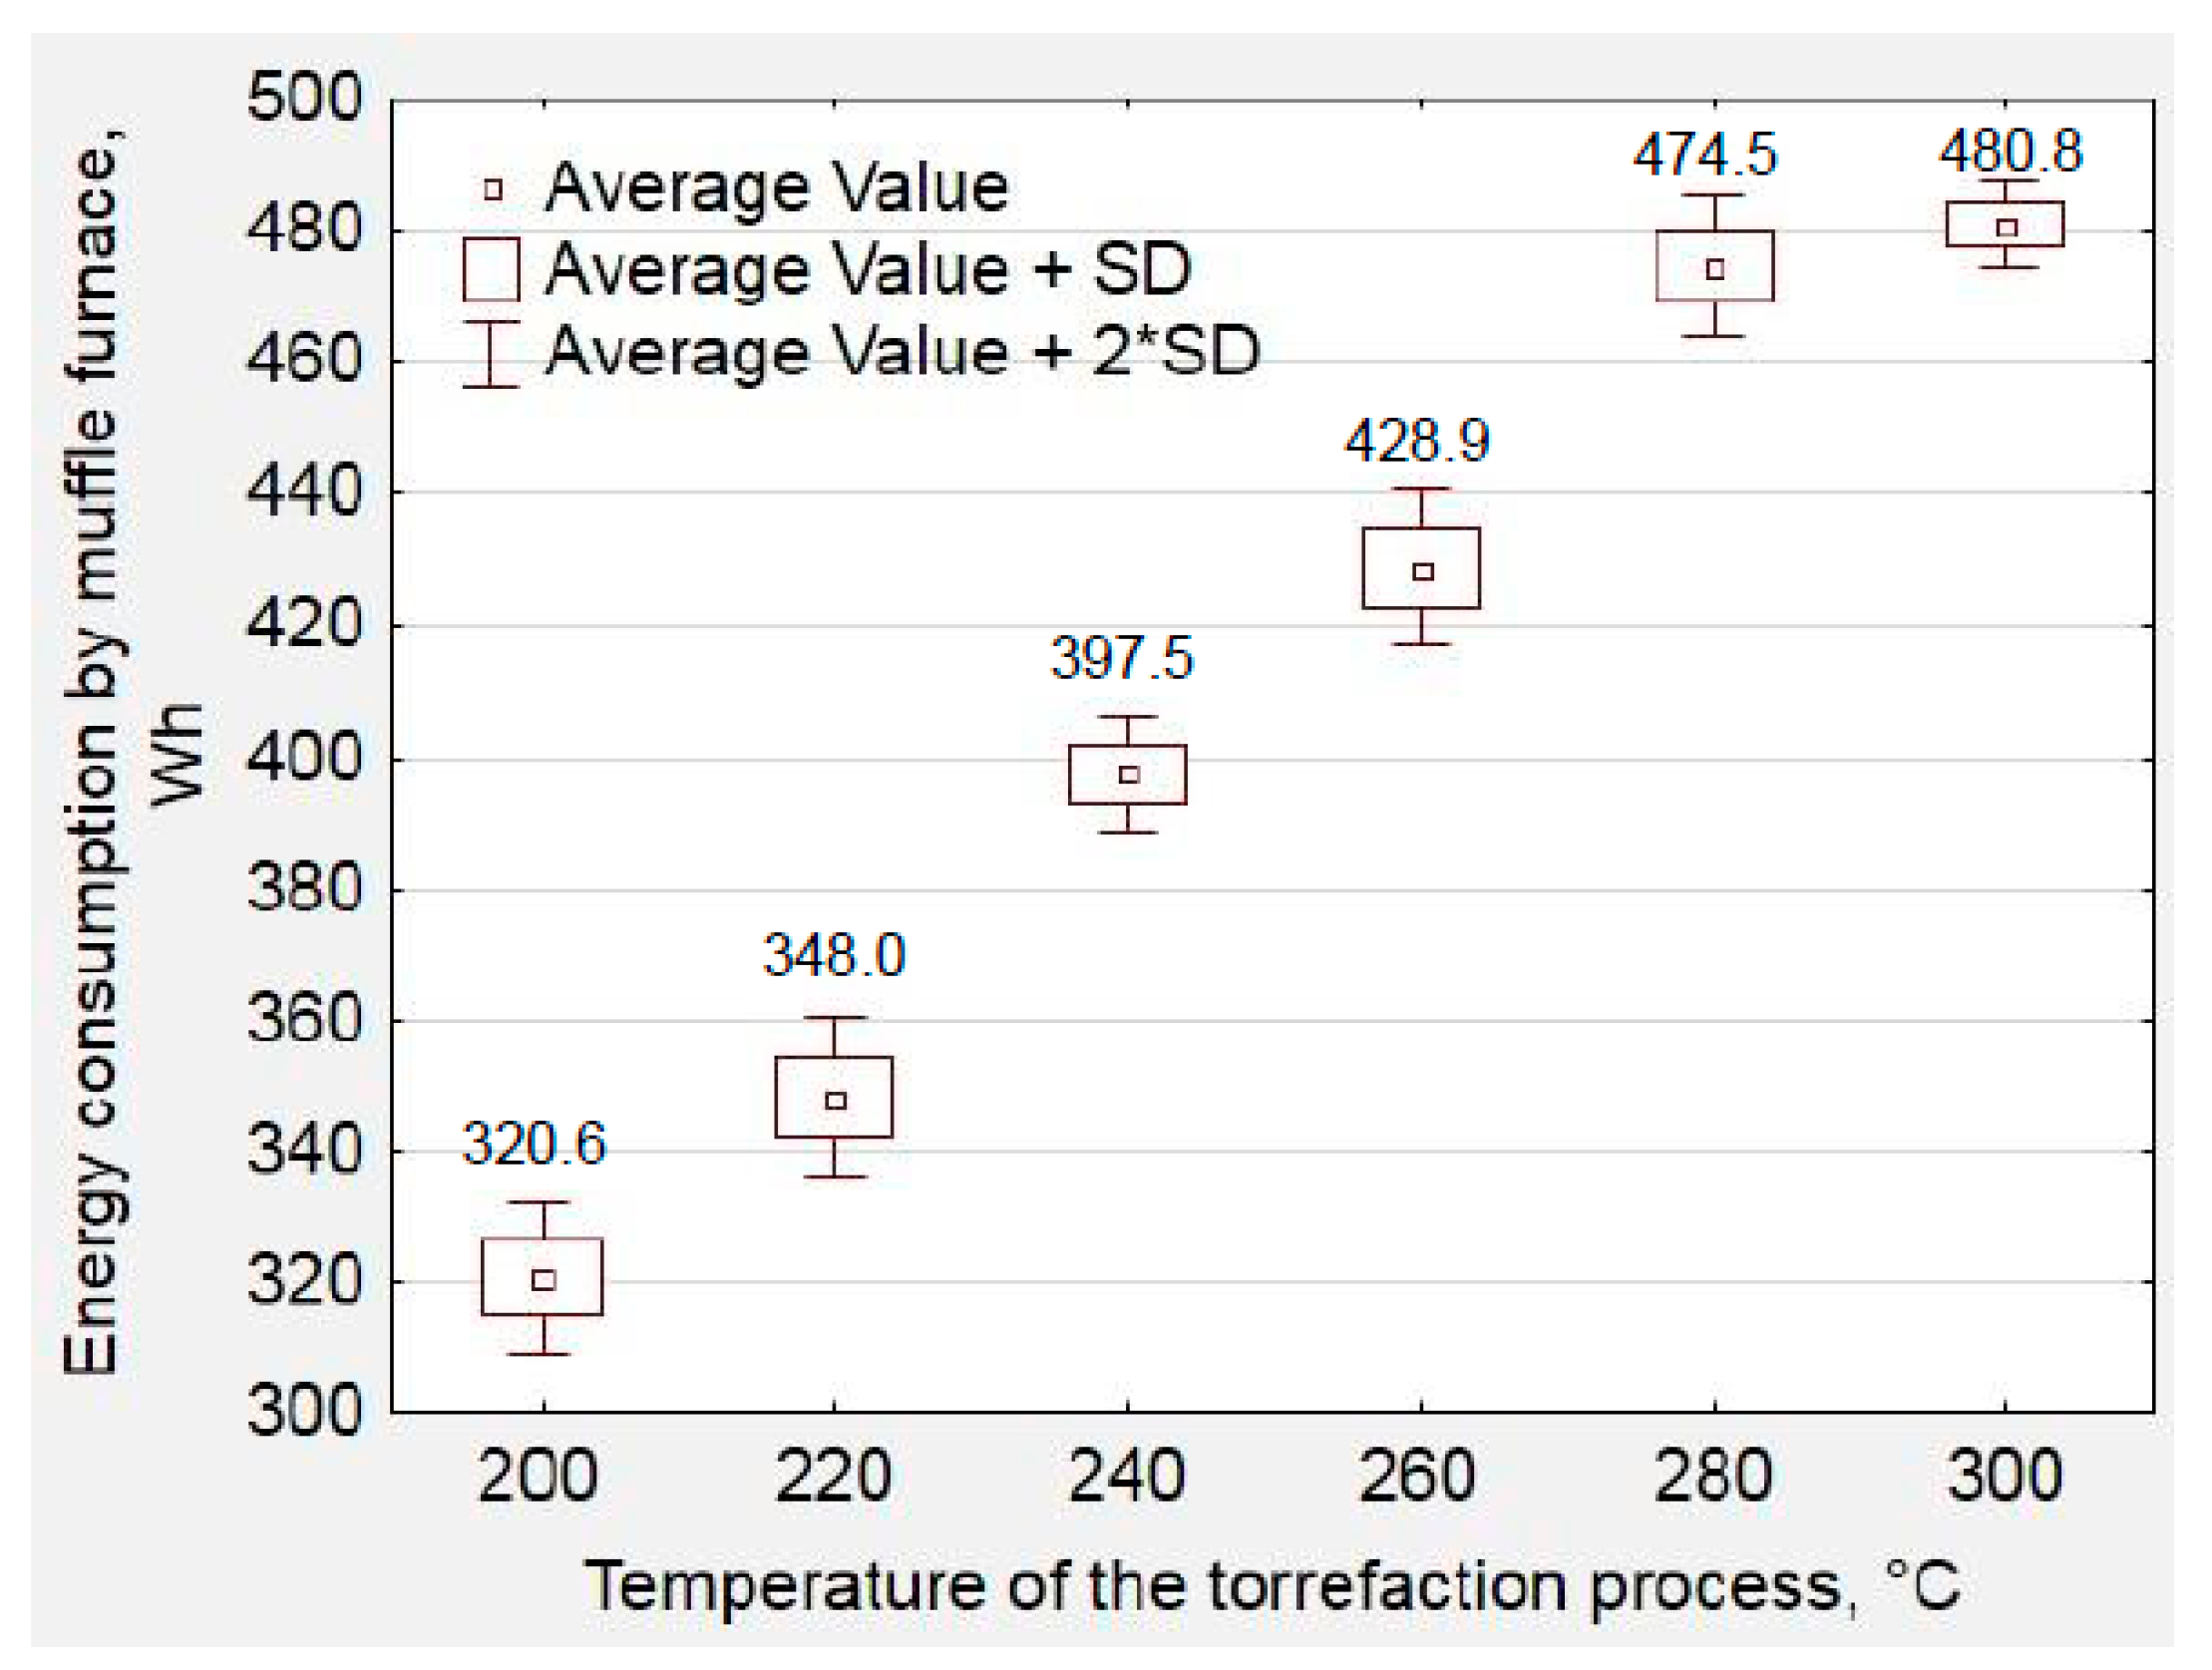
3. Results and Discussion

The investigated materials were characterized by the moisture content in the range from 3.25% to 5.99% (details are in the Supplementary Table S2).
After the torrefaction process at temperatures from 200 °C to 300 °C, the changes in colors of the torrefied materials were observed (Figure 5). The raw material was characterized by a yellow/orange/bright brown color. However, the color of the material was getting darker (from the light brown through the dark brown to the black one) as the torrefaction process temperature increased. Waste biomass from food processing torrefied at 300 °C was characterized by black color and looked like fine coal. The change in the color was observed for all investigated materials. Similar behavior was observed also by other researchers [51,52].
Analyzing the obtained data of the physical properties of the torrefied food waste biomass, some similarities to other wastes could be observed. Analyzing the influence of the temperature of the torrefaction process on the ash content in the tested organic materials, different values of the ash content were observed depending on the type of waste biomass. The ash content (AC) in the samples tested ranged from 0.86% to 22.39% (Figure 6). As the temperature of the torrefaction process increased, the ash content in the materials was higher. The lowest ash content was observed for the walnut shells (from 0.86% at 105 °C to 2.15% at 300 °C). Pumpkin seeds were characterized by the highest value of ash content (from 13.8% at 105 °C to 22.39% at 300 °C). Pumpkin seeds were also characterized by the highest increase in AC at the range of temperatures from 200 to 300 °C.
The ash content was also related to the temperature of the torrefaction process. The higher temperature caused a release of a part of volatile matters. Therefore, there was an effect of concentrating the solid material, resulting in an increase of ash content in the fuel. Other biomass materials like wood sawdust and chips, investigated by Świechowski et al. [53], also had a higher ash content at a higher temperature of the torrefaction process. Their research showed that torrefied pruned biomass (oxytree wood) at a temperature of 200 °C contained below 10% of ash. In turn, the rise of the torrefaction temperature to 300 °C caused the increase in ash content to 15%.
The volatile matter content (VMC) in the tested samples was between 44% and 94% (Figure 7). As the temperature of the torrefaction process increased, the VMC decreased depending on the type of food waste biomass. The lowest VMC in the dried materials (105 °C) was observed for the black currant pomace (81.6%) and the walnut shells (81.4%). Whereas, the highest VMC was determined for the apple pomace (93.8%). At a temperature (torrefaction process) of 300 °C, the highest VMC was noticed for black currant pomace (62.8%). The lowest volatile matter content was observed for pumpkin seeds (42.97%). Pumpkin seeds were characterized by the largest decrease in VMC. The difference between 105 °C and 300 °C in volatile matter content was ca. 42%. The lowest decrease was observed for black currant pomace (only 19%).
In the case of the volatile matters in torrefied biomass, it could be seen that as the temperature of the process increased, the VMC decreased. This dependence was also investigated by Matali et al. [54]. Matali et al. investigated two types of biomass: oil palm frond (OPF) and Leucaena Leucocephala (LL). Volatile matter content in these materials also decreased with the increase of the torrefaction temperature. Torrefied OPF was characterized by a volatile matter content of 79% at 200 °C, 70% at 250 °C, and 46% at 300 °C. Similar dependence was observed for LL (65% VMC at 200 °C and 37% VMC at 300 °C).
Fuels characterized by the lower content of the volatile matters were difficult to ignite. As a result, the thermally treated wastes needed more energy to be delivered to cause the auto-ignition process. At the higher temperature of torrefaction, during the thermal processing, more light and flammable compounds from the fuel were released.
In relation to the influence of temperature of the torrefaction process on the higher heating values (HHV) of the tested materials, depending on the type of waste material tested, a different increase in these values was observed (Figure 8). The heating values were higher as the temperature of the process increased. The lowest heating value was observed for the pumpkin seeds (dried at 105 °C), it amounted to 18,228 kJ·kg−1. After torrefaction at 300 °C, the HHV = 28,488 kJ·kg−1. It was the highest value of HHV across the investigated materials. The lowest value of HHV at 300 °C was observed for orange peels (23,447 kJ·kg−1). Walnut shells were characterized by the lowest increase in HHV (from 19,604 kJ·kg−1 at 105 °C to 24,343 kJ·kg−1 at 300 °C).
Lower heating values (LHV) depended on the initial moisture content in the food waste biomass (Figure 9). The lowest LHV was calculated for the pumpkin seeds at a temperature of 105 °C (17,110 kJ·kg−1). Black currant pomace was characterized by the highest LHV amounted to 26,902 kJ·kg−1 at 300 °C.
Data analysis of the heating value shows a dependence of HHV on the temperature of the torrefaction process. During the torrefaction, the mass losses are greater than the amount of energy accumulated in the volatile compounds released during the thermal conversion. As a consequence, an (LHV and HHV) included in the mass unit of the torrefied material (biochar) raise [28]. A higher temperature during the torrefaction process allows higher production of oxygenated volatiles, resulting in lower char yield and elevated HHV [55]. An increase in heating values of the plants during the torrefaction process was investigated and confirmed by Mundike et al. [56], as well. In their studies, the materials, such as Lantana camara (LC) and Mimosa pigra (MP), were investigated. The torrefaction at 250 °C caused the increase in HHV by +2.1 MJ·kg−1 for LC and +1.49 MJ·kg−1 for MP, compared to 200 °C. The largest increase in HHV was observed between the temperatures 250 and 280 °C (+6.19 MJ·kg−1 for LC and +4.62 MJ·kg−1 for MP).
Based on the water absorption time, the hydrophobic properties of the tested materials were determined. The torrefied material (pumpkin seeds dried at 105 °C), shown in Figure 10a, was characterized by hydrophilic properties. After a few seconds from the beginning of the test, drops of water were completely absorbed by the investigated material. In the case of the torrefied material (pumpkin seeds torrefied at 240 °C), the strong/severe hydrophobic properties were established (Figure 10b). In turn, Figure 10c shows the extremely hydrophobic properties obtained by pumpkin seeds torrefied at 300 °C. The drops of water stuck well on the surface of the material throughout the test.
Analyzing the influence of the temperature of the torrefaction process on the hydrophobic properties of the tested organic materials, different courses of variation of these properties were observed depending on the type of waste biomass. Black currant pomace and apple pomace were characterized by a different course of the variability of their hydrophobic properties compared to other samples (orange peels, walnut shells, pumpkin seeds).
In the case of black currant pomace, in the temperature range of the torrefaction process from 200 °C to 280 °C, no significant changes in hydrophobic properties were observed in comparison to the reference sample (dried at 105 °C) (Figure 11a). In this range, the black currant pomace was characterized by slightly hydrophobic or hydrophilic properties, although the process temperature increased. These slight variations might be explained by the fact that the difference in the drop penetration time between the classification of the material as hydrophobic (more than 5 s and less than 60 s) and hydrophilic (below 5 s) was very small. If the composition of the black currant pomace itself is considered to be not completely homogeneous (without the external impurities), as it may contain petioles, leaves, stalks, peels, and seeds, the heterogeneous nature of the material may influence small differences in the degree of carbonization and thus final results. However, a further increase in temperature of the process (300 °C) already caused a significant change in the hydrophobic properties of the torrefied black currant pomace. In this temperature, the tested material was characterized by severely hydrophobic properties, where the water drop penetration time was ca. 2000 s.
In the range of the torrefaction process temperatures from 200 °C to 280 °C, in the case of apple pomace, a consistent improvement in hydrophobic properties was observed as the process temperature increased (Figure 11b). In this range of temperatures, the material changed their hydrophobic properties from strongly hydrophobic (200 °C) to severely hydrophobic (220–280 °C). However, as in the case of black currant pomace, the largest increase and the best hydrophobic property was achieved for the process temperature of 300 °C. Torrefied apple pomace at a temperature of 300 °C was characterized by extremely hydrophobic properties with a water drop penetration time of 9200 s.
The torrefaction process had also a positive effect on the hydrophobic properties of orange peels, walnut shells, and pumpkin seeds. However, in this case, the course of change of hydrophobic properties differed from fruit pomaces. For the torrefied orange peels, walnut shells, and pumpkin seeds, the largest increase of hydrophobic properties was observed in the range of temperatures from 200 °C to 280 °C (Figure 12).
The torrefied orange peels (Figure 12a) reached the extremely hydrophobic properties at a temperature of 240 °C, and the largest increase of hydrophobic properties was achieved in the range of temperature from 200 °C to 240 °C. At a temperature of 240 °C, the further increase in the penetration time of water drop was not as significant. The thermal treatment of the raw material at a temperature of 300 °C did not improve the hydrophobic properties. The time of the water drop penetration was similar at 280 °C and 300 °C (between 6000 and 7000 s).
A similar relationship was observed for torrefied walnut shells (Figure 12b). The largest increase of hydrophobic properties was noted in the range of torrefaction process temperatures from 200 °C to 260 °C. Extremely hydrophobic properties were already achieved at 220 °C (WDPT was 4600 s). Again, at a temperature of 240 °C, the dynamics of the water drop penetration time diminished. Further increase in the process temperature (to 300 °C) did not result in an increase in water drop penetration time and thereby the hydrophobic properties.
In the case of pumpkin seeds (Figure 12c), in the range of temperature from 200 °C to 240 °C, the change of hydrophobic properties was low. The material was characterized by slightly hydrophobic properties at 105 °C (reference sample), strongly hydrophobic at 200 °C, and severely hydrophobic at 220 °C and 240 °C. The largest change in hydrophobic properties of pumpkin seeds was observed from 240 °C to 280 °C. Torrefied pumpkin seeds were characterized by extremely hydrophobic properties already at the temperature of 260 °C. The temperature increase of the torrefaction process from 280 °C to 300 °C did not change its hydrophobic properties.
The performed research confirmed that the temperature of the torrefaction process affected significantly the hydrophobicity properties of the waste biomass material produced during food processing. The increase of the temperature from 200 °C to 300 °C caused the improvement in the hydrophobic properties of the material. The studies of other researchers have also shown the impact of the torrefaction temperature on hydrophobic properties [41,57,58]. Sokhansanj et al. [59] noted a 25% decrease in the water uptake of torrefied biomass (wood pellets) (250 °C and 300 °C) compared to the untreated reference sample of wood pellets. Significant improvement in hydrophobicity of biomass material at the level of 50% reduction of hygroscopicity was achieved in studies carried out by Chen D. et al. [39] and Chen W.H. et al. [60].
However, analyzing a wider range of temperatures than in other studies, it was observed that only in a certain temperature range of the torrefaction process (mainly from 200 °C to 280 °C), there was a significant improvement in hydrophobicity. The application of the higher process temperature (i.e., 300 °C) did not bring tangible benefits in hydrophobicity; instead, it required a greater amount of energy needed to maintain this temperature in the chamber. Thus, the determination of the optimal value of the torrefaction temperature is crucial to optimize the costs and energy input for the process.
The hydrophobicity improvement of the material at a higher temperature of the process is associated with the degradation of hydroxyl groups that are responsible for the binding of moisture in the material. Chen et al. [61] described the relationship between the presence of hydroxyl groups (O-H bonds) and the thermal processing of the material. The higher temperature of the process causes the dissolution and dehydration of O-H bonds, thus improving the hydrophobicity of the material [62,63]. As a result, the disintegration of these bonds causes a decrease in the moisture uptake coefficient.
From the economic point of view, it should be marked that the improvement of the waste biomass (as alternative fuel) properties by thermal processing is associated with higher energy consumption by the reactor (muffle oven, internal dimensions of the chamber: 32.0 cm x 15.0 cm x 20.5 cm). The energy demand for a torrefaction process increased with a temperature increase (Figure 13). During these studies, the torrefaction process at 200 °C demanded ca. 320 Wh of energy (duration time of the torrefaction process was 60 min). At the higher temperatures, energy consumption was also higher, at 260 °C, it was 428 Wh and, at the 300 °C, it was 480 Wh, respectively. Therefore, the determination of the optimal temperature of the process at which the torrefied material reaches the expected hydrophobic properties or heating value is very important in relation to the processing costs.

4. Conclusions

Biomass resistance to moisture absorption is an important aspect in terms of its use as an energy source. The unprocessed and raw material is exposed to the negative effect of external conditions. Raw biomass absorbs more moisture than torrefied biomass (biochar) due to its poor hydrophobic properties. An increase in the moisture content of the material causes a decrease in the quality of the fuel and also creates a problem during its transport and storage.
Based on the performed research, it could be concluded that the increase of torrefaction process temperature resulted in the increase of the hydrophobic properties of agri-food industry wastes, such as black currant and apple pomace, orange peels, walnut shells, and pumpkin seeds. However, the range of the process temperature should be properly chosen due to the technical and economic aspects (concerns). A too high temperature of the torrefaction process might result in high energy consumption with a small improvement in hydrophobic properties, leading to financial losses or unnecessary expenses. Thus, the optimization process should be applied to find a proper balance between the costs and expected biomass valorization.
This research provided also a room for further tests that could be oriented on the explanation of the different behavior of the organic materials during torrefaction. It is also still unknown what is a dominant driver of the changes in the hydrophobic properties (chemical or physical changes).

Supplementary Materials

The following are available online at https://www.mdpi.com/1996-1073/12/24/4609/s1, Table S1. Analysis of hydrophobic properties of the investigated materials., Table S2. Analysis of ash content, volatile matter content, higher heating value, lower heating value, and moisture content of the investigated materials.

Author Contributions

A.D. conceived and designed the research; T.N. and M.S. performed the research; A.D. and T.N. analyzed the data and contributed materials/analysis tools; A.D. and T.N. wrote the paper.

Funding

This research received no external funding. The APC was funded by the Institute of Agricultural Engineering of the Wroclaw University of Environmental and Life Sciences (Statutory activity B010/0036/19).

Conflicts of Interest

The author declares no conflict of interest.

Abbreviations

ACash content
ECEuropean Commission
EUEuropean Union
HHVhigher heating value
LHVlower heating value
LCLantana camara
LLLeucaena Leucocephala
MCmoisture content
MPMimosa pigra
OPFoil palm frond
RESrenewable energy sources
VMCvolatile matter content
WDPTwater drop penetration time

References

  1. Caineng, Z.; Qun, Z.; Guosheng, Z.; Bo, X. Energy Revolution: From a Fossil Energy Era to a New Energy Era. Nat. Gas Ind. 2016, 3, 1–11. [Google Scholar] [CrossRef] [Green Version]
  2. Filipovici, A.; Tucu, D.; Białowiec, A.; Bukowski, P.; Crisan, G.C.; Lica, S.; Pulka, J.; Dyjakon, A.; Dębowski, M. Effect of Temperature and Heating Rate on the Char Yield in Sorghum and Straw Slow Pyrolysis. Rev. Chem. 2017, 68, 576–580. [Google Scholar]
  3. Ociepa-Kubicka, A. Wykorzystanie Biomasy w Przedsiębiorstwach Energetycznych. Proc. Ecopole 2015, 9, 279–286. [Google Scholar]
  4. Wit, M.; Faaij, A. European Biomass Resource Potential and Costs. Biomass Bioenergy 2010, 34, 188–202. [Google Scholar] [CrossRef]
  5. European Commission. Estimates of European Food Waste Levels, Fusions Eu Project; European Commission: Stockholm, Sweden, 2016; ISBN 978-91-88319-01-2. [Google Scholar]
  6. Białecka, B. Gospodarka Odpadami z Przemysłu Rolno-Spożywczego w Województwie Śląskim. Problemy Ekol. 2008, 12, 28–32. [Google Scholar]
  7. Alvarez, J.G.; Moya, R.; Puente-Urbina, A.; Rodriguez-Zuniga, A. Thermogravimetric, Volatilization Rate, and Differential Scanning Calorimetry Analyses of Biomass of Tropical Plantation Species of Costa Rica Torrefied at Different Temperatures and Times. Energies 2018, 11, 696–720. [Google Scholar] [CrossRef] [Green Version]
  8. Dincer, I.; Midilli, A.; Kucuk, H. Progress in Sustainable Energy Technologies: Generating Renewable Energy; Springer International Publishing: Berlin, Germany, 2014; ISBN 978-3319078953. [Google Scholar]
  9. Tabil, L.; Adapa, P.; Kashaninejad, M. Biomass Feedstock Pre-Processing-Part 2: Densification. In Biofuel’s Engineering Process Technology; InTech: Rijeka, Croatia, 2011; ISBN 978-953-307-480-1. [Google Scholar]
  10. Singh, R.; Krishna, B.B.; Kumar, J.; Bhaskar, T. Opportunities for Utilization of Non-Conventional Energy Sources for Biomass Pretreatment. Bioresour. Technol. 2016, 199, 398–407. [Google Scholar] [CrossRef]
  11. Qiaoming, L.; Chmely, S.C.; Abdoulmoumine, N. Biomass Treatment Strategies for Thermochemical Conversion. Energy Fuels 2017, 31, 3525–3536. [Google Scholar] [CrossRef]
  12. Nguyen, C.V.; Lewis, D.; Chen, W.H.; Huang, H.W.; Al-Othman, Z.A.; Yamauchi, Y.; Wu, K.C.W. Combined treatments for producing 5-hydroxymethylfurfural (HMF) from lignocellulosic biomass. Catal. Today 2016, 278, 344–349. [Google Scholar] [CrossRef]
  13. Matsagar, B.M.; Hossain, S.A.; Islam, T.; Alamri, H.R.; Alothman, Z.A.; Yamauchi, Y.; Dhepe, P.L.; Wu, K.C.W. Direct Production of Furfural in One-pot Fashion from Raw Biomass Using Bronsted Acidic Ionic Liquids. Sci. Rep. 2017, 7, 13508. [Google Scholar] [CrossRef] [Green Version]
  14. Dutta, S.; Kim, J.; Ide, Y.; Kim, J.H.; Hossain, S.A.; Bando, Y.; Yamauchi, Y.; Wu, K.C.W. 3D network of cellulose-based energy storage devices and related emerging applications. Mater. Horiz. 2017, 4, 522–545. [Google Scholar] [CrossRef] [Green Version]
  15. Stępień, P.; Pulka, J.; Białowiec, A. Organic Waste Torrefaction–A Review: Reactor Systems, and the Biochar Properties. In Pyrolysis; IntechOpen: London, UK, 2017; ISBN 978-953-51-3312-4. [Google Scholar]
  16. Phanphanich, M.; Mani, S. Impact of Torrefaction on the Grindability and Fuel Characteristics of Forest Biomass. Bioresour. Technol. 2011, 102, 1246–1253. [Google Scholar] [CrossRef] [PubMed]
  17. Van der Stelt, M.J.C.; Gerhauser, H.; Kiel, J.H.A.; Ptasinski, K. Biomass Upgrading by Torrefaction for the Production of Biofuels: A Review. Biomass Bioenergy 2011, 35, 3748–3762. [Google Scholar] [CrossRef]
  18. Bajcar, M.; Zaguła, G.; Saletnik, B.; Tarapatskyy, M.; Puchalski, C. Relationship between Torrefaction Parameters and Physicochemical Properties of Torrefied Products Obtained from Selected Plant Biomass. Energies 2018, 11, 2919–2931. [Google Scholar] [CrossRef] [Green Version]
  19. Alvarez, A.; Gutierrez, G.; Matos, M.; Pizarro, C.; Bueno, J.L. Torrefaction of Short Rotation Coppice of Poplar under Oxidative and Non-Oxidative Atmospheres. Proceedings 2018, 2, 1479–1483. [Google Scholar] [CrossRef] [Green Version]
  20. Nunes, L.J.R.; Matias, J.C.O.; Catalão, J.P.S. A Review on Torrefied Biomass Pellets as a Sustainable Alternative to Coal in Power Generation. Renew. Sustain. Energy Rev. 2014, 40, 153–160. [Google Scholar] [CrossRef]
  21. Chen, W.; Peng, J.; Bi, X. A State of the Art Review of Biomass Torrefaction, Densification and Application. Renew. Sustain. Energy Rev. 2015, 44, 847–866. [Google Scholar] [CrossRef]
  22. Basu, P. Biomass Gasification, Pyrolysis and Torrefaction; Chapter 4; Academic Press: Cambridge, MA, USA, 2013; ISBN 978-0-12-396488-5. [Google Scholar]
  23. Bajcar, M.; Puchalski, C.; Saletnik, B.; Zaguła, G.; Fabisiak, A.; Malecka, K. Optymalizacja Punktu Temperaturowego i Czasu Trwania Procesu Toryfikacji Wybranych Produktów Odpadowych Rolniczej Produkcji Roślinnej; Wydawnictwo Uniwersytetu Rzeszowskiego: Rzeszów, Poland, 2015; ISBN 978-83-7996-216-7. [Google Scholar]
  24. Bergman, P.C.A.; Boersma, A.R.; Zwart, R.W.R.; Kiel, J.H.A. Torrefaction for Biomass Co-Firing in Existing Coal-Fired Power Stations. ECN BIOMASS 2005, ECN-C—05-013. Available online: https://publicaties.ecn.nl/PdfFetch.aspx?nr=ECN-C--05-013 (accessed on 10 October 2019).
  25. Wang, S.; Dai, G.; Ru, B.; Zhao, Y.; Wang, X.; Zhou, J.; Luo, Z.; Cen, K. Effects of Torrefaction on Hemicellulose Structural Characteristics and Pyrolysis Behaviours. Bioresour. Technol. 2016, 218, 1106–1114. [Google Scholar] [CrossRef]
  26. Prins, M.J.; Ptasinski, K.J.; Janssen, F.J.J.G. Torrefaction of Wood. Part 2: Analysis of Products. J. Anal. Appl. Pyrolysis 2006, 77, 35–40. [Google Scholar] [CrossRef]
  27. Satpathy, S.K.; Tabil, L.G.; Meda, V.; Naik, S.N.; Prasad, R. Torrefaction of Wheat and Barley Straw after Microwave Heating. Fuel 2014, 124, 269–278. [Google Scholar] [CrossRef]
  28. Uslu, A.; Faaij, A.P.C.; Bergman, P.C.A. Pre-Treatment Technologies and their Effect on International Bioenergy Supply Chain Logistics. Techno-Economic Evaluation of Torrefaction, Fast Pyrolysis and Palletisation. Energy 2008, 33, 1206–1223. [Google Scholar] [CrossRef]
  29. Bates, R.B.; Ghoniem, A.F. Modeling Kinetics-Transport Interactions during Biomass Torrefaction: The Effects of Temperature, Particle Size and Moisture Content. Fuel 2014, 137, 216–229. [Google Scholar] [CrossRef]
  30. Pimchuai, A.; Dutta, A.; Basu, P. Torrefaction of Agricultural Residues to Enhance Combustible Properties. Energy Fuels 2010, 24, 4638–4645. [Google Scholar] [CrossRef]
  31. Tumuluru, J.S.; Sokhansanj, S.; Wright, C.T.; Boardman, R.D.; Hess, R.J. Review on Biomass Torrefaction Process and Product Properties and Design of Moving Bed Torrefaction System Model Development. In Proceedings of the ASABE Annual International Meeting, Louisville, KY, USA, 7–10 August 2011. [Google Scholar]
  32. Hakkou, M.; Petrissans, M.; Gerardin, P.; Zoulalian, A. Investigation of the Reasons for Fungal Durability of Heat-Treated Beech Wood. Polym. Degrad. Stabil. 2006, 91, 393–397. [Google Scholar] [CrossRef]
  33. Carneiro, R.J.M.; Godina, R.; Oliveira, M.J.C.; Ribeiro, N.L.J. Future Perspectives of Biomass Torrefaction: Review of the Current State-Of-The-Art and Research Development. Sustainability 2018, 10, 2323. [Google Scholar] [CrossRef] [Green Version]
  34. Prins, M.J.; Ptasinski, K.J.; Janssen, F.J.J.G. More Efficient Biomass Gasification via Torrefaction. Energy 2006, 31, 3458–3470. [Google Scholar] [CrossRef]
  35. Peng, J.H.; Bi, H.T.; Lim, C.J.; Sokhansanj, S. Study on Density, Hardness, and Moisture Uptake of Torrefied Wood Pellets. Energy Fuels 2013, 27, 967–974. [Google Scholar] [CrossRef]
  36. Yan, W.; Acharjee, T.C.; Coronella, C.J.; Vasquez, V.R. Thermal Pretreatment of Lignocellulosic Biomass. Environ. Prog. Sustain. Energy 2009, 28, 435–440. [Google Scholar] [CrossRef]
  37. Strandberg, M.; Olofsson, I.; Pommer, L.; Wiklund-Lindstrom, S.; Aberg, K.; Nordin, A. Effects of Temperature and Residence Time on Continuous Torrefaction of Spruce Wood. Fuel Process. Technol. 2015, 134, 387–398. [Google Scholar] [CrossRef]
  38. Kinney, T.J.; Masiello, C.A.; Dugan, B.; Hackaday, W.C.; Dean, M.R.; Zygourakis, K.; Barnes, R.T. Hydrologic Properties of Biochars Produced at Different Temperatures. Biomass Bioenergy 2012, 41, 34–43. [Google Scholar] [CrossRef]
  39. Chen, D.; Zheng, Z.; Fu, K.; Zeng, Z.; Wang, J.; Lu, M. Torrefaction of Biomass Stalk and its Effect on the Yield and Quality of Pyrolysis Products. Fuel 2015, 159, 27–32. [Google Scholar] [CrossRef]
  40. Acharjee, T.C.; Coronella, C.J.; Vasquez, C.R. Effect of Thermal Pretreatment on Equilibrium Moisture Content of Lignocellulosic Biomass. Bioresour. Technol. 2011, 102, 4849–4854. [Google Scholar] [CrossRef] [PubMed]
  41. Alvarez, A.; Nogueiro, D.; Pizarro, C.; Matos, M.; Bueno, J.L. Non-Oxidative Torrefaction of Biomass to Enhance its Fuel Properties. Energy 2018, 158, 1–8. [Google Scholar] [CrossRef]
  42. Baronti, S.; Vaccari, F.P.; Miglietta, F.; Calzolari, C.; Lugato, C.; Orlandini, S.; Pini, R.; Zulian, C.; Genesio, L. Impact of Biochar Application on Plant Water Relations in Vitis Vinifera (L.). Eur. J. Agron. 2014, 53, 38–44. [Google Scholar] [CrossRef]
  43. Doerr, S.H. On Standardizing the “Water Drop Penetration Time” and the “Molarity of An Ethanol Droplet” Techniques to Classify Soil Hydrophobicity: A Case Study Using Medium Textured Soils. Earth Surf. Process. Landf. 1998, 23, 663–668. [Google Scholar] [CrossRef]
  44. PN-EN ISO 18134-2:2017-03E–Solid Biofuels. Determination of Moisture Content–Oven Dry Method–Part 2: Total Moisture–Simplified Method; European Committee for Standardization: Brussels, Belgium, 2017. [Google Scholar]
  45. PN-EN ISO 18125:2017-07. Solid Biofuels-Determination of Calorific Value; European Committee for Standardization: Brussels, Belgium, 2017. [Google Scholar]
  46. Dyjakon, A. The Influence of the Use of Windrowers in Baler Machinery on the Energy Balance during Pruned Biomass Harvesting in the Apple Orchard. Energies 2018, 11, 3236. [Google Scholar] [CrossRef] [Green Version]
  47. PN ISO 1171:2010–Solid Mineral Fuels. Determination of Ash; European Committee for Standardization: Brussels, Belgium, 2010. [Google Scholar]
  48. PN-EN ISO 18123:2016-01–Solid Fuels. Determination of Volatile Content by Gravimetric Method; European Committee for Standardization: Brussels, Belgium, 2016. [Google Scholar]
  49. Guatam, R.; Ashwath, N. Hydrophobicity of 43 Potting Media: Its Implications for Raising Seedlings in Revegetation Programs. J. Hydrol. 2012, 430–431, 111–117. [Google Scholar] [CrossRef]
  50. Bisdom, E.B.A.; Dekker, L.W.; Schoute, J.F.T. Water Repellency of Sieve Fractions from Sandy Soils and Relationships with Organic Material and Soil Structure. Geoderma 1993, 56, 105–118. [Google Scholar] [CrossRef]
  51. Tran, K.-Q.; Luo, X.; Seisenbaeva, G.; Jirjis, R. Stump torrefaction for bioenergy application. Appl. Energy 2012, 112, 539–546. [Google Scholar] [CrossRef]
  52. Berther, M.A.; Commandre, J.M.; Rouau, X.; Gontard, N.; Angellier-Coussy, H. Torrefaction Treatment of Lignocellulosic Fibres for Improving Fibre, Matrix Adhesion in a Biocomposite. Mater. Des. 2016, 92, 223–232. [Google Scholar] [CrossRef]
  53. Świechowski, K.; Liszewski, M.; Bąbelewski, P.; Koziel, J.A.; Białowiec, A. Oxytree Pruned Biomass Torrefaction: Mathematical Models of the Influence of Temperature and Residence Time on Fuel Properties Improvement. Materials 2019, 12, 2228. [Google Scholar] [CrossRef] [Green Version]
  54. Matali, S.; Rahman, N.A.; Idris, S.S.; Yaacob, N.; Alias, A.B. Lignocellulosic Biomass Solid Fuel Properties Enhancement Via Torrefaction. Proc. Eng. 2016, 148, 671–678. [Google Scholar] [CrossRef] [Green Version]
  55. Medic, D.; Darr, M.; Shah, A.; Potter, B.; Zimmerman, J. Effects of Torrefaction Process Parameters on Biomass Feedstock Upgrading. Fuel 2012, 91, 147–154. [Google Scholar] [CrossRef]
  56. Mundike, J.; Collard, F.X.; Görgens, J.F. Torrefaction of Invasive Alien Plantsl Influence of Heating Rate and Other Conversion Parameters on Mass Yield And Higher Heating Value. Bioresour. Technol. 2016, 209, 90–99. [Google Scholar] [CrossRef]
  57. Wang, Z.; Lim, C.J.; Grace, J.R. Biomass Torrefaction in a Slot-Rectangular Spouted Bed Reactor. Particuology 2018, 42, 154–162. [Google Scholar] [CrossRef]
  58. Matali, S.; Rahman, N.A.; Idris, S.S.; Yaacob, N. Enhancement of Energy Properties of Leucaena Leucocephala Pellets Via Torrefaction and its Non-Isothermal Decomposition Kinetics. Int. J. Eng. Technol. 2018, 7, 306–310. [Google Scholar]
  59. Sokhansanj, S.; Peng, J.H.; Bi, X.T.; Lim, C.J.; Wang, L.; Lam, P.S.; Hoi, J.P.; Melin, S.; Tumuluru, C.T.; Wright, C.T. Optimum Torrefaction and Pelletization of Biomass Feedstock. In Symposium on Thermal and Catalytic Science for Biofuels and Biobased Products; Iowa State University: Ames, IA, USA, 2010; pp. 21–23. [Google Scholar]
  60. Chen, W.H.; Lin, B.J.; Colin, B.; Chang, J.S.; Petrissans, A.; Bi, X.; Petrissans, M. Hygroscopic Transformation of Woody Biomass Torrefaction for Carbon Storage. Appl. Energy 2018, 231, 768–776. [Google Scholar] [CrossRef]
  61. Chen, Y.; Liu, B.; Yang, H.; Yang, Q.; Chen, H. Evolution of Functional Groups and Pore Structure During Cotton and Corn Stalks Torrefaction and its Correlation with Hydrophobicity. Fuel 2014, 137, 41–49. [Google Scholar] [CrossRef]
  62. Chen, D.; Gao, A.; Cen, K.; Zhang, J.; Cao, X.; Ma, Z. Investigation of Biomass Torrefaction Based on Three Major Components: Hemicellulose, Cellulose and Lignin. Energy Convers. Manag. 2018, 169, 228–237. [Google Scholar] [CrossRef]
  63. Wang, S.; Dai, G.; Ru, B.; Zhao, Y.; Wang, X.; Xiao, G.; Luo, Z. Influence of Torrefaction on the Characteristics and Pyrolysis Behaviour of Cellulose. Energy 2017, 120, 864–871. [Google Scholar] [CrossRef]
Figure 1. Conversion methods of raw biomass.
Energies 12 04609 g001
Figure 2. Biomass transformations during torrefaction process (adopted from [23,24]).
Energies 12 04609 g002
Figure 3. Organic materials used in the studies: (a) black currant pomace; (b) apple pomace; (c) orange peels; (d) walnut shells; (e) pumpkin seeds.
Energies 12 04609 g003
Figure 4. Laboratory devices: (a) biomass mill LMN 400; (b) muffle furnace SNOL82/1100; (c) moisture analyzer SARTORIUS MA150; (d) calorimetric bomb IKA C200; (e) a set for WDPT (water drop penetration time) test.
Energies 12 04609 g004
Figure 5. Color change of the material depending on the torrefaction process temperature: (a) 105 °C (drying); (b) 200 °C; (c) 220 °C; (d) 240 °C; (e) 260 °C; (f) 280 °C; (g) 300 °C.
Energies 12 04609 g005
Figure 6. Ash content in the torrefied food waste biomass.
Energies 12 04609 g006
Figure 7. Volatile matter content in torrefied food waste biomass.
Energies 12 04609 g007
Figure 8. The higher heating value of torrefied food waste biomass.
Energies 12 04609 g008
Figure 9. The lower heating value of torrefied food waste biomass.
Energies 12 04609 g009
Figure 10. Type of hydrophobic properties of torrefied biomass: (a) hydrophilic (105 °C); (b) strongly hydrophobic (240 °C); (c) extremely hydrophobic (300 °C).
Energies 12 04609 g010
Figure 11. Hydrophobic properties as a function of torrefaction process temperature of (a) torrefied black currant pomace; (b) torrefied apple pomace.
Energies 12 04609 g011
Figure 12. Hydrophobic properties as a function of torrefaction process temperature of (a) orange peels; (b) walnut shells; (c) pumpkin seeds.
Energies 12 04609 g012
Figure 13. The influence of the temperature on energy consumption by the muffle furnace during the torrefaction process.
Energies 12 04609 g013
Table 1. Classification criterion of hydrophobic properties [49,50].
Classification Criterion
Time of the Penetration of a Drop of Water
Hydrophobic Properties
<5 sHydrophilic
5–60 sSlightly hydrophobic
60–600 sStrongly hydrophobic
600–3600 sSeverely hydrophobic
>3600 sExtremely hydrophobic

