Article

Electrochemical Impedance Spectroscopy on the Performance Degradation of LiFePO4/Graphite Lithium-Ion Battery Due to Charge-Discharge Cycling under Different C-Rates

Department of Mathematical Science and Electrical-Electronic-Computer Engineering, Akita University, Tegatagakuen-machi 1-1, Akita 010-8502, Japan
*
Author to whom correspondence should be addressed.
Energies 2019, 12(23), 4507; https://doi.org/10.3390/en12234507
Submission received: 21 October 2019 / Revised: 18 November 2019 / Accepted: 23 November 2019 / Published: 27 November 2019
(This article belongs to the Special Issue Testing and Management of Lithium-Ion Batteries)

Abstract

:
Lithium-ion batteries (LIBs) using a LiFePO4 cathode and graphite anode were assembled in coin cell form and subjected to 1000 charge-discharge cycles at 1, 2, and 5 C at 25 °C. The performance degradation of the LIB cells under different C-rates was analyzed by electrochemical impedance spectroscopy (EIS) and scanning electron microscopy. The most severe degradation occurred at 2 C while degradation was mitigated at the highest C-rate of 5 C. EIS data of the equivalent circuit model provided information on the changes in the internal resistance. The charge-transfer resistance within all the cells increased after the cycle test, with the cell cycled at 2 C presenting the greatest increment in the charge-transfer resistance. Agglomerates were observed on the graphite anodes of the cells cycled at 2 and 5 C; these were more abundantly produced in the former cell. The lower degradation of the cell cycled at 5 C was attributed to the lowered capacity utilization of the anode. The larger cell voltage drop caused by the increased C-rate reduced the electrode potential variation allocated to the net electrochemical reactions, contributing to the charge-discharge specific capacity of the cells.

Graphical Abstract

1. Introduction

Lithium-ion batteries (LIBs) have been extensively used as rechargeable power sources for mobile and automotive products. The applications of LIBs as secondary batteries in electric vehicles and large-scale renewable energy storage systems are now on the rise owing to their superior performances, including a higher energy density, superior power capability, long cycle-life, and low-cost [1,2,3,4,5]. Current LIBs generally comprise a lithium transition metal oxide cathode, graphitic anode, porous separator, and non-aqueous electrolyte. LiFePO4 (LFP) has been utilized as the cathode active material because of its high theoretical specific capacity (170 mAh·g−1), good cycling stability, higher safety, low cost, and non-toxicity [6,7,8,9]. However, LFP has the disadvantages of low electrical and ionic conductivities. Thus, LFP particles have been carbon coated prior to cathode fabrication to secure a sufficient reversible specific capacity and the required stability against the high current density [6]. Graphitic anodes have been widely used in commercial LIBs owing to their superior high theoretical specific capacity (372 mAh·g−1), low working potential (~0 V vs. Li/Li+), low cost, and natural abundance [10,11,12]. LIBs comprising an LFP cathode and graphite anode show great potential for application as electric vehicles and large-scale energy storage systems.
The operating conditions during charge-discharge cycling strongly influence various properties of the LIB cells. Thus, many studies targeting the performance degradation of LIB cells under various operating conditions have been reported [13,14,15,16,17,18,19]. Most works have focused on the effect of temperature on the cell performances. Guo and Chen examined the capacity fading mechanism of LFP/graphite soft-packed cells, including a commercial electrolyte with functional additives under high temperature conditions (25, 45, and 60 °C) [13]. Sun et al. investigated the charge-discharge cycling performance of commercial LFP/graphite LIBs in the temperature range 25–55 °C, revealing that the degree of capacity fading was influenced by the operating temperature [14]. Zhang et al. studied the performances of LIBs comprising an Ni-based cathode and graphite anode under low temperatures, and reported poor cell performances at low temperatures of <−10 °C [15]. Moreover, high temperatures of >50 °C led to performance degradation, such as a decrease in the reversible charge-discharge specific capacity and increase in the charge-transfer resistance (Rct) within the anode active materials [13,14]. Under low temperatures, the large IR drop at the beginning of charging and discharging was responsible for the decrease in the cell capacity, even at a low current density. The enhancement of internal resistance closely related to the charge-transfer resistance was noticeable [15].
In the above studies [13,14,15], the current densities of the charge-discharge tests were confined to low values (<1 C). The C-rate is the unit of charge-discharge current density in cells. 1 C is defined as the current level that fully discharges the fully charged cell in 1 h. Thus, 5 C is the current level fully discharging the fully charged cell in 1/5 (0.2) h. Generally, the cell capacity is determined from the cathode capacity. Guan et al. investigated the degradation of LiCoO2/graphite LIBs at different C-rates [16]. They allocated the C-rates, stepwise, during charge-discharge cycling at room temperature (~25 °C) and observed the Li deposition on the anode surface together. They also investigated the damage to the crystalline structure, caused by the charge-discharge cycling at high C-rates (>1.8 C), of both the anode and cathode active materials. Zheng et al. examined the degradation of power-type LFP/graphite LIBs operated under high-rate discharge (10 C) and high temperature (55 °C) [17]. Their results revealed that a high rate and temperature generally accelerated the performance degradation of the LFP/graphite LIBs. However, to date, performance degradation under moderately high current densities (1–5 C) during long-term charge-discharge cycling has not been reported in detail. Information on the effect of the C-rate on the long-term charge-discharge cycling stability aids in the design of various battery systems.
Electrochemical impedance spectroscopy (EIS) is a highly effective methodology to determine the electrochemical and impedance behaviors of LIBs without cell destruction [20,21,22,23,24,25,26,27,28]. The afforded EIS data can be thoroughly analyzed using an equivalent circuit model comprising circuit elements, such as the resistor, capacitance, Warburg impedance (Wz), and constant phase element (CPE). If a suitable equivalent circuit model is selected, the calculated parameters of the circuit elements provide a comprehensive understanding of the electrochemical and physical phenomena within the cell.
This study assembled LFP/graphite LIB coin cells and implemented 1000 galvanostatic charge-discharge cycles under different C-rates (1, 2, and 5 C) at 25 °C. The LIB cells were analyzed by EIS at 25 °C, before and after cycling, under DC bias voltages of 2.5, 3.3, and 4.2 V. Four equivalent circuit models were proposed to establish the model that best simulated the impedance feature of the LFP/graphite cell under different states of charge (SOCs). The most suitable model was selected by comparing the actual EIS curve with the curves produced by the parameter-fitting simulation; the electrochemical and physical phenomena occurring within the cell during cycling were subsequently discussed. Additionally, the surface morphology of the degraded cathode and anode after the cycling test was studied by scanning electron microscopy (SEM). Finally, a performance degradation mechanism of the LFP/graphite LIBs caused by charge-discharge cycling at 1, 2, and 5 C was proposed.

2. Experimental

LFP (1–3 mass% carbon-coated LiFePO4; Tatung Fine Chemical Co., Ltd., Taiwan) and graphite (spherical natural graphite; Nippon Graphite Co., Ltd., Otsu, Japan) were used as the cathode and anode active materials, respectively. The particle sizes of the LFP and graphite powders were 2 and 16 µm, respectively, as reported in the literature [29]. To fabricate the LFP cathode and graphite anode, a slurry was prepared by mixing the active material, conductive agent, and binder in a solvent. This was then pasted on a current collector. Acetylene black (AB; Denka Co., Ltd., Tokyo, Japan) was employed as the conductive agent while polyvinylidene difluoride (PVDF; KF Polymer F #9130, Kureha Corp., Tokyo, Japan) and styrene-butadiene rubber (SBR; TRD2001, JSR Corp., Tokyo, Japan) were used as the binder for the cathode and anode, respectively. Sodium carboxymethyl cellulose (CMC; Cellogen 7A, DKS Co., Ltd., Kyoto, Japan) was added as a dispersing agent for the graphite anode slurry. The respective cathode and anode solvents were N-methylpyrrolidone (Tokyo Chemical Industry Co., Ltd., Tokyo, Japan) and distilled water. Al and Cu foils (no surface treatment; Hohsen Corp., Osaka, Japan) were employed as the current collectors for the cathode and anode, respectively; the thickness of both current collectors was 20 µm. The LFP cathode comprised 80 mass% LFP, 10 mass% AB, and 10 mass% PVDF. The composition of the graphite anode was 90 mass% graphite, 5 mass% AB, 2.5 mass% SBR, and 2.5 mass% CMC. After pasting the slurry on the current collector, the resultant electrode sheet was dried in an oven at 100 °C for 6 h. The dried electrode sheet was smoothed by using a press machine with a pressure of 2 MPa, and punched out into disks (Φ15 mm). The punched electrodes were then degassed under vacuum at 140 °C for 6 h and were subsequently transferred into an argon-filled glove box without exposure to air.
CR2032-type coin cells (Hohsen Corp., Osaka, Japan) were used to assemble the LIB cells in which the LFP cathode, graphite anode, separator, and non-aqueous electrolyte were installed. The electrolyte comprised 1.0 mol·L−1 LiPF6 in an ethylene carbonate (EC) and diethyl carbonate (DEC) mixture (1 M LiPF6/EC+DEC, 1:1 v/v%, Kishida Chemical Co., Ltd., Osaka, Japan). The cathode and anode were separated by a polypropylene porosity separator. The electrodes and separator were dipped into the electrolyte for ~5 s to promote electrolyte penetration. Any excessive electrolyte thereon was removed by shaking the electrodes. The entire cell assembly was conducted in the argon-filled glove box. The active material loadings of the LFP and the graphite were 3.64 to 3.74 and 2.21 to 2.28 mg cm−2, respectively, with the respective loading thicknesses of 42 to 43 and 31 to 33 µm. The anode-to-cathode capacity ratio (A/C ratio) was calculated based on the determined specific capacities of LFP (170 mAh·g−1) and graphite (340 mAh·g−1) [29]. The A/C ratio of all the LIB cells was maintained at ~1.2 to prevent Li-metal deposition on the anode surface. The open circuit voltage (OCV) of the assembled LIB cells was measured using a digital multimeter (PC7000, Sanwa Electric Instrument Co., Ltd., Tokyo, Japan). The LIB cells were connected to an electrochemical measurement system (HZ-5000, Hokuto Denko Corp., Tokyo, Japan) after the OCV measurement.
Cyclic voltammetry (CV) was first implemented for the pristine LIB cells. The cell voltage was increased from the OCV to 4.2 V and then decreased to 2.5 V at the scan rate 0.1 mV·s−1. Subsequently, the cell voltage was increased to 4.2 V and decreased to 2.5 V at the same scan rate; this was performed twice. These three CV cycles aimed at electrochemically ensuring the formation of a solid–electrolyte interface (SEI) on the graphite anode, the process of which was denoted as the cell formation. Following CV, the LIB cell was subjected to EIS. An AC voltage with an amplitude of 5 mV was applied to the LIB cell, in which the frequency of the AC voltage was varied from 100 to 0.1 Hz. During EIS, the LIB cell was subjected to different DC bias voltages (2.5, 3.3, and 4.2 V) to acquire impedance spectra at the different SOCs. The cell was biased at the targeted DC voltage for 30 min via constant-voltage control mode. Subsequently, the AC voltage was applied to the cell under the maintenance of similar DC bias voltage, so as to produce an impedance spectrum of the cell under stable SOC. After the CV and EIS measurements, the LIB cell was connected to a battery charge-discharge system (HJ1020mSD8, Hokuto Denko Corp., Tokyo, Japan).
The cycling behavior of the LIB cell at different C-rates was evaluated via a constant current (CC) charge-discharge mode. The C-rate during the charge-discharge cycling was designed to be of moderate to moderately high class, namely 1, 2, and 5 C (170, 340, and 850 mA·gCathode−1). The actual current level was determined based on the specific capacity of the cathode active material (LFP; 170 mAh·g−1). The three LIB cells subjected to the charge-discharge cycling at 1, 2, and 5 C were denoted as the 1C-, 2C-, and 5C-cycling cells, respectively. All the LIB cells were initially charged and discharged at 0.1 C (17 mA·gCathode−1) to confirm their reversible cathode-based specific capacity. Next, the charge-discharge cycle was repeated 1000-fold, during which the cut-off voltages were set to 2.5 and 4.2 V. After charge-discharge cycling, EIS was again implemented using the abovementioned method.
The impedance spectra were reproduced based on the equivalent circuit model using EIS simulation software (EIS, Version 1.0.14, Hokuto Denko Corp., Tokyo, Japan). Four equivalent circuit models were proposed for the 1C-cycling cell to establish the model that best reproduced the actual impedance spectra. Subsequently, curve-fitting procedures using the assumed equivalent circuits were executed for the 1C-cycling cell at DC bias voltages of 2.5 and 4.2 V. The most suitable model for the LFP/graphite LIB cell was determined based on the fitness of the simulated impedance spectra. Finally, the impedance spectra of all the cells for all the DC bias voltages were thoroughly examined using the most suitable equivalent circuit model.
After the second EIS measurement, the LIB cells were transferred into an argon-filled glove box and disassembled using a coin cell disassembler (Hohsen Corp., Osaka, Japan). To remove the residual ions from the cathode and anode, the two electrodes were separately rinsed by immersion into a DEC solution (Wako Pure Chemicals Corp., Osaka, Japan). The extraneous DEC solution on each electrode was removed with a clean nonwoven cloth. Finally, the electrodes were dried under vacuum at 140 °C for 2 h. Pristine electrodes were also prepared for comparison. The surface morphology of the pristine and degraded cathodes and anodes were observed by SEM (VE-8800, Keyence Corp., Osaka, Japan). All the experiments and measurements were performed at 25 °C.

3. Results and Discussion

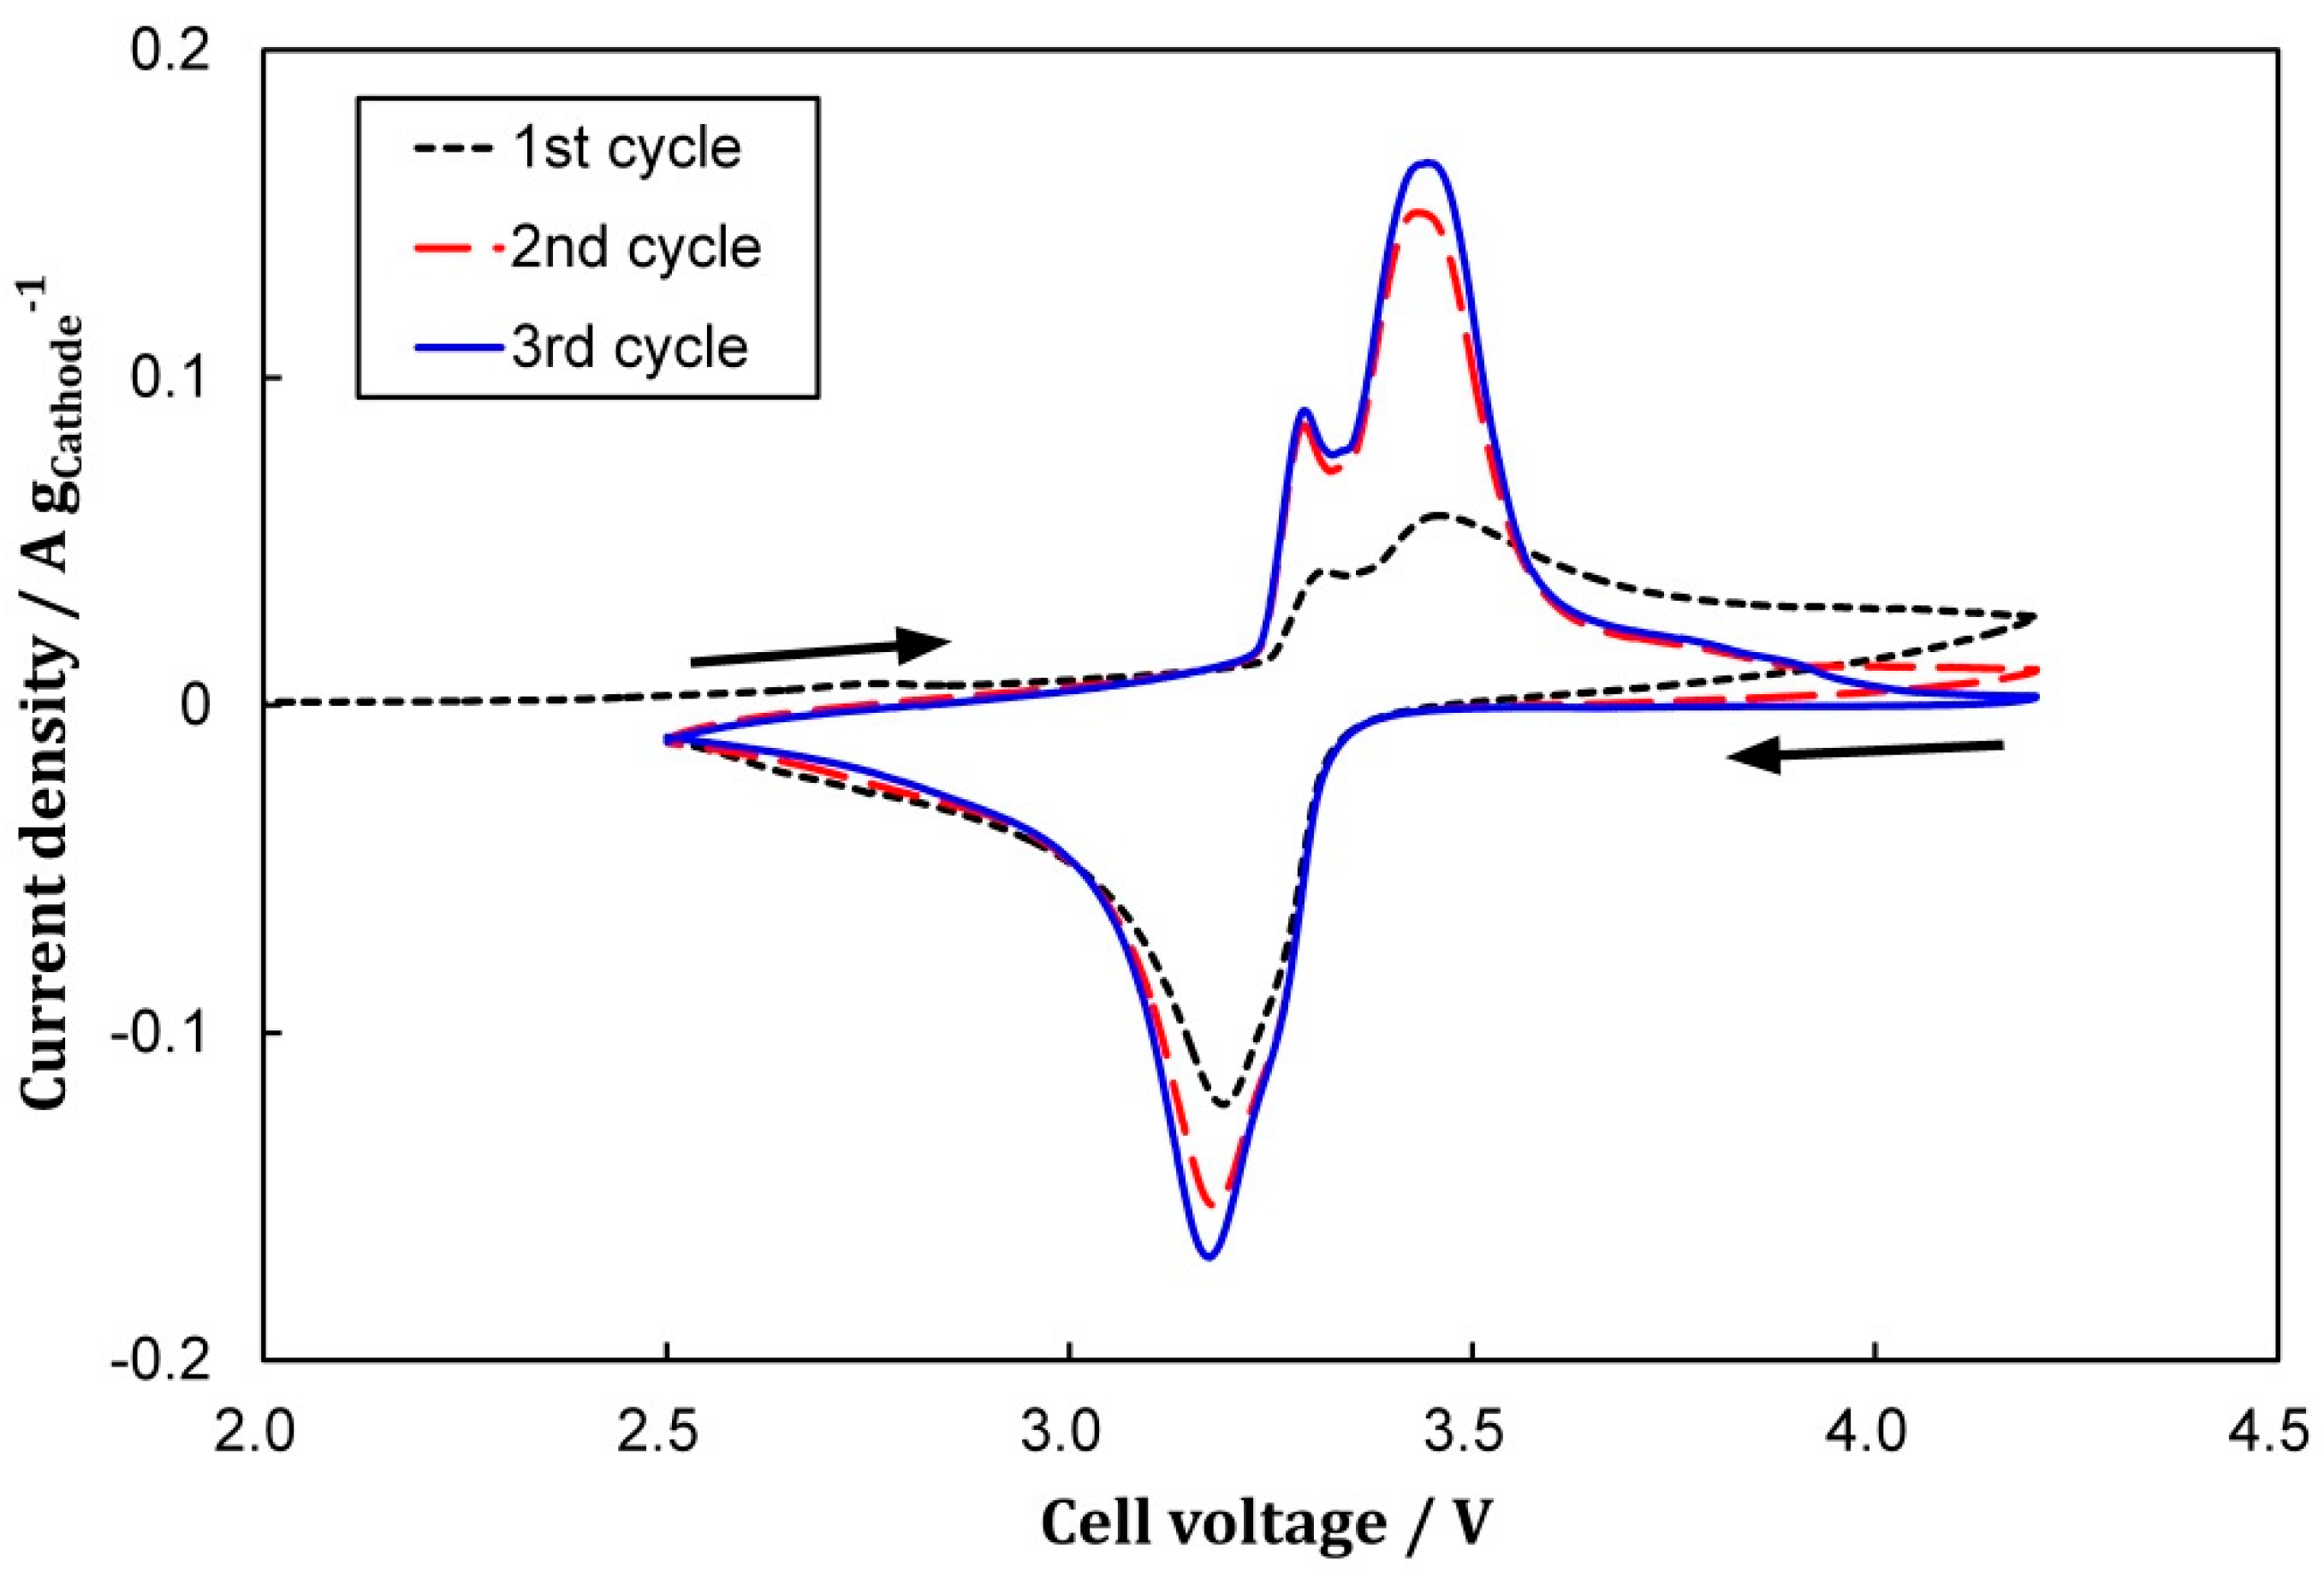
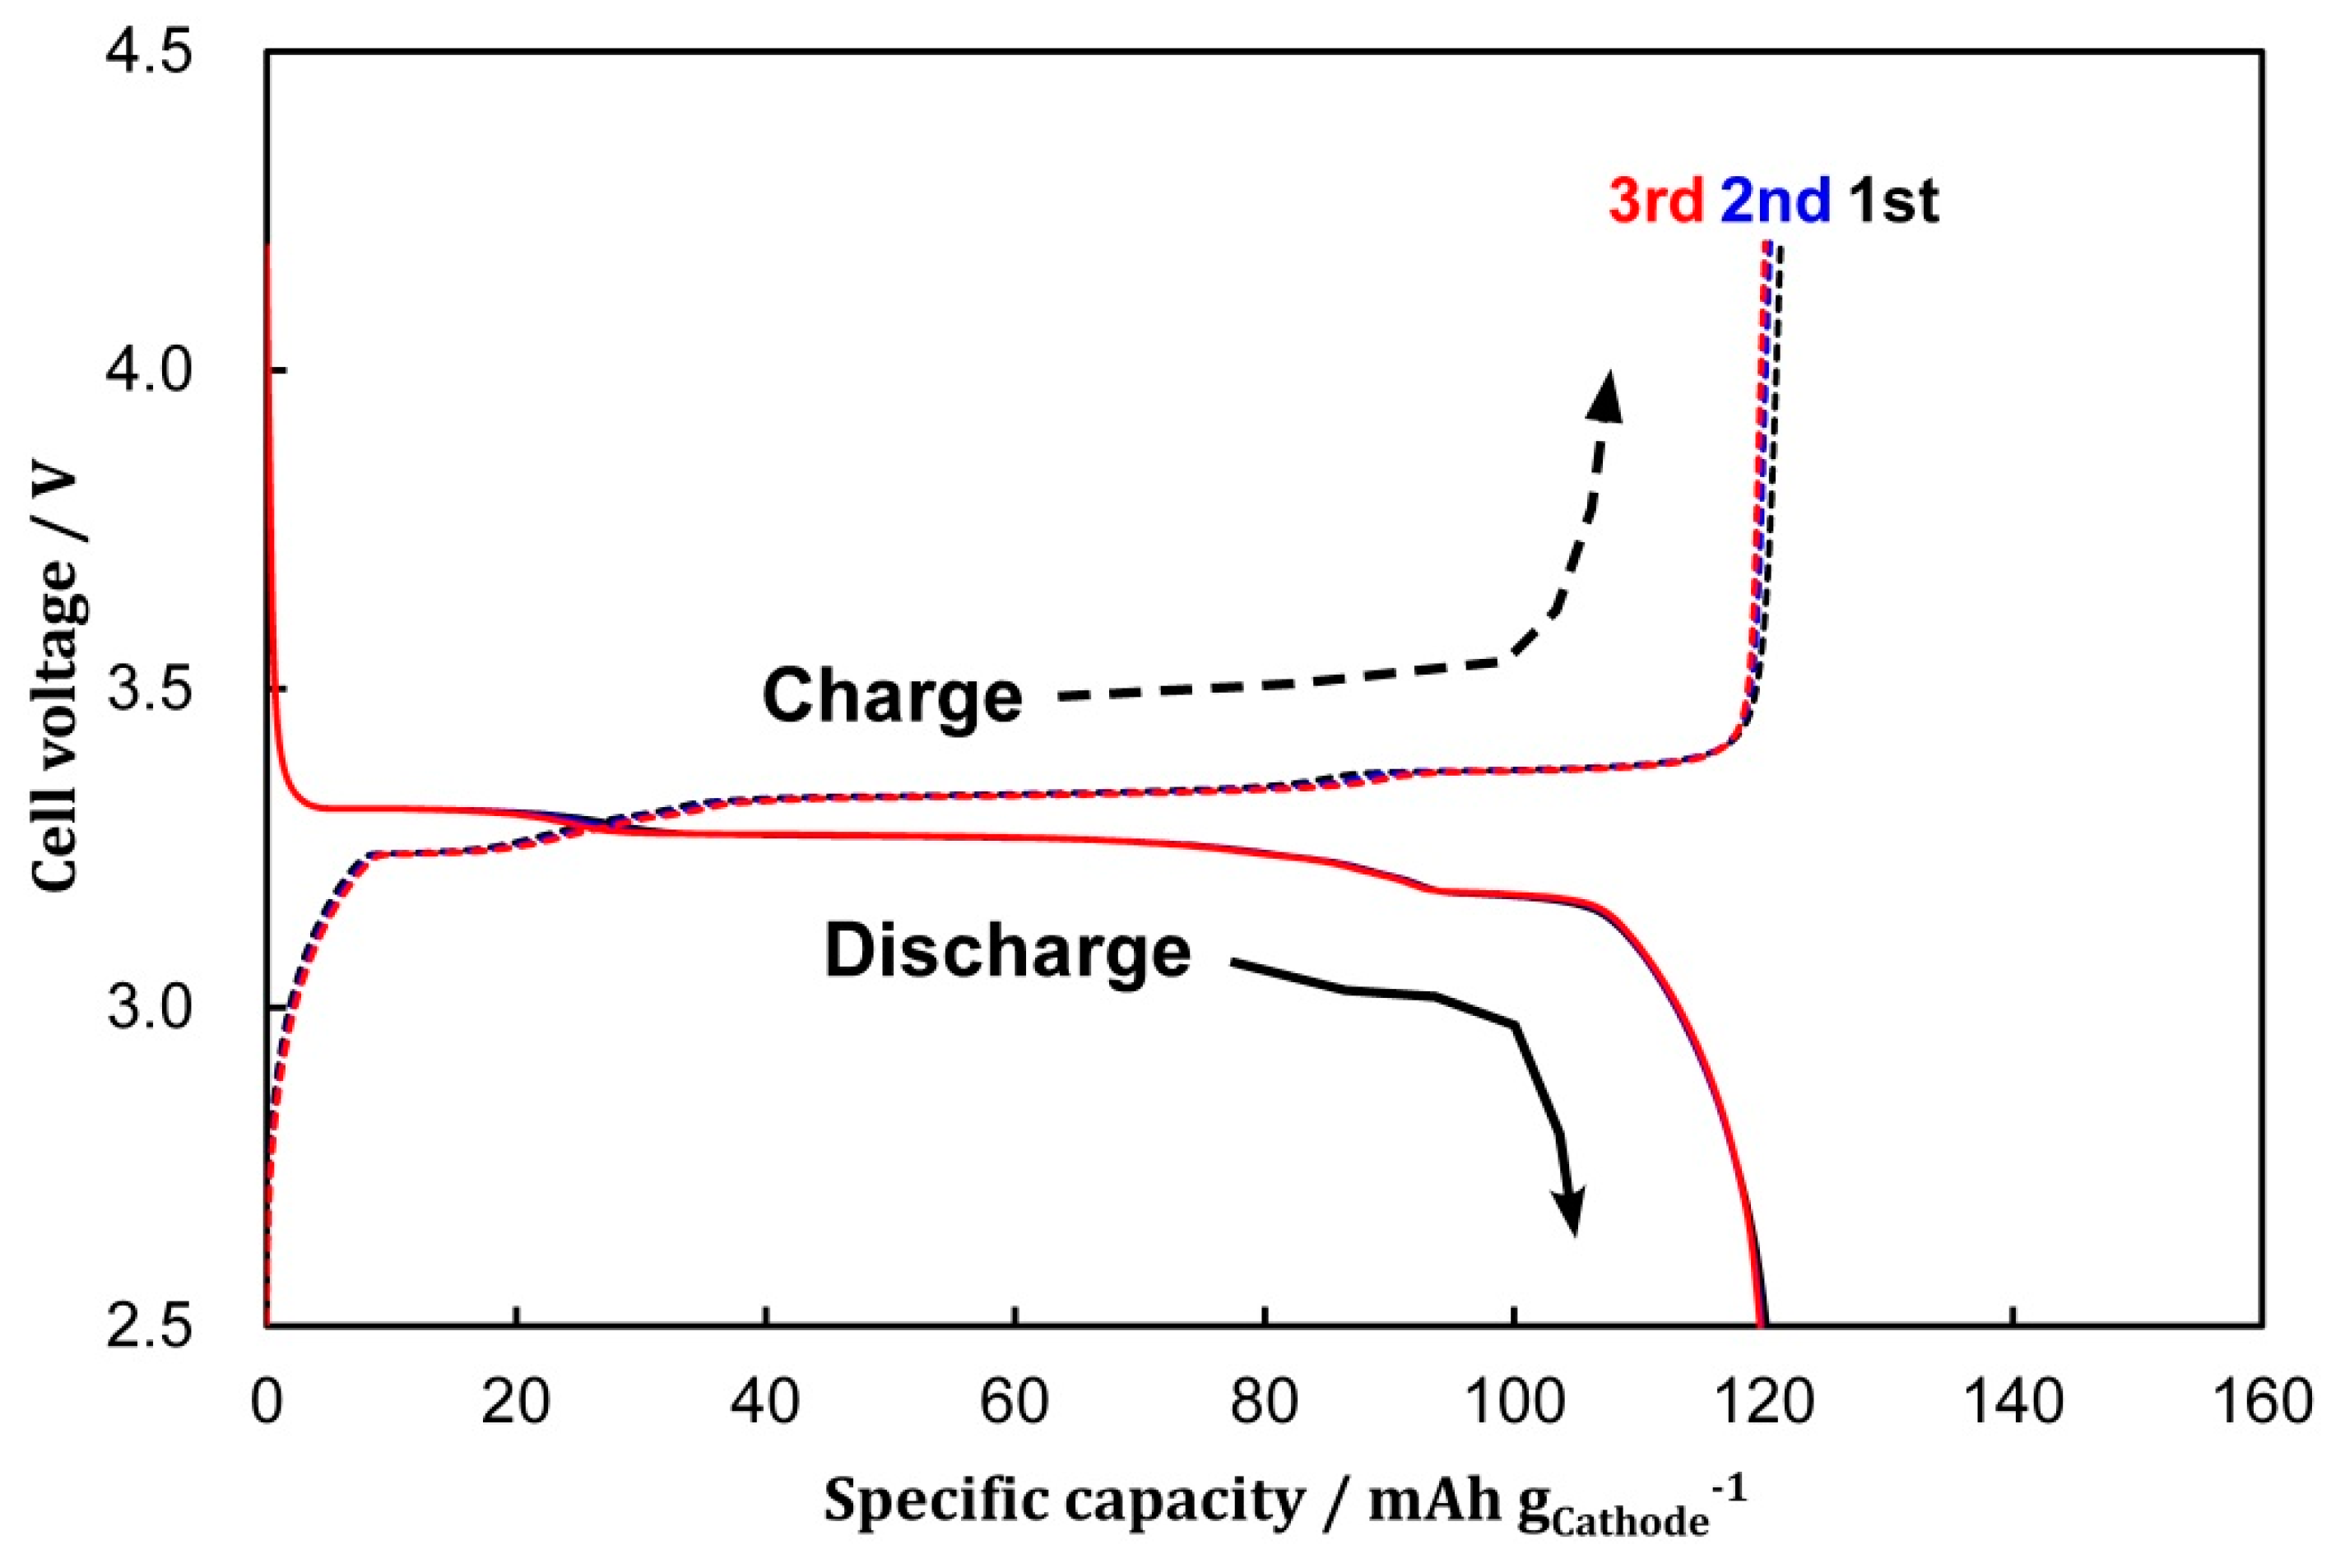
3.1. Cell Formation via CV

Cell formation by CV was achieved for the three assembled LIB cells and similar CV curves were observed for all the cells. The curve for the 1C-cycling cell is presented in Figure 1. The measured OCV of the 1C-cycling cell was 42 mV. During the positive (ascendant) voltage sweep, oxidation (Li-ion extraction) and reduction (Li-ion insertion) occurred within the LFP cathode and graphite anode, respectively. The inverse reactions, namely reduction at the cathode and oxidation at the anode, occurred during the negative (descendant) voltage sweep. The shape of the first-cycle curve was different from the subsequent cycles. The first cell voltage sweep, from the OCV to 4.2 V, allowed two humps at 3.3 and 3.4 V. Low current density (~0.03 A·gCathode−1) was maintained from 3.5 to 4.2 V during the first positive sweep, indicating that the SEI film was stably formed on the graphite anode. The second and third positive sweeps produced two distinct peaks at 3.3 and 3.4 V assigned to the two-step Li-ion extraction of LFP and Li-ion insertion of graphite; such peaks were also reported in the literature [9]. A solo sharp peak was similarly seen at the cell voltage of 3.2 V during the first three negative sweeps. This peak was ascribed to the Li-ion insertion (reduction) and extraction (oxidation) reactions within the LFP cathode and graphite anode, respectively.
Following cell formation via CV, all the cells were charged and discharged threefold at the low C-rate of 0.1 C; the 1, 2, and 5C-cycling cells displayed identical profiles. The charge-discharge profile of the 1C-cycling cell is displayed in Figure 2. The observed charge and discharge specific capacities and the Coulombic efficiencies (CEs) for the first three cycles are listed in Table 1. All the cells exhibited charge and discharge specific capacities of ~120 mAh·gCathode−1 during these three cycles. Moreover, the CE in these three cycles was >98.9%, indicating negligible irreversible reactions within these cells. The galvanostatic charge-discharge cycling at the low current density clearly led to sufficient preconditioning for the long-term charge-discharge cycling test.

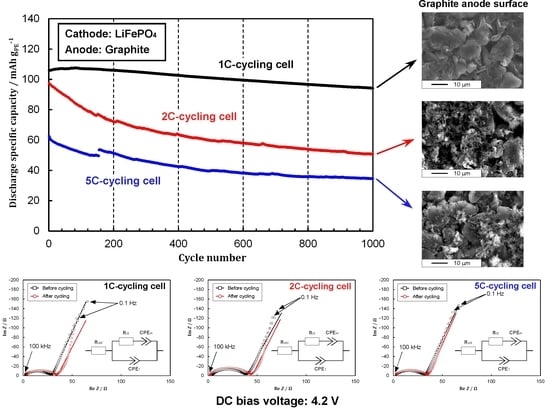
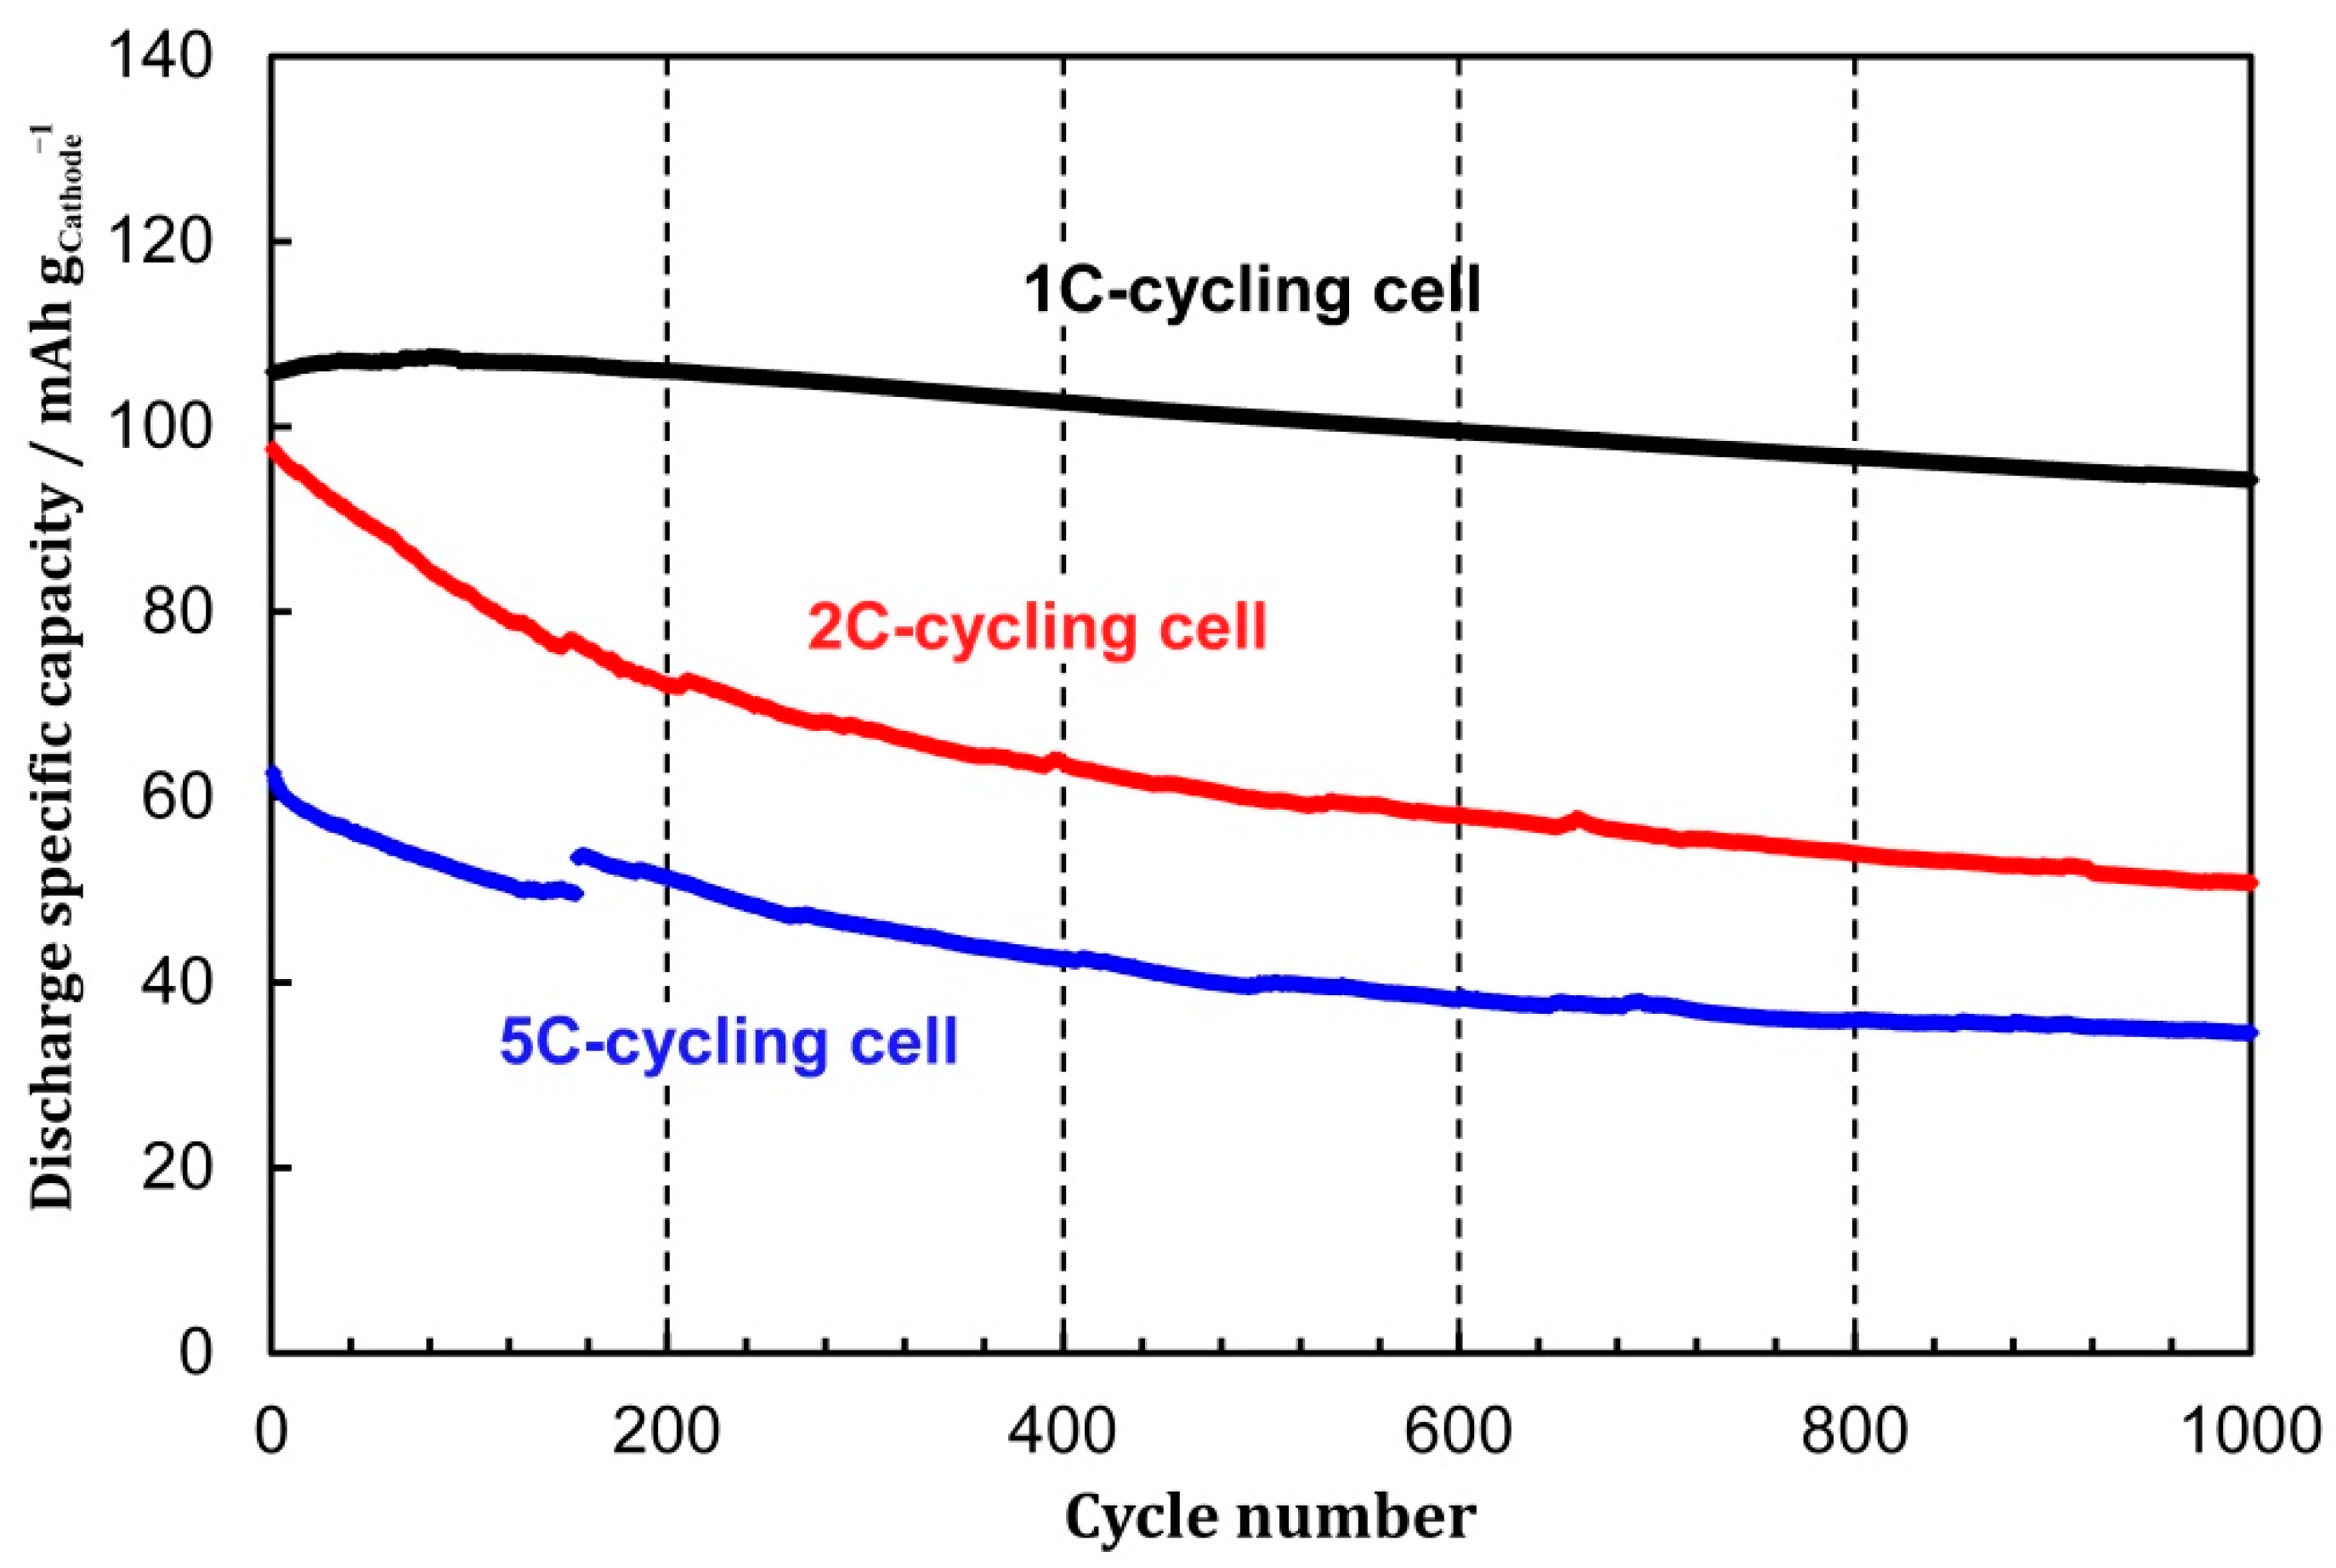
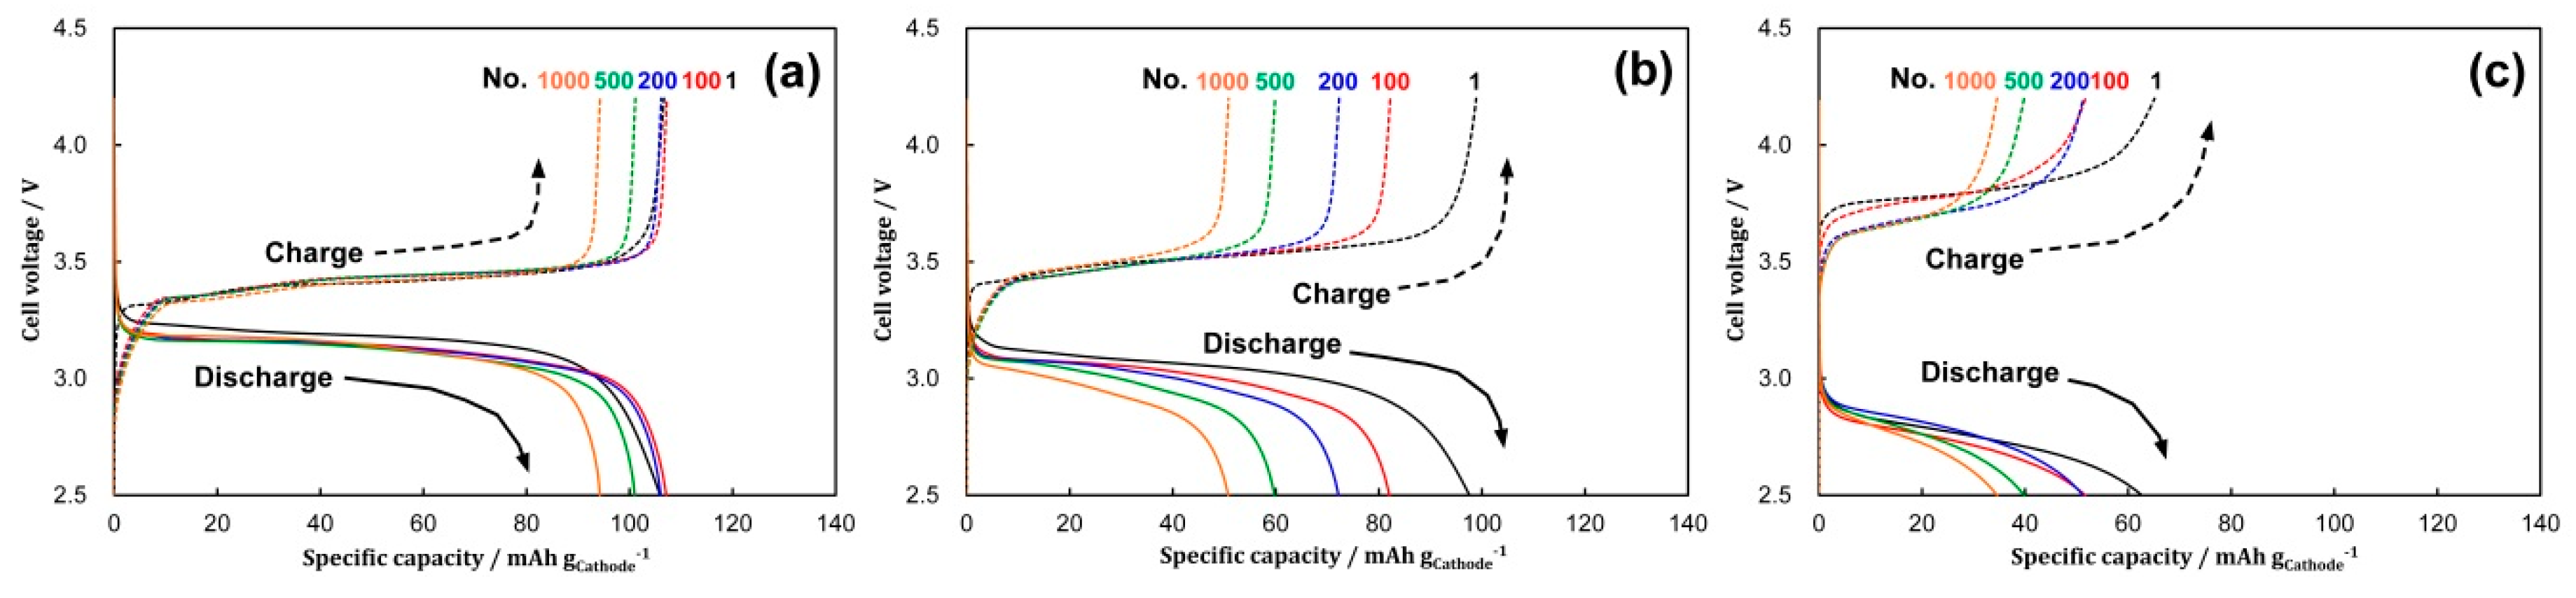
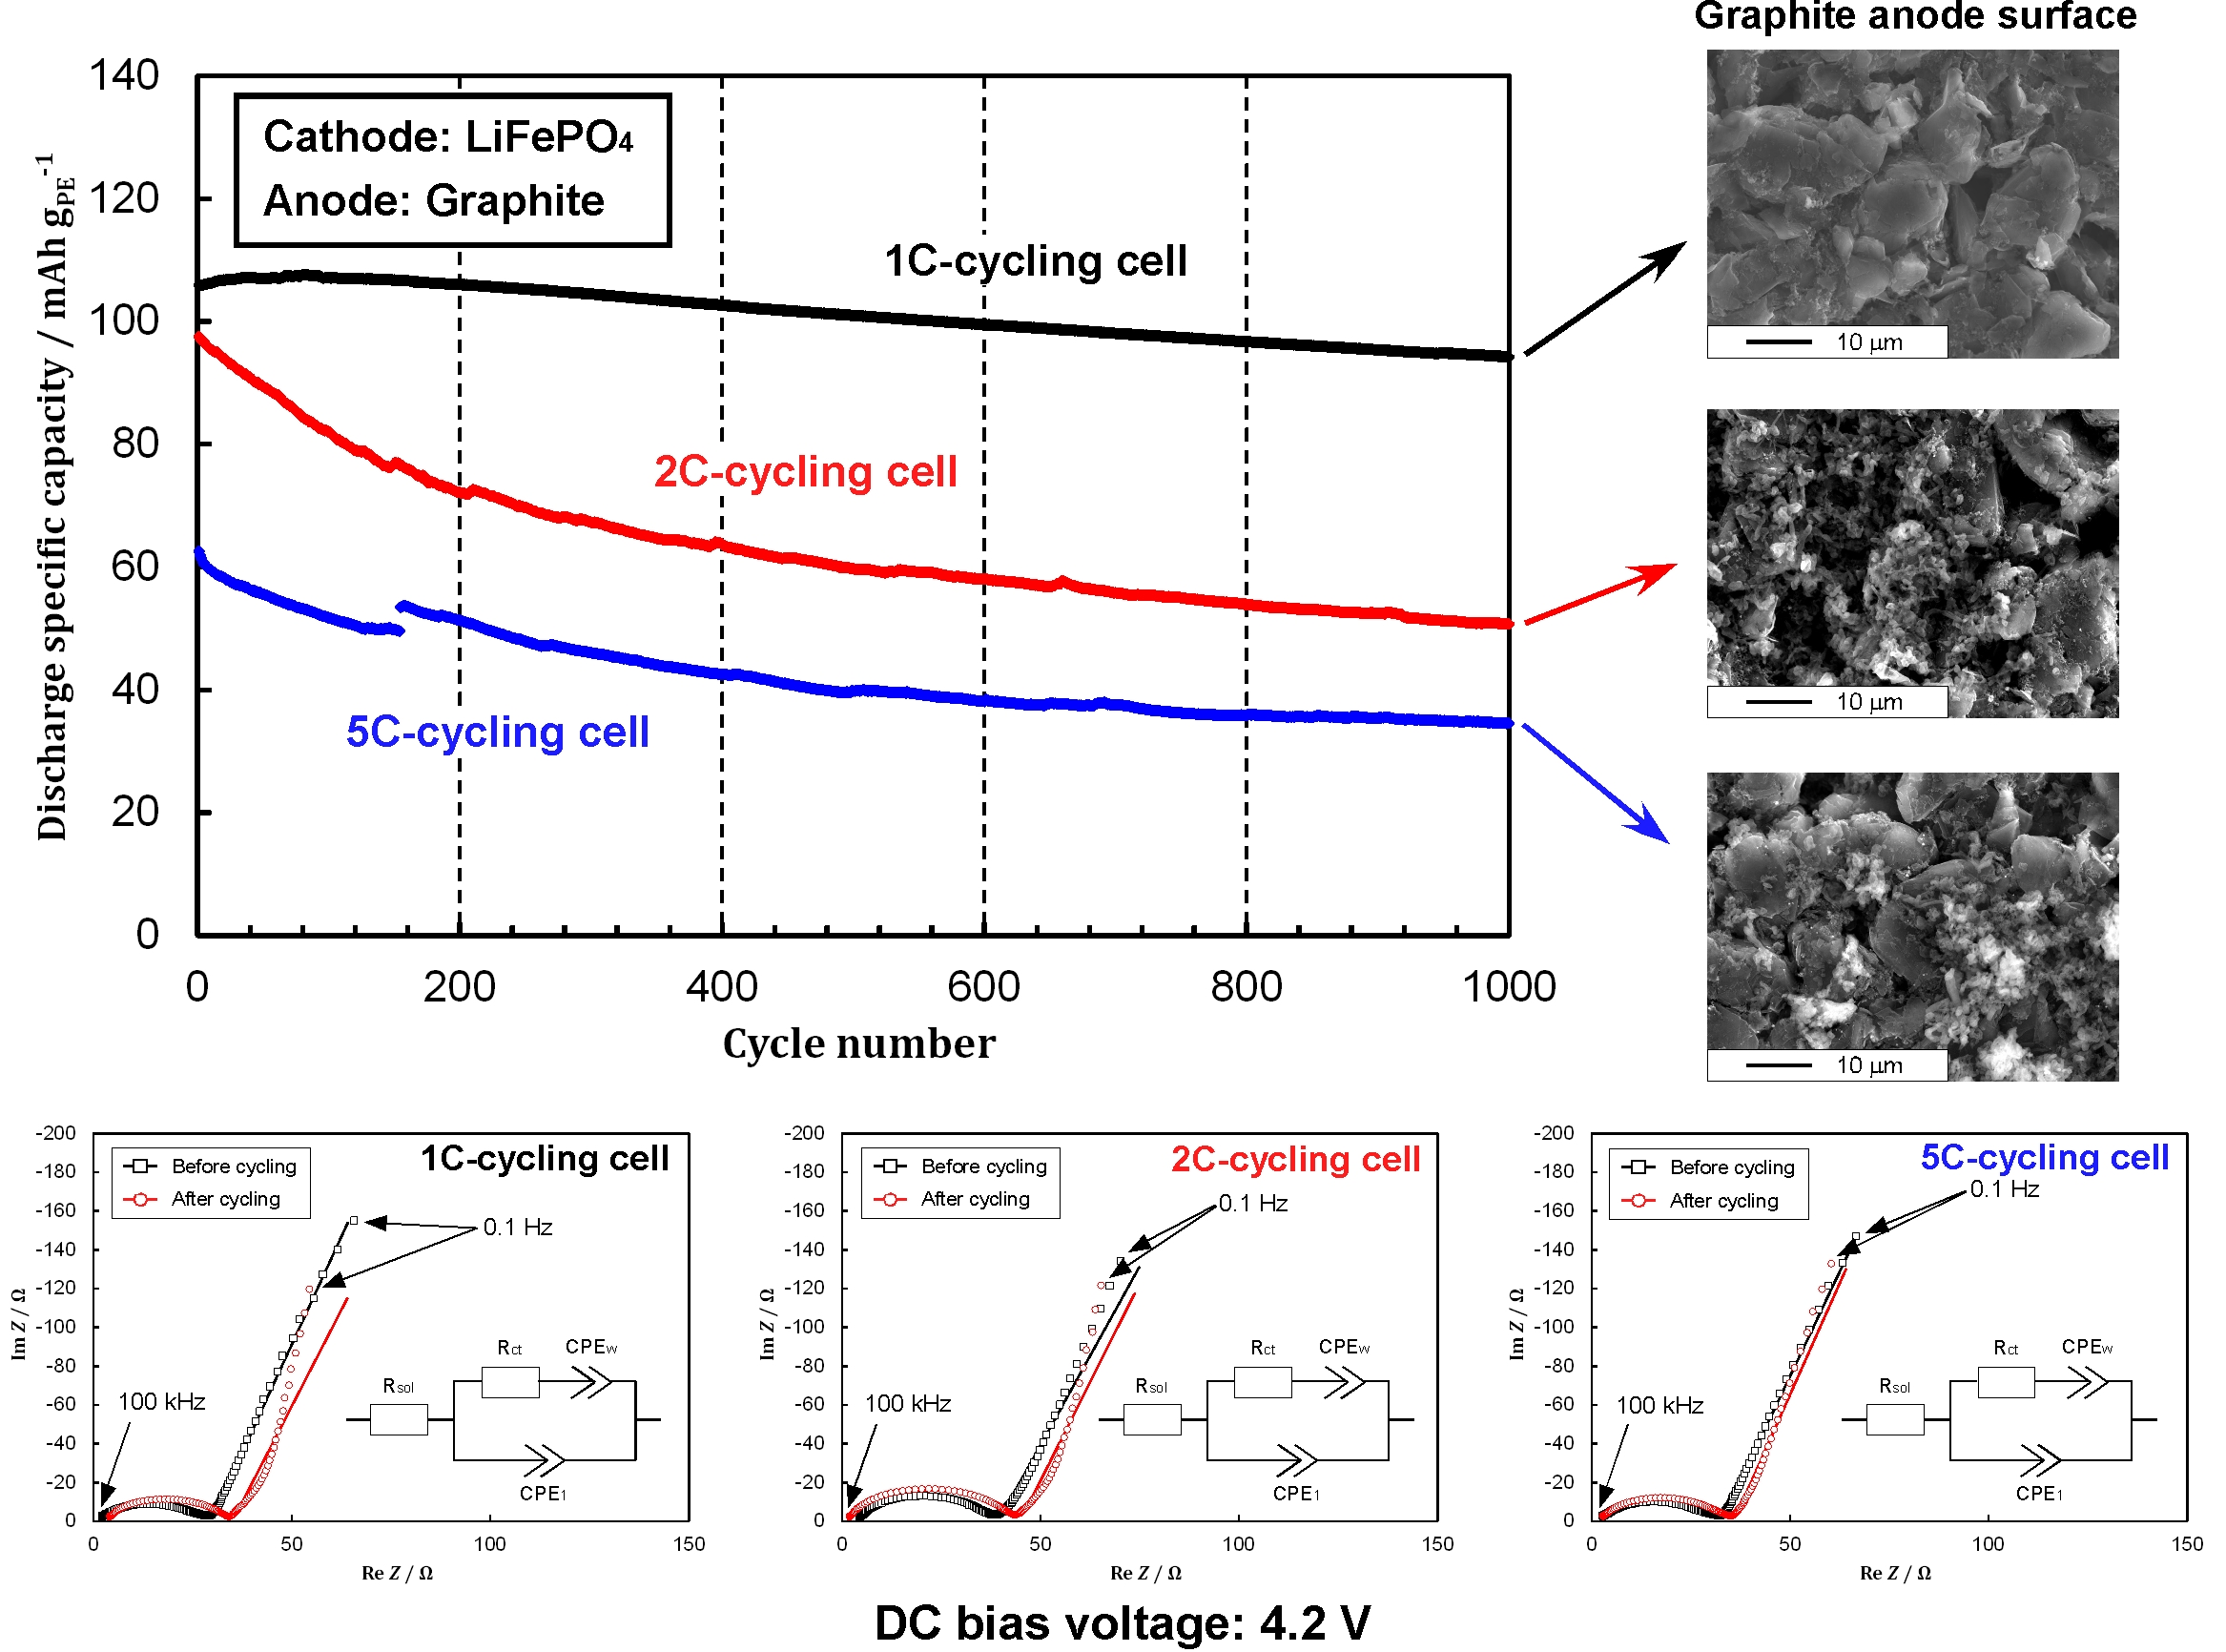
3.2. Cycling Performances under Different C-Rates

The preconditioned LFP/graphite LIB cells were subjected to charge-discharge cycling at 1, 2, and 5 C. Figure 3 illustrates the discharge specific capacities of the cells as a function of the cycle number. While the 1C-cycling cell could substantially retain the discharge specific capacity during the 1000 cycles, the 2C- and 5C-cycling cells exhibited a gradual decrease in the specific capacity. The capacity retentions after the 1000-charge-discharge cycles were 89.0%, 52.0%, and 55.2% for the 1C-, 2C-, and 5C-cycling cells, respectively. The cell voltage profiles for the 1st, 100th, 200th, 500th, and 1000th cycles are presented in Figure 4. The charge-discharge CEs for all the LIB cells were maintained at ~100% throughout the cycling process. The charge-discharge specific capacity of the 1C-cycling cell decreased simply, without polarization enhancement. The 2C-cycling cell displayed the largest decrease in the charge-discharge specific capacity. The polarization was enhanced with an increase in the cycle number, especially in the discharging processes. Notably, a large IR drop was observed at the beginning of charging and discharging processes of the 5C-cycling cell. The IR drops incurred at the charge-discharge switching for the 1C-, 2C-, and 5C-cycling cells during the cycling were ~0.18, ~0.32, and ~0.74 V, respectively, corresponding to the equivalent series resistances (R values) of ~160, ~140, and ~130 Ω. Because the IR drop was allocated to the working cell voltage, the charge-discharge specific capacity of the LIB cell decreased with an increase in the C-rate. The polarization of the 5C-cycling cell diminished when compared to that of the 2C-cycling cell. The afforded results suggested that the 2C- and 5C-cycling cells exhibited different degradation modes.

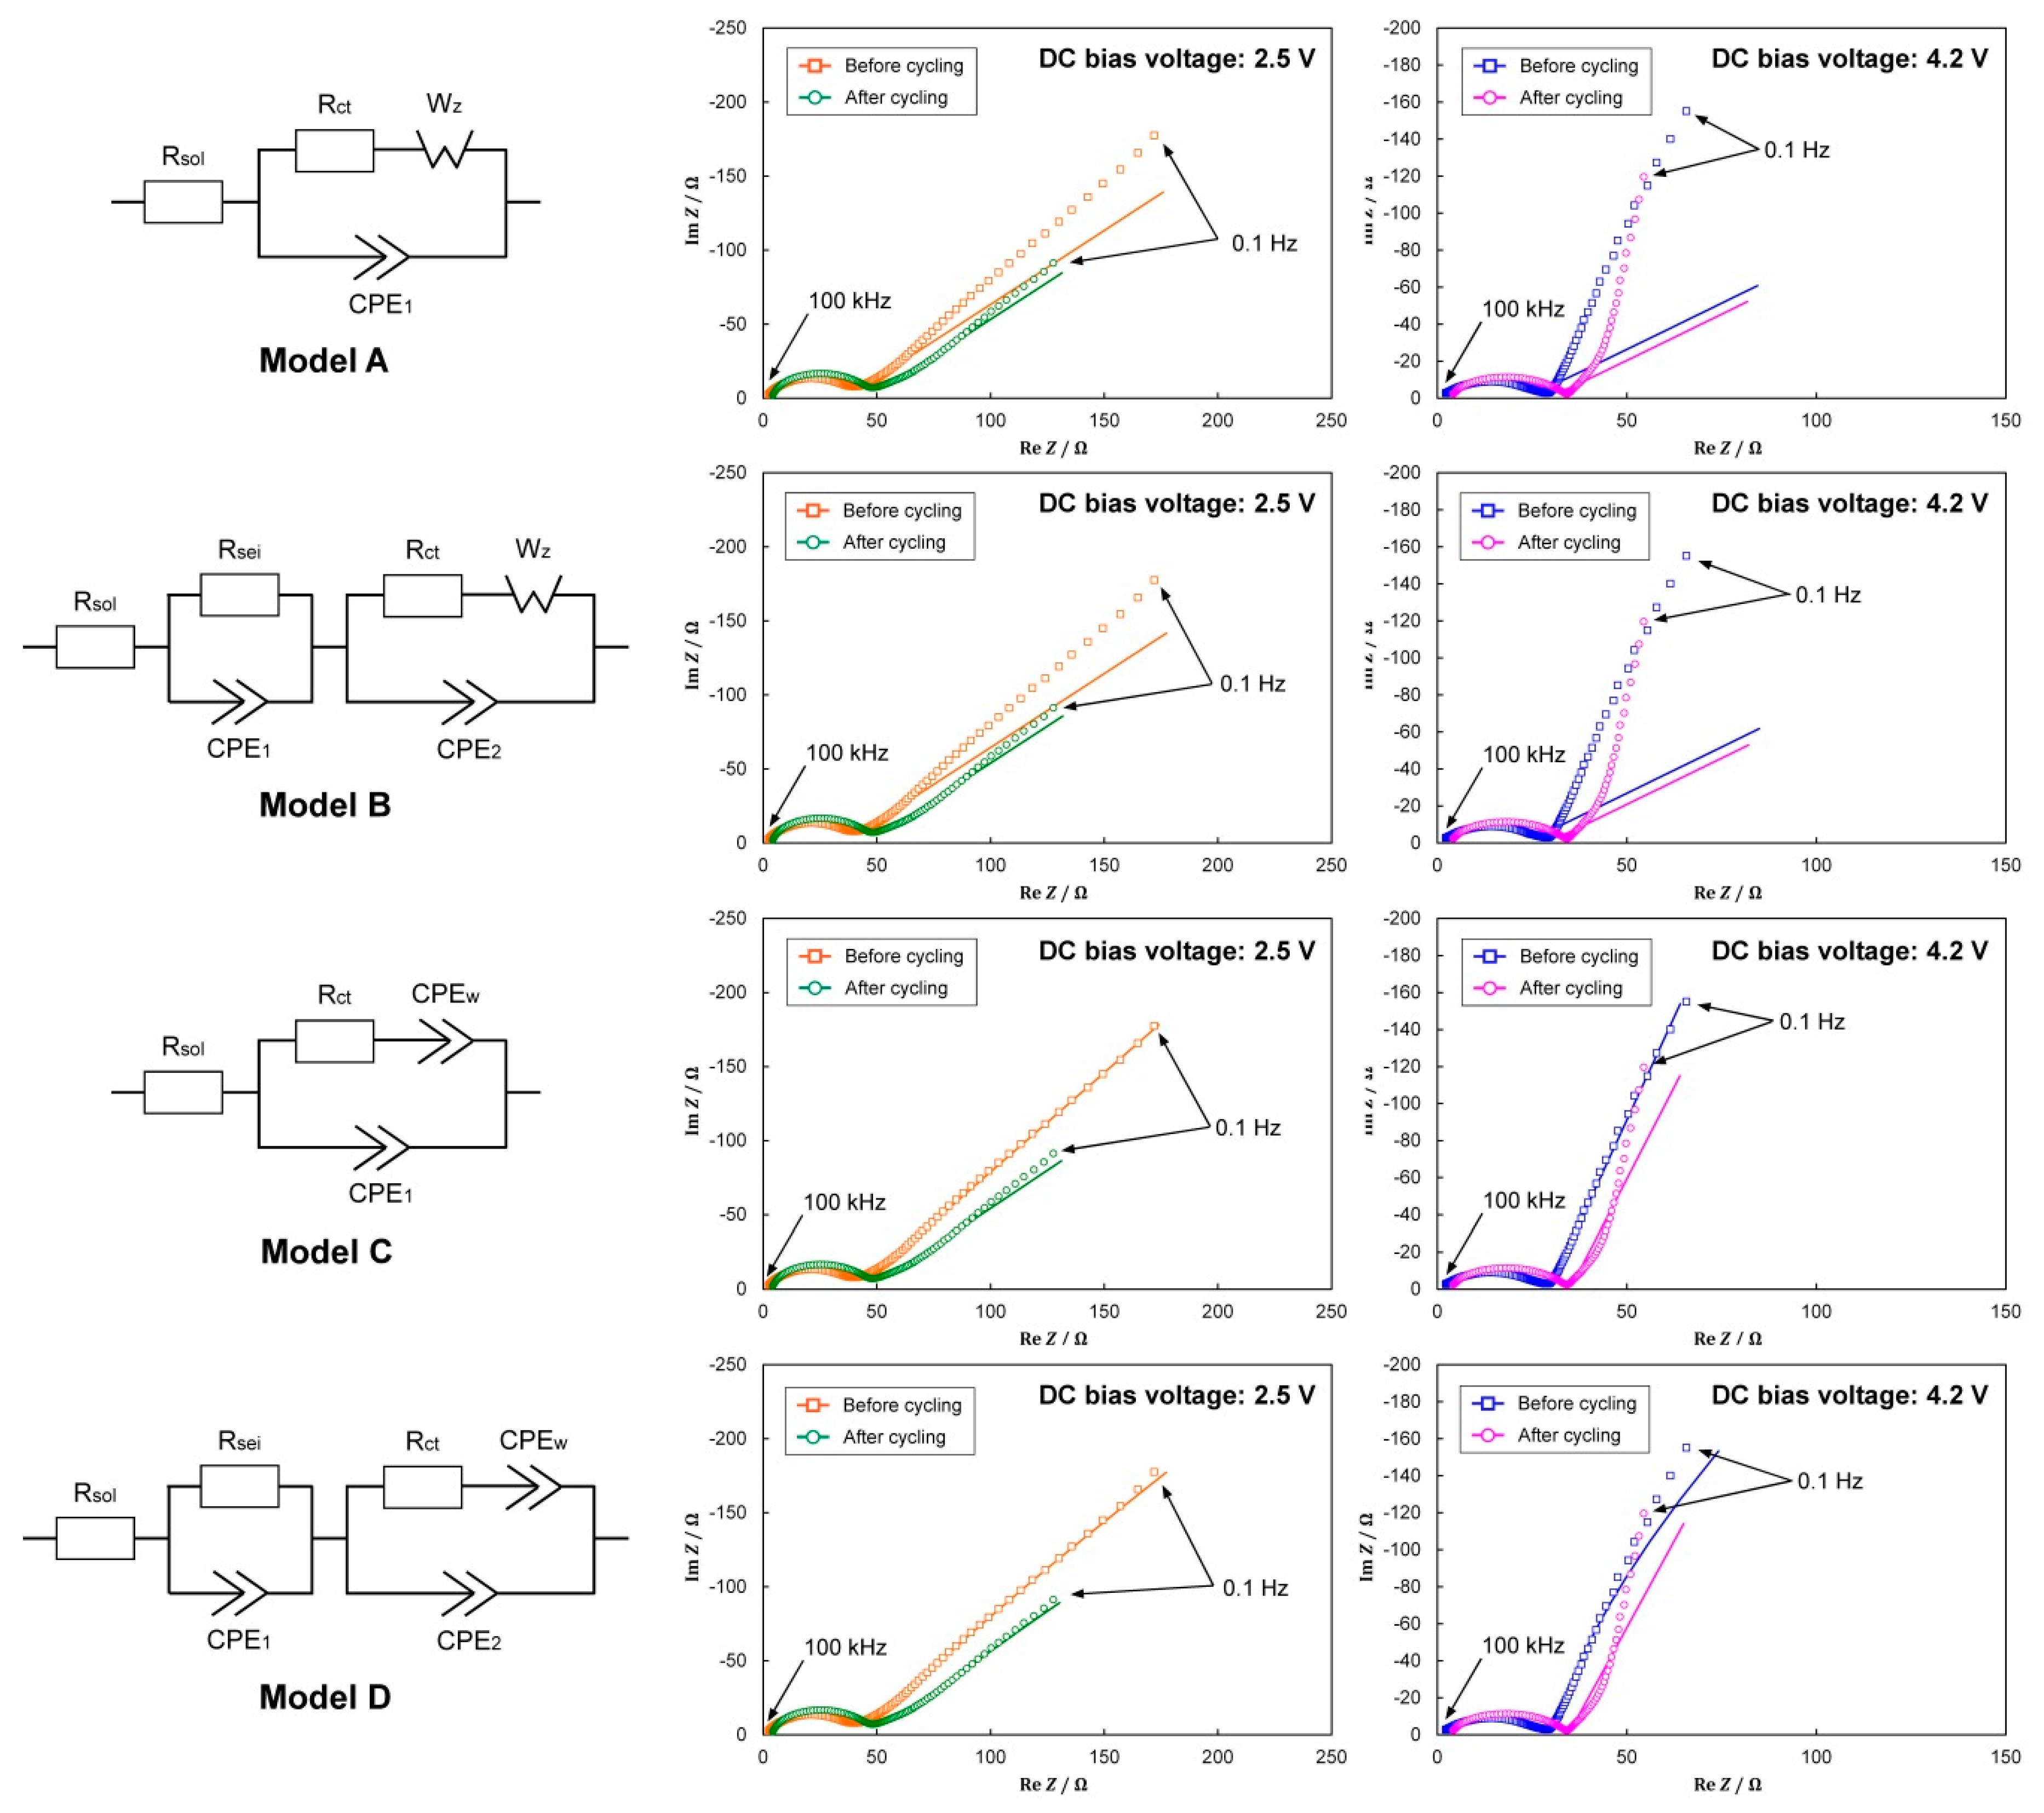
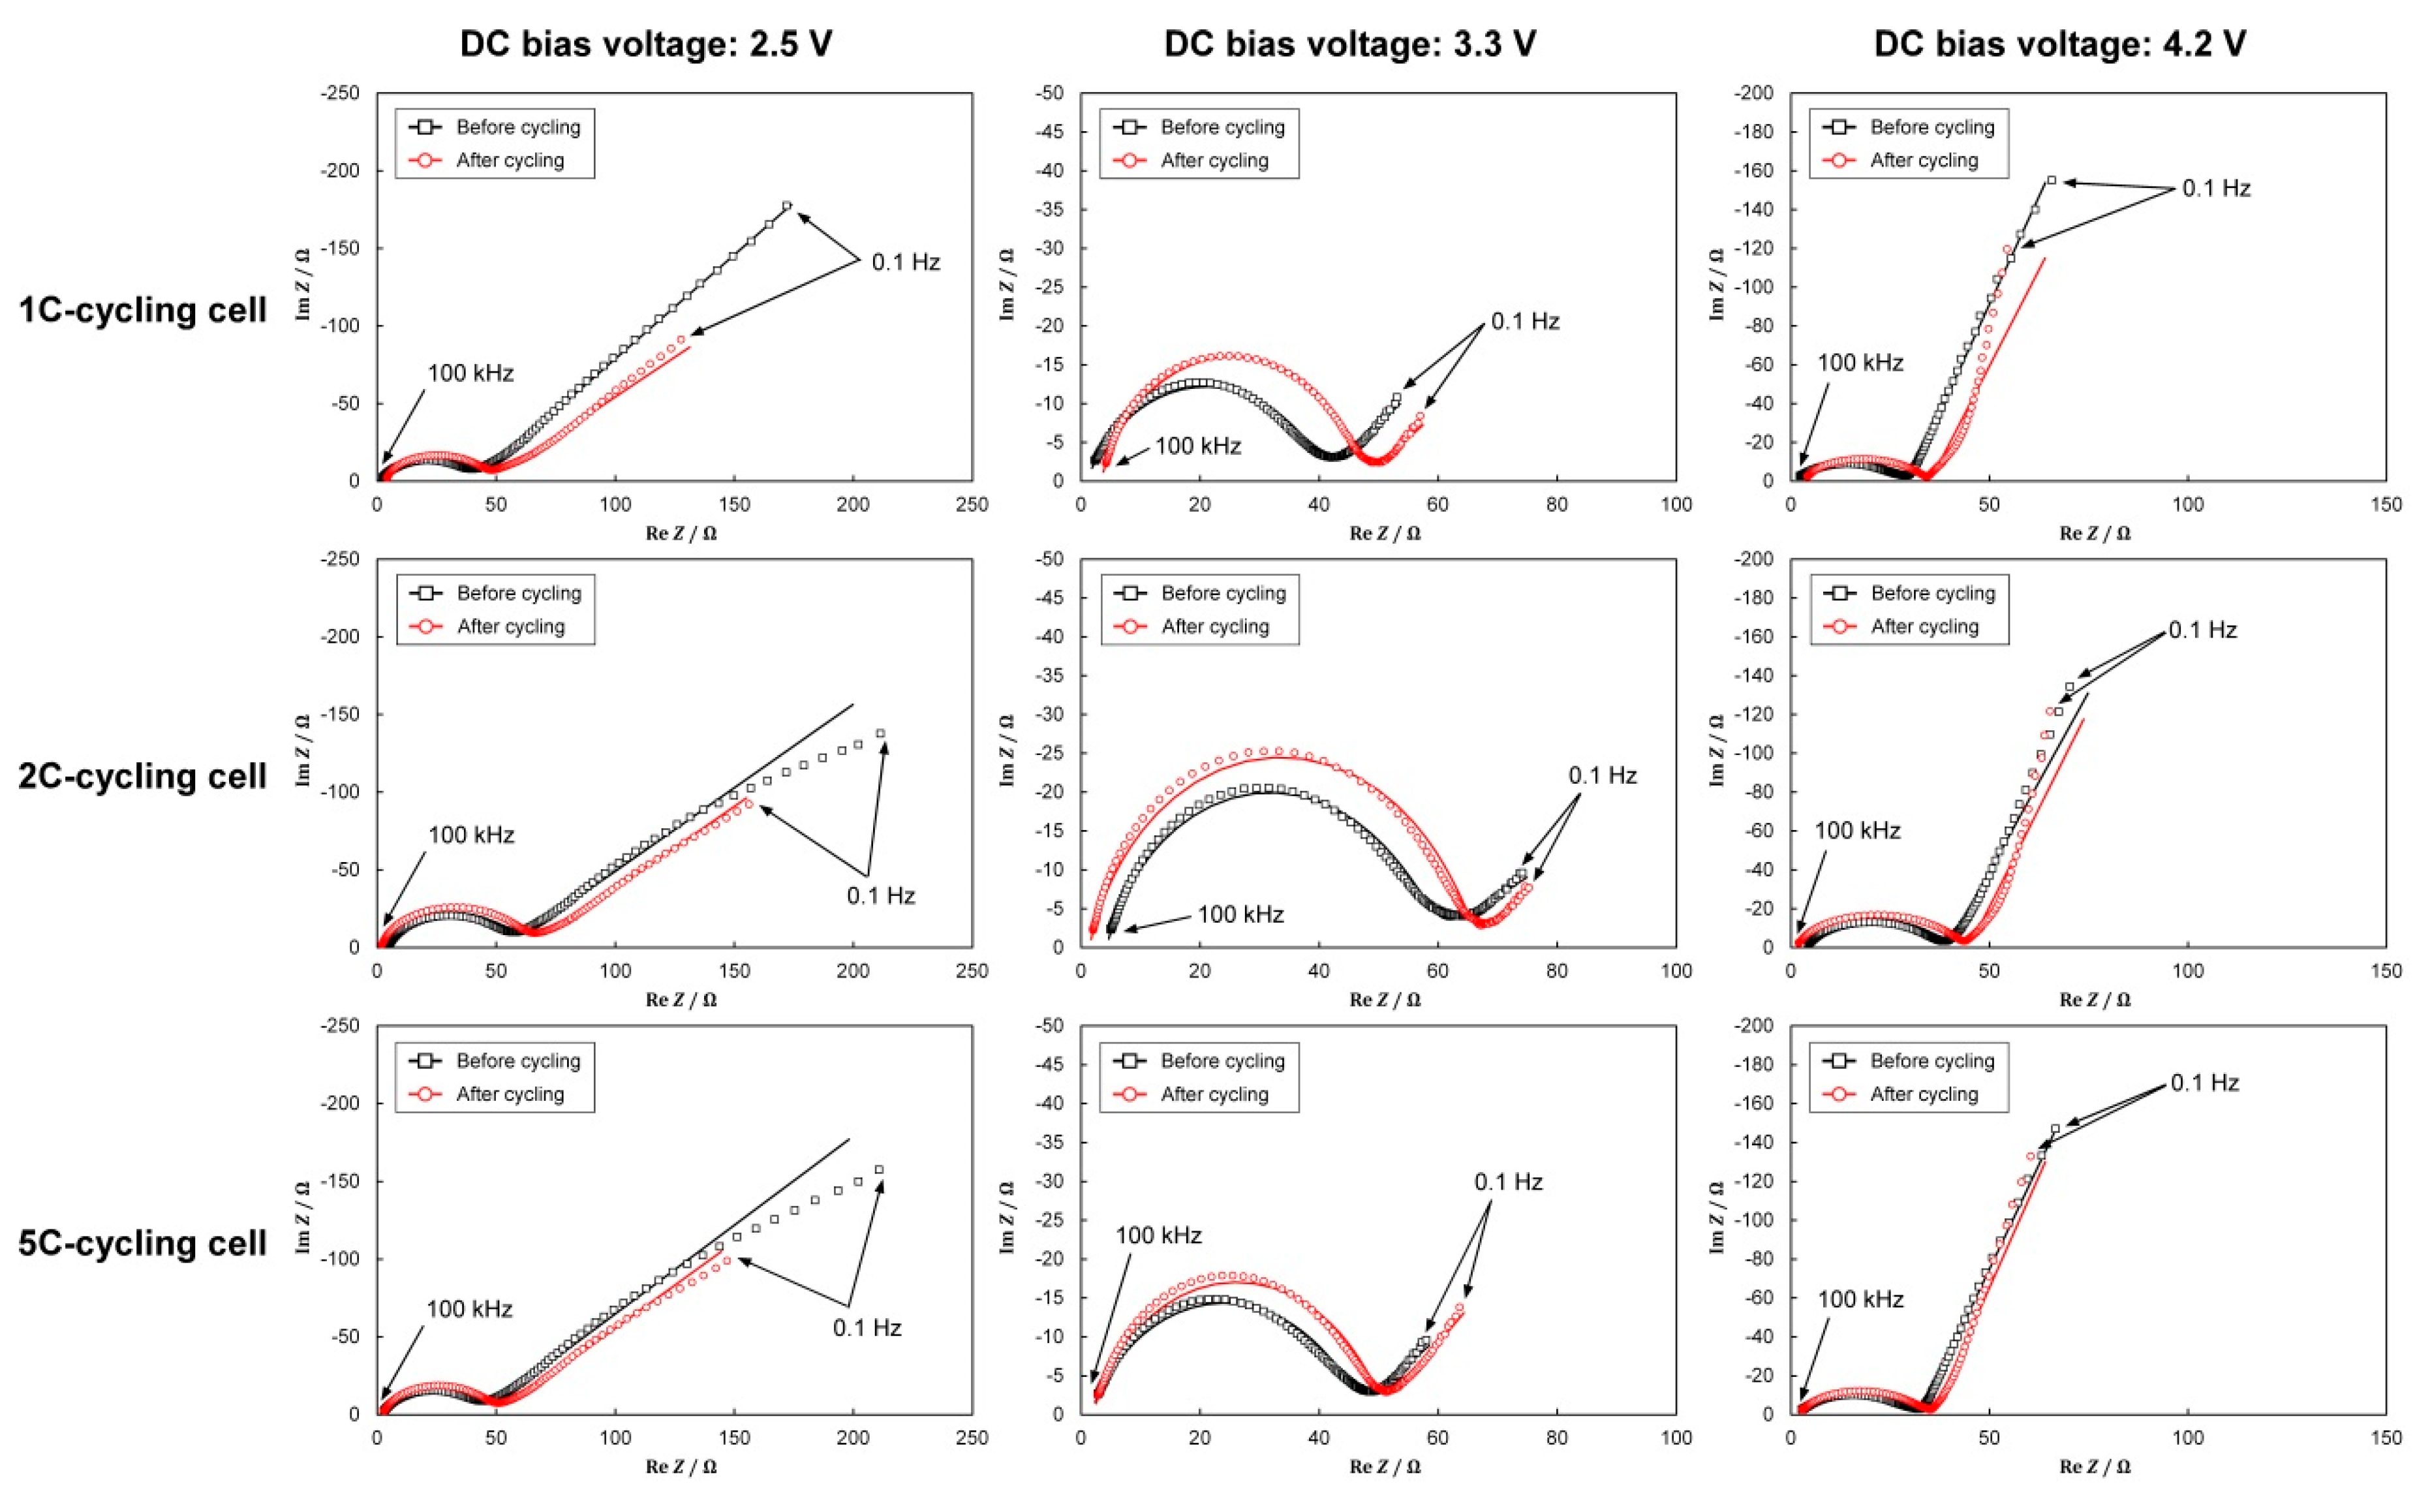
3.3. Impedance Analysis

EIS was performed to acquire the impedance spectra of the LIB cells. The four equivalent circuit models were adapted to reproduce the obtained impedance spectra at different DC bias voltages. One equivalent circuit model, model A, was designed according to the literature [20,21,24]. This model comprised a solution resistance (Rsol) and one parallel connection of Rct in series with Wz, and CPE. Wz can be expressed by Equation (1):
W z = ( 1 j ) α ω ,
where j is an imaginary unit, α is the constant related to diffusion, and ω is the angular frequency. The CPE was introduced to account for the roughness of the electrode surface [21], of which the impedance, ZCPE, can be expressed by Equation (2):
Z CPE =   1 ( j   ω ) p T ,
where p is the exponent of CPE (0 < p ≤ 1) and T is the CPE coefficient. To take the roles of the SEI film into account [15,17,26,27], a parallel connection of CPE1 and Rsei was inserted into model A: This was designated as model B. Models C and D were produced by replacing Wz with the CPE in models A and B, respectively.
Figure 5 illustrates the actual impedance spectra of the 1C-cycling cell at DC bias voltages of 2.5 V (fully discharged, SOC 0%) and 4.2 V (fully charged, SOC 100%), before and after the cycling test, and the impedance spectra reproduced by parameter optimization of each element on the selected equivalent circuit model. The element parameters in the equivalent circuit models were estimated using EIS software to closely fit the simulated impedance spectra with the actual impedance spectra. The optimized parameters, and the success or failure of optimization are presented in Table 2. The impedance spectra comprised a depressed semicircle at the high-to-middle frequency and a slope at the low frequency. Rsol corresponds to the distance between the left-side semicircle edge and the imaginary part axis, which was attributed to the electrolyte solution resistance within the cell and the intrinsic resistance, including the contact resistance and the resistance within the active materials. For models A and C, the diameter of the depressed semicircle along the real part axis represents the Rct value. The slope at the low frequency was related to Li-ion diffusion, electrically represented by Wz [23]. Wz, which expresses the ionic diffusion behavior and exhibits a 45° slope, was employed in models A and B. The two parallel connections of a resistor and CPE in models B and D divided the depressed semicircle into the SEI film and charge-transfer contributions.
When models A and B were adapted to the 1C-cycling cell, the impedance spectra at the low frequency region could not be reproduced, indicating the difficulty for Wz to simulate the Li-ion diffusion within the active materials. The impedance spectra simulated using model C were highly consistent with the actual impedance spectra. The fitting accuracy did not increase when the more complex model D was used to reproduce the impedance spectra. Wz is a special case of the CPE in which p is set to 0.5, thereby providing a 45° slope. Thus, model C was established as the most relevant equivalent circuit model to simulate the pristine and degraded LIB cells.
The impedance spectra of the 2C- and 5C-cycling cells before and after the cycling test were also acquired. Figure 6 displayed the impedance spectra at the three DC bias levels (2.5, 3.3, and 4.2 V) and those reproduced by parameter optimization using model C. The DC bias voltage of 3.3 V corresponded to the 50%-SOC. The optimized parameters for all the cells are listed in Table 3. Except for the low fitness at the low frequency region, the reproduced impedance spectra, which were based on model C, fitted the actual impedance spectra well.
The impedance spectra included the resistance attributed to both the cathode and the anode. According to the literature [27], the individual contributions of the two electrodes were dependent on the SOC, which in turn was closely related to the Li-ion behaviors within the active materials and at the SEI layer. At the initial charging stage (low SOC), the Rct on the cathode side was larger than that on the anode side. Both the Rsei and Rct values increased with an increase in the SOC level and reached a maximum at the fully charged state (SOC 100%).
For the 1C-cycling cell, the values of Rsol before and after cycling were significantly smaller than those of Rct, regardless of the DC bias voltage. Rsol increased to ~3 Ω due to cycling, while the change in Rct was relatively small. The estimated Rsol and Rct values indicated that the internal resistance within the cell was dominated by the charge-transfer resistance, as observed in the 2C- and 5C-cycling cells. For all the cells, the Rct values at the bias voltages of 2.5 and 3.3 V were relatively similar and much larger than that observed at 4.2 V. Among all the cells, the 2C-cycling cell displayed the largest increase in Rct, which was independent of the charging state. For all the cells, the values of p for the CPEw and CPE1 were slightly different, even after the cycling test. The value of T for the CPEw was much higher than that observed for CPE1. Because these CPEs were connected in parallel, the influence of T in CPEw on the capacitive behavior of the cells was dominant. All the cells displayed an increase in T of CPEw owing to cycling, implying that capacitive components of the cycling-derived deposition or byproduct were produced. The 5C-cycling cell exhibited a low charge-discharge specific capacity during cycling and a large IR drop in the initial stage of the charge-discharge cycling. However, the 5C-cycling cell did not present the highest Rsol and Rct values before and after cycling. A DC bias voltage of 4.2 V produced the fully charged state, in which the cell internal resistance was dominated by the anode side [27].
Rsol reflects not only the electrolytic solution resistance but also a penetration or an affinity of the solution within the cathode, anode, and separator. The higher initial Rsol and Rct for the 2C-cycling cell were presumed to be due to the insufficient penetration or affinity of the solution within them. The increase in Rsol for the 1C- and 5C-cycling cells due the cyclic charge-discharge processes might have a relation with the electrolyte degradation. For the 2C-cycling cell, although it might allow the increase in Rsol due to the cycling, the decrease in Rsol attributable to the electrolyte penetration enhanced during the cycling was deduced to be more apparent. Regardless of the higher initial Rsol and Rct, it was experimentally revealed that, during the cycling test, the 2C-cycling cell allowed the largest decrease in the specific capacity, and the largest increase in Rct.

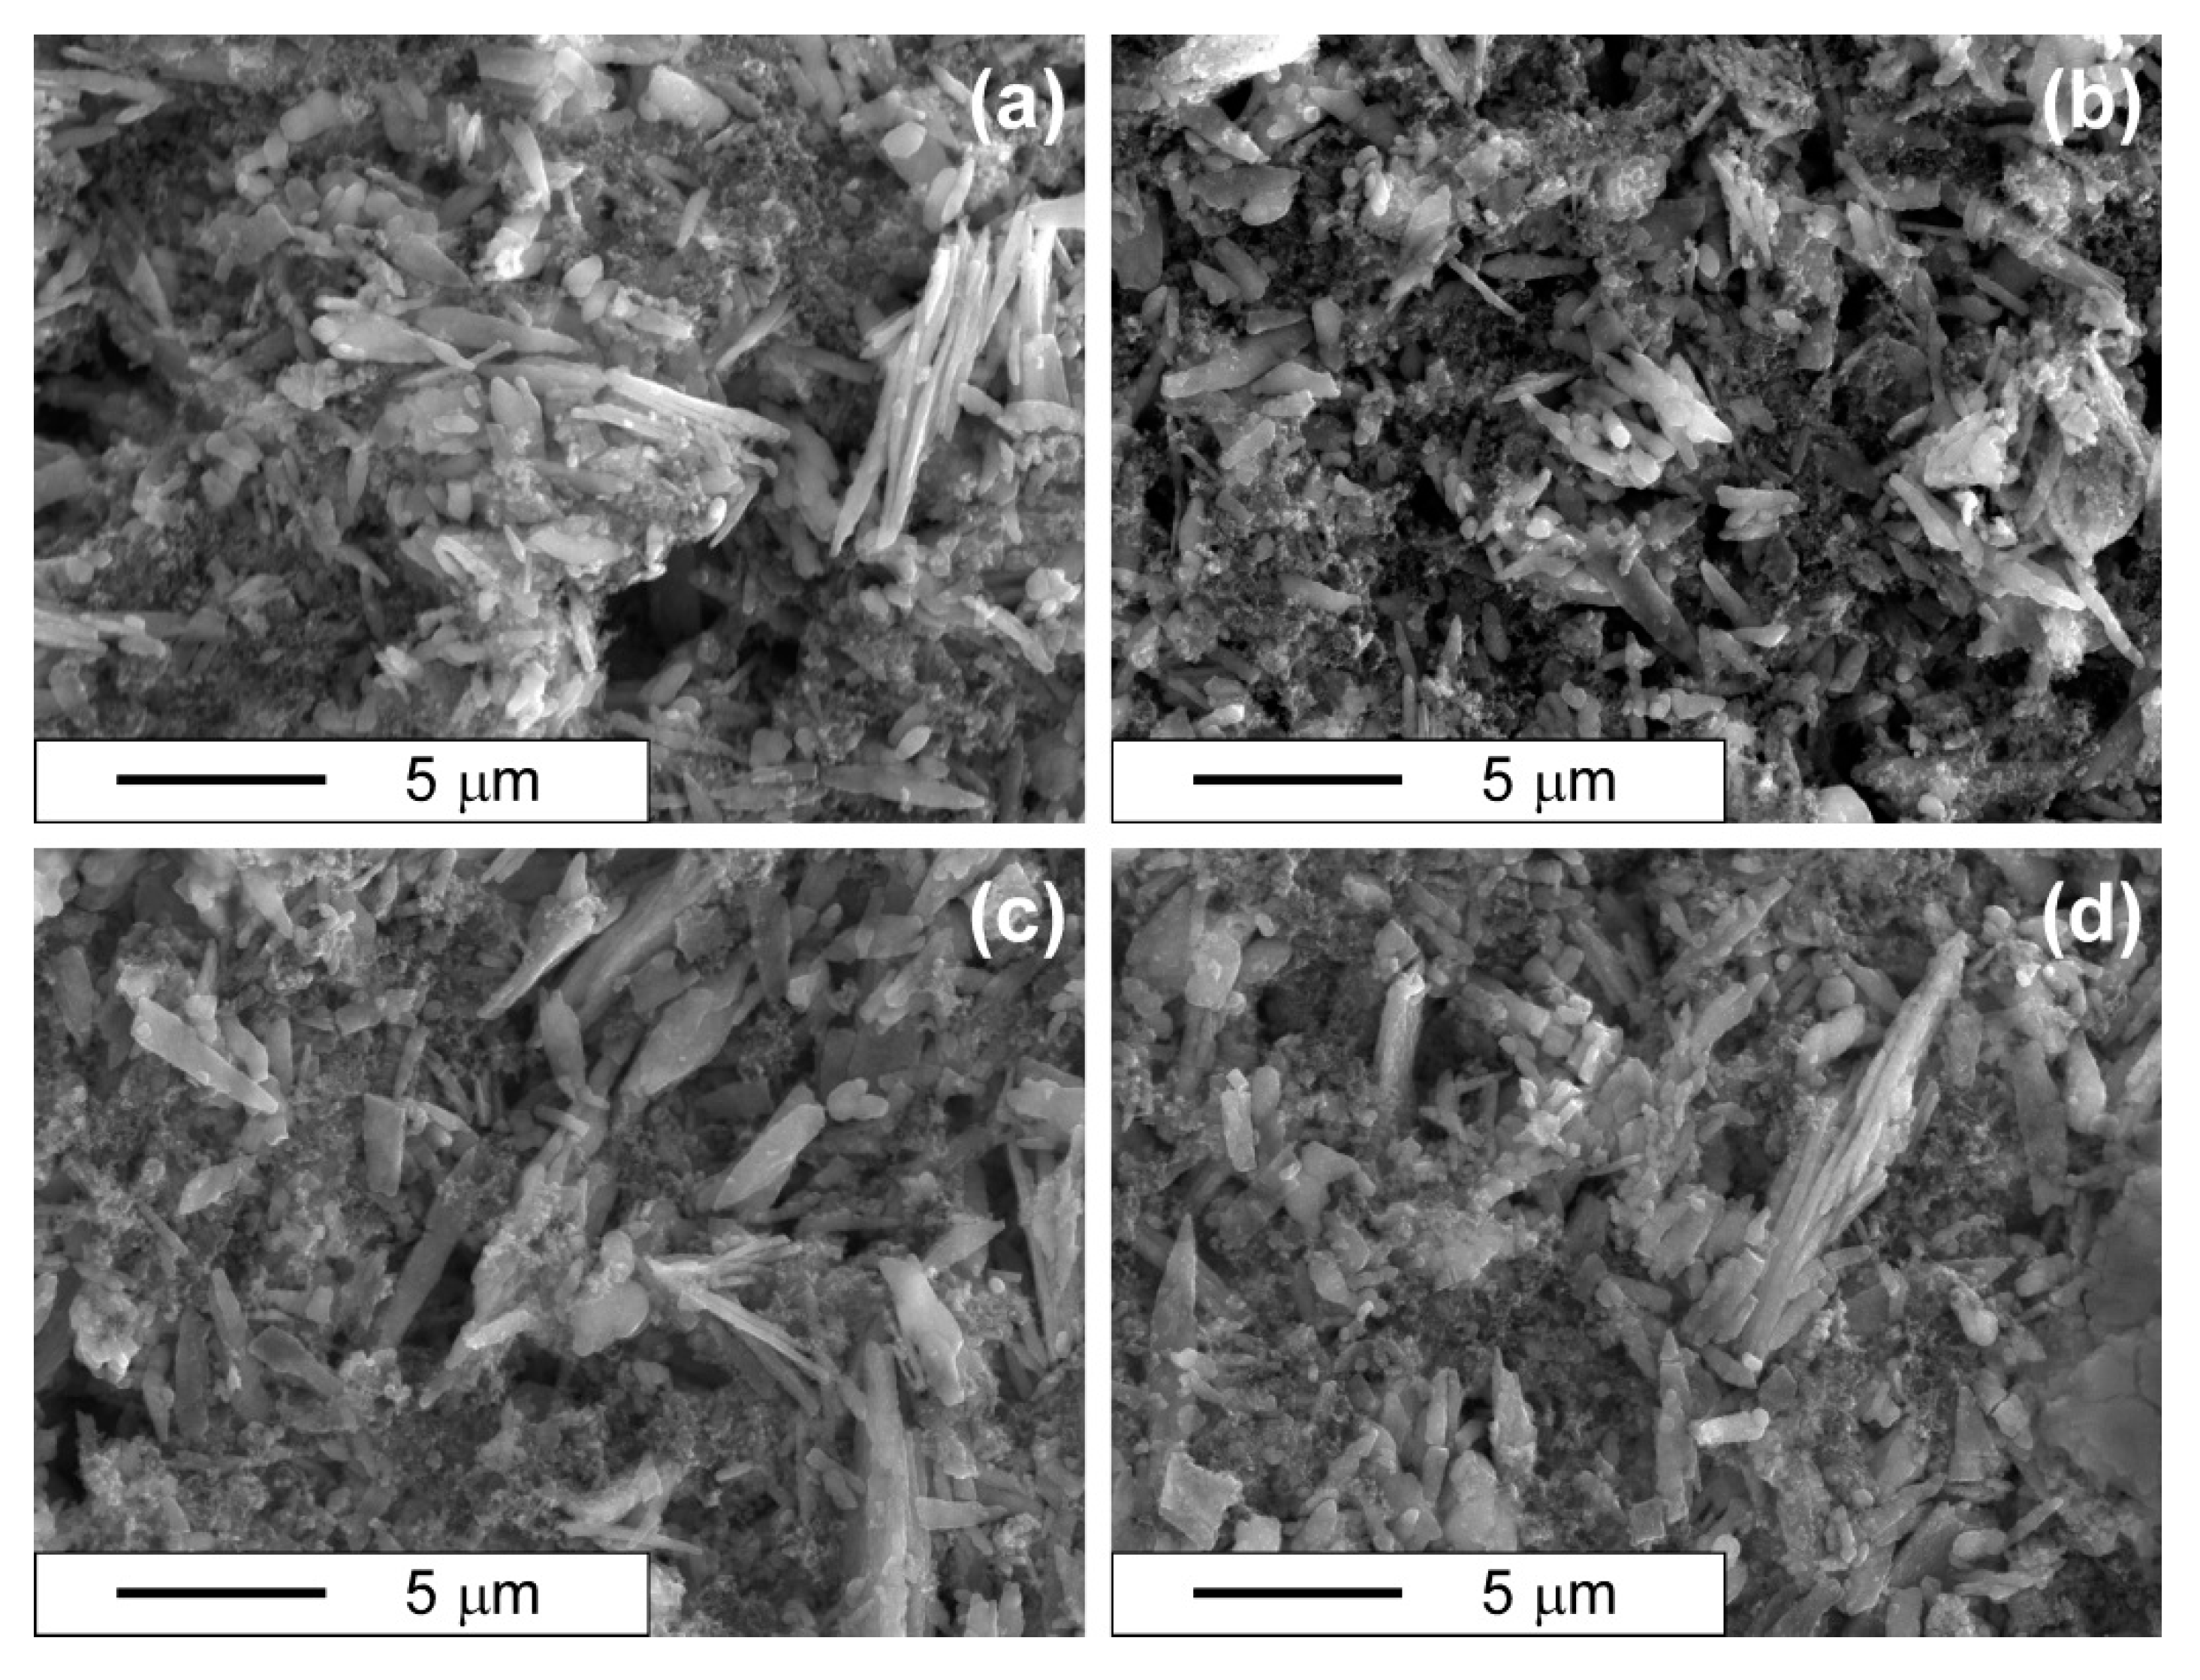
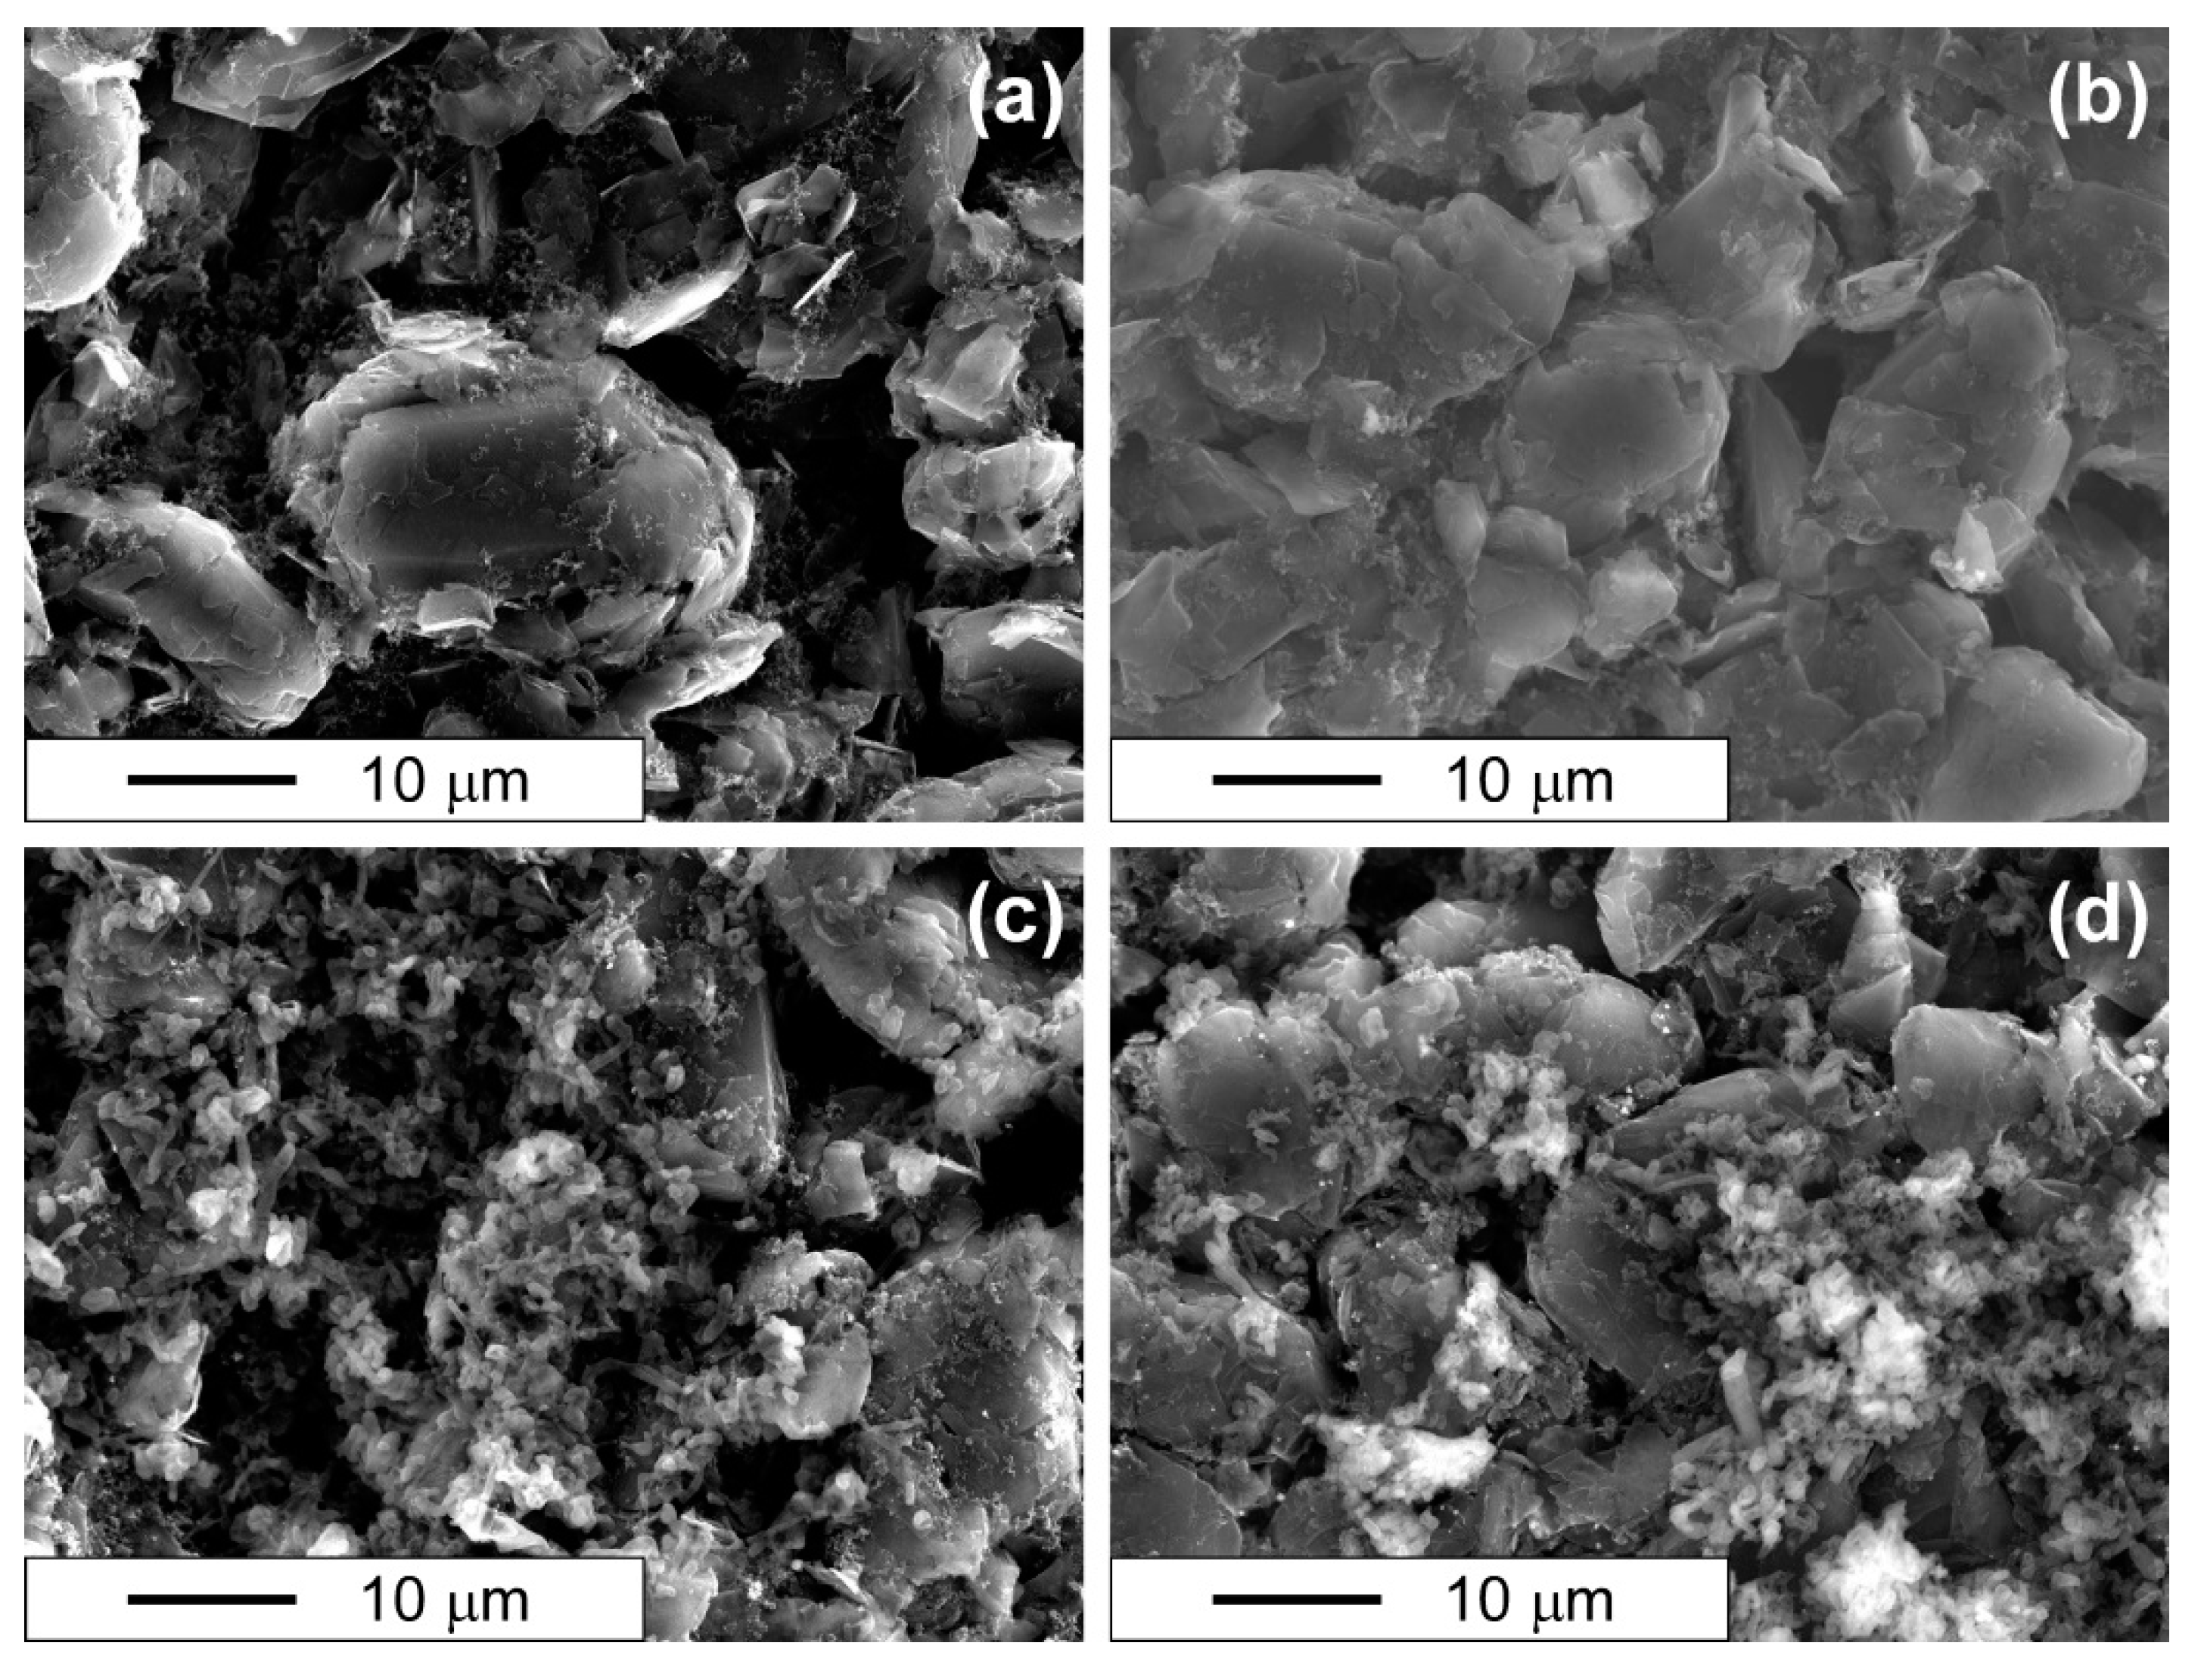
3.4. Morphology Observation by SEM

The pristine and degraded LFP cathodes were analyzed by SEM (see Figure 7). At the pristine cathode surface, the deposited rod-like LFP was in contact with the sponge-like conductive agent AB. No significant differences were observed in the surface morphologies of the LFP cathodes subjected to charge-discharge cycling at different or no C-rates. Figure 8 illustrates the scanning electron micrographs of the pristine and degraded graphite anodes. At the pristine anode, spherically shaped graphite particles were deposited with the sponge-like AB. The graphite particle size was larger than that of LFP. The graphite particles in the degraded graphite anode of the 1C-cycling cell maintained their spherical shape, even after cycling. However, the surface morphologies of the graphite anodes cycled at 2 and 5 C were notably different from that cycled at 1 C. The graphite particles were covered by numerous fine agglomerates, suspected to be Li-included byproducts generated by the higher C-rate cycling. The most extensive deposition was observed on the 2C-cycling cell. The agglomerate formation on the anodes of the 2C- and 5C-cycling cells seems to be related to the capacity retention during cycling. The LiCoO2/graphite full cell allowed Li metal deposition on the graphite anode when the C-rate was greater than or equal to 1.8 C [16]. It was also shown that the Li metal deposition accelerated the loss of active Li-ion, leading to rapid capacity fading when compared with the SEI generation, and implying that the agglomerate included Li metal as well as SEI-related substances, such as LiCO3 and/or ROCO2Li [16,30].

3.5. Performance Degradation under Different C-Rates

As the C-rate increased, the capacity retention and the charge-discharge profiles of the LIB cells became differentiated. For the 1C-cycling cell, the charge-discharge specific capacity decreased simply, without polarization enhancement, and displayed the highest capacity retention during the cycling test (89.0%). Repeating the Li-ion insertion-extraction deep inside the graphite can lead to the deformation of the crystalline structure of the active material [16,17]. The capacity fading was closely related to the lowered ability of Li-ion insertion-extraction within the graphite anode. The loss of active Li-ions, caused by the traps within the graphite, was probably the main cause of the capacity fading observed in the 1C-cycling cell. The charge-discharge specific capacity of the 2C-cycling cell exhibited the largest decrease during the cycling (52.0% retention), and the largest polarization was observed in the discharging process. This polarization enhancement was due to the largest increase in Rct (~10 Ω increment after the cycling). The highest number of agglomerates was observed on the anode of the 2C-cycling cell as the cycling-derived byproducts, which was consistent with the increased Rct. Regardless of the cycle number, the 5C-cycling cell exhibited the largest IR drop (~0.74 V decrement, corresponding to ~130 Ω equivalent series resistance), thereby delivering the lowest charge-discharge specific capacity throughout the cycling process (~50 mAh·gCathode−1). The impedance analysis data revealed that the Rct increment due to the cycling of the 5C-cycling cell (~3 Ω) was smaller than that of the 2C-cycling cell and close to that of the 1C-cycling cell. More agglomerates were formed on the graphite anode of the 2C-cycling than that on that of the 5C-cycling cell. The current density for the 5C-cycling cell was markedly higher than that of the 2C-cycling cell. The higher C-rate (and hence the increased IR drop) decreased the voltage allocated to the net electrochemical reactions contributing to the charge-discharge specific capacity. This decrease in voltage allocation leads to a low capacity utilization of the anode, which in turn decelerates the degradation of the graphite anode of the 5C-cycling cell; this was consistent with its slight increase in Rct due to cycling. The 2C-cycling cell exhibited both the highest increase in Rct and the highest Rct value (>60 Ω after the cycle test). The most severe degradation, observed in its graphite anode, was attributed to the high C-rate and high capacity utilization.

4. Conclusions

LFP/graphite LIB cells were assembled and subjected to 1000 galvanostatic charge-discharge cycles under different C-rates (1, 2, and 5 C) in the cell voltage range 2.5–4.2 V. To elucidate the performance degradation of these cells, EIS tests were performed before and after cycling. The most suitable equivalent circuit model was determined based on the accuracy of the simulated impedance spectra for the 1C-cycling cell, and the actual impedance spectra for all the cells were analyzed thoroughly. The 1C-cycling cell exhibited the highest capacity retention and a slight degradation, even after the cycling test. The capacity retention of the 2C-cycling cell was lower than that of the 5C-cycling cell during cycling. The EIS data indicated that, compared to the other cells, the 2C-cycling cell displayed the largest increase in the Rct. The anode agglomerating byproducts were most abundant on the anode of the 2C-cycling cell with the highest Rct. The lower capacity utilization of the 5C-cycling cell was attributed to the larger IR drop. This indicated that a higher C-rate could restrict the available charge-discharge specific capacity, thereby slowing down the degradation process. Degradation of the LFP/graphite LIBs could progress with an increasing C-rate; however, higher C-rates could mitigate the degradation because of the lowered capacity utilization.

Author Contributions

Y.A. designed and performed the experiments, analyzed the results, and wrote the manuscript. N.H. performed the experiments, and analyzed the results. S.K. designed and performed the experiments, analyzed the results, and wrote and revised the manuscript.

Funding

This work was in part supported by JSPS KAKENHI Grant Number JP19H02121. We also appreciate the financial support from the Suzuki Foundation.

Acknowledgments

We would like to thank Tomoaki Saito of Akita University for his help with the experiments.

Conflicts of Interest

The authors declare no conflict of interest.

References

  1. Bresser, D.; Hosoi, K.; Howell, D.; Li, H.; Zeisel, H.; Amine, K.; Passerini, S. Perspectives of automotive battery R&D in China, Germany, Japan, and the USA. J. Power Sources 2018, 382, 176–178. [Google Scholar] [CrossRef]
  2. Zubi, G.; Dufo-López, R.; Carvalho, M.; Pasapglu, G. The lithium-ion battery: State of the art and future perspectives. Renew. Sustain. Energy Rev. 2018, 89, 292–308. [Google Scholar] [CrossRef]
  3. Placke, T.; Kloepsch, R.; Dühnen, S.; Winter, M. Lithium ion, lithium metal, and alternative rechargeable battery technologies: The odyssey for high energy density. J. Solid State Electrochem. 2017, 21, 1939–1964. [Google Scholar] [CrossRef]
  4. Andre, D.; Hain, H.; Lamp, P.; Maglia, F.; Stiaszny, B. Future high-energy density anode materials from an automotive application perspective. J. Mater. Chem. A 2017, 5, 17174–17198. [Google Scholar] [CrossRef]
  5. Andre, D.; Kim, S.J.; Lamp, P.; Lux, S.F.; Maglia, F.; Paschos, O.; Stiaszny, B. Future generations of cathode materials: An automotive industry perspective. J. Mater. Chem. A 2015, 3, 6709–6732. [Google Scholar] [CrossRef]
  6. Sarkar, S.; Mitra, S. Carbon coated submicron sized-LiFePO4: Improved high rate performance lithium battery cathode. Energy Procedia 2014, 54, 718–724. [Google Scholar] [CrossRef]
  7. Su, C.; Bu, X.; Xu, L.; Liu, J.; Zhang, C. A novel LiFePO4/graphene/carbon composite as a performance-improved cathode material for lithium-ion batteries. Electrochim. Acta 2012, 64, 190–195. [Google Scholar] [CrossRef]
  8. Zhang, Z.; Zeng, T.; Qu, C.; Lu, H.; Jia, M.; Lai, Y.; Li, J. Cycle performance improvement of LiFePO4 cathode with polyacrylic acid as binder. Electrochim. Acta 2012, 80, 440–444. [Google Scholar] [CrossRef]
  9. Shobukawa, H.; Alvarado, J.; Yang, Y.; Meng, Y.S. Electrochemical performance and interfacial investigation on Si composite anode for lithium ion batteries in full cell. J. Power Sources 2017, 359, 173–181. [Google Scholar] [CrossRef]
  10. Kim, J.H.; Jung, M.J.; Kim, M.J.; Lee, Y.S. Electrochemical performances of lithium and sodium ion batteries based on carbon materials. J. Ind. Eng. Chem. 2018, 61, 368–380. [Google Scholar] [CrossRef]
  11. Eftekhari, A. Low voltage anode materials for lithium-ion batteries. Energy Storage Mater. 2017, 7, 157–180. [Google Scholar] [CrossRef]
  12. Zhang, S.S.; Xu, K.; Jow, T.R. EIS study on the formation of solid electrolyte interface in Li-ion battery. Electrochim. Acta 2006, 51, 1636–1640. [Google Scholar] [CrossRef]
  13. Guo, Z.; Chen, Z. High-temperature capacity fading mechanism for LiFePO4/graphite soft-packed cell without Fe dissolution. J. Electroanal. Chem. 2015, 754, 148–153. [Google Scholar] [CrossRef]
  14. Sun, S.; Guan, T.; Shen, B.; Leng, K.; Gao, Y.; Cheng, X.; Yin, G. Changes of degradation mechanisms of LiFePO4/graphite batteries cycled at different ambient temperatures. Electrochim. Acta 2017, 237, 248–258. [Google Scholar] [CrossRef]
  15. Zhang, S.S.; Xu, K.; Jow, T.R. The low temperature performance of Li-ion batteries. J. Power Sources 2003, 115, 137–140. [Google Scholar] [CrossRef]
  16. Guan, T.; Sun, S.; Yu, F.; Gao, Y.; Fan, P.; Zuo, P.; Du, C.; Yin, G. The degradation of LiCoO2/graphite batteries at different rates. Electrochim. Acta 2018, 279, 204–212. [Google Scholar] [CrossRef]
  17. Zheng, Y.; He, Y.B.; Qian, K.; Li, B.; Wang, X.; Li, J.; Chiang, S.W.; Miao, C.; Kang, F.; Zhang, J. Deterioration of lithium iron phosphate/graphite power batteries under high-rate discharge cycling. Electrochim. Acta 2015, 176, 270–279. [Google Scholar] [CrossRef]
  18. Bryden, T.S.; Holland, A.; Hilton, G.; Dimitrov, B.; Ponce de León Albarrán, C.; Cruden, A. Lithium-ion degradation at varying discharge rates. Energy Procedia 2018, 151, 194–198. [Google Scholar] [CrossRef]
  19. Jiang, J.; Lin, Z.; Ju, Q.; Ma, Z.; Zheng, C.; Wang, Z. Electrochemical impedance spectra for lithium-ion battery ageing considering the rate of discharge ability. Energy Procedia 2017, 105, 844–849. [Google Scholar] [CrossRef]
  20. Erol, S. Impedance Analysis and Modeling of Lithium-Ion Batteries; LAMBERT Academic Publishing: Saarbrucken, Germany, 2016; Chapter 3. [Google Scholar]
  21. Orazem, M.E.; Tribollet, B. Electrochemical Impedance Spectroscopy; John Wiley & Sons: Hoboken, NJ, USA, 2008; Chapter 13. [Google Scholar]
  22. Ovejas, V.J.; Cuadras, A. Impedance characterization of an LCO-NMC/graphite cell: Ohmic conduction, SEI transport and charge-transfer phenomenon. Batteries 2018, 4, 43. [Google Scholar] [CrossRef]
  23. Vyroubal, P.; Kazda, T. Equivalent circuit model parameters extraction for lithium ion batteries using electrochemical impedance spectroscopy. J. Energy Storage 2018, 15, 23–31. [Google Scholar] [CrossRef]
  24. Habte, B.T.; Jiang, F. Microstructure reconstruction and impedance spectroscopy study of LiCoO2, LiMn2O4 and LiFePO4 Li-ion battery cathodes. Microporous Mesoporous Mater. 2018, 268, 69–76. [Google Scholar] [CrossRef]
  25. Hang, T.; Mukoyama, D.; Nara, H.; Takami, N.; Momma, T.; Osaka, T. Electrochemical impedance spectroscopy analysis for lithium-ion battery using Li4Ti5O12 anode. J. Power Sources 2013, 222, 442–447. [Google Scholar] [CrossRef]
  26. Osaka, T.; Momma, T.; Mukoyama, D.; Nara, H. Proposal of novel equivalent circuit for electrochemical impedance analysis of commercially available lithium ion battery. J. Power Sources 2012, 205, 483–486. [Google Scholar] [CrossRef]
  27. Wu, M.S.; Chiang, P.C.J.; Lin, J.C. Electrochemical investigations on advanced lithium-ion batteries by three-electrode measurements. J. Electrochem. Soc. 2005, 152, A47–A52. [Google Scholar] [CrossRef]
  28. Zhang, D.; Haran, B.S.; Durairajan, A.; White, R.E.; Podrazhansly, Y.; Popov, B.N. Studies on capacity fade of lithium-ion batteries. J. Power Sources 2000, 91, 122–129. [Google Scholar] [CrossRef]
  29. Abe, Y.; Kumagai, S. Effect of negative/positive capacity ratio on the rate and cycling performances of LiFePO4/graphite lithium-ion batteries. J. Energy Storage 2018, 19, 96–102. [Google Scholar] [CrossRef]
  30. Castro, L.; Dedryvère, R.; Ledeuil, J.B.; Bréger, J.; Tessier, C.; Gonbeau, D. Aging mechanisms of LiFePO4 // graphite cells studied by XPS: Redox reaction and electrode/electrolyte interfaces. J. Electrochem. Soc. 2012, 159, A357–A363. [Google Scholar] [CrossRef]
Figure 1. CV curves of the pristine 1C-cycling cell at the scan rate of 0.1 mV·s−1. 1C-cycling cell is a LIB cell which will be subjected to the charge-discharge cycling at 1 C. The first ascendant sweep was performed from the OCV to 4.2 V and the subsequent sweeps were repeated in the range 4.2–2.5 V.
Energies 12 04507 g001
Figure 2. Charge-discharge profiles of the 1C-cycling cell at 0.1 C (17 mA·gCathode−1) in the cell voltage range 2.5–4.2 V.
Energies 12 04507 g002
Figure 3. Cycling behaviors of the LFP/graphite cells at different C-rates: 1, 2, and 5 C are equal to 170, 340, and 850 mA·gCathode−1, respectively.
Energies 12 04507 g003
Figure 4. Charge-discharge profiles of the LFP/graphite cells during the cycling test: (a) 1C-; (b) 2C-; and (c) 5C-cycling cells.
Energies 12 04507 g004
Figure 5. Plots of the actual impedance data of the 1C-cycling cell before and after the cycling test, and the simulated impedance spectra reproduced by parameter optimization of each element using the proposed equivalent circuit models. The applied DC bias voltage was 2.5 and 4.2 V while the frequency of the imposed AC voltage was decreased from 100 to 0.1 Hz.
Energies 12 04507 g005
Figure 6. Actual impedance spectra acquired by EIS and the simulated (fitting) lines produced using model C at the different DC bias voltages before and after cycling. The AC voltage frequency was changed from 100 to 0.1 Hz.
Energies 12 04507 g006
Figure 7. Surface scanning electron micrographs of the pristine (a) and degraded LFP cathodes (bd) cycled at (b) 1C, (c) 2C, and (d) 5C-rate.
Energies 12 04507 g007
Figure 8. Surface scanning electron micrographs of the pristine (a) and degraded graphite anodes (bd) cycled at (b) 1C, (c) 2C, and (d) 5C-rate.
Energies 12 04507 g008
Table 1. Charge and discharge specific capacities and CEs of the LIB cells at 0.1 C (17 mA·gCathode−1) prior to the cycling test.
1st Cycle2nd Cycle3rd Cycle
Cell Type1C-cycling2C-cycling5C-cycling1C-cycling2C-cycling5C-cycling1C-cycling2C-cycling5C-cycling
CapC * (mAh· gCathode−1)121121122121120121120119121
CapD ** (mAh· gCathode−1)120119121120119120120118120
CE (%)99.199.098.999.599.299.399.799.499.4
* Charge specific capacity; ** Discharge specific capacity.
Table 2. Estimated parameters of the equivalent circuit elements in model C for all the cells at the bias voltages 2.5, 3.3, and 4.2 V before and after the cycling.
Model AModel BModel CModel D
ElementCyclingDC Bias VoltageDC Bias VoltageDC Bias VoltageDC Bias Voltage
2.5 V4.2 V2.5 V4.2 V2.5 V4.2 V2.5 V4.2 V
RsolBefore1.261.04* 1.0 × 10−5* 1.0 × 10−51.050.46* 1.0 × 10−5* 1.0 × 10−5
After3.393.500.02* 1.0 × 10−53.383.122.020.10
RseiBefore--3.722.67--19.613.8
After--3.784.32--29.13.67
RctBefore36.222.832.120.541.229.538.719.9
After43.626.242.524.944.032.138.530.9
WzαBefore11048.211249.0----
After67.141.467.942.0----
CPEwpBefore----0.590.860.670.94
After----0.510.840.620.83
TBefore----5.90 × 10−39.38 × 10−33.93 × 10−37.49 × 10−3
After----1.05 × 10−21.25 × 10−26.88 × 10−31.25 × 10−2
CPE1pBefore0.750.760.6310.710.660.950.89
After0.820.85110.810.770.961
TBefore2.59 × 10−52.44 × 10−56.79 × 10−55.58 × 10−73.96 × 10−57.16 × 10−56.88 × 10−61.21 × 10⁻⁵
After1.50 × 10−51.02 × 10−51.23 × 10−71.73 × 10−71.54 × 10−52.41 × 10−55.49 × 10−61.67 × 10⁻⁷
CPE2pBefore--0.850.87--0.400.40
After--0.850.93--0.370.82
TBefore--1.09 × 10−59.42 × 10−6--1.87 × 10−31.96 × 10−3
After--1.07 × 10−55.48 × 10−6--3.51 × 10−31.53 × 10−5
*: incomplete optimization.
Table 3. Estimated parameters of the equivalent circuit elements in model C for all the cells at the bias voltages 2.5, 3.3, and 4.2 V before and after the cycling.
Cell1C-cycling Cell2C-cycling Cell5C-cycling Cell
DC Bias VoltageDC Bias VoltageDC Bias Voltage
ElementCycling** 2.5 V3.3 V** 4.2 V2.5 V3.3 V4.2 V2.5 V3.3 V4.2 V
Rsol [Ω]before1.050.870.464.304.273.461.791.551.18
after3.383.323.121.531.371.132.151.961.66
Rct [Ω]before41.239.629.551.053.136.142.644.331.8
after44.043.932.163.464.043.948.148.034.3
p of CPEwbefore0.590.410.860.520.300.830.540.390.86
after0.510.390.840.520.420.850.530.470.86
T of CPEwbefore5.90 × 10−373.5 × 10−39.38 × 10−35.98 × 10−358.6 × 10−310.8 × 10−35.47 × 10−377.5 × 10−39.90 × 10−3
after10.5 × 10−395.7 × 10−312.5 × 10−39.64 × 10−393.2 × 10−312.2 × 10−39.08 × 10−364.0 × 10−311.2 × 10⁻³
p of CPE1before0.710.700.660.820.810.770.750.730.69
after0.810.800.770.840.830.800.800.790.75
T of CPE1before3.96 × 10−54.60 × 10−57.16 × 10−51.46 × 10−51.79 × 10−52.67 × 10−52.48 × 10−53.30 × 10−55.08 × 10−5
after1.54 × 10−51.75 × 10−52.41 × 10−51.23 × 10−51.39 × 10−51.94 × 10−51.56 × 10−51.84 × 10−52.89 × 10−5
**: identical data shown in Table 2, Model C.

