Methane and Hydrogen Sulfide Production from Co-Digestion of Gummy Waste with a Food Waste, Grease Waste, and Dairy Manure Mixture


Abstract
1. Introduction
2. Materials and Methods
2.1. Sample Collection
2.2. Experimental Design
2.3. Biochemical Methane Potential (BMP) Test Procedures
2.4. Analytical Methods
2.5. Statistical Analysis
3. Results
3.1. Methane (CH4) Production
3.2. Hydrogen Sulfide (H2S) Production
3.3. Effect of Retention Time and Solids Degradation
4. Discussion
5. Conclusions
Author Contributions
Funding
Acknowledgments
Conflicts of Interest
References
- El-Mashad, H.M.; Zhang, R. Biogas production from co-digestion of dairy manure and food waste. Bioresour. Technol. 2010, 101, 4021–4028. [Google Scholar] [CrossRef] [PubMed]
- Weiland, P. Biogas production: Current state and perspectives. Appl. Microbiol. Biotechnol. 2010, 85, 849–860. [Google Scholar] [CrossRef] [PubMed]
- Mata-Alvarez, J.; Dosta, J.; Romero-Güiza, M.S.; Fonoll, X.; Peces, M.; Astals, S. A critical review on anaerobic co-digestion achievements between 2010 and 2013. Renew. Sustain. Energy Rev. 2014, 36, 412–427. [Google Scholar] [CrossRef]
- Zhang, C.; Xiao, G.; Peng, L.; Su, H.; Tan, T. The anaerobic co-digestion of food waste and cattle manure. Bioresour. Technol. 2013, 129, 170–176. [Google Scholar] [CrossRef]
- Lisboa, M.S.; Lansing, S. Characterizing food waste substrates for co-digestion through biochemical methane potential (BMP) experiments. Waste Manag. 2013, 33, 2664–2669. [Google Scholar] [CrossRef]
- Moody, L.B.; Burns, R.T.; Bishop, G.; Sell, S.T.; Spajic, R. Using biochemical methane potential assays to aid in co-substrate selection for co-digestion. Appl. Eng. Agric. 2011, 27, 433–439. [Google Scholar] [CrossRef]
- Braguglia, C.M.; Gallipoli, A.; Gianico, A.; Pagliaccia, P. Anaerobic bioconversion of food waste into energy: A critical review. Bioresour. Technol. 2018, 248, 37–56. [Google Scholar] [CrossRef]
- Xu, F.; Li, Y.; Ge, X.; Yang, L.; Li, Y. Anaerobic digestion of food waste—Challenges and opportunities. Bioresour. Technol. 2018, 247, 1047–1058. [Google Scholar] [CrossRef]
- Zhang, C.; Su, H.; Baeyens, J.; Tan, T. Reviewing the anaerobic digestion of food waste for biogas production. Renew. Sustain. Energy Rev. 2014, 38, 383–392. [Google Scholar] [CrossRef]
- Belle, A.J.; Lansing, S.; Mulbry, W.; Weil, R.R. Anaerobic co-digestion of forage radish and dairy manure in complete mix digesters. Bioresour. Technol. 2015, 178, 230–237. [Google Scholar] [CrossRef]
- Lupitskyy, R.; Alvarez-Fonseca, D.; Herde, Z.D.; Satyavolu, J. In-situ prevention of hydrogen sulfide formation during anaerobic digestion using zinc oxide nanowires. J. Environ. Chem. Eng. 2018, 6, 110–118. [Google Scholar] [CrossRef]
- Pipatmanomai, S.; Kaewluan, S.; Vitidsant, T. Economic assessment of biogas-to-electricity generation system with H2S removal by activated carbon in small pig farm. Appl. Energy 2009, 86, 669–674. [Google Scholar] [CrossRef]
- Corro, G.; Pal, U.; Bañuelos, F.; Rosas, M. Generation of biogas from coffee-pulp and cow-dung co-digestion: Infrared studies of postcombustion emissions. Energy Convers. Manag. 2013, 74, 471–481. [Google Scholar] [CrossRef]
- RedCorn, R.; Fatemi, S.; Engelberth, A.S. Comparing End-Use Potential for Industrial Food-Waste Sources. Engineering 2018, 4, 371–380. [Google Scholar] [CrossRef]
- Rusín, J.; Kašáková, K.; Chamrádová, K. Anaerobic digestion of waste wafer material from the confectionery production. Energy 2015, 85, 194–199. [Google Scholar] [CrossRef]
- ASSOCIATED PRESS. Sweet news: Germany’s Haribo to produce gummy bears in Wisconsin. Available online: https://www.chicagotribune.com/business/ct-haribo-gummy-bear-factory-kenosha-wisconsin-20170324-story.html (accessed on 17 November 2019).
- Cecilia, J.A.; García-Sancho, C.; Maireles-Torres, P.J.; Luque, R. Industrial Food Waste Valorization: A General Overview. In Biorefinery; Springer: New York, NY, USA, 2019; pp. 253–277. [Google Scholar]
- Delgado, P.; Bañón, S. Determining the minimum drying time of gummy confections based on their mechanical properties. CYTA - J. Food 2015, 13, 329–335. [Google Scholar] [CrossRef]
- Peters, J.; Combs, S.; Hoskins, B.; Jarman, J.; Kovar, J.; Watson, M.; Wolf, A.; Wolf, N. Recommended Methods of Manure Analysis; University of Wisconsin Cooperative Extension Publishing: Madison, WI, USA, 2003. [Google Scholar]
- Adams, R.C.; Bennett, F.M.; Dixon, J.K.; Lough, R.C.; Maclean, F.S.; Martin, G.I. The utilization of organic wastes in NZ. New Zeal. Eng. 1951, 6, 396. [Google Scholar]
- Lansing, S.; Martin, J.F.; Botero, R.B.; da Silva, T.N.; da Silva, E.D. Methane production in low-cost, unheated, plug-flow digesters treating swine manure and used cooking grease. Bioresour. Technol. 2010, 101, 4362–4370. [Google Scholar] [CrossRef]
- Ugoji, E.O. Anaerobic digestion of palm oil mill effluent and its utilization as fertilizer for environmental protection. Renew. Energy 1997, 10, 291–294. [Google Scholar] [CrossRef]
- Angelidaki, I.; Ahring, B.K. Codigestion of olive oil mill wastewaters with manure, household waste or sewage sludge. Biodegradation 1997, 8, 221–226. [Google Scholar] [CrossRef]
- Wang, X.; Yang, G.; Feng, Y.; Ren, G.; Han, X. Optimizing feeding composition and carbon-nitrogen ratios for improved methane yield during anaerobic co-digestion of dairy, chicken manure and wheat straw. Bioresour. Technol. 2012, 120, 78–83. [Google Scholar] [CrossRef] [PubMed]
- AgStar Increasing Anaerobic Digester Performance with Codigestion. Available online: http://www.epa.gov/agstar/documents/codigestion.pdf (accessed on 17 November 2019).
- Bujoczek, G.; Oleszkiewicz, J.; Sparling, R.; Cenkowski, S. High Solid Anaerobic Digestion of Chicken Manure. J. Agric. Eng. Res. 2000, 76, 51–60. [Google Scholar] [CrossRef]
- Witarsa, F.; Lansing, S. Quantifying methane production from psychrophilic anaerobic digestion of separated and unseparated dairy manure. Ecol. Eng. 2015, 78, 95–100. [Google Scholar] [CrossRef]
- Kaparaju, P.; Luostarinen, S.; Kalmari, E.; Kalmari, J.; Rintala, J. Co-digestion of energy crops and industrial confectionery by-products with cow manure: Batch scale and farm scale evaluation. Water Sci. Technol. 2002, 45, 275–280. [Google Scholar] [CrossRef][Green Version]
- Li, Y.; Zhang, R.; Liu, X.; Chen, C.; Xiao, X.; Feng, L.; He, Y.; Liu, G. Evaluating methane production from anaerobic mono- and co-digestion of kitchen waste, corn stover, and chicken manure. Energy and Fuels 2013, 27, 2085–2091. [Google Scholar] [CrossRef]
- Belle, A.J.; Lansing, S.; Mulbry, W.; Weil, R.R. Methane and hydrogen sulfide production during co-digestion of forage radish and dairy manure. Biomass Bioenergy 2015, 80, 44–51. [Google Scholar] [CrossRef]
- Xie, S.; Higgins, M.J.; Bustamante, H.; Galway, B.; Nghiem, L.D. Current status and perspectives on anaerobic co-digestion and associated downstream processes. Environ. Sci. Water Res. Technol. 2018, 4, 1759–1770. [Google Scholar] [CrossRef]
- Chastain, J.P.; Camberato, J.J. Dairy manure production and nutrient content. In Confined Animal Manure Managers Certification Program Manual B Dairy Version 1; Clemson University Cooperative Extension Service, 2004; Volume 1, pp. 1–16. Available online: https://www.clemson.edu/extension/camm/manuals/dairy/dch3a_04.pdf (accessed on 22 November 2019).
- Tampio, E.; Ervasti, S.; Paavola, T.; Heaven, S.; Banks, C.; Rintala, J. Anaerobic digestion of autoclaved and untreated food waste. Waste Manag. 2014, 34, 370–377. [Google Scholar] [CrossRef]


| Parameters | Gummy Vitamin Waste | Food Waste | Grease Waste | Dairy Manure | Inoculum |
|---|---|---|---|---|---|
| Total Solids (g/kg) | 464 ± 2.0 | 91.0 ± 1.0 | 673 ± 4.5 | 94.5 ± 3.6 | 64.8 ± 0.9 |
| Volatile Solids (g/kg) | 463 ± 2.1 | 83.1 ± 1.1 | 645 ± 1.5 | 81.7 ± 3.6 | 47.5 ± 0.8 |
| Digestion Substrate and Inoculum | Inoculum (g) | DM (g) | FW (g) | GW (g) | GVW (g) | TS (g/L) | VS (g/L) |
|---|---|---|---|---|---|---|---|
| Inoculum control | 31.9 | - | - | - | - | 64.1 | 47.0 |
| Dairy manure (DM) | 31.9 | 18.3 | - | - | - | 71.7 | 59.5 |
| Food waste (FW) | 31.9 | - | 18.1 | - | - | 74.2 | 60.0 |
| Grease waste (GW) | 31.9 | - | - | 2.3 | - | 105 | 87.6 |
| Gummy vitamin waste (GVW) | 31.9 | - | - | - | 3.2 | 101 | 85.5 |
| DM.FW.GW (0% GVW) | 23.9 | 5.2 | 1.4 | 0.9 | - | 86.3 | 71.5 |
| GVW.DM.FW.GW (5% GVW) | 28.1 | 5.2 | 1.4 | 0.9 | 0.4 | 88.2 | 73.5 |
| GVW.DM.FW.GW (9% GVW) | 31.9 | 5.2 | 1.4 | 0.9 | 0.8 | 89.5 | 74.5 |
| GVW.DM.FW.GW (23% GVW) | 47.9 | 5.2 | 1.4 | 0.9 | 2.4 | 93.1 | 78.0 |
| Treatment | CH4 (%) * | mL CH4/g VS | mL CH4/g Substrate | mL H2S/kg VS | mL H2S/kg Substrate |
|---|---|---|---|---|---|
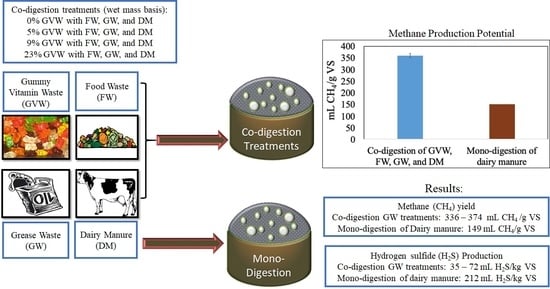
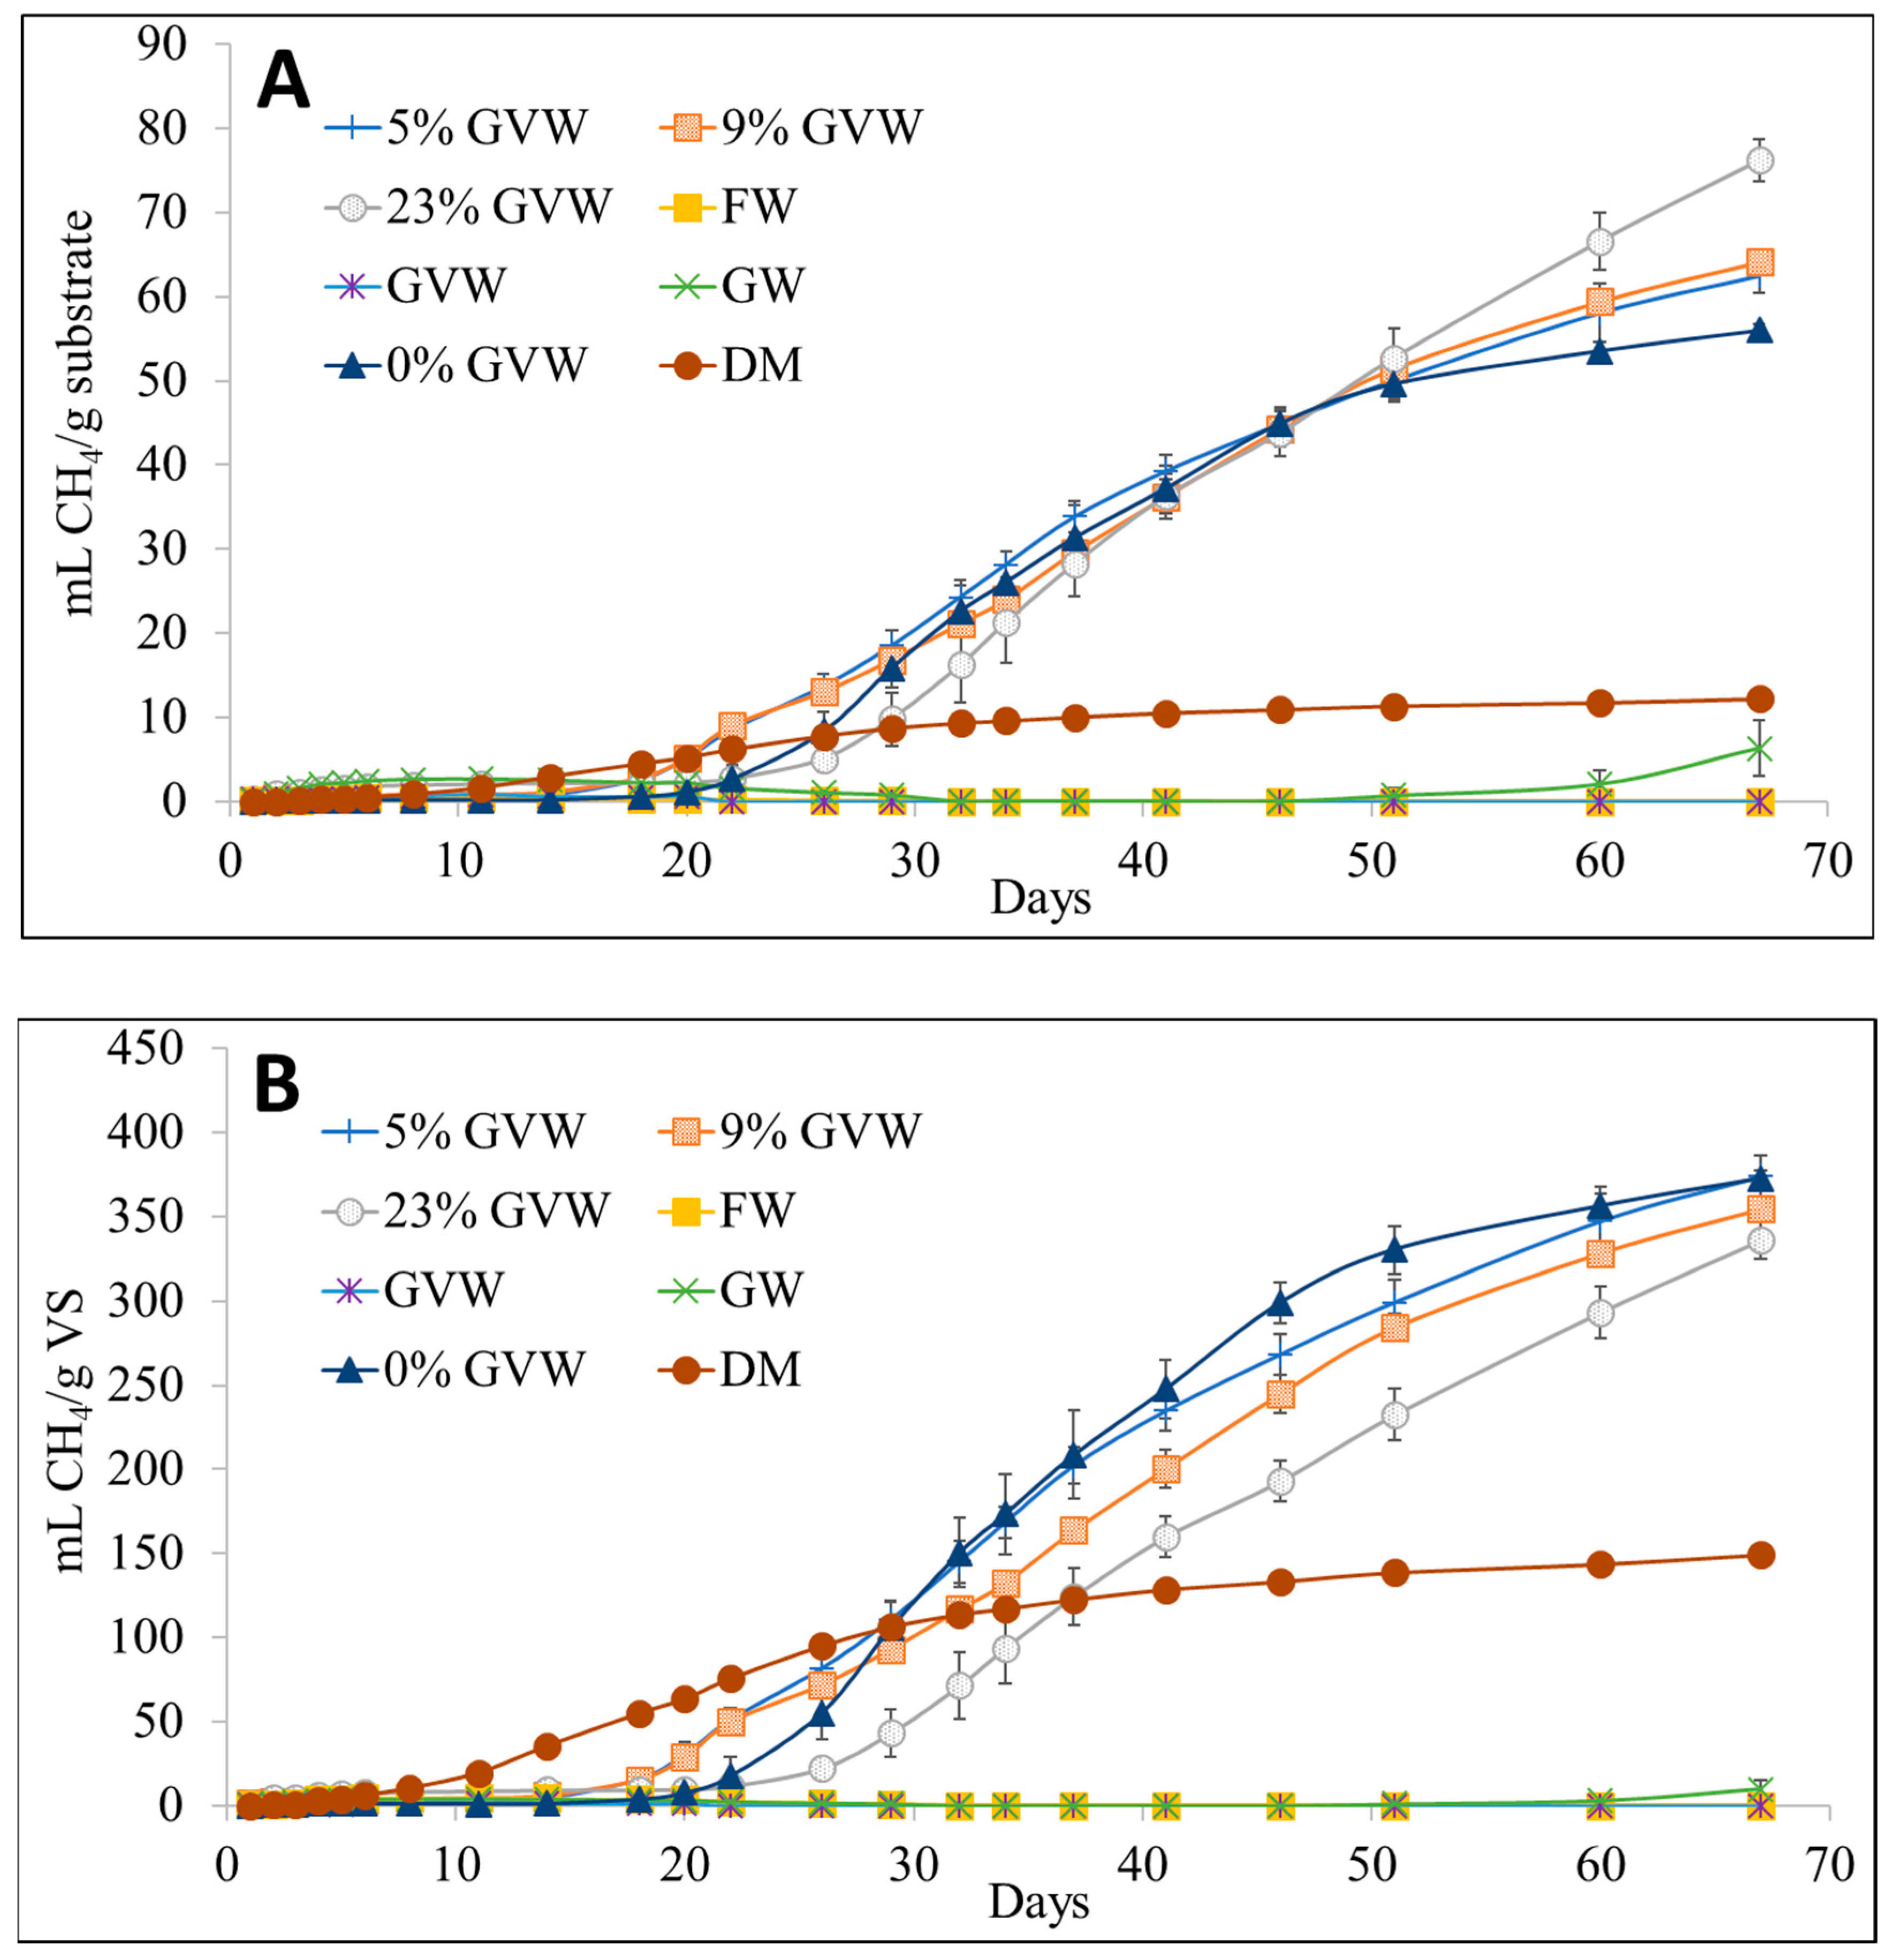
| Dairy manure (DM) | 53.7 ± 0.5 | 149 ± 11 | 12.2 ± 0.1 | 212 ± 17 | 17.4 ± 1.4 |
| Food waste (FW) | 14.8 ± 1.1 | 0 # | 0 # | 99.7 ± 8.8 | 8.3 ± 0.7 |
| Grease waste (GW) | 25.7 ± 3.0 | 10 ± 4.5 | 6.3 ± 2.9 | 33.1 ± 30.4 | 21.4 ± 19.6 |
| Gummy vitamin waste (GVW) | 6.98 ± 0.9 | 0 # | 0 # | 7.0 ± 0.1 | 3.2 ± 0.1 |
| DM.FW.GW (0% GVW) | 67.4 ± 0.2 | 373 ± 6 | 56.0 ± 0.8 | 35.1 ± 2.2 | 5.3 ± 0.3 |
| GVW.DM.FW.GW (5% GVW) | 66.6 ± 1.6 | 374 ± 12 | 62.5 ± 2 | 71.9 ± 13.7 | 12.0 ± 2.3 |
| GVW.DM.FW.GW (9% GVW) | 68.3 ± 1.2 | 355 ± 3 | 64.1 ± 0.5 | 70.4 ± 5.2 | 12.7 ± 0.9 |
| GVW.DM.FW.GW (23% GVW) | 71.1 ± 1.0 | 336 ± 12 | 76.3 ± 2.7 | 68.3 ± 16.6 | 15.5 ± 3.8 |
| Treatment | Initial VS (g/L) | Final VS (g/L) | Decrease in VS (%) | Initial pH | Final pH |
|---|---|---|---|---|---|
| Dairy manure (DM) | 59.5 | 48.0 ± 1.8 | 19.3% | 7.64 | 7.75 |
| Food waste (FW) | 60.0 | 42.0 ± 2.5 | 30.0% | 7.11 | 6.24 |
| Grease Waste (GW) | 87.5 | 79.5 ± 1.1 | 9.1% | 7.79 | 7.21 |
| Gummy vitamin waste (GVW) | 85.5 | 53.0 ± 0.5 | 38.0% | 7.75 | 6.24 |
| DM.FW.GW (0% GVW) | 71.5 | 49.4 ± 0.8 | 30.9% | 7.92 | 7.97 |
| GVW.DM.FW.GW (5% GVW) | 73.5 | 47.6 ± 3.0 | 35.2% | 7.84 | 7.95 |
| GVW.DM.FW.GW (9% GVW) | 74.5 | 49.2 ± 1.3 | 34.0% | 7.87 | 7.95 |
| GVW.DM.FW.GW (23% GVW) | 78.0 | 51.0 ± 2.6 | 34.6% | 7.77 | 7.88 |
| Treatment | Day 20 (mL CH4/g VS) | Day 46 (mL CH4/g VS) | Day 67 (mL CH4/g VS) |
|---|---|---|---|
| Dairy manure (DM) | 64 (43%) | 133 (89%) | 149 |
| DM.FW.GW (0% GVW) | 7 (2%) | 299 (80%) | 373 |
| GVW.DM.FW.GW (5% GVW) | 30 (8%) | 268 (72%) | 374 |
| GVW.DM.FW.GW (9% GVW) | 29 (8%) | 245 (69%) | 355 |
| GVW.DM.FW.GW (23% GVW) | 10 (3%) | 193 (57%) | 336 |
© 2019 by the authors. Licensee MDPI, Basel, Switzerland. This article is an open access article distributed under the terms and conditions of the Creative Commons Attribution (CC BY) license (http://creativecommons.org/licenses/by/4.0/).
Share and Cite
Choudhury, A.; Lansing, S. Methane and Hydrogen Sulfide Production from Co-Digestion of Gummy Waste with a Food Waste, Grease Waste, and Dairy Manure Mixture. Energies 2019, 12, 4464. https://doi.org/10.3390/en12234464
Choudhury A, Lansing S. Methane and Hydrogen Sulfide Production from Co-Digestion of Gummy Waste with a Food Waste, Grease Waste, and Dairy Manure Mixture. Energies. 2019; 12(23):4464. https://doi.org/10.3390/en12234464
Chicago/Turabian StyleChoudhury, Abhinav, and Stephanie Lansing. 2019. "Methane and Hydrogen Sulfide Production from Co-Digestion of Gummy Waste with a Food Waste, Grease Waste, and Dairy Manure Mixture" Energies 12, no. 23: 4464. https://doi.org/10.3390/en12234464
APA StyleChoudhury, A., & Lansing, S. (2019). Methane and Hydrogen Sulfide Production from Co-Digestion of Gummy Waste with a Food Waste, Grease Waste, and Dairy Manure Mixture. Energies, 12(23), 4464. https://doi.org/10.3390/en12234464