Article

Modeling the Effect of the Loss of Cyclable Lithium on the Performance Degradation of a Lithium-Ion Battery

1
Department of Chemical Engineering and Division of Energy Systems Research, Ajou University, Suwon 16499, Korea
2
Gwangju Bioenergy R & D Center, Korea Institute of Energy Research, Gwangju 61003, Korea
*
Authors to whom correspondence should be addressed.
Energies 2019, 12(22), 4386; https://doi.org/10.3390/en12224386
Submission received: 26 September 2019 / Revised: 8 November 2019 / Accepted: 14 November 2019 / Published: 18 November 2019
(This article belongs to the Section D: Energy Storage and Application)

Abstract

:
This paper reports a modeling methodology to predict the effect of the loss of cyclable lithium of a lithium-ion battery (LIB) cell comprised of a LiNi0.6Co0.2Mn0.2O2 cathode, natural graphite anode, and an organic electrolyte on the discharge behavior. A one-dimensional model based on a finite element method is presented to calculate the discharge behaviors of an LIB cell during galvanostatic discharge for various levels of the loss of cyclable lithium. Modeling results for the variation of the cell voltage of the LIB cell are compared with experimental measurements during galvanostatic discharge at various discharge rates for three different levels of the loss of cyclable lithium to validate the model. The calculation results obtained from the model are in good agreement with the experimental measurements. On the basis of the validated modeling approach, the effects of the loss of cyclable lithium on the discharge capacity and available discharge power of the LIB cell are estimated. The modeling results exhibit strong dependencies of the discharge behavior of an LIB cell on the discharge C-rate and the loss of cyclable lithium.

1. Introduction

The lithium-ion battery (LIB) is a preferred power source for battery electric vehicles (BEVs), because LIBs have higher energy density, longer life and higher power density than most other practical batteries [1]. Although long lifespan (i.e., 10–15 years) is required for LIBs that are targeted for BEV applications, the service life of LIBs is limited as a consequence of various aging mechanisms including lithium deposition, electrolyte decomposition, active material dissolution, phase changes in the insertion electrode materials, and passive film formation over the electrode and current collector surfaces among others [2]. The aging of LIB for BEV applications generally manifests itself in the performance degradation such as capacity and power fades [3]. It is, therefore, essential to predict the performance degradation of LIBs by including the various causes of aging in the modeling and simulation tools of LIB for the optimal design and management of the vehicle electrical system in BEV applications [4].
There have been many previous efforts concerning the aging mechanisms and the modeling to predict the aging for LIBs. The reviews on the aging mechanisms of LIBs are given in references [2,3,4,5,6,7,8]. Different models have been developed to account for various degradation mechanisms leading to the aging of LIBs [9,10,11,12,13,14,15,16,17,18,19,20,21]. The aging models for LIBs [9,10,11,12,13,14,15,16,17,18,19,20,21] basically adopted a porous electrode model based on the concentrated solution theory developed by Doyle et al. [22] and altered the model of Doyle et al. [22] to deal with the degradation mechanisms. Kwon et al. [23] introduced a modeling strategy different from the rigorous porous electrode model [22] to predict the effect of electrode configuration on the discharge performance of an LIB cell. They presented a model to compute the two-dimensional distributions of the potential and current density on the electrodes of an LIB cell. By not computing the potential distribution of electrolyte phase and the transport phenomena of lithium ion, the model of Kwon et al. [23] cuts down considerable computation time in comparison with the rigorous porous electrode model [22], while preserving the validity of the model. Kim et al. [24,25,26,27] and Yi et al. [28,29,30] carried out a two-dimensional modeling to compute the thermal behaviors of an LIB throughout charge and discharge processes based on the distributions of potential and current density on the electrodes acquired by following a similar procedure of Kwon et al. [23]. They reported that the thermal modeling results agree well with the experimental IR measurements. Koo et al. [31] enhanced the previous works [23,24,25,26,27,28,29,30] to unravel the effect of fast charge scenarios composed of different types of fast charge protocols on the cycle life of LIBs.
According to the aging effects of LIBs summarized by the previous reviews [2,3,4,5,6,7,8], the growth of solid electrolyte interphase (SEI) induces the loss of cyclable lithium and electrolyte decomposition. Furthermore, the solvent interaction with the graphite in the negative electrode may cause the graphite exfoliation and create gas which can crack the SEI. In terms of battery performance, both of the losses of cyclable lithium and active materials lead to the fading of the battery’s capacity and the battery resistance increase is engendered by the passive film growth at the surface of active material. These processes influencing LIB aging do not occur separately [7] and it has been a challenge to isolate the contribution of individual effects on the overall performance degradation of an LIB [32]. Dubarry et al. [33,34,35] presented a mechanistic model that can synthesize a variety of cell aging scenarios based on degradation modes, including loss of active material, loss of lithium inventory, kinetic degradation or increase of polarization resistance, formation of parasitic phases, Li plating, and any combination of them. Their approach employed a modified equivalent circuit model from which the cell performance is emulated from two-separated half-cell modules each constructed from laboratory experimental data. Although this approach offers the advantages of universal applicability to various cell chemistries and operating modes, pristine half-cell pseudo open-circuit voltage measurements, which take a long time, and aging history measurements are required to discard the estimation of wrong degradation modes [36,37]. In this work, a one-dimensional model obtained by reducing the spatial dimension of the two-dimensional model of Kim et al. [24,25,26,27] and Yi et al. [28,29,30], owing to the cylindrical symmetry of a coin cell is presented to investigate the effect of the loss of cyclable lithium on the performance degradation of LIBs, because the loss of cyclable lithium is considered as the main reason for the capacity and power fades of LIBs [19,20,21]. The modeling approach adopted in this work [24,25,26,27,28,29,30,31] requires only straightforward measurements of the cell voltages during constant-current discharge at a few different C-rates and the procedures to obtain the key modeling parameters are simple and obvious as compared to the other modeling approach mentioned above [9,10,11,12,13,14,15,16,17,18,19,20,21,22,33,34,35]. Validation of the modeling approach is provided via a comparison of the modeling results with experimental measurements.

2. Mathematical Model

Aging and lifespan depend on the LIB type [38,39,40,41]. The most common LIBs are lithium cobalt oxide (LCO) with a LiCoO2 cathode and a graphite anode, lithium manganese oxide (LMO) with a LiMn2O4 cathode and a graphite anode, lithium nickel manganese cobalt oxide (NMC) with a LiNiMnCoO2 cathode and a graphite anode, lithium iron phosphate (LFP) with a LiFePO4 cathode and a graphite anode, lithium nickel cobalt aluminum oxide (NCA) with a LiNiCoAlO2 cathode and a graphite anode, and lithium titanate (LTO) with a LMO or NMC cathode and a Li2TiO3 anode. A coin-type LIB cell comprised of LiNi0.6Co0.2Mn0.2O2 (NCM622) cathode, natural graphite anode, and an organic electrolyte, which can be classified as one of NMCs, is modeled in this work. Figure 1 shows a schematic diagram of the two-dimensional currents in the two parallel circular electrodes during discharge. The distance between the electrodes is assumed to be so small that the current between the electrodes would be perpendicular to them. The two-dimensional currents on the positive and negative electrodes in Figure 1 are assumed to have circular symmetry with respect to the axis passing through the centers of the circular electrodes. Then, the two-dimensional currents on the electrodes are reduced to one-dimensional currents in terms of the radial coordinate, r, in Figure 1. The modeling procedure used to calculate the potential and current density distribution on the electrodes is similar to that of the two-dimensional model of Kim et al. [24,25,26,27] and Yi et al. [28,29,30]. Ohm’s law is expressed as follows:
i p , r = 1 r p d V p d r for R c < r < R
i n , r = 1 r n d V n d r for R c < r < R
where i p , r and i n , r are the r components of the linear current density vectors [current per unit length (A·m−1)] in the positive and negative electrodes, respectively; rp and rn are the resistances (Ω) of the positive and negative electrodes, respectively; and Vp and Vn are the potentials (V) of the positive and negative electrodes, respectively. Rc and R denote the radii of the electrical contact and the coin cell, respectively. From the continuity of the current on the positive and negative electrodes during discharge, the Poisson equations to compute the potential distributions on the positive and negative electrodes are derived as follows:
1 r d d r ( r d V p d r ) = + r p J for R c < r < R
1 r d d r ( r d V n d r ) = r n J for R c < r < R
where J is the current density [current per unit area (A·m−2)] transferred through the separator from the negative electrode to the positive electrode.
The relevant boundary conditions for Vp are
1 r p d V p d r = I 0 2 π R c on   r = R c
d V p d r = 0 on   r = R
The first boundary condition (5) means that the linear current density through the electrical contact of length 2 π R c (cm) has a value of I 0 2 π R c . I0 is the total current (A) through the electrical contact in the constant-current discharge mode, which is a function of time. The second boundary condition in Equation (6) implies that there is no current through the electrode edge. The boundary conditions for Vn are
V n = 0 on   r = R c
d V n d r = 0 on   r = R
The first boundary condition in Equation (7) means that the potential at the electrical contact of the negative electrode has a fixed value of zero as the reference potential. The second boundary condition in Equation (8) implies the same as in the case of Vp. The solutions to the governing Equations (3) and (4) subject to the associated boundary conditions (5)–(8) were obtained by using the finite element method as explained in Refs. [24,25,26,27,28,29,30].
The current density, J, of Equations (1) and (2) is a function of the potentials of the positive and negative electrodes. The functional relationship between the current density and the electrode potentials depends on the polarization characteristics of the electrodes. In this study, the following polarization expression used by Tiedemann and Newman [42] and Newman and Tiedemann [43] is employed:
J = Y ( V p V n U )
where Y and U are the fitting parameters. The physical meaning of U is similar to the equilibrium potential of the battery cell and Y may be regarded as a reaction rate constant of an electrochemical reaction as discussed in Ref. [25]. As discussed by Gu [44], U and Y are the functions of SOC (state of charge). The details of the procedures to obtain the functional relationships of U and Y with respect to SOC are given in Section 4.

3. Experimental Section

The electrochemical properties of samples were measured using CR2032 coin-type cells. CR2032 is normally used for a primary (single use) coin cell with a lithium cathode having the dimension of 20 mm diameter and 3.2 mm height, but it is occasionally a secondary (rechargeable) battery. LiNi0.6Co0.2Mn0.2O2 (NCM622) cathode and natural graphite anode were used as standard electrode materials. Conductive carbon and PVDF binder ratios were two weight percentages each with NCM622 in the cathode. A high loading level over 14 mg·cm−1, which is comparable with that of PHEV cells, was adopted for the cathode. In the anode, 1% carbon with 2.5% SBR/CMC binder in graphite was loaded. The full cell capacity balance ratio for the negative and positive electrodes (N/P) was 1.1. Electrode materials were purchased from Wellcos Corporation (Gunpo-si, Gyeongi-do, Korea) to maintain the consistency. One M LiPF6 in a 3:4:3 mixture of ethylene carbonate (EC), ethyl methyl carbonate (EMC) and diethyl carbonate (DEC) with 2% VC (vinyl carbonate) was used as the electrolyte with an SC1622 separator (W-SCOPE, Cheongwon-gun, Chungbuk, Korea). Galvanostatic charge–discharge tests were conducted with Maccor 4000 battery cycler (Maccor, Tulsa, OK, USA).
In order to embody the loss of cyclable lithium, NCM622 cathode was assembled using lithium metal as the counter electrode. The NCM622 half-cell performed three cycles of the charge–discharge process for cell formation at 0.1 C between 2.5–4.2 voltage range, and then the cell discharged up to the intended values of depth of discharge at 80%, 90% and 100% each. Loss percentage of cyclable lithium was checked by the discharge capacity value at the third formation cycle of the cells. To extract the lithium loss electrode, the NCM622/lithium metal cell was disassembled in an argon-filled glovebox to retrieve the cathode with the intended loss percentage of cyclable lithium. The retrieved cathode with the loss of cyclable lithium was washed by using dimethyl carbonate (DMC) and dried in a vacuum chamber to prevent air exposure.

4. Results and Discussion

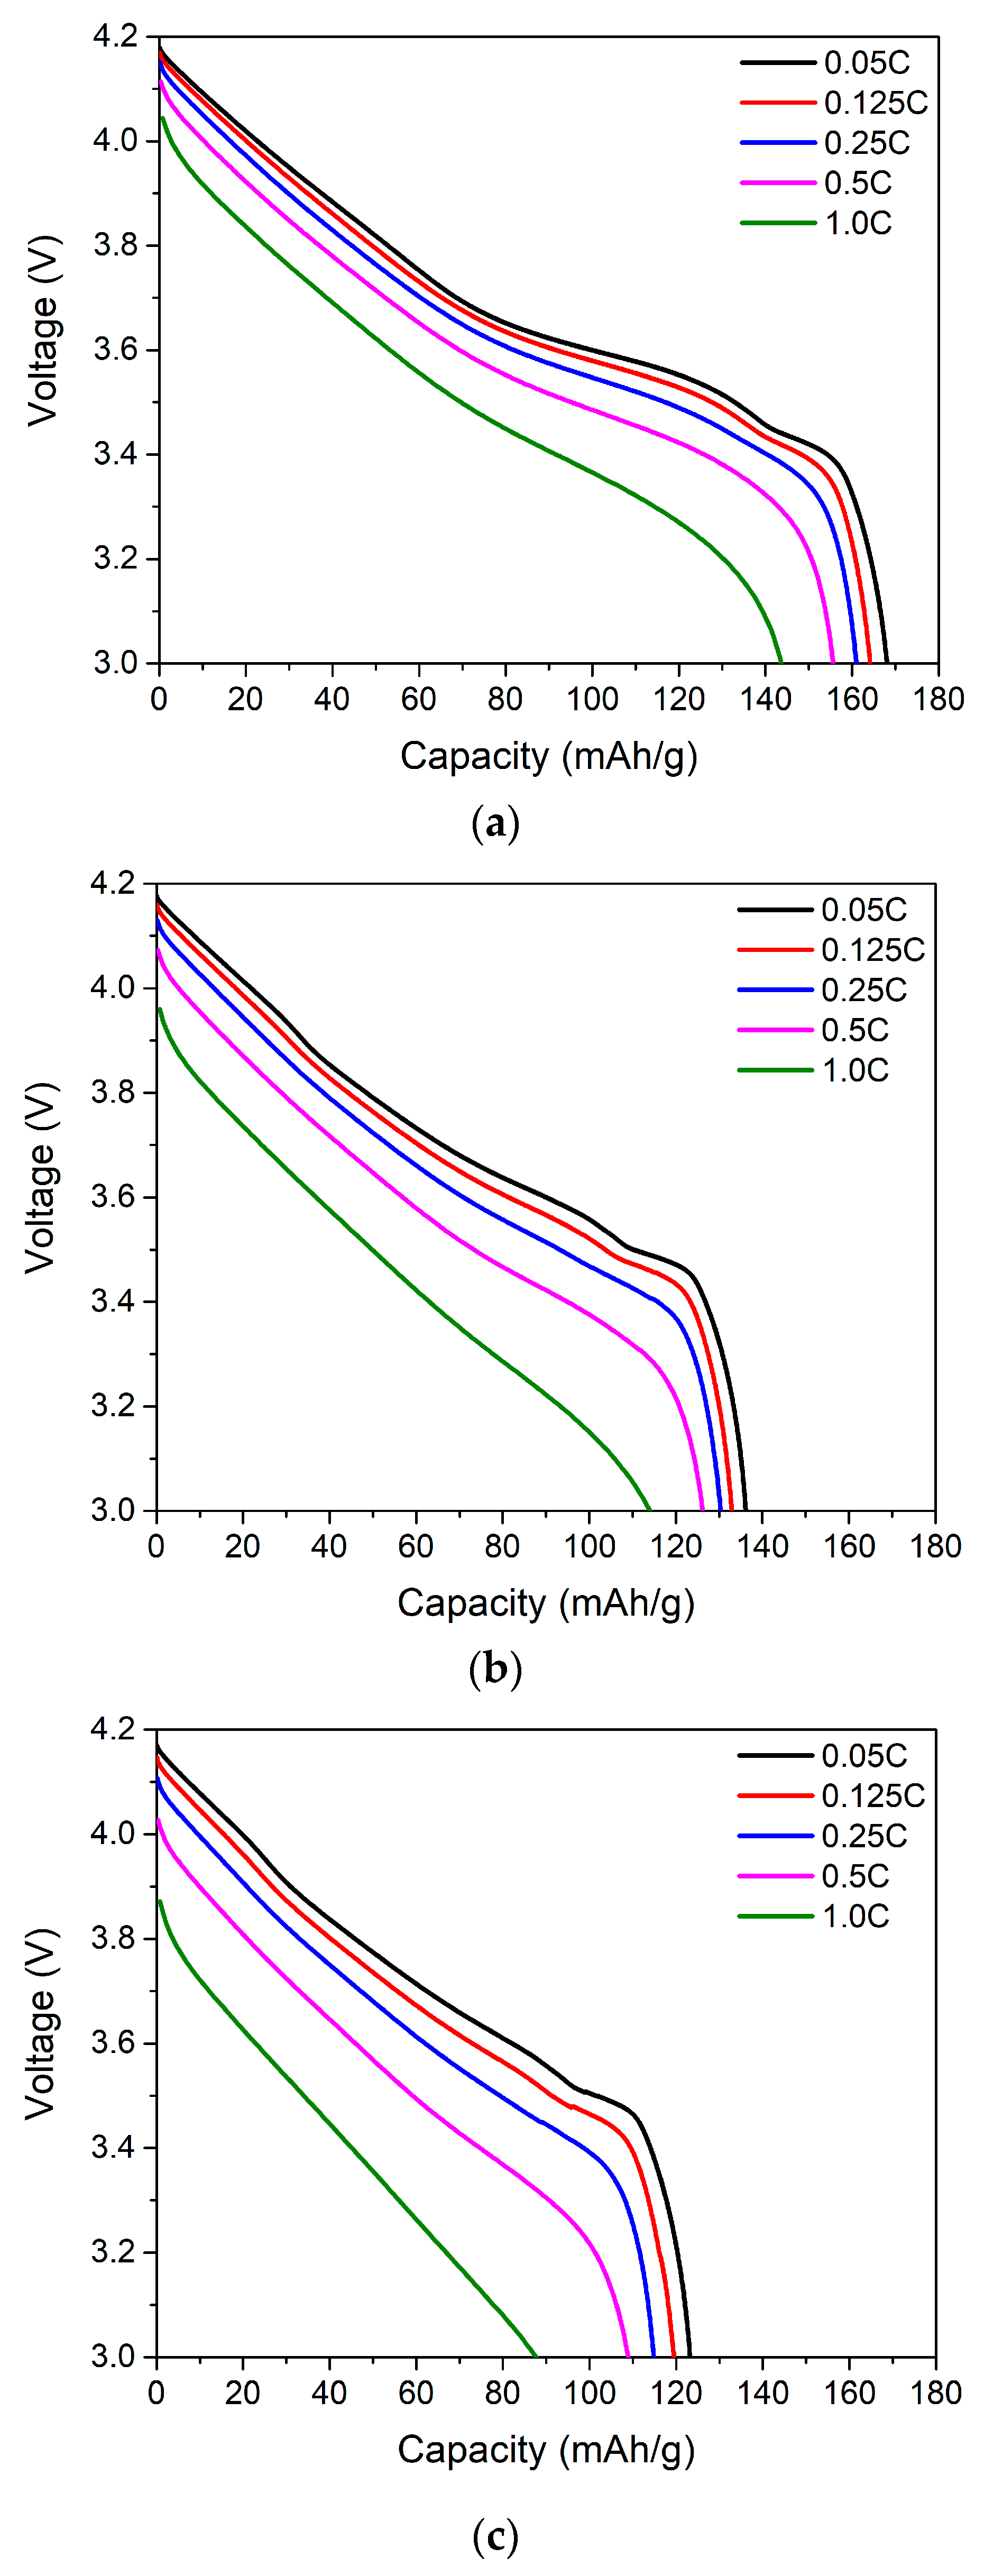
The experimental discharge curves of the LIB full cells comprised of the NCM622 cathode and natural graphite anode with no loss, 10% loss, and 20% loss of cyclable lithium are shown in Figure 2a–c, respectively.
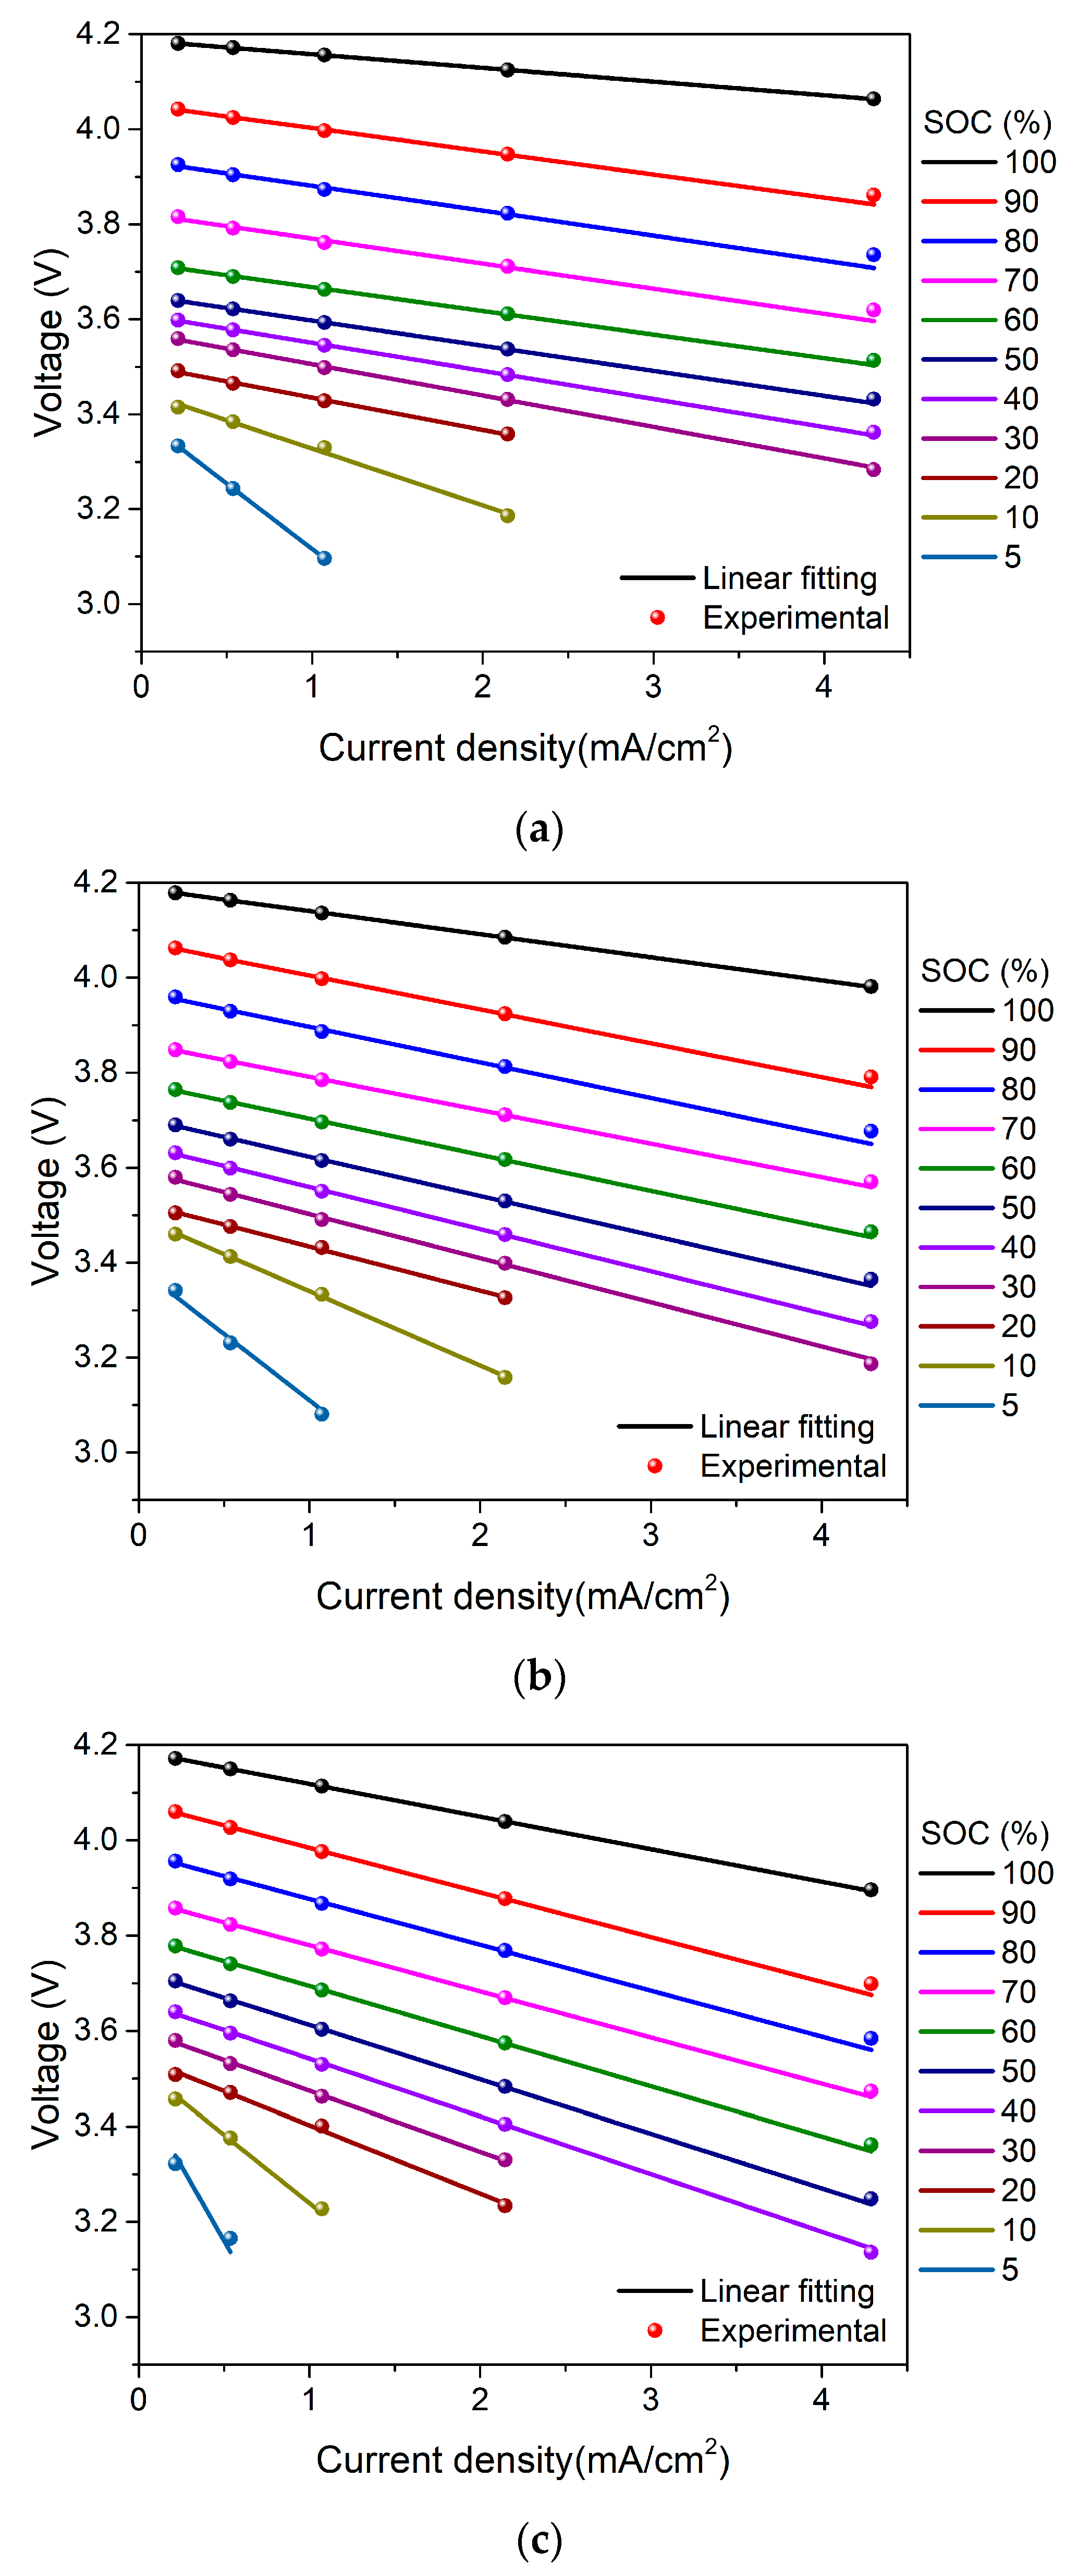
The experimental data of Figure 2a–c can be converted to the cell voltage as a function of applied current density during discharge as shown in Figure 3a–c, respectively. The cell voltage data are fitted fairly well with a linear function of applied current density, which justifies the use of the functional relationship of Equation (9) between the cell voltage and applied current density.
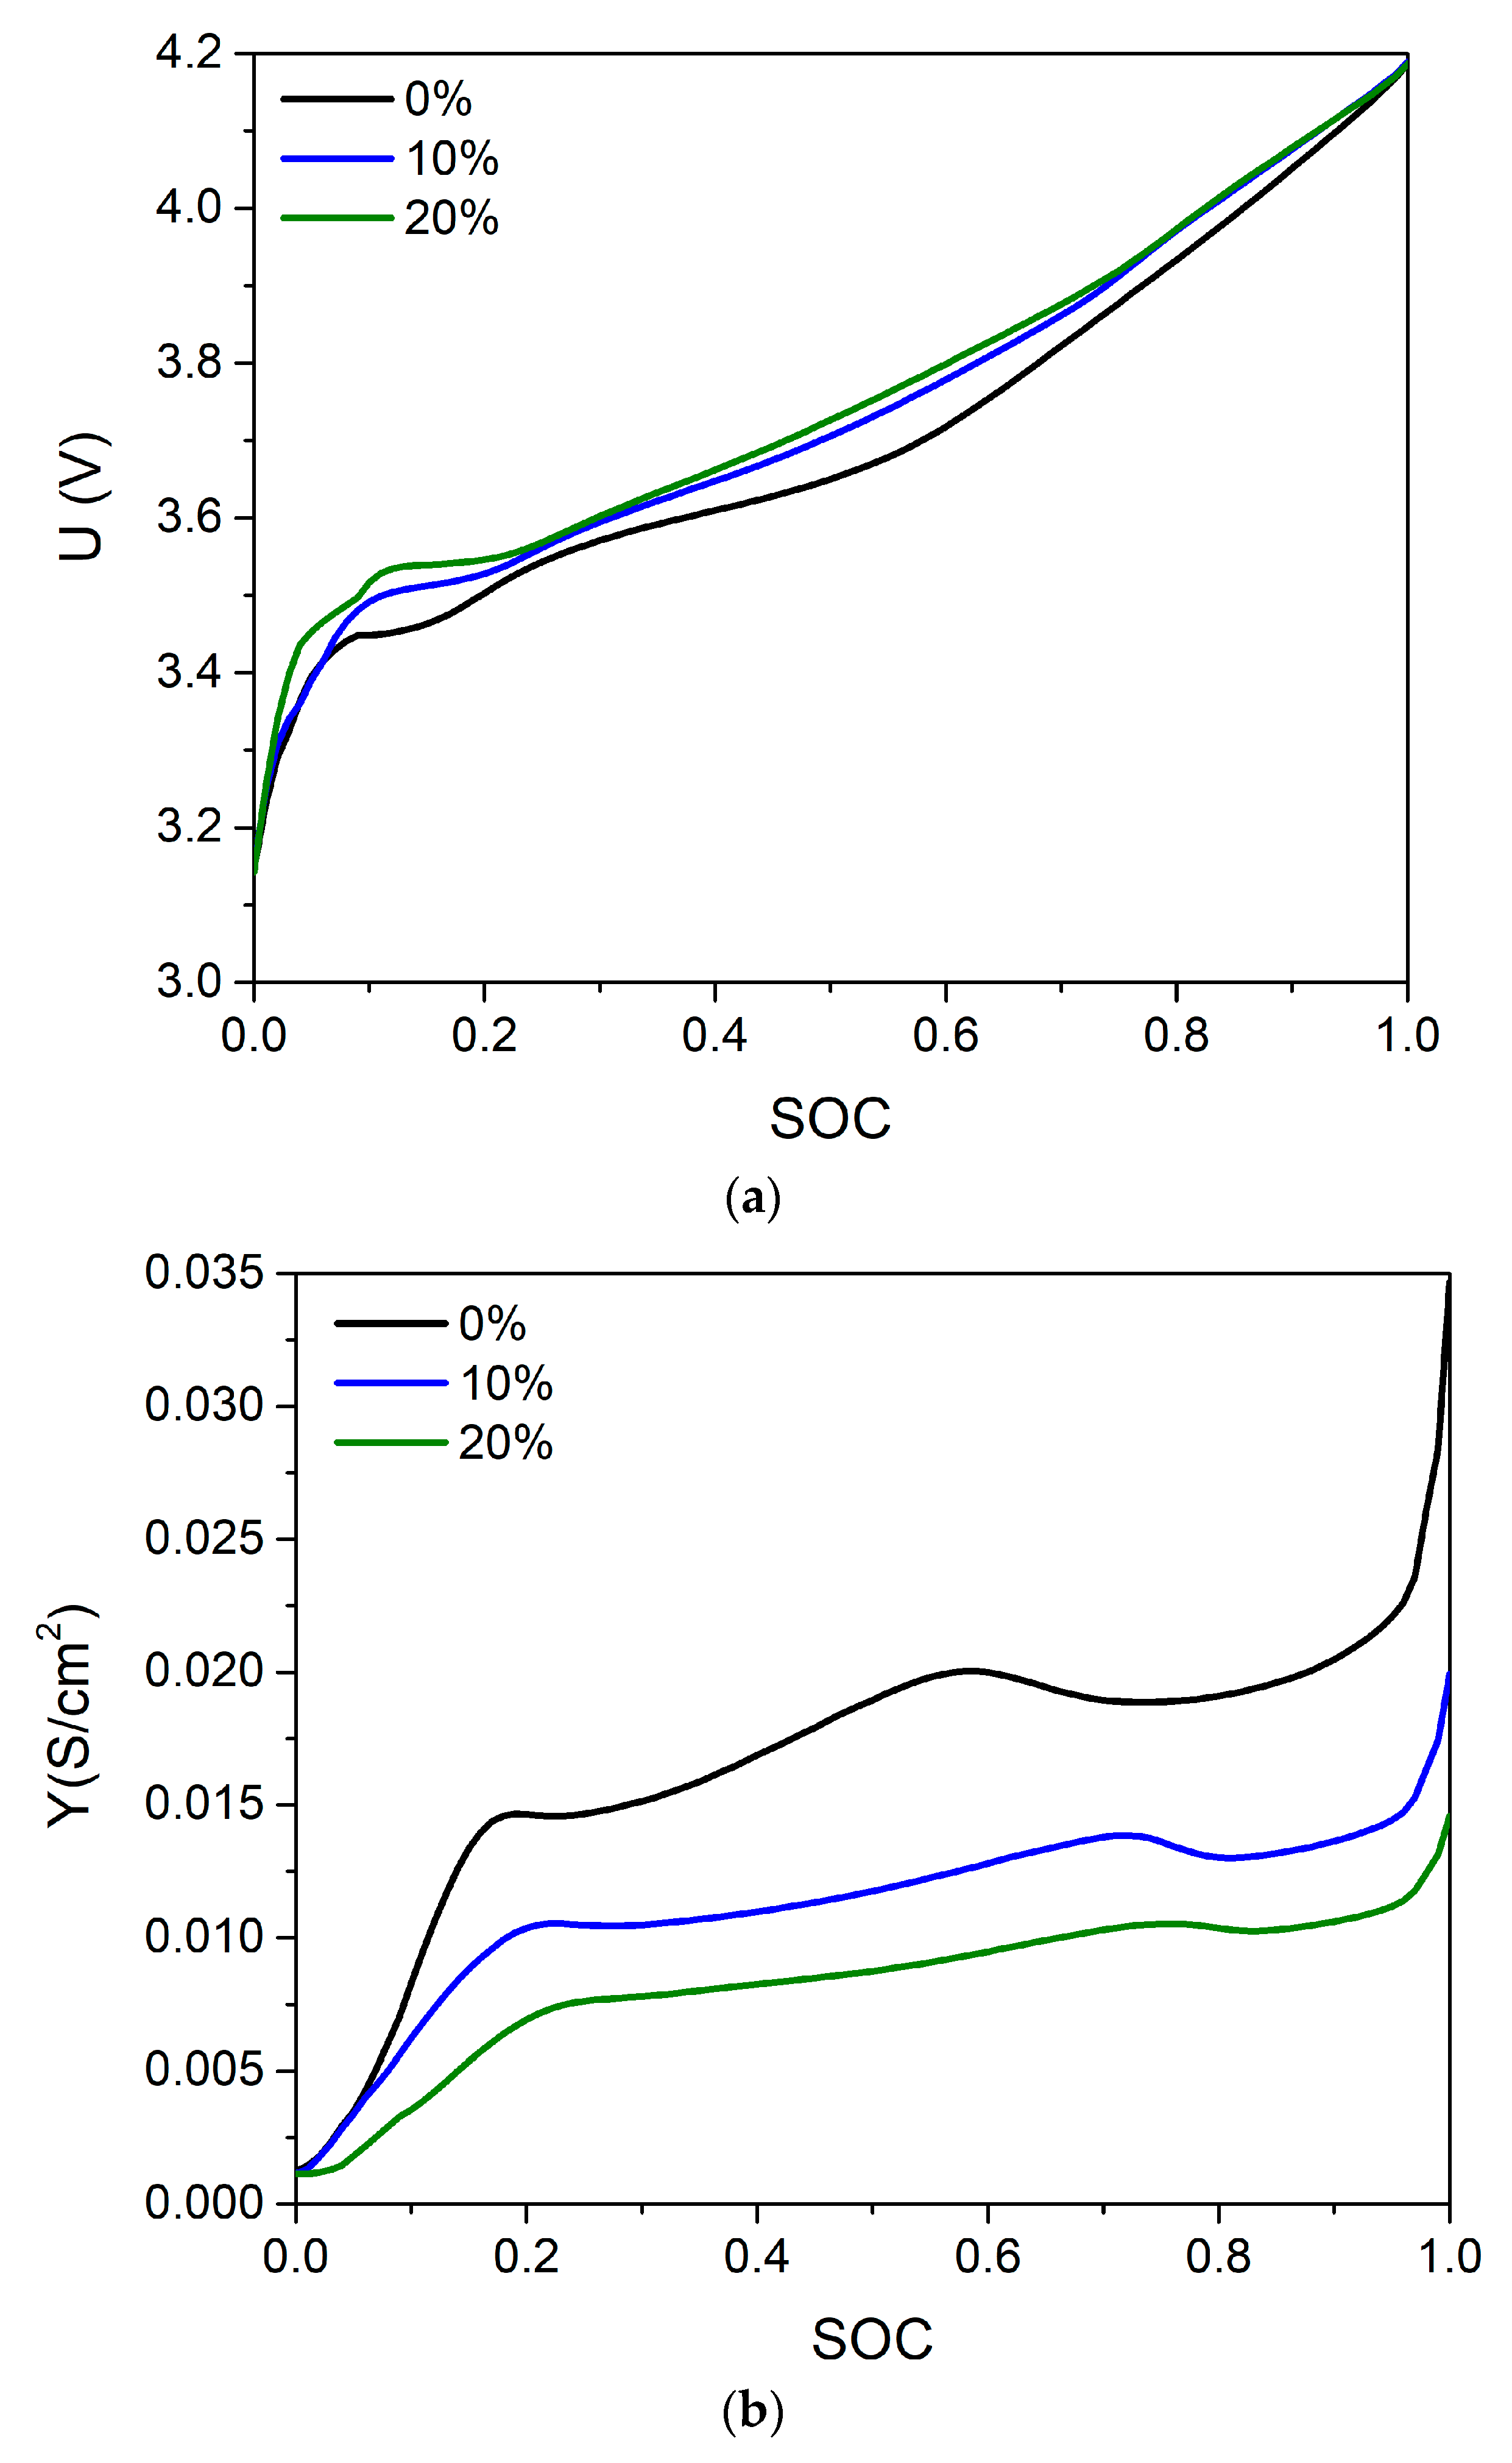
From the slopes and intercepts with vertical axis of the linear fittings at different SOC values, the functional relationships of Y and U with SOC are obtained. The values of U and Y are obtained by the method demonstrated in Figure 3a–c for a specific value of the 101 end points of 100 equally spaced intervals of SOC ranging from 0 to 1. The functional relationships of U and Y with SOC are obtained by using a piecewise linear interpolation on those 100 intervals of SOC between 0 and 1, instead of expressing U and Y as polynomial functions of SOC, as shown in previous works [24,25,26,27,28,29,30]. The relationships of U and Y with SOC of the LIB cells with no loss, 10% loss, and 20% loss of cyclable lithium are shown in Figure 4a,b, respectively. As mentioned in the last paragraph of Section 2, the physical meaning of U is similar to the equilibrium potential of the battery cell and Y may be regarded as a reaction rate constant of an electrochemical reaction. U and Y are the two key modeling parameters of this work.
With the object of the model validation, the calculated discharge curves from the model using U and Y presented in Figure 4a,b are compared with the experimental data with discharge rates ranging from 0.05 C to 1.0 C for the LIB cells with no loss, 10% loss, and 20% loss of cyclable lithium in Figure 5a–c, respectively. The experimental discharge curves are generally in good agreement with the modeling results based on the finite element method, although there is some deviation between the experimental and modeling discharge curves for a high discharge rate of 1.0 C near the end of discharge. The model captures all of the salient features of the discharge characteristics of the cell voltage from the initial stage of discharge to the cutoff voltage of 3.0 V at various discharge rates from 0.05 C to 1.0 C for the three different levels of the loss of cyclable lithium. This demonstrates the validity of the modeling approach for predicting the effect of the loss of cyclable lithium on the discharge behaviors of an LIB cell, comprised of an NCM622 cathode, natural graphite anode, and an organic electrolyte.
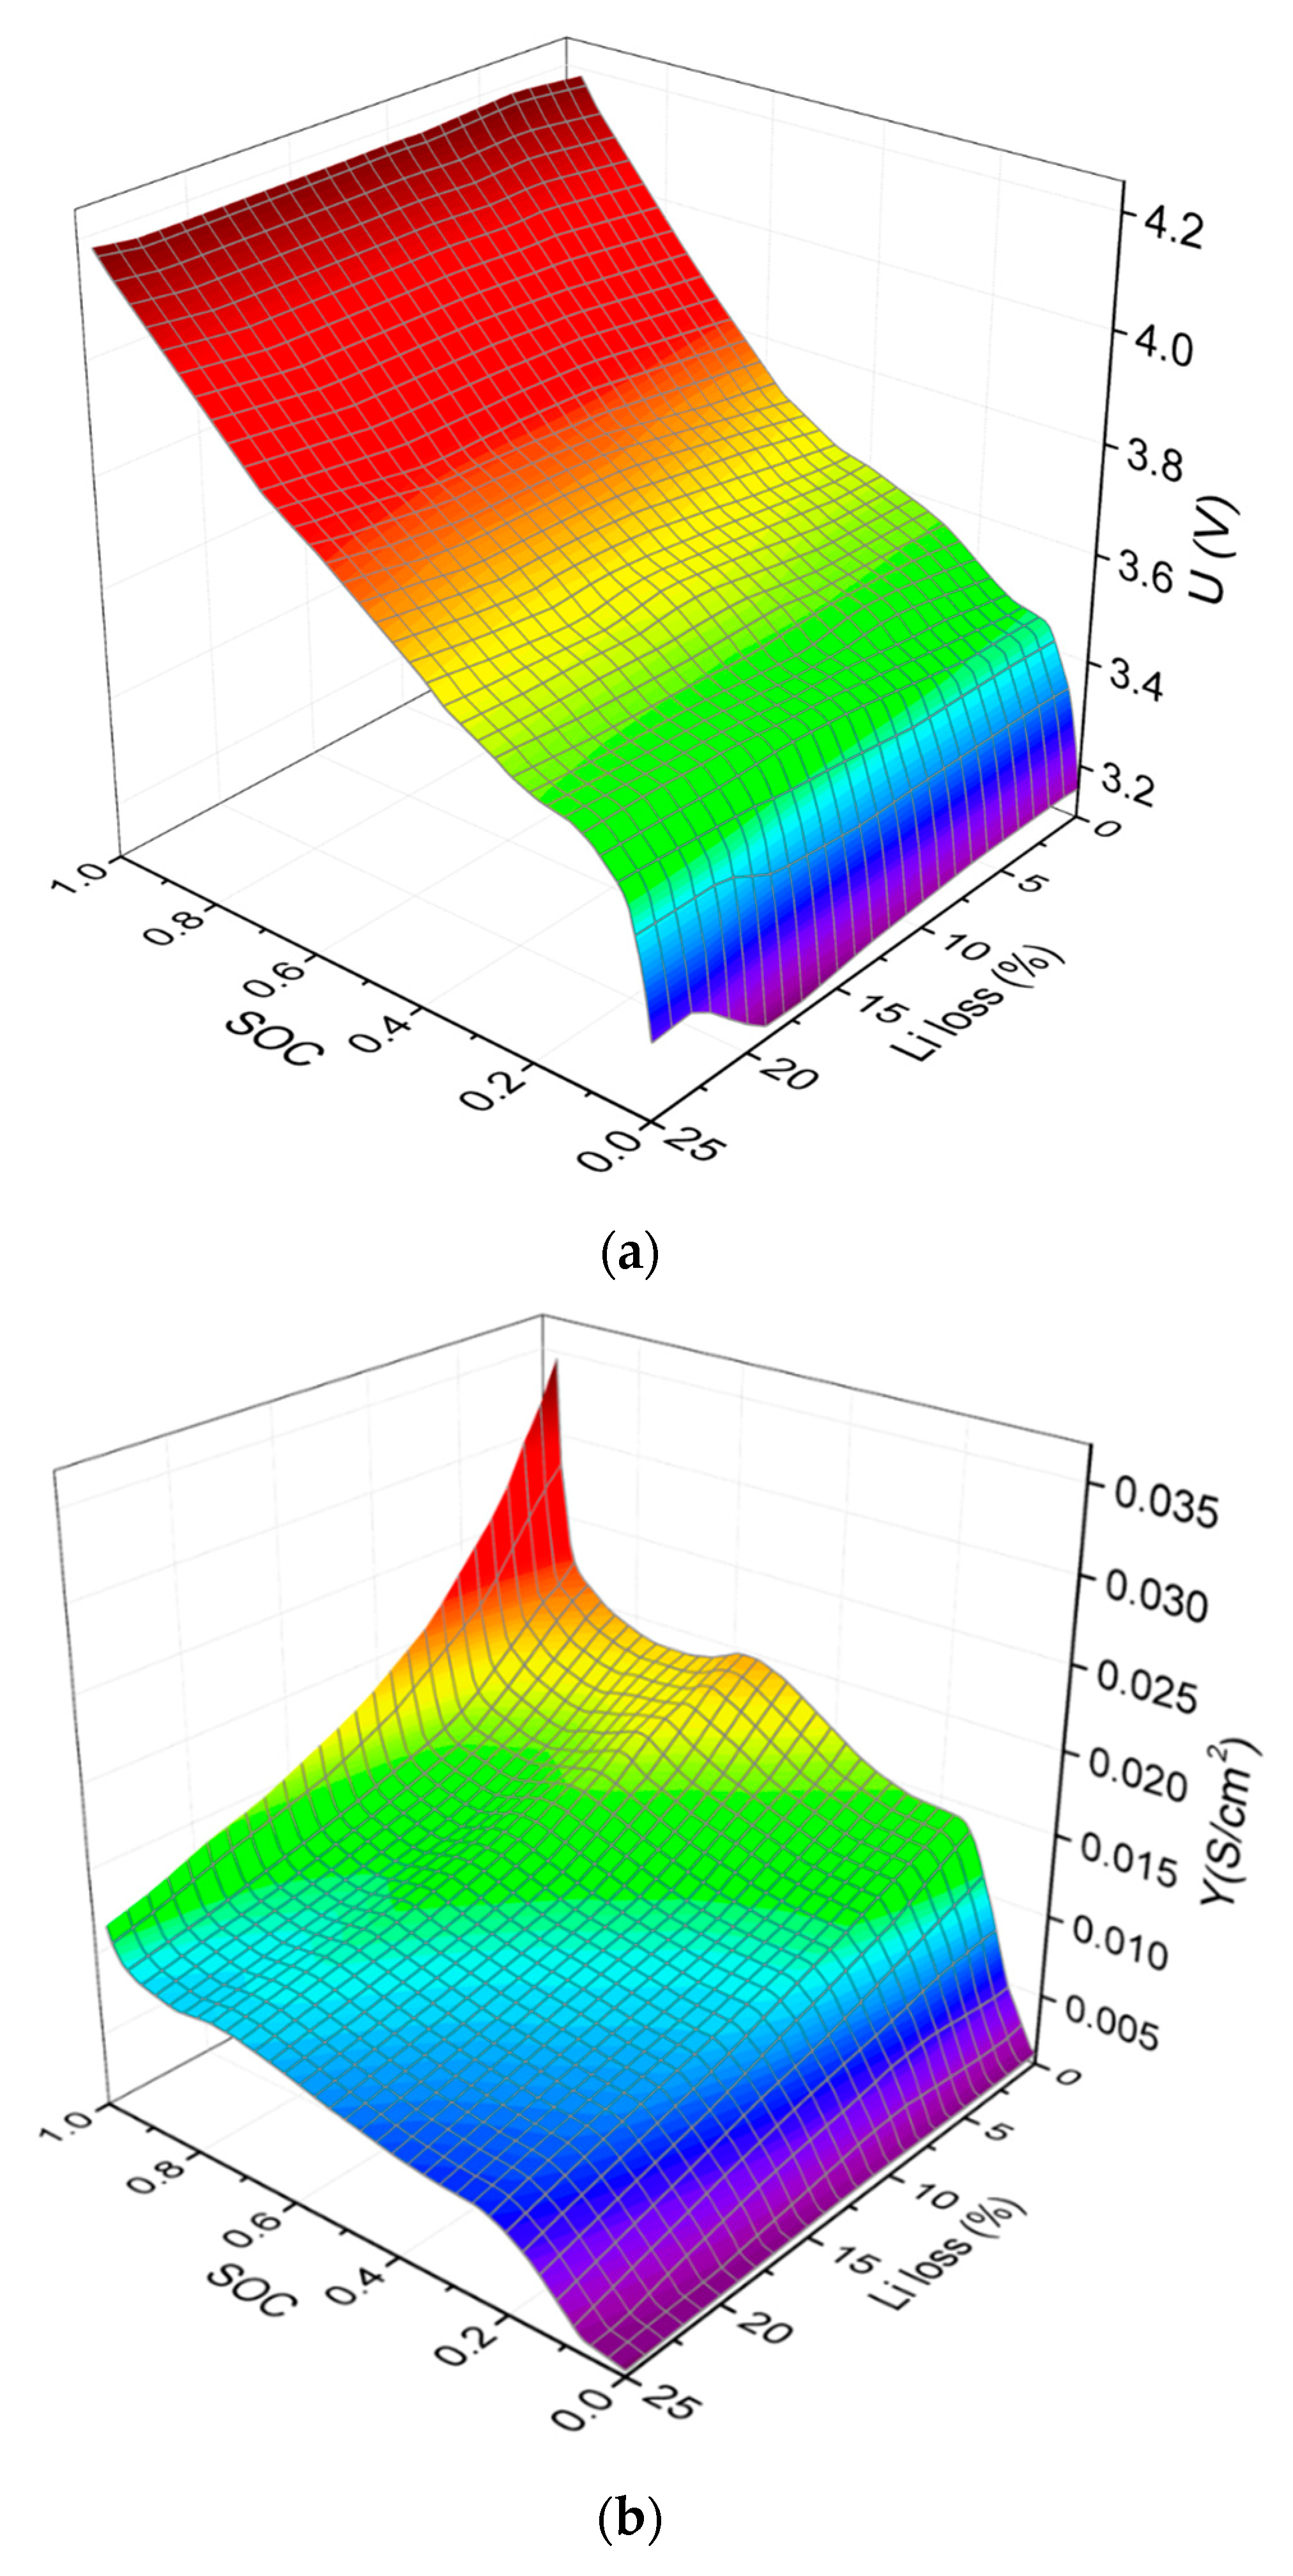
In order to estimate the discharge behaviors of an LIB cell for a broader range of the loss of cyclable lithium other than those in Figure 5a–c for which the experiments are performed, U and Y are calculated as functions of SOC and the loss of cyclable lithium by using the kriging method. The kriging method is widely used in geostatistical science and the software library is open to the public [45]. The kriging method provides an optimal interpolation or extrapolation for the unknown values of the function with multiple parameters from the observed data at known locations based on regression. In this work, the functional relationships between U, Y and the SOC values for the three different levels of the loss of cyclable lithium in Figure 4a,b are provided as input to the kriging software and the kriging software generates the U and Y as a function of SOC for the loss of cyclable lithium, other than the three levels of the loss of cyclable lithium in Figure 4a,b. These results are given as the three-dimensional surface plots of U and Y as functions of SOC and the loss of cyclable lithium in Figure 6a,b.
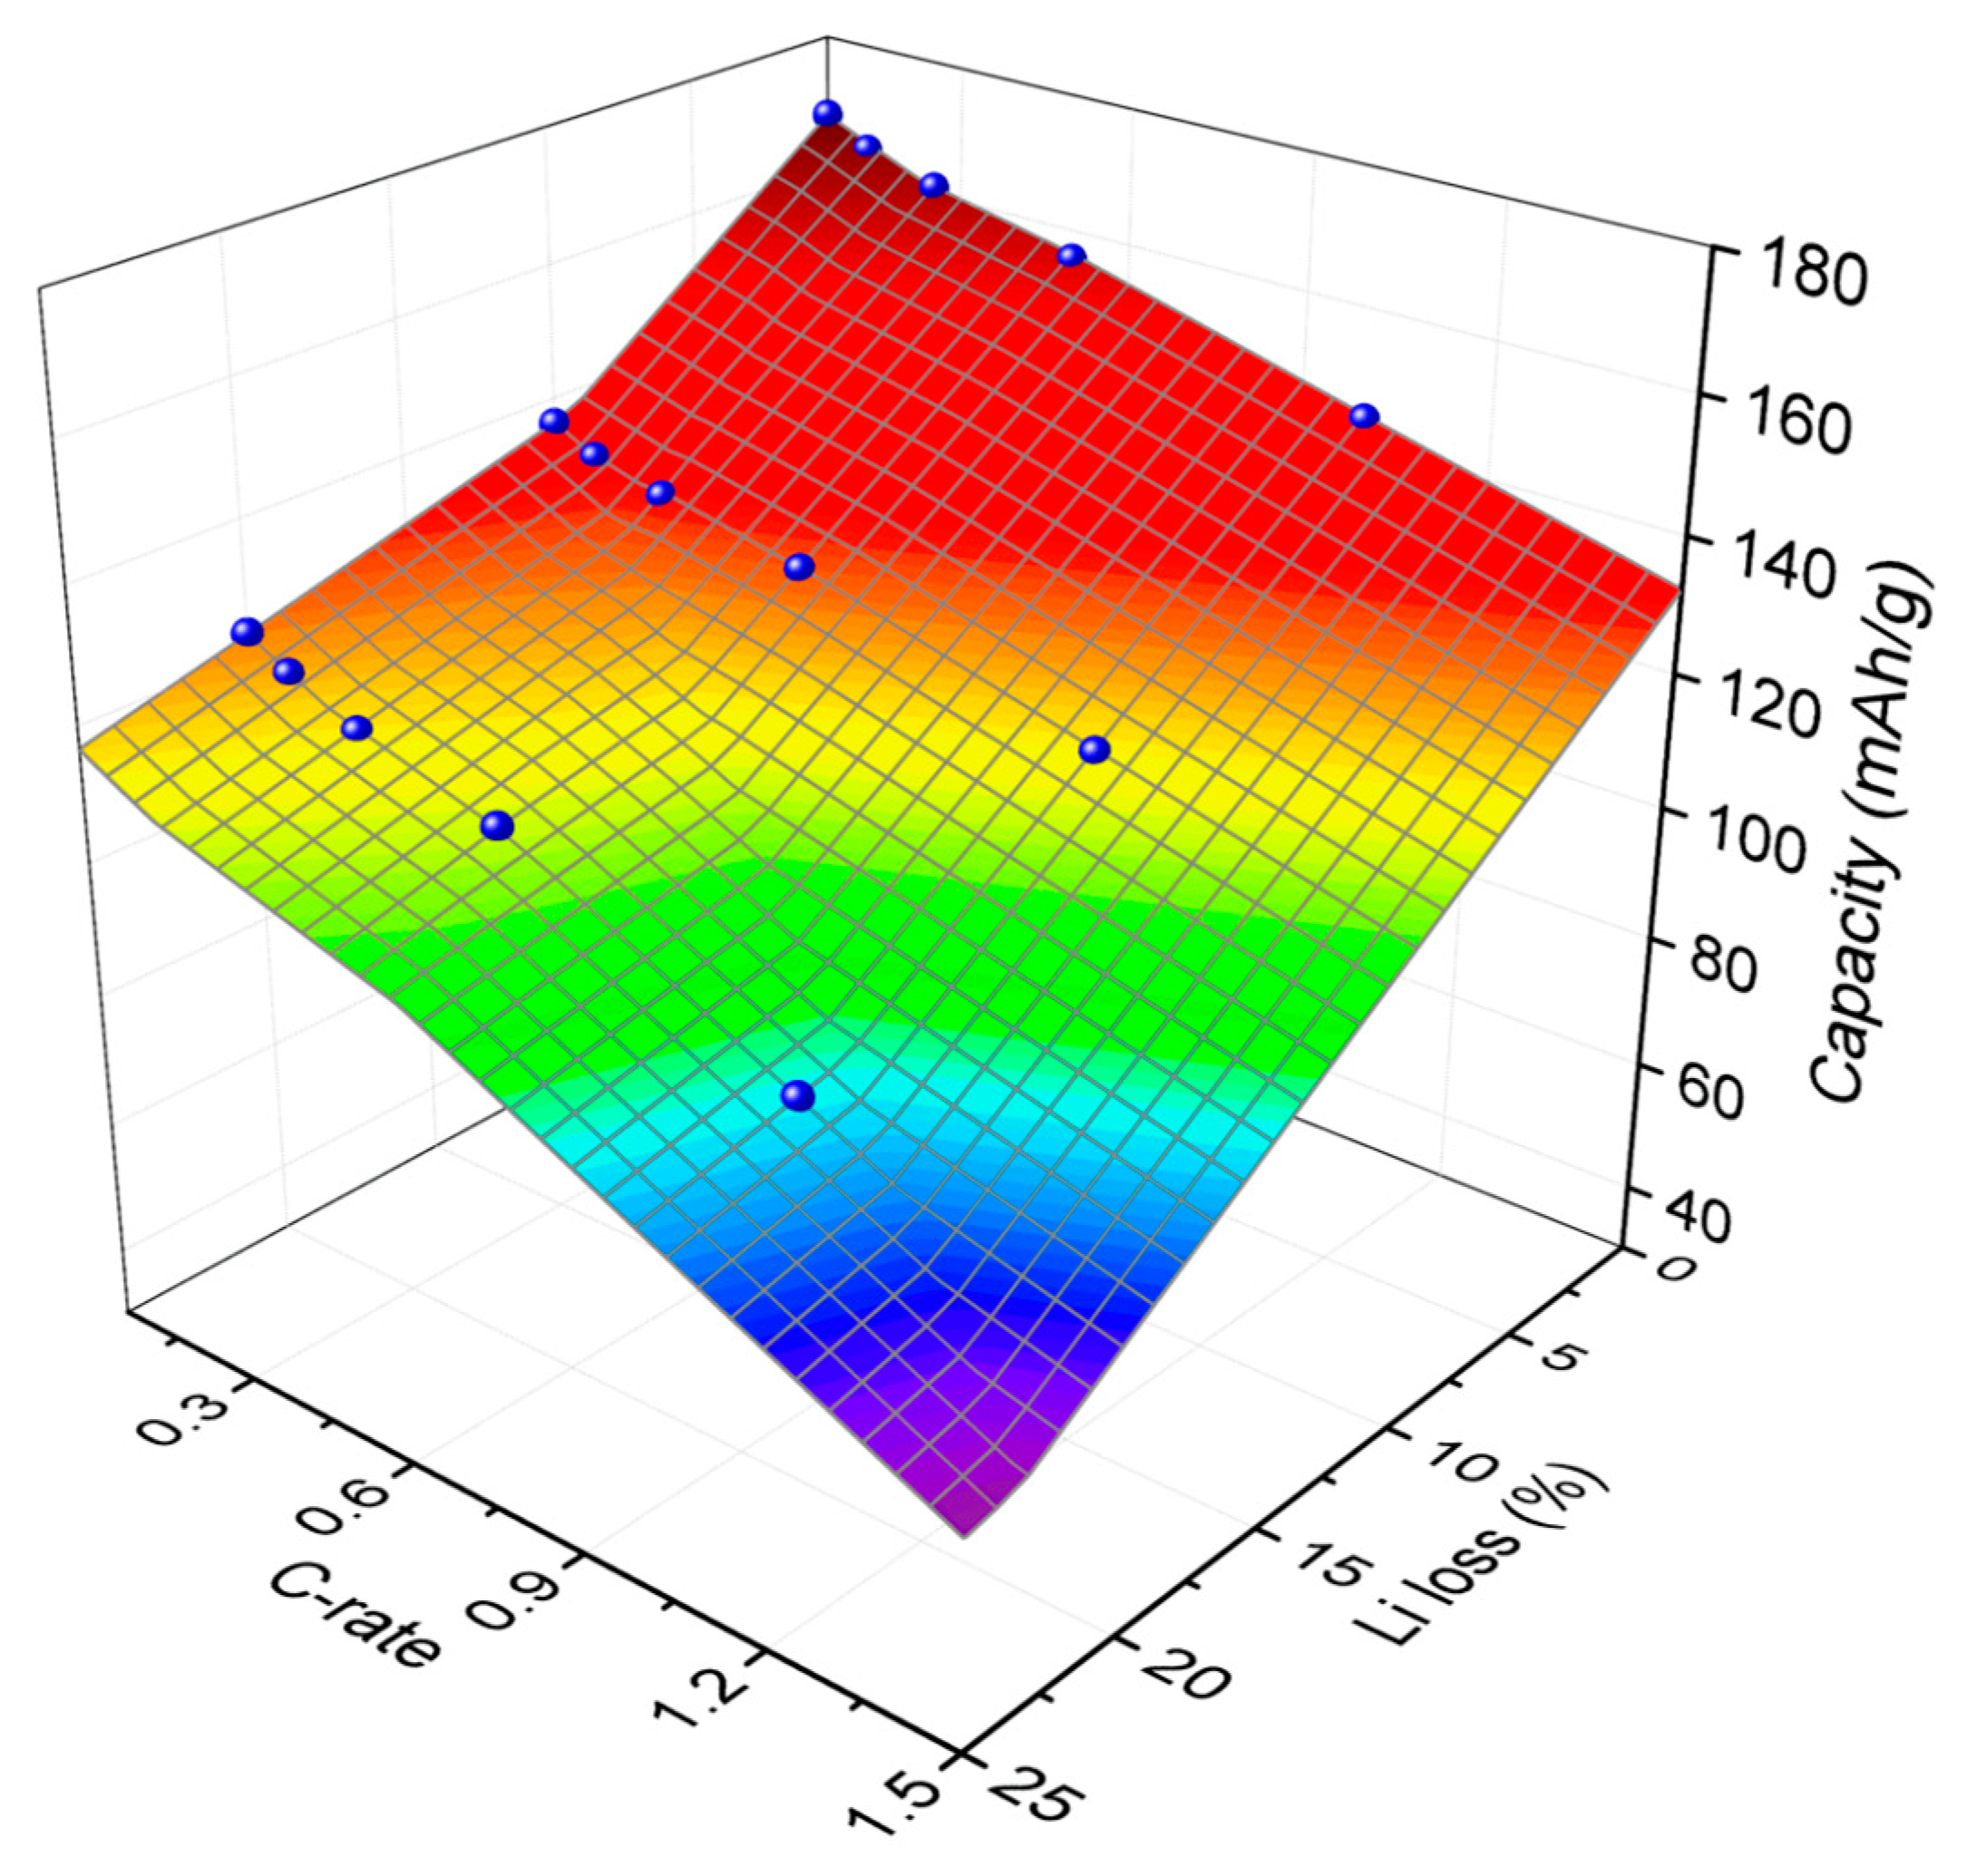
By using the values of U and Y in Figure 6a,b, the discharge capacities at the discharge rates ranging from 0.05 C to 1.5 C are estimated for the loss of cyclable lithium ranging from 0% to 25%, and the results are plotted in Figure 7. The discharge capacity decreases monotonically at a given discharge rate as the degree of the loss of cyclable lithium increases for the range of the loss of cyclable lithium investigated in this work. As the discharge rate increases from 0.05 C to 1.5 C, the capacity decrease is more pronounced.
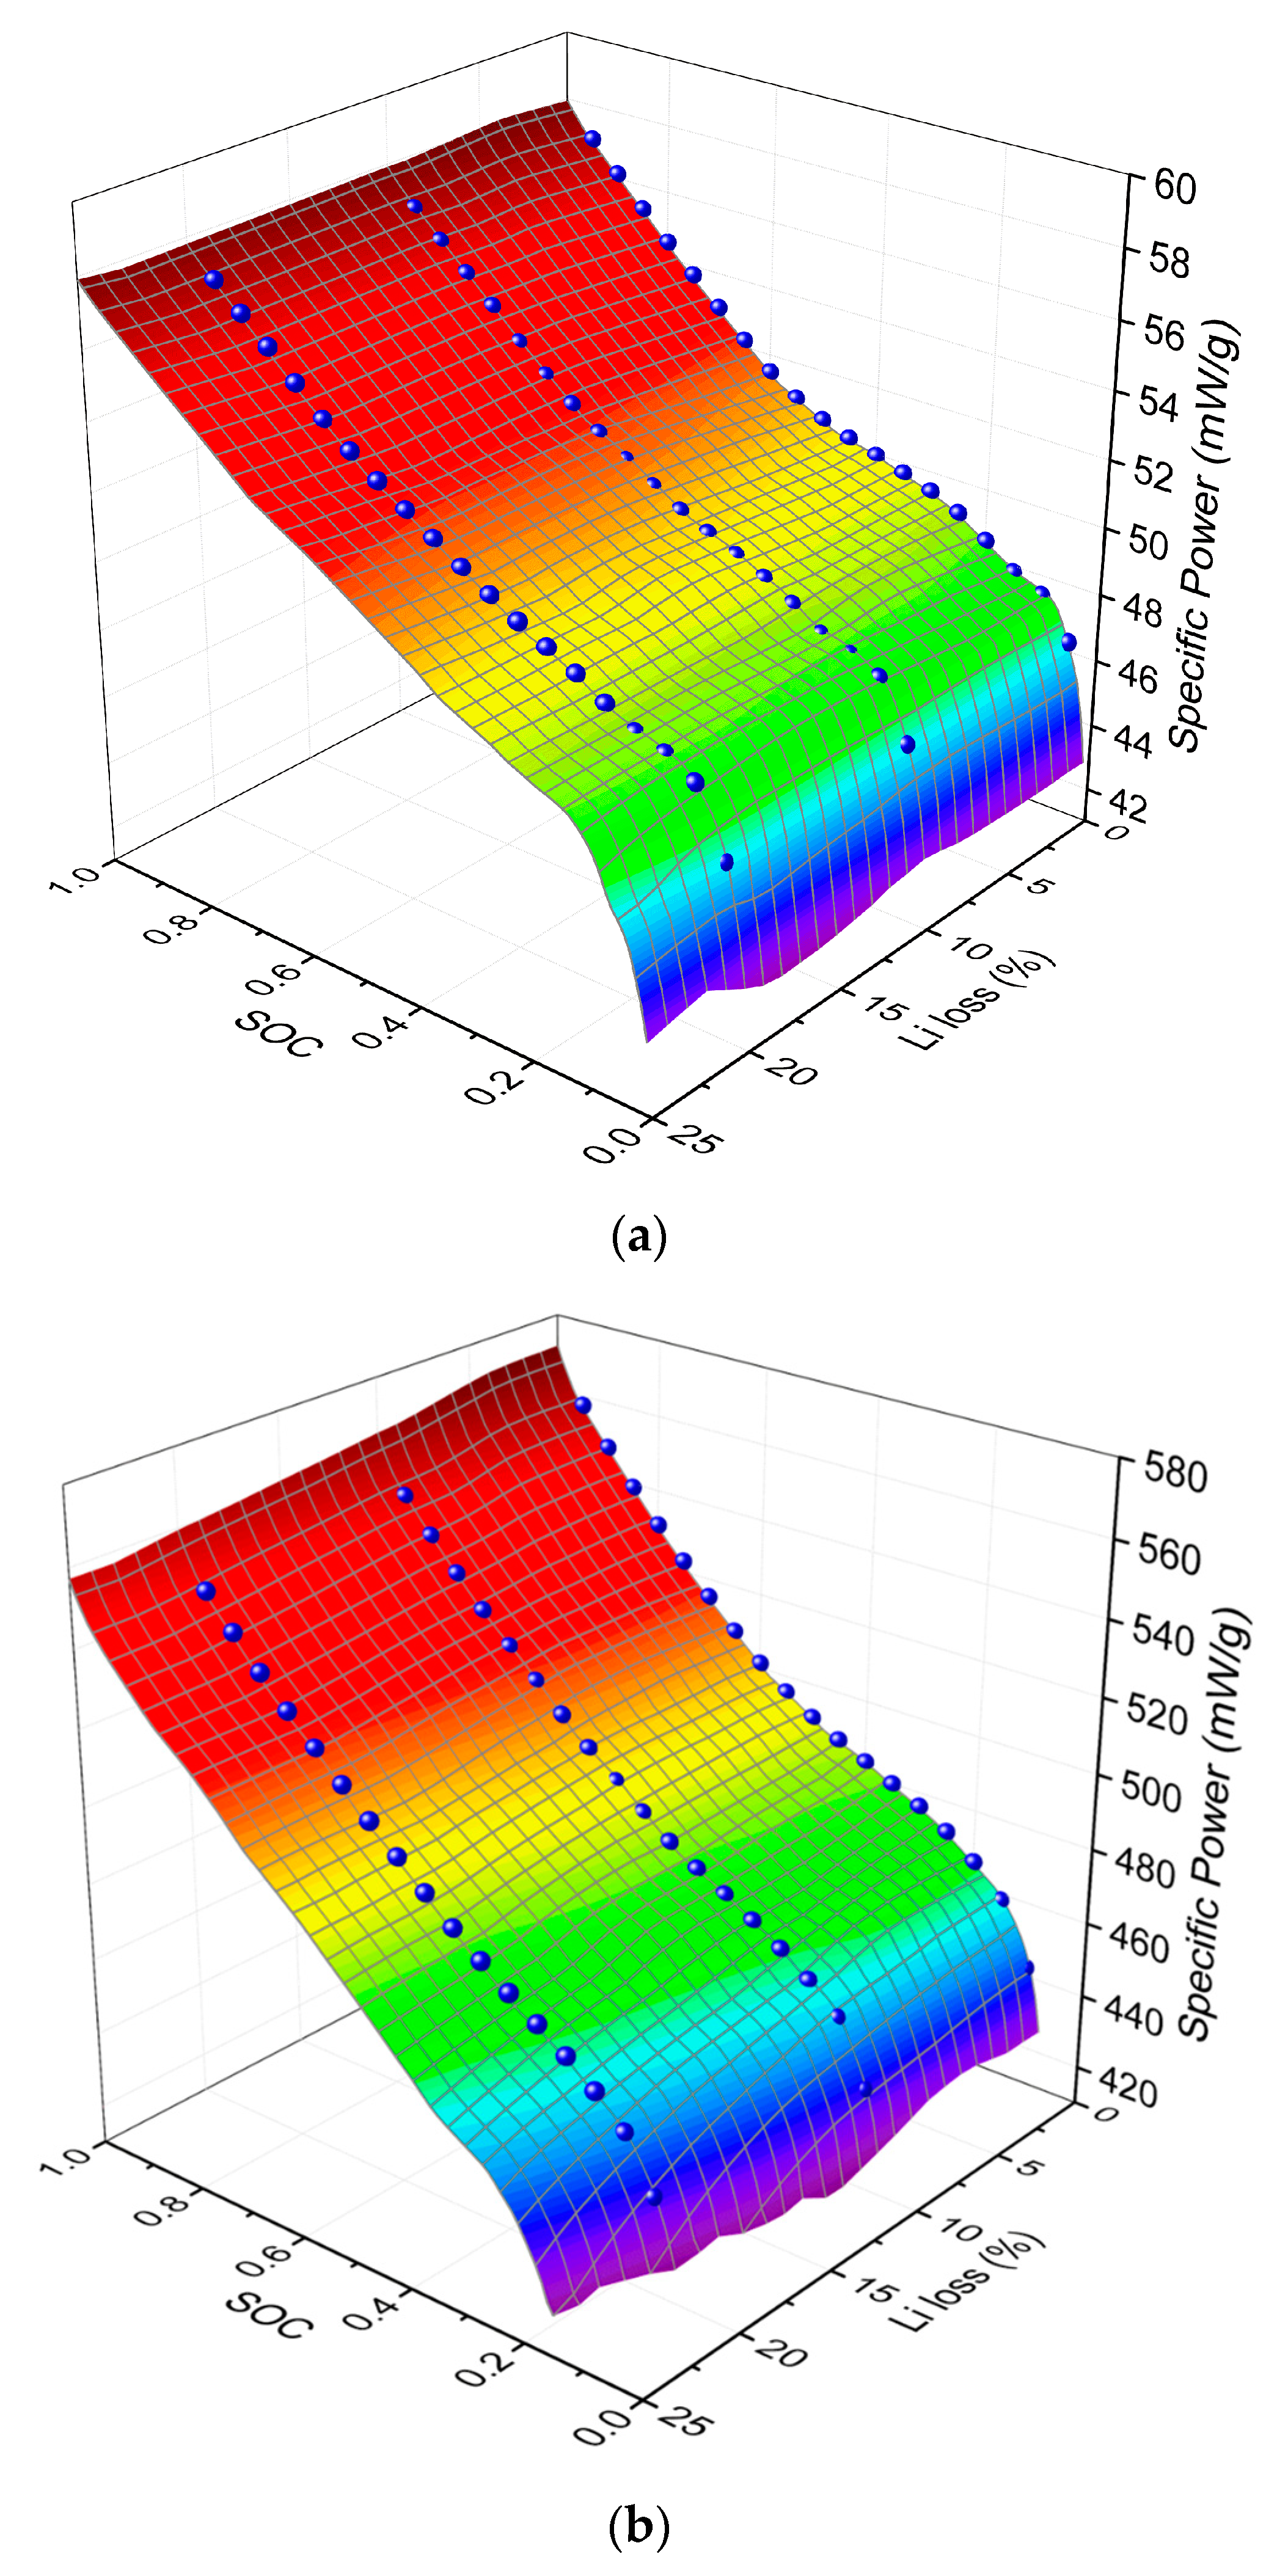
The available discharge power of an LIB cell depends on many factors including the discharge rate, SOC, and aging of the battery cell as well as cell chemistry. Because the loss of cyclable lithium is one of the main causes for the aging of LIB [19,20,21], the available discharge powers are calculated as a function of SOC and the loss of cyclable lithium for the discharge rates of 0.05 C and 0.5 C and the results are shown in Figure 8a,b, respectively. The available discharge power decreases as SOC decreases at a given discharge rate, because the LIB cell voltage declines as SOC decreases during discharge. At a low discharge rate of 0.05 C, the effect of the loss of cyclable lithium on the discharge power is not significant as shown in Figure 8a. As the discharge rate increases up to 0.5 C, the effect of the loss of cyclable lithium on the discharge power is more pronounced than that of the discharge rate of 0.05 C as demonstrated in Figure 8b.
The performance degradation of LIBs including capacity and power fade depends on many physicochemical processes such as loss of cyclable lithium, dissolution of active materials, structural degradation of electrode materials, loss of electrical contact within the porous electrode to name a few. These processes influencing LIB aging do not occur separately, but they cause together the performance degradation. Isolation of the contribution of the individual processes on the overall performance degradation of an LIB is necessary to analyze the cause and effect on the aging of LIBs. Although only the effect of the loss of cyclable lithium is modeled in this work, the modeling methodology developed in this work can be a meaningful first step to provoke further studies to develop an efficient modeling tool combining the effects of other individual processes on the aging of LIBs.

5. Conclusions

A mathematical procedure was developed to study the effect of the loss of cyclable lithium on the performance degradation of an LIB cell, comprised of an NCM622 cathode, natural graphite anode, and an organic electrolyte. A one-dimensional model based on a finite element method was presented to calculate the discharge behaviors of an LIB cell during galvanostatic discharge for various levels of the loss of cyclable lithium. Modeling results for the variation of the cell voltage of the LFP battery were compared with experimental measurements during galvanostatic discharge at discharge rates of 0.05 C, 0.125 C, 0.25 C, 0.5 C, and 1.0 C for three different levels of the loss of cyclable lithium to validate the model. The calculation results obtained from the model are in good agreement with the experimental measurements. The key modeling parameters were calculated as functions of SOC and the loss of cyclable lithium by using the kriging method to estimate the discharge behavior of an LIB cell for a broader range of the loss of cyclable lithium. The discharge capacities and the available powers were estimated for the loss of cyclable lithium ranging from 0% to 25%. The modeling methodology presented in this study may contribute to the development of an efficient modeling tool combining all the effects of individual aging processes on the performance degradation of LIBs.

Author Contributions

D.L., B.K. and C.B.S. developed the methodology and performed the modeling. S.-Y.L., J.S., I.-C.J., and J.-J.W. provided the experimental data.

Funding

This research was conducted under the framework of the Research and Development Program of the Korea Institute of Energy Research (KIER) (B9-2442-04). This work was partially supported by the National Research Foundation of Korea (2018R1D1A1B0742519) and the Human Resources Program in Energy Technology (No. 20174010201410) of the Korea Institute of Energy Technology Evaluation and Planning (KETEP), which is granted financial resources from the Ministry of Trade, Industry & Energy, Republic of Korea.

Conflicts of Interest

The authors declare no conflicts of interest.

References

  1. Safari, M. Battery electric vehicles: Looking behind to move forward. Energy Policy 2018, 115, 54–65. [Google Scholar] [CrossRef]
  2. Barré, A.; Deguilhem, B.; Grolleau, S.; Gérard, M.; Suard, F.; Riu, D. A review on lithium-ion battery ageing mechanisms and estimations for automotive applications. J. Power Sources 2013, 241, 680–689. [Google Scholar] [CrossRef]
  3. Vetter, J.; Novák, P.; Wagner, M.; Veit, C.; Möller, K.; Besenhard, J.; Winter, M.; Wohlfahrt-Mehrens, M.; Vogler, C.; Hammouche, A. Ageing mechanisms in lithium-ion batteries. J. Power Sources 2005, 147, 269–281. [Google Scholar] [CrossRef]
  4. Rezvanizaniani, S.M.; Liu, Z.; Chen, Y.; Lee, J. Review and recent advances in battery health monitoring and prognostics technologies for electric vehicle (EV) safety and mobility. J. Power Sources 2014, 256, 110–124. [Google Scholar] [CrossRef]
  5. Arora, P.; White, R.E.; Doyle, M. Capacity fade mechanisms and side reactions in lithium-ion batteries. J. Electrochem. Soc. 1998, 145, 3647–3667. [Google Scholar] [CrossRef]
  6. Aurbach, D. Review of selected electrode-solution interactions which determine the performance of Li and Li ion batteries. J. Power Sources 2000, 89, 206–218. [Google Scholar] [CrossRef]
  7. Wohlfahrt-Mehrens, M.; Vogler, C.; Garche, J. Aging mechanisms of lithium cathode materials. J. Power Sources 2004, 127, 58–64. [Google Scholar] [CrossRef]
  8. Nowak, S.; Winter, M. Review-Chemical analysis for a better understanding of aging and degradation mechanisms of non-aqueous electrolytes for lithium ion batteries: Method development, application and lessons learned. J. Electrochem. Soc. 2015, 162, A2500–A2508. [Google Scholar] [CrossRef]
  9. Ramadass, P.; Haran, B.; White, R.; Popov, B.N. Mathematical modeling of the capacity fade of Li-ion cells. J. Power Sources 2003, 123, 230–240. [Google Scholar] [CrossRef]
  10. Ramadass, P.; Haran, B.; Gomadam, P.M.; White, R.; Popov, B.N. Development of first principles capacity fade model for Li-ion cells. J. Electrochem. Soc. 2004, 151, A196–A203. [Google Scholar] [CrossRef]
  11. Arora, P.; Doyle, M.; White, R.E. Mathematical modeling of the lithium deposition overcharge reaction in lithium-ion batteries using carbon-based negative electrodes. J. Electrochem. Soc. 1999, 146, 3543–3553. [Google Scholar] [CrossRef]
  12. Ploehn, H.J.; Ramadass, P.; White, R.E. Solvent diffusion model for aging of lithium-ion battery cells. J. Electrochem. Soc. 2004, 151, A456–A462. [Google Scholar] [CrossRef]
  13. Christensen, J.; Newman, J. Effect of anode film resistance on the charge/discharge capacity of a lithium-ion battery. J. Electrochem. Soc. 2003, 150, A1416–A1420. [Google Scholar] [CrossRef]
  14. Christensen, J.; Newman, J. A mathematical model for the lithium-ion negative electrode solid electrolyte interphase. J. Electrochem. Soc. 2004, 151, A1977–A1988. [Google Scholar] [CrossRef]
  15. Ning, G.; Popov, B.N. Cycle life modeling of lithium-ion batteries. J. Electrochem. Soc. 2004, 151, A1584–A1591. [Google Scholar] [CrossRef]
  16. Ning, G.; White, R.E.; Popov, B.N. A generalized cycle life model of rechargeable Li-ion batteries. Electrochim. Acta 2006, 51, 2012–2022. [Google Scholar] [CrossRef]
  17. Santhanagopalan, S.; Guo, Q.; Ramadass, P.; White, R.E. Review of models for predicting the cycling performance of lithium ion batteries. J. Power Sources 2006, 156, 620–628. [Google Scholar] [CrossRef]
  18. Subramanian, V.R.; Boovaragavan, V.; Ramadesigan, V.; Arabandi, M. Mathematical model reformulation for lithium-ion battery simulations: Galvanostatic boundary conditions. J. Electrochem. Soc. 2009, 156, A260–A271. [Google Scholar] [CrossRef]
  19. Safari, M.; Morcrette, M.; Teyssot, A.; Delacourt, C. Multimodal physics-based aging model for life prediction of Li-ion batteries. J. Electrochem. Soc. 2009, 156, A145–A153. [Google Scholar] [CrossRef]
  20. Delacourt, C.; Safari, M. Life simulation of a graphite/LiFePO4 cell under cycling and storage. J. Electrochem. Soc. 2012, 159, A1283–A1291. [Google Scholar] [CrossRef]
  21. Deshpande, R.; Verbrugge, M.; Cheng, Y.; Wang, J.; Liu, P. Battery cycle life prediction with coupled chemical degradation and fatigue mechanics. J. Electrochem. Soc. 2012, 159, A1730–A1738. [Google Scholar] [CrossRef]
  22. Doyle, M.; Fuller, T.F.; Newman, J. Modeling of galvanostatic charge and discharge of the lithium/polymer/insertion cell. J. Electrochem. Soc. 1993, 140, 1526–1533. [Google Scholar] [CrossRef]
  23. Kwon, K.H.; Shin, C.B.; Kang, T.H.; Kim, C. A two-dimensional modeling of a lithium-polymer battery. J. Power Sources 2006, 163, 151–157. [Google Scholar] [CrossRef]
  24. Kim, U.S.; Shin, C.B.; Kim, C. Effect of electrode configuration on the thermal behavior of a lithium-polymer battery. J. Power Sources 2008, 180, 909–916. [Google Scholar] [CrossRef]
  25. Kim, U.S.; Yi, J.; Shin, C.B.; Han, T.; Park, S. Modeling the dependence of the discharge behavior of a lithium-ion battery on the environmental temperature. J. Electrochem. Soc. 2011, 158, A611–A618. [Google Scholar]
  26. Kim, U.S.; Yi, J.; Shin, C.B.; Han, T.; Park, S. Modelling the thermal behaviour of a lithium-ion battery during charge. J. Power Sources 2011, 196, 5115–5121. [Google Scholar] [CrossRef]
  27. Kim, U.S.; Yi, J.; Shin, C.B.; Han, T.; Park, S. Modeling the thermal behaviors of a lithium-ion battery during constant-power discharge and charge operations. J. Electrochem. Soc. 2013, 160, A990–A995. [Google Scholar] [CrossRef]
  28. Yi, J.; Kim, U.S.; Shin, C.B.; Han, T.; Park, S. Modeling the temperature dependence of the discharge behavior of a lithium-ion battery in low environmental temperature. J. Power Sources 2013, 244, 143–148. [Google Scholar] [CrossRef]
  29. Yi, J.; Lee, J.; Shin, C.B.; Han, T.; Park, S. Modeling of the transient behaviors of a lithium-ion battery during dynamic cycling. J. Power Sources 2015, 277, 379–386. [Google Scholar] [CrossRef]
  30. Yi, J.; Koo, B.; Shin, C.B.; Han, T.; Park, S. Modeling the effect of aging on the electrical and thermal behaviors of a lithium-ion battery during constant current charge and discharge cycling. Comput. Chem. Eng. 2017, 99, 31–39. [Google Scholar] [CrossRef]
  31. Koo, B.; Yi, J.; Lee, D.; Shin, C.B.; Han, T.; Park, S. Modeling the effect of fast charge scenario on the cycle life of a lithium-ion battery. J. Electrochem. Soc. 2018, 165, A3674–A3680. [Google Scholar] [CrossRef]
  32. Nagpure, S.C.; Bhushan, B.; Babu, S.S. Multi-scale characterization studies of aged Li-ion large format cells for improved performance: An overview. J. Electrochem. Soc. 2013, 160, A2111–A2154. [Google Scholar] [CrossRef] [Green Version]
  33. Dubarry, M.; Liaw, B.Y. Development of a universal modeling tool for rechargeable lithium batteries. J. Power Sources 2007, 174, 856–860. [Google Scholar] [CrossRef]
  34. Dubarry, M.; Vuillaume, N.; Liaw, B.Y. From single cell model to battery pack simulation for Li-ion batteries. J. Power Sources 2009, 186, 500–507. [Google Scholar] [CrossRef]
  35. Dubarry, M.; Truchot, C.; Liaw, B.Y. Synthesize battery degradation modes via a diagnostic and prognostic model. J. Power Sources 2012, 219, 204–216. [Google Scholar] [CrossRef]
  36. Barai, A.; Uddin, K.; Dubarry, M.; Somerville, L.; McGordon, A.; Jennings, P.; Bloom, I. A comparison of methodologies for the non-invasive characterisation of commercial Li-ion cells. Prog. Energy Combust. Sci. 2019, 72, 1–31. [Google Scholar] [CrossRef]
  37. Pastor-Fernándeza, C.; Yu, T.F.; Widanage, W.D.; Marco, J. Critical review of non-invasive diagnosis techniques for quantification of degradation modes in lithium-ion batteries. Renew. Sustain. Energy Rev. 2019, 109, 138–159. [Google Scholar] [CrossRef]
  38. Cicconi, P.; Postacchini, L.; Pallotta, E.; Monteriù, A.; Prist, M.; Bevilacqua, M.; Germani, M. A life cycle costing of compacted lithium titanium oxide batteries for industrial applications. J. Power Sources 2019, 436, 226837. [Google Scholar] [CrossRef]
  39. Lim, J.; Choi, A.; Kim, H.; Doo, S.W.; Park, Y.; Lee, K.T. In situ electrochemical surface modification for high-voltage LiCoO2 in lithium ion batteries. J. Power Sources 2019, 426, 162–168. [Google Scholar] [CrossRef]
  40. Wegmann, R.; Döge, V.; Sauer, D.U. Assessing the potential of a hybrid battery system to reduce battery aging in an electric vehicle by studying the cycle life of a graphite|NCA high energy and a LTO|metal oxide high power battery cell considering realistic test profiles. Appl. Energy 2018, 226, 197–212. [Google Scholar] [CrossRef]
  41. Hu, M.; Pang, X.; Zhou, Z. Recent progress in high-voltage lithium ion batteries. J. Power Sources 2013, 237, 229–242. [Google Scholar] [CrossRef]
  42. Tiedemann, W.; Newman, J. Current and potential distribution in lead-acid battery plates. In Battery Design and Optimization; Gross, S., Ed.; The Electrochemical Society, Inc.: Pennington, NJ, USA, 1979; pp. 39–49. [Google Scholar]
  43. Newman, J.; Tiedemann, W. Potential and current distribution in electrochemical cells—Interpretation of the half-cell voltage measurements as a function of reference-electrode location. J. Electrochem. Soc. 1993, 140, 1961–1968. [Google Scholar] [CrossRef]
  44. Gu, H. Mathematical analysis of a Zn / NiOOH cell. J. Electrochem. Soc. 1983, 130, 1459–1464. [Google Scholar] [CrossRef]
  45. Deutsch, C.V.; Journel, A.G. GSLIB—Geostatistical Software Library and User’s Guide, 2nd ed.; Oxford University Press: New York, NY, USA, 1998; pp. 63–118. [Google Scholar]
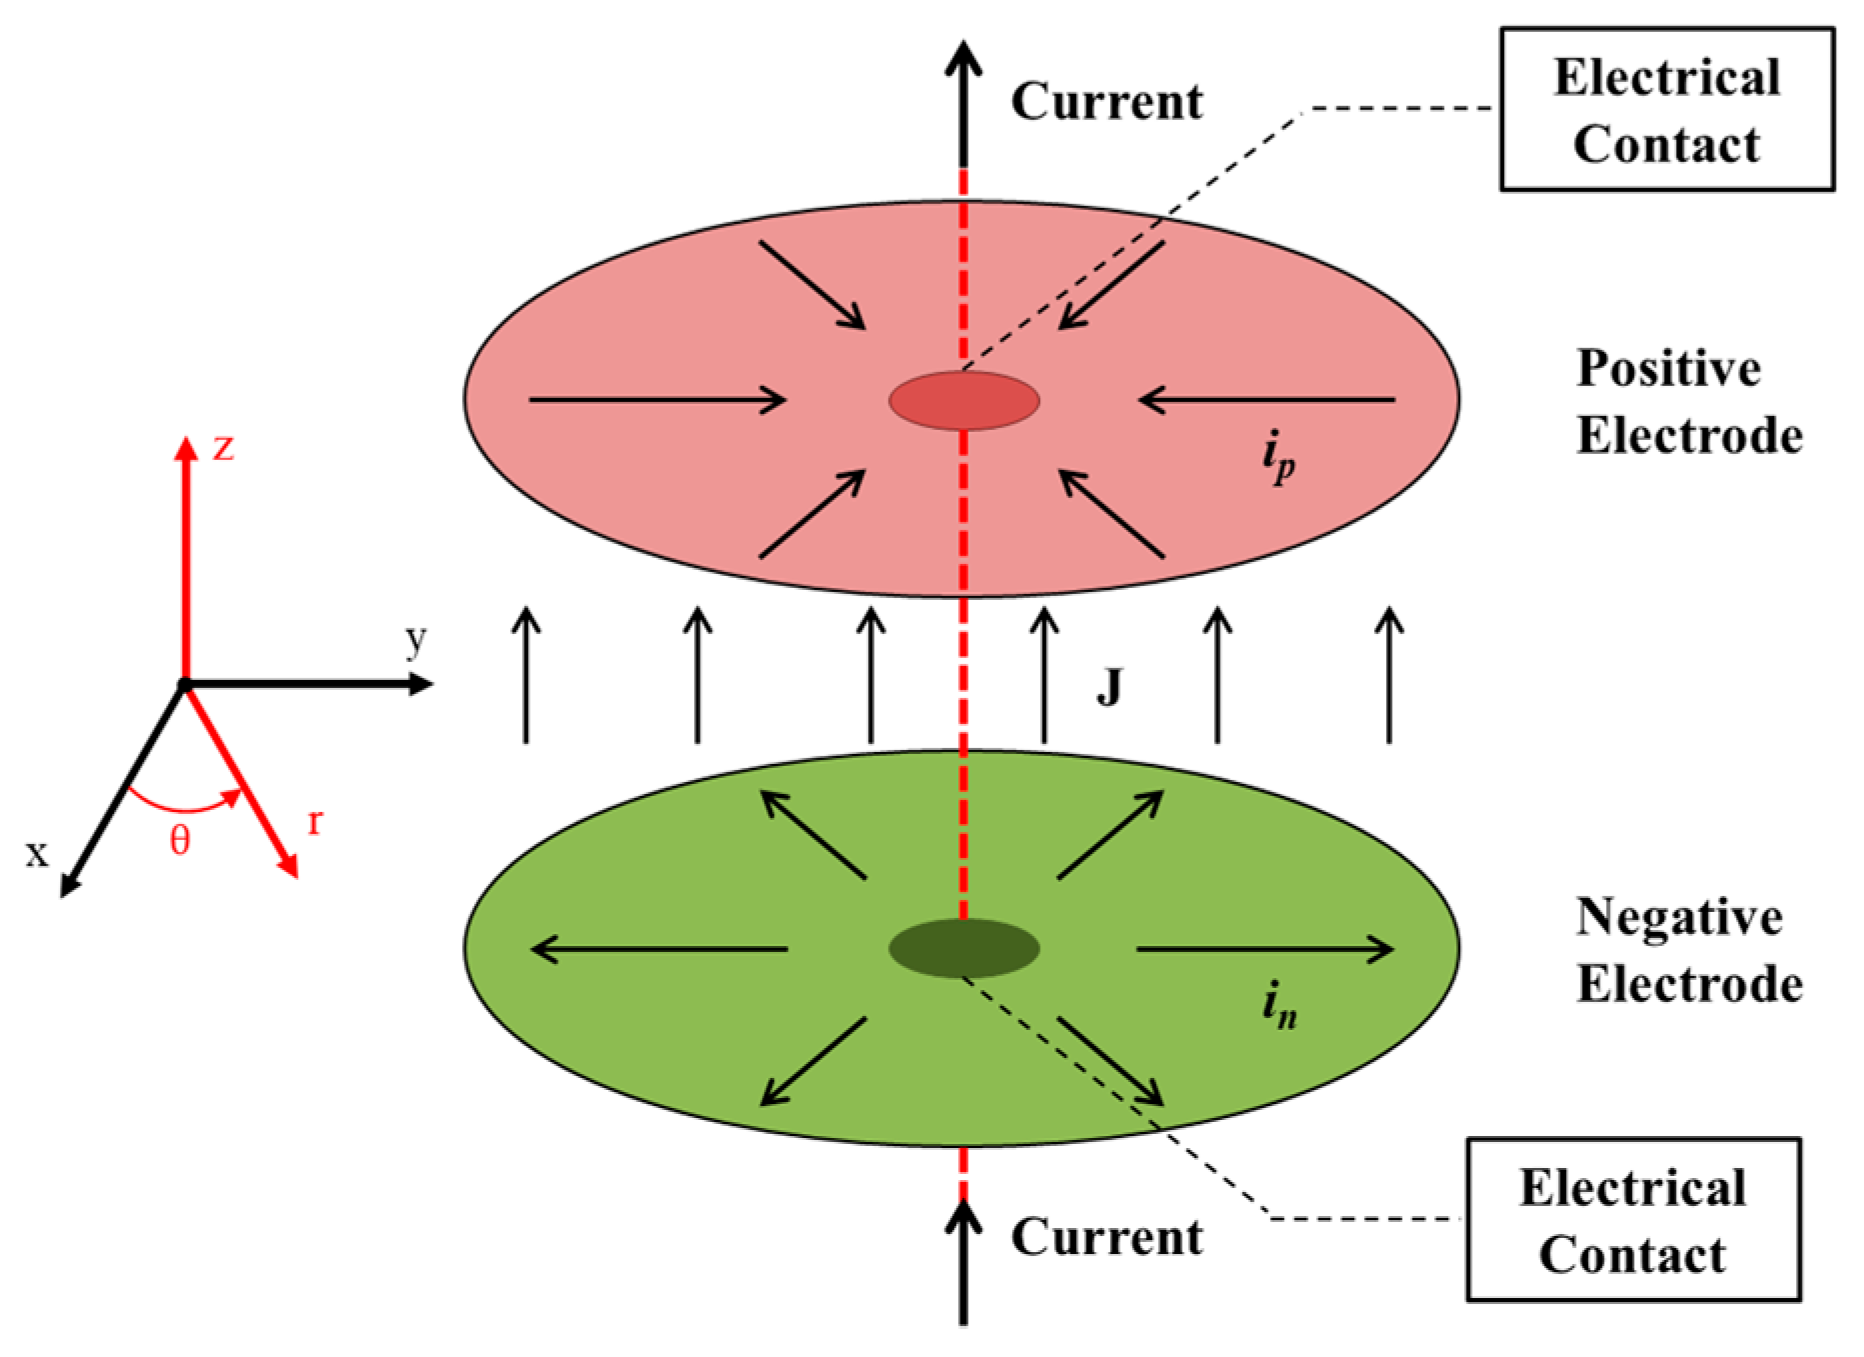
Figure 1. Schematic diagram of the currents in the two parallel circular electrodes during discharge.
Energies 12 04386 g001
Figure 2. Experimental discharge curves of the lithium-ion battery (LIB) cells with three different levels of the loss of cyclable lithium: (a) 0%; (b) 10%; and (c) 20%.
Energies 12 04386 g002
Figure 3. Cell voltage as a function of applied current density during discharge for the LIB cells with three different levels of the loss of cyclable lithium: (a) 0%; (b) 10%; and (c) 20%.
Energies 12 04386 g003
Figure 4. (a) U as a function of state of charge (SOC); and (b) Y as a function of SOC for the LIB cells with three different levels of the loss of cyclable lithium of 0%, 10%, and 20%.
Energies 12 04386 g004
Figure 5. Comparison between experimental and modeling discharge curves with discharge rates ranging from 0.05 C to 1 C for the LIB cells with three different levels of the loss of cyclable lithium: (a) 0%; (b) 10%; and (c) 20%.
Energies 12 04386 g005
Figure 6. Three-dimensional surface plots of (a) U; and (b) Y as functions of SOC and of the loss of cyclable lithium.
Energies 12 04386 g006
Figure 7. Three-dimensional surface plots of the discharge capacities as functions of SOC and of the loss of cyclable lithium. The spheres are the experimental data.
Energies 12 04386 g007
Figure 8. Three-dimensional surface plots of the available discharge power as functions of SOC and of the loss of cyclable lithium for the discharge rates of (a) 0.05 C and (b) 0.5 C. The spheres are the experimental data.
Energies 12 04386 g008