1. Introduction
Over the recent years, increasing problems with ensuring reliable and stable supply of energy in the global aspect may be observed due to rapidly increasing peak electricity demand and hindered development of generating units with sufficient peak capacities. These problems generate growing interest in alternative ways of managing power systems, such as demand side response (DSR), because the electricity suppliers are given a choice between investing in new, costly peak capacities at generation side and using less risky means, related to load management, pay significant attention to using these less radical methods being more environmentally friendly as well. Demand response is a vital component of smart grid technologies. DSR can be properly used only based on smart metering systems ensuring the detailed knowledge of the demand, helping to explain the relationship between DSR and energy prices and demonstrate the flexibility of electricity demand.
An application of demand side response price based programs includes applying various pricing schemes to be chosen by the consumers in the form of electricity tariffs [
1]. An appropriate electricity tariff design requires one to know the price elasticity of electricity demand of the considered consumers, which describes a possible change in the electricity demand as a result of electricity price change or other events, such as price change of different energy carriers, which may act as substitute for electricity, consumer’s change of income, etc. [
2].
That is why price elasticity of demand is a key indicator characterizing electricity market and the consumer acting on this market [
3]. A specific group of consumers are residential consumers, which, in the case of Poland, are settled according to electricity tariffs set by energy supplying companies and distribution system operators (DSOs). These residential consumers, in the Polish conditions, are given a choice between a flat tariff and a time-of-use tariff. In Poland, such consumers generate over 20% of the total electricity demand, 80% of which are settled according to the flat tariff [
4]. Therefore, knowledge of their behavior in the energy market is extremely important, as they create a significant potential for load management. The proper design of low voltage customers’ tariffs analyzed in [
5] can ensure savings for customers from the cost of electricity use and at the same time it may allow electricity providers to balance the demand better with less instability in the system. The problems how to optimize the power purchase portfolio decision of electricity sales companies offering time-of-use tariffs taking into account load uncertainties and electricity prices is dealt with in [
6].
As price elasticity of demand values are used as input data for an electricity tariff design [
7] and determining possible consumers’ reactions for price changes in DSR programs [
1,
8,
9], which are influencing the management of generating capacities at the competitive market [
10], they are vital to be precisely determined. Studies published up to now base the price elasticity of electricity calculation on historic data, i.e., comparing the electricity consumption and prices in corresponding time periods (months, seasons, years). However, the power industry has undergone massive restructuring and numerous merging processes within power companies in previous years in order to implement energy market and to create large entities able to undertake important development tasks. Introduced energy market rules changed the operation conditions of supply companies while the newly created regulation authorities influenced the tariff building process of distribution system operators. All these changes distorted the possibility of using the historic data to determine the precise price elasticity of demand values.
The aim of the presented research is to propose a new method of determining price elasticity of electricity demand, not on the basis of historical data comparison in series of years (as it is presented extensively in the literature), but on the basis of comparison of load profiles of customers settled according to flat and time-of-use tariffs. Thus, a current customers’ response to market conditions is explored. A primary motivation for this research is providing a novel method for determining price elasticity of demand, so that it may be used by electricity suppliers to forecast the consumers’ behavior at the electricity market based on the experience from actually applied time-of-use (TOU) tariffs. The main goals of this paper are as follows: a) Propose an alternative method of determining the price elasticity of electricity demand for residential customers using zonal tariffs, b) determine the annual price elasticity of electricity demand for residential customers using zonal tariffs for the selected distribution area in Poland based on the introduced methodology, c) evaluate the efficiency of zonal tariffs for residential customers changing their load profile.
The article is organized in sections presenting the following issues:
Section 2—literature review,
Section 3—data used and method applied for price elasticity of demand determination, consisting of subsections concerning background information on demand management using electricity tariffs in Poland, source data on customers’ load profiles used for analysis, analysis of changes in load profile, and yearly electricity consumption in result of TOU tariff application, and, finally, the methodology for determining the price elasticity of demand using the comparative load profiles method.
Section 4 presents the results of calculations of annual elasticity values for the analyzed distribution area,
Section 5 presents the proposed efficiency estimation of time-of-use tariffs, and
Section 6 presents the discussion of the obtained results. Finally, a summary of the research is presented in the conclusion section.
2. Literature Review
Methods of determining the price elasticity of demand vary significantly in the literature, depending on applied load model, settlement system of the consumers, econometric estimation methods, and number of other factors taken into account, such as consumers’ income or spending, climate conditions, or household appliances’ energy efficiency.
Variations concerning values of price elasticity of electricity demand provided by different studies are significant and they are influenced by a number of factors specific to a given country, consumers’ group, pricing schemes and regulations, etc. Comparison of the results of price elasticity of electricity demand analyses described in the literature is presented in
Table 1. It acknowledges the variety of the research conducted and the variety of the obtained results of price elasticity of demand at the global level. Both self elasticity values and cross elasticity values concerning other energy carriers or other time zones during the day are considered.
Analyses regarding customer responses using different pricing schemes have already started in the second half of the previous century, beginning with the identification of problems related to determining the price elasticity of demand [
38] and attempts to determine the response of customers using multi-zone tariffs for price changes [
39,
40]. More detailed analyses of electricity demand in multi-zone tariffs, determining price elasticity of demand, were later carried out for time-of-use (TOU) tariffs [
20,
27,
41], for progressive tariffs [
27], for tariffs with a critical peak pricing (CPP) [
36,
42], and for real-time pricing (RTP) tariffs [
36]. In [
43,
44], the customers’ flexibility to price changes in dynamic tariffs was determined empirically, based on real energy consumption measurements, depending on the household appliances used. The interesting method of demand elasticity learning and estimation algorithm is presented in [
45] for future smart energy systems.
Researches on price elasticity of demand also include other, non-economic factors affecting the consumption of electricity. The methodologies proposed in [
27,
46,
47] combine preferences of consumer behavior and energy prices with physical factors, such as external weather conditions or temperature and humidity in a household. In [
48], the most significant drivers for price responsiveness were determined using machine learning techniques. The most meaningful drivers turned out to be the previous electricity consumption, revenues, and number of inhabitants in a household and the possession of specific household appliances, such as dishwashers or water boilers. In [
31], elasticity is determined for various areas of the USA to determine the impact of climatic conditions on electricity consumer’s behavior (self and cross price elasticity), whereas in [
35], price elasticity of demand is needed to create strategies for sustainable energy development.
Source data for price analyses of electricity demand elasticity are often panel data at the household level [
35,
49,
50], that is multi-dimensional data including measurements and observations of various phenomena over time for the same individuals. Basing the analyses on such data sets allows for a very accurate analysis, but the results become very susceptible to regional factors and require very high detail of household data. In the absence of full panel data, some studies create pseudo-panels and base their analyses on a series of independent data [
33,
51]. Another approach to the price elasticity of demand research focuses on aggregate data, which is summary data based on multiple measurements, often made available by energy suppliers [
34,
52]. Research based on aggregate data is characterized by high repeatability. However, some of the relevant household data may be lost in this way.
Part of the reported research assumes that the price elasticity of demand is constant [
53], especially in the long-term perspective [
54]. However, in the latest research, more and more attention is being paid to the fact that the price elasticity of demand is a variable in time feature [
27] and should be determined individually for individual cases. In [
52], the hourly variability of the customer’s responsiveness for price change for the 24-hour period is presented, according to which the greatest elasticity of residential consumers occurs early in the morning and in the afternoon, while the smallest one is around midnight. In [
25], the author also determines the volatility of the real-time price elasticity of the demand values in order to determine the potential for introducing RTP tariffs.
Research on price elasticity of demand also differs in terms of the properties of the considered elasticity. One can distinguish between long-term and short-term elasticity, as well as self and cross elasticity. The research conducted worldwide focuses more often on short-term elasticity, since the determination of long-term elasticity requires much more data [
20]. However, it has been found that short-term elasticity values are much lower than of the long-term elasticity, because in the long term the customer may react to the price increases by, for example, buying more energy-efficient equipment or improving the insulation conditions of the building [
20,
51]. In a short term, the customer may react to a price change only by reducing electricity consumption or shifting this consumption to off-peak periods [
3,
20].
The methods of determining price elasticity of demand also differ in terms of the applied model of energy demand and the customer’s response to price changes. The basic models are the Quadratic Benefit Function [
1,
53] and power, exponential, and logarithmic models [
54], which present the customer’s response to price changes in real time. However, these models have been extended using double logarithmic forms [
19,
20] or log-linear models [
52], making the demand for electricity dependent on its price, the household’s income, and socio-economic factors, such as household size, age, or number of the inhabitants. Furthermore, the energy demand can also be modeled through the Generalised Leontief (GL) system [
37] or using neural networks [
48].
Due to complex load models used in various studies, it is necessary to use sophisticated methods of econometric estimation to determine the price elasticity of demand. In [
17], the OLS (Ordinary Least Squares) method is used, in [
19,
20], the LSDV (Least Squares Dummy Variable) and LSDVC (Least Squares Dummy Variable Corrected) approaches are used, in [
42], the methods of robust statistics (robust regression) is adopted, [
33] proposes two specifications: FE (Fixed Effects) and RE (Random Effects) models, while in [
16] the author confronts the OLS, FE, and LSDVC methods. In addition, the improved AIC (Akaike’s Information Criterion) can be used to find the most appropriate specifications in the load models under consideration [
52]. Furthermore, when using the panel data, it is possible to use the PMG (Pooled Mean Group) method to determine price elasticity of demand [
21]. A different approach to the estimation of results is presented in [
37], where the ITSUR (Iterated Seemingly Unrelated Regression) method is used. An alternative methodology to assess consumer elasticity for price incentives was proposed in [
55], assuming that the average elasticity values are burdened with a very large error, so the probabilistic Quantile Regression (QR) method can be used to model human behavior more appropriately.
3. Data and Methods Used for Price Elasticity of Demand Determination
To reach the aim of the study the data reflecting the conditions of demand side response in one of Polish distribution system operators’ area supplying above two millions of customers was used. Beyond the prices of energy and distribution services in the chosen area in the years 2016 and 2017, crucial were average annual electricity consumptions and the average load profiles with hourly resolution. Details concerning the applied method for price elasticity of demand determination and the data used are presented in the following subsections. The detailed list of symbols used for the method of price elasticity of demand determination is presented in
Table A1 in
Appendix A.
3.1. Demand Side Management Using Zonal Electricity Tariffs
Demand control programs applying zonal tariffs are widely used in Poland. The set of tariffs available to the customer depends on the voltage level to which the customer is connected and the contracted capacity of the customer. DSOs in Poland offer the possibility of settling their services in accordance with the following tariffs:
From flat tariff A21 to four zone tariff A24 for HV (110 kV) connected customers;
From single-zone tariffs B11 and B21 to three-zone tariff B23 for medium voltage connected customers;
From single-zone tariffs C11 and C21 to three-zone tariff C23 for commercial and industrial customers, and from single-zone tariff G11 to three-zone tariff G13 for residential customers connected to low voltage grid. Residential customers’ tariffs considered later are related to as Gxx tariffs in general, where “xx” stands for its digital designation being “11” for flat tariff and “12” for TOU tariff, whichever is appropriate.
The number of price zones in the distribution tariff is determined by the last digit in the tariff symbol and varies between 1 for flat tariffs to a maximum of 4 for TOU tariffs in the case of Poland. The first digit in the tariff symbol (1 or 2) stands for the contracted capacity of the customer and means the customer up to 40 kW of ordered power (number 1) or over 40 kW of ordered power (number 2). The duration periods of individual zones are also approved in the tariffs of DSOs and are generally correlated with peak load periods in winter, and they are shifted to corresponding peak periods in other seasons of the year, but only for customers connected at high and medium voltage levels. Energy suppliers use their own tariffs, which are compatible in terms of duration of time zones with the offer of DSOs for the case of residential customers.
The amount of energy supplied within zonal tariffs accounted for 64% of total electricity consumption in Poland in 2016 and for 65% in 2017 [
56]. These values indicate a significant influence of tariff demand side management on the power system load curve.
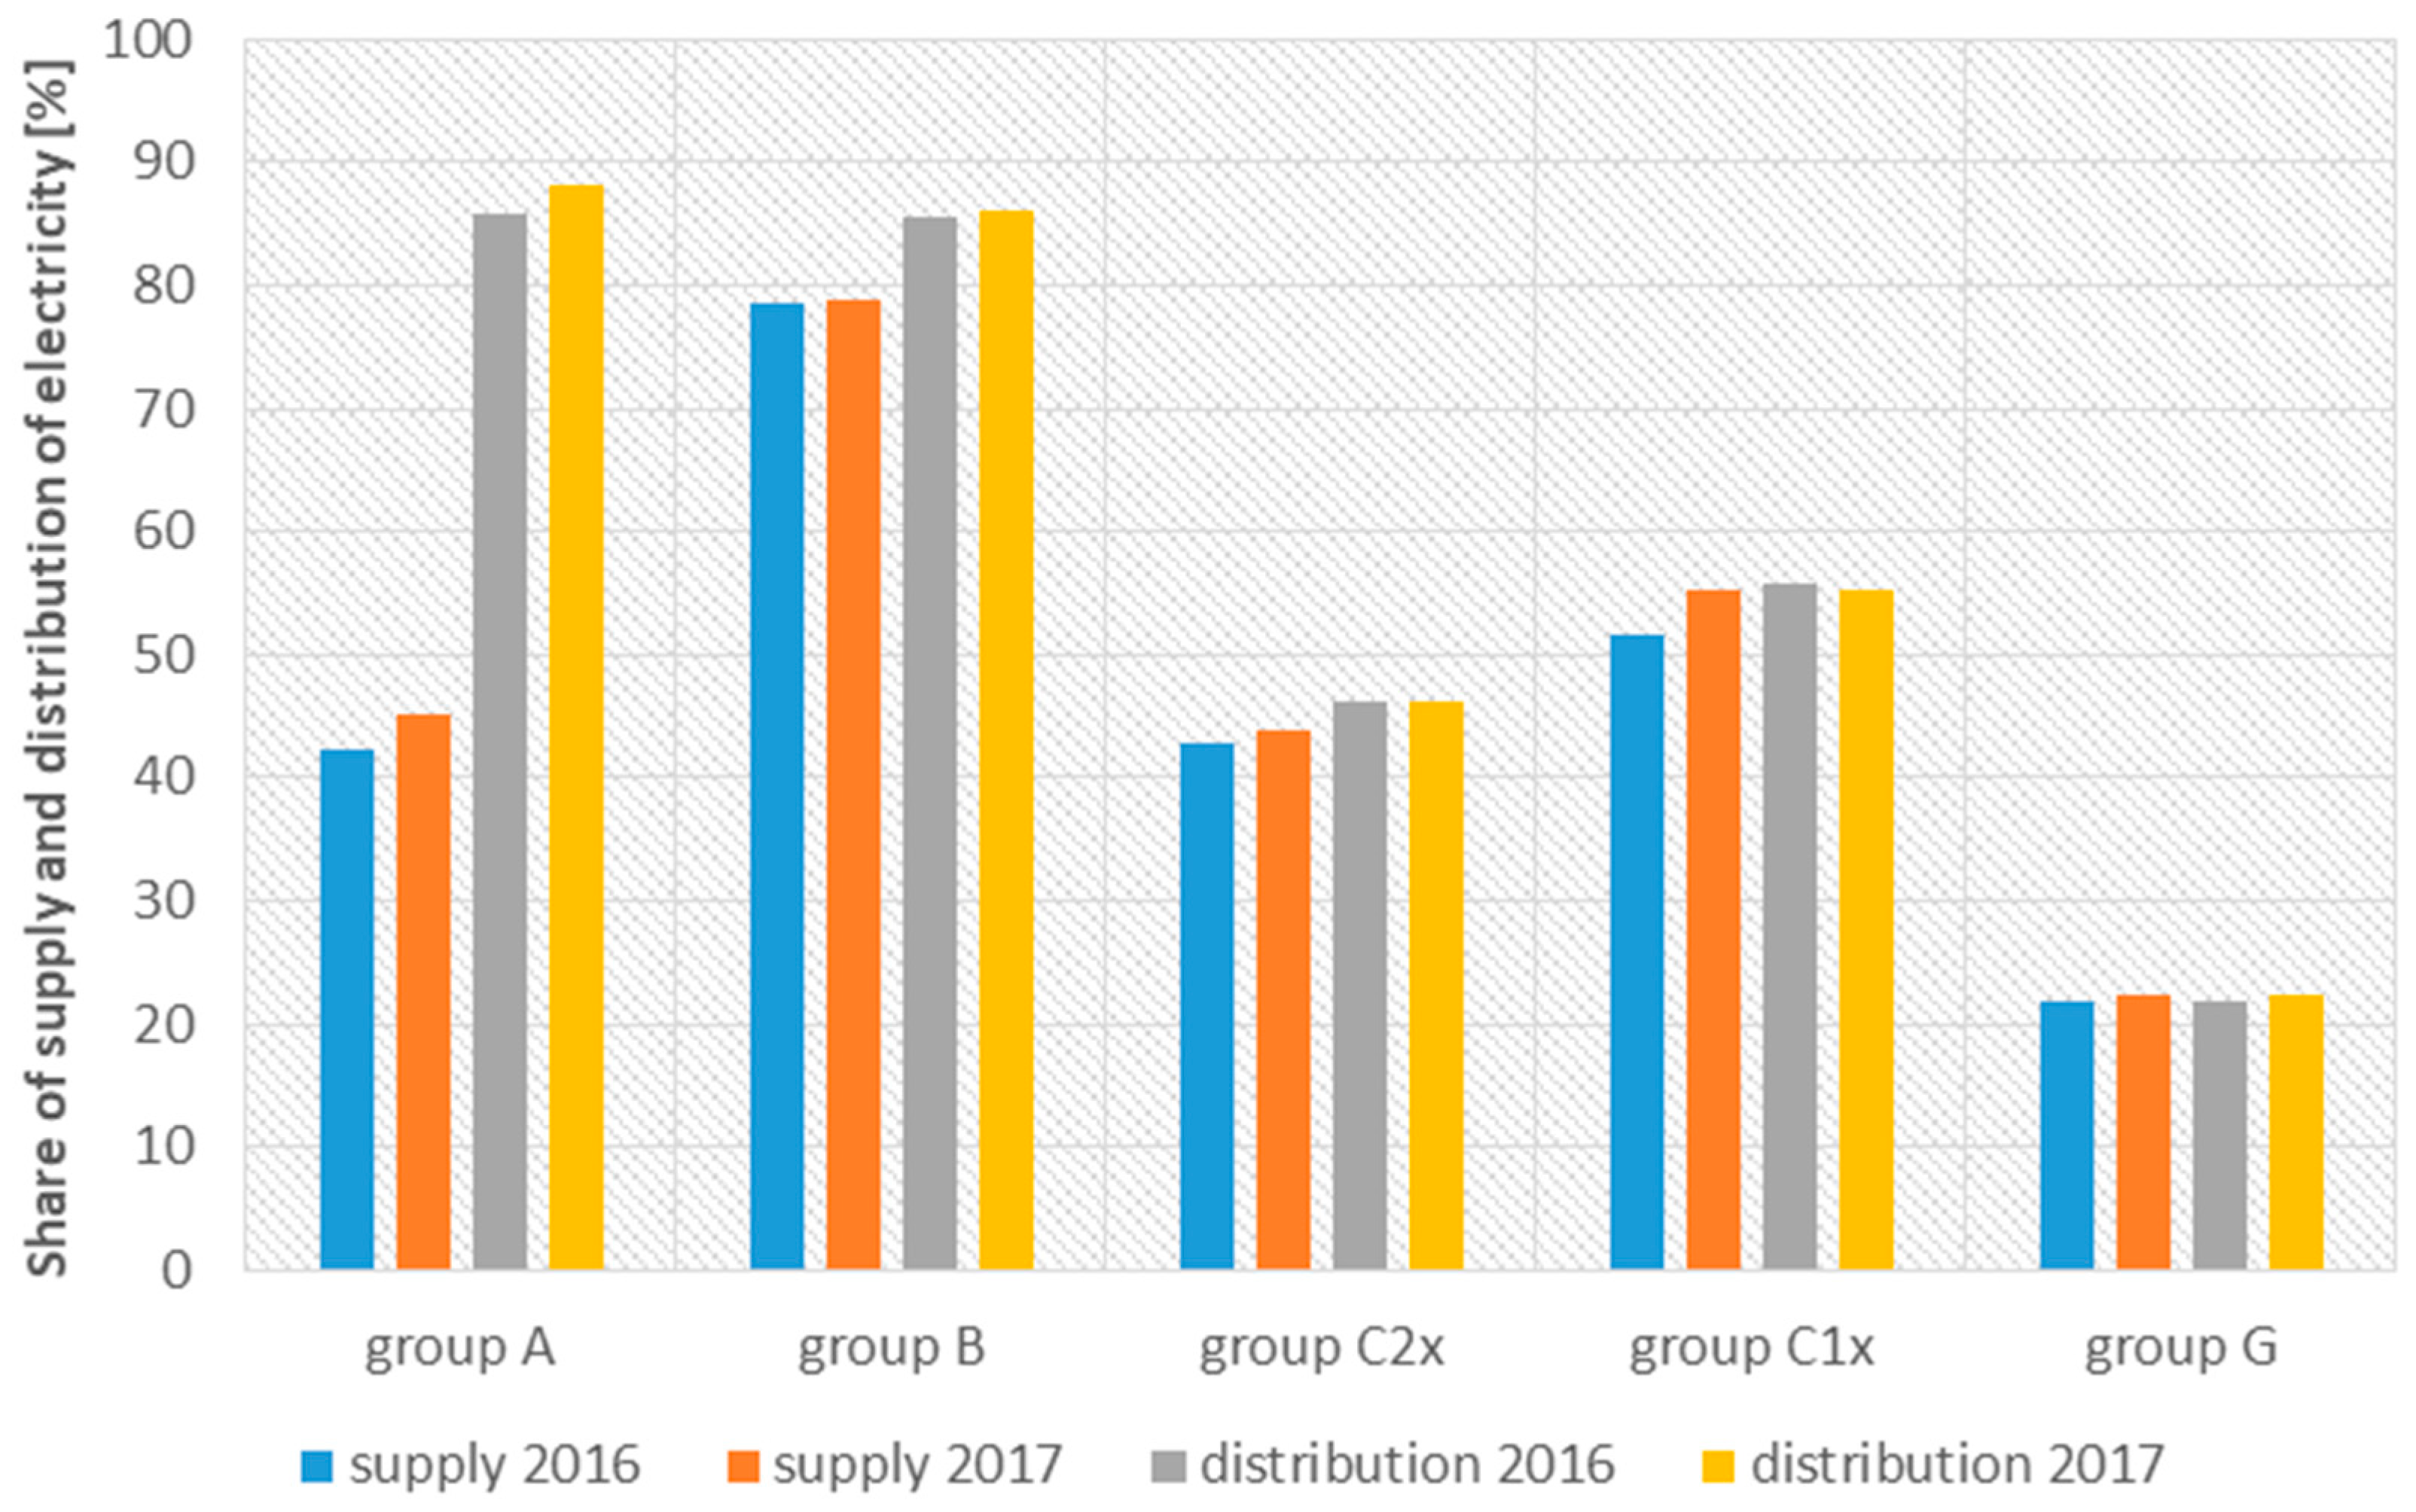
Figure 1 presents a comparison of the percentage share of electricity settlements in zonal tariffs in terms of energy supply and distribution service in Poland for the years 2016 and 2017 [
56]. It can be concluded that zonal settlements dominate at higher voltage levels for tariff groups B and A reaching 85% in distribution agreements. At the low voltage level in supply and distribution service contracts of industrial and commercial customers, this share drops to 45–56%, while at the low voltage level for households it reaches only 21–22%.
The energy consumption in the G tariff group subject to demand management using zonal tariffs reaches over 6000 GWh, which is over 20% of the total energy supplied to this group of customers. The development of smart metering systems creates new opportunities for this group of customers who, knowing their own hourly consumption profiles, can make rational choices regarding participation in the offered tariff demand response programs. On the other hand, energy suppliers and network operators may be interested in designing tariffs for this group of customers, which will allow for limiting the costs of energy supply and decreasing expenditures necessary for technical infrastructure construction enabling such supplies. In order to effectively create such tariffs, it is essential to know the price elasticity of demand of residential consumers using zonal settlement for electricity consumption.
3.2. Load Profiles of Households Using Flat and TOU Tariffs
The introduction of the electricity market resulted in the need to settle purchases of wholesale energy suppliers in hourly periods. Due to the small availability of smart metering systems allowing to obtain such hourly data of consumers’ electricity consumption in households, which is necessary to settle electricity suppliers on the market, hourly consumption levels are determined by applying standard load profiles (
Supplementary Materials) for individual tariff groups. Standard load profiles illustrate the replacement profile characterizing the average consumption profile of a given customers’ group for a given area settled for electricity in accordance with a specific tariff plan and are determined on the basis of measurements of a group of 500 customers settled according to a given tariff in Poland. Profiles have the form of data sets for individual Gxx tariffs, containing the values of relative energy consumption
HGxxi in the
ith hour of the year of a representative customer expressed in relation to its annual consumption
EaGxx.
Standard load profiles are published by DSOs for their operation areas and are an approximation of the electricity consumption profiles of consumer groups settled according to various tariffs. In the future, when the smart metering devices in households become widespread, the load profiles can be obtained by aggregating and averaging the loads of individual customers settled according to the same tariff and they can then be considered as accurate. At present, familiarity with the course of the standard load profiles may form the basis for energy purchases for this group of customers by retailers and for the implementation of demand response programs in order to avoid overloading power system infrastructure components during peak loads and energy purchases during periods of high market prices.
In this paper, standard load profiles for residential customers using flat and TOU tariffs were used as a basis for a practical assessment of the effectiveness of the already implemented demand response tariff programs and for determination of price elasticity of demand of customer groups settled according to their conditions. In the future, the presented method may be used with more accurate profiles collected using data from smart metering systems.
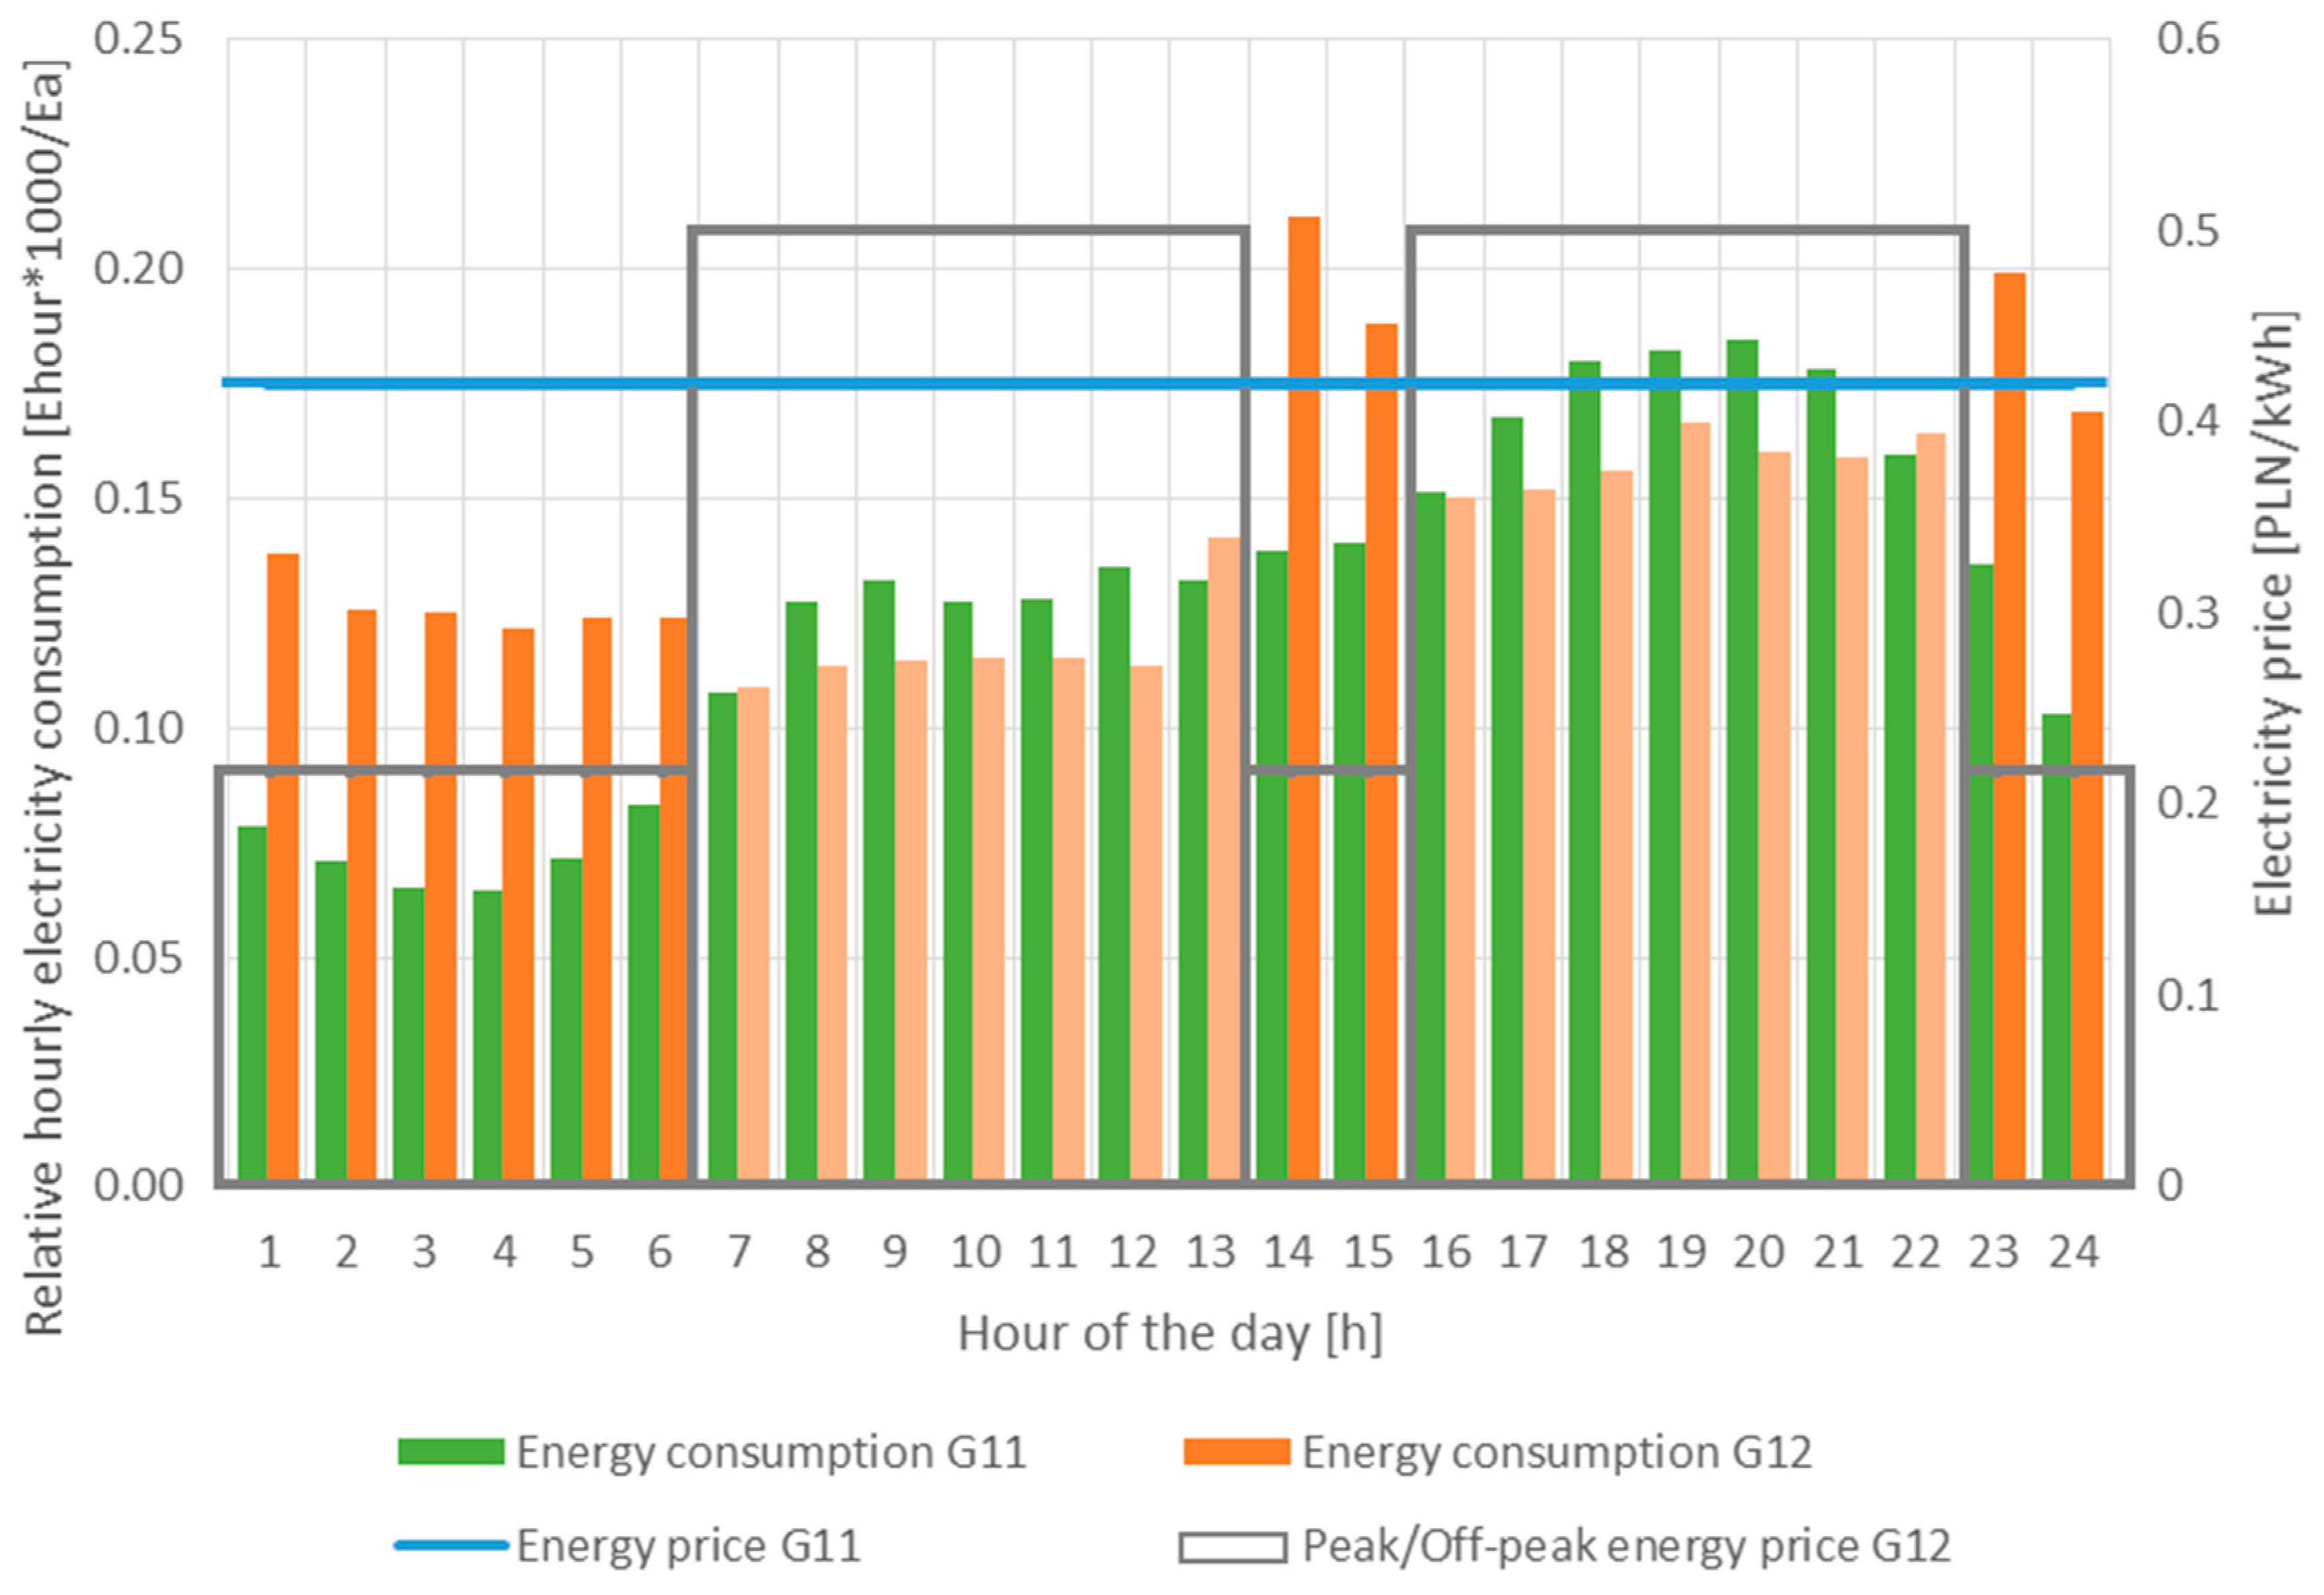
The impact of dual-zone tariff for households on changing the load profile is presented in
Figure 2. Introduction of reduced energy prices and rates of distribution fees in the off-peak zone, covering eight hours in the night from 22:00 to 6:00 and two hours during the day between 13:00 and 15:00, encourages consumers to consider electricity as an energy carrier for space heating purposes. In fact, the customer deciding to settle the electricity supply according to the dual-zone tariff uses the reduction of energy prices due to the use of electricity in the off-peak period. Due to the off-peak period during the afternoon hours, a significant load peak may be observed during the day, which may in some cases correspond with the peak load of the country power system.
3.3. Analysis of Changes in Load Profile and Yearly Consumption in Result of TOU Tariff
The purpose of introducing zonal tariffs is to use the elasticity of the demand of the customers to induce a change in the profile of electricity consumption by customers due to the increase in off-peak sales and its reduction in the peak periods. The price elasticity of demand, binding the change of the settlement price for purchase and supply of energy Δ
P and the following change in energy consumption Δ
E with the assumed initial price
P1 and the initial consumption
E1 is defined by the following equation:
Price elasticity of demand is usually negative and the higher its absolute value is, the more effectively demand can be controlled using the energy price and distribution fees change.
Below, the method of determining the price elasticity of the demand of customers of the dual-zone G12 tariff group will be presented. In order to obtain data for determining the price elasticity of demand for this group of tariff customers in households, standard load profiles for tariff groups G11 and G12 will be used. The introduced procedure for determining elasticity includes two stages:
Determining, based on the analysis of load profiles, the changes in annual energy consumption in tariff price zones when transitioning from G11 to G12 tariff; for this purpose we set, for the G12 customer with the assumed annual consumption of the output energy, the value of energy, which was consumed under G11 tariff before his/her decision to change the tariff;
Determining the average elasticity of the G12 customer for the annual period.
Therefore, the determined elasticity values concern a customer choosing G12 tariff with the intention of increasing the consumption in the off-peak zone in consequence of purchasing energy-consuming appliances to be utilized in that zone, such as electric heaters. The remaining electricity demand stays approximately unchanged with the exception of shifting some appliances to the off-peak to generate savings.
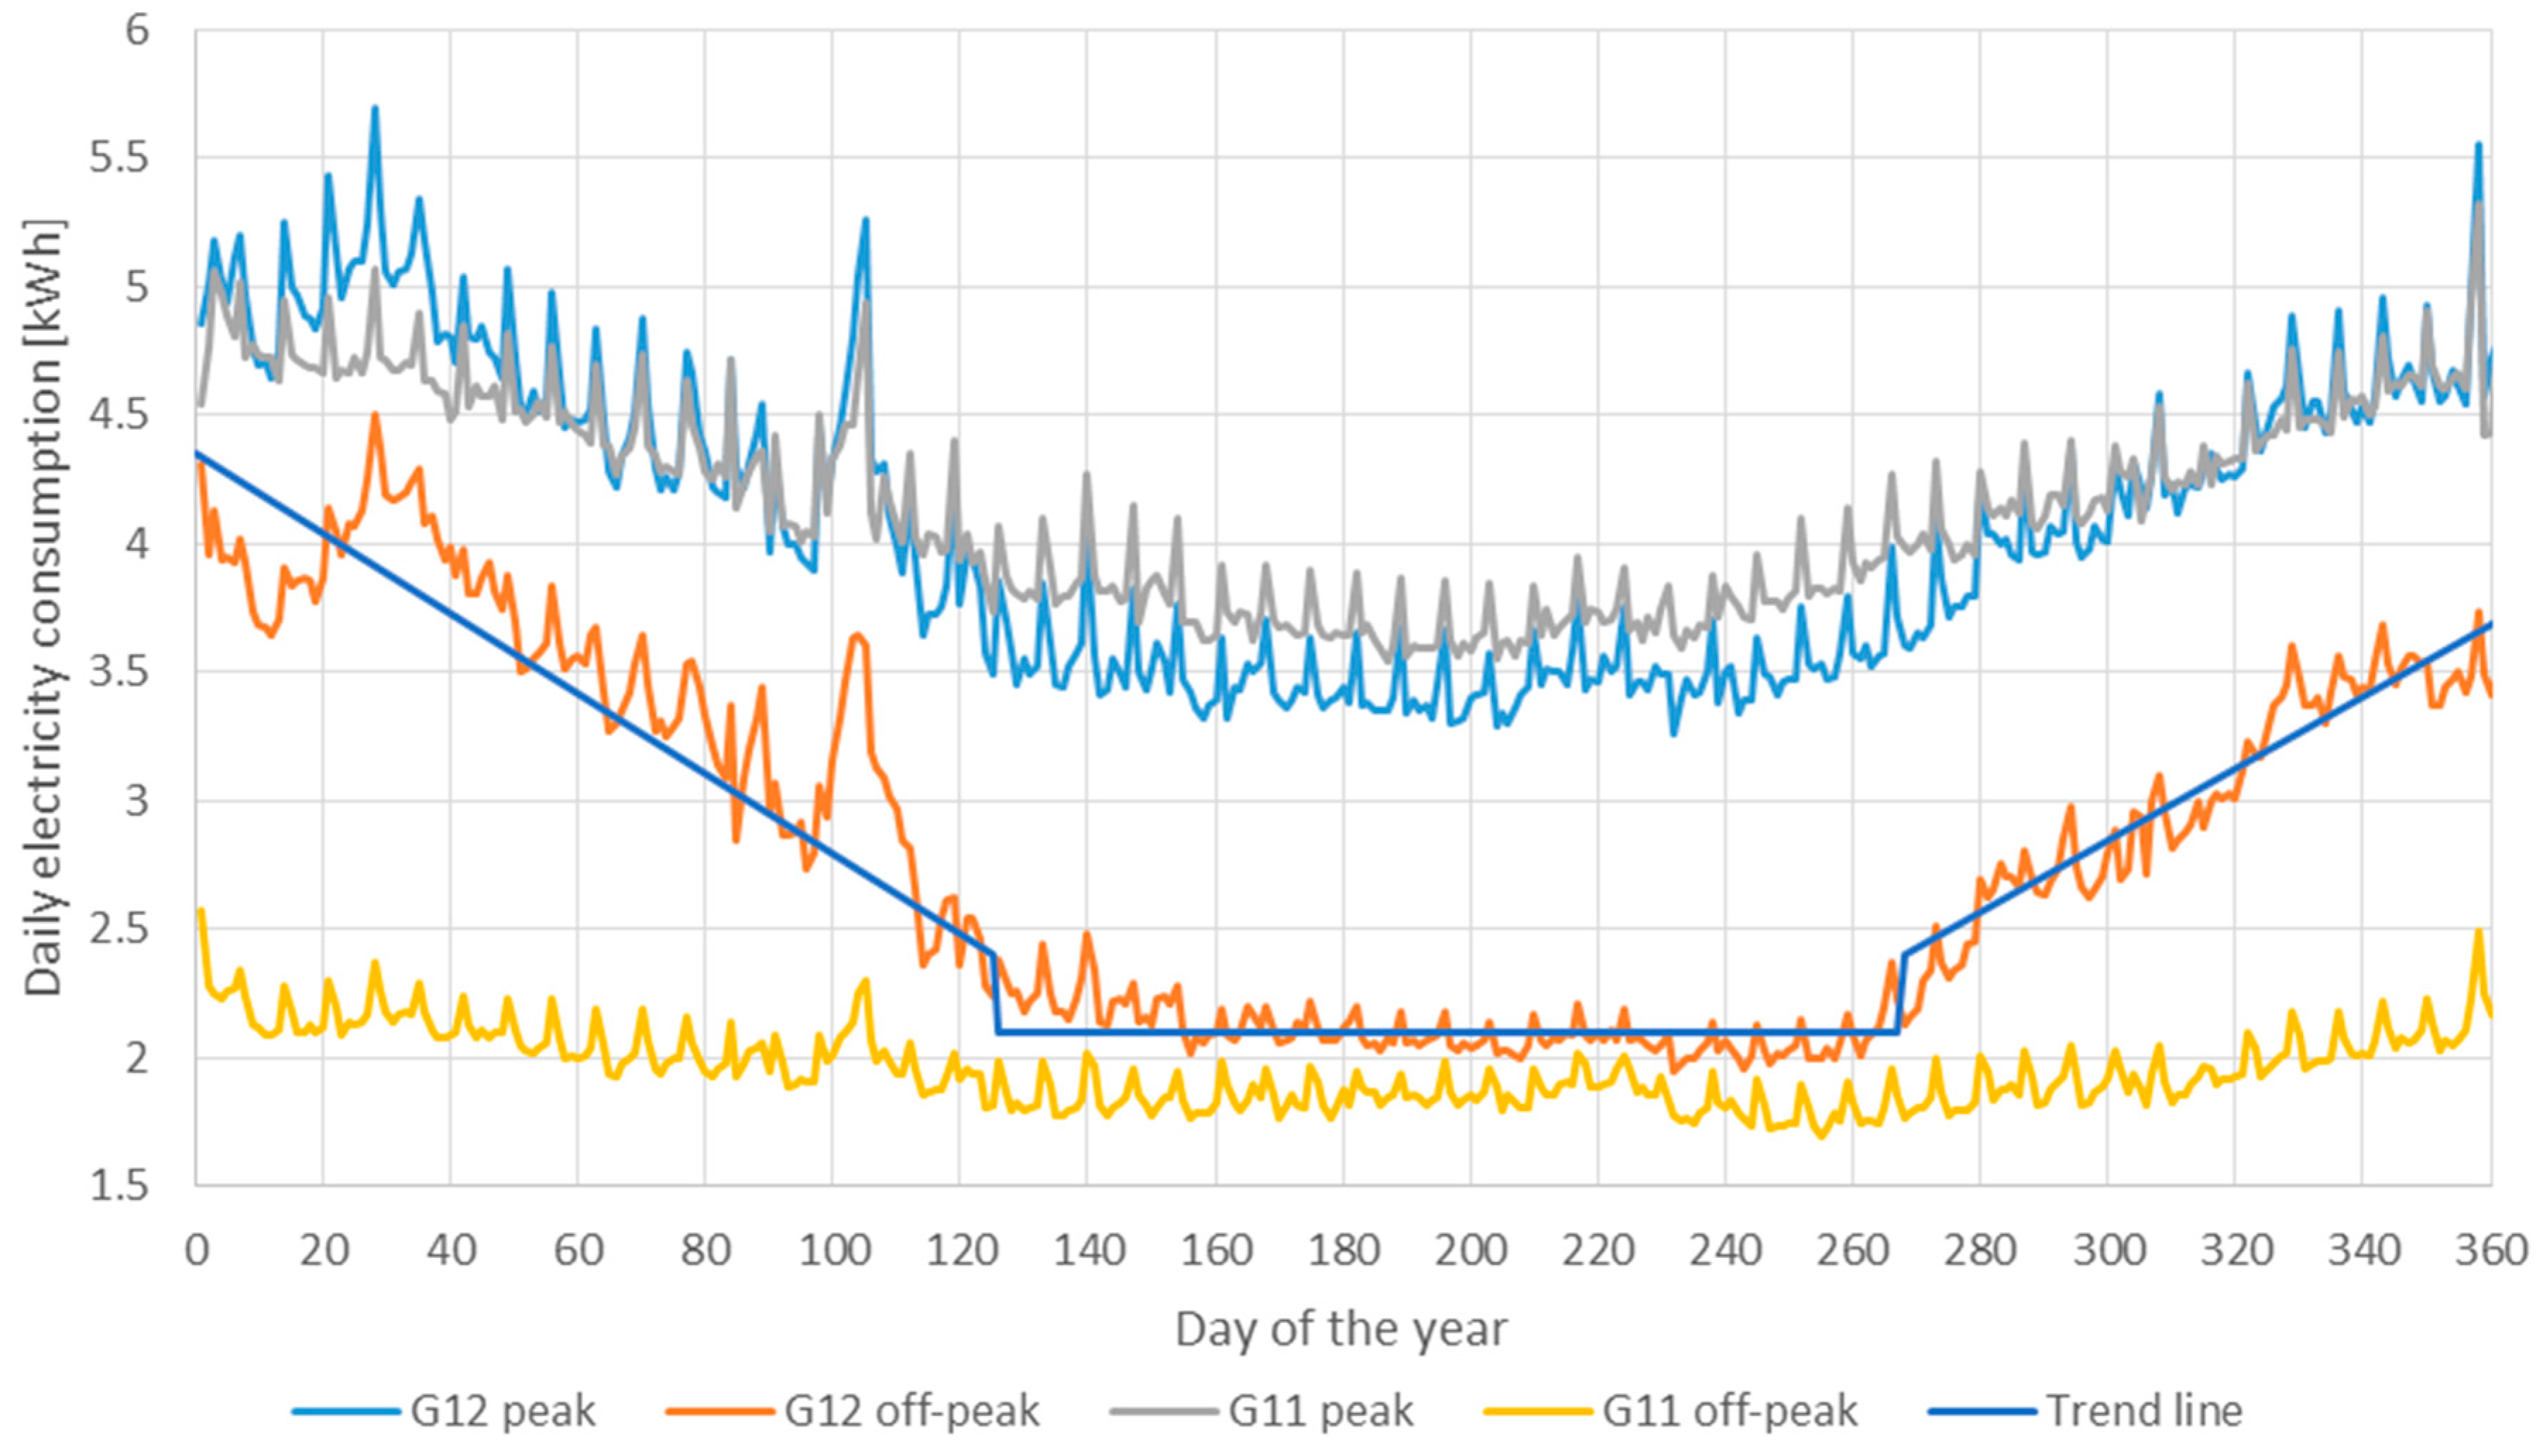
Figure 3 presents levels of daily energy consumption in the course of a year for representative consumers settled for electricity in G11 and G12 tariffs divided into consumption in peak and off-peak settlement periods of the G12 tariff marked in
Figure 2. Energy consumption settled in G11 tariff reflects a natural satisfaction of the customer’s needs within a day. In the case of settlements in the G12 tariff, the consumer tries to shift consumption from peak to off-peak periods in order to obtain lower costs of electricity use. Analysis of the energy consumption ratio of a representative customer settled according to G11 tariff and consumption of a representative customer settled according to G12 tariff in a year allows for determining the impact of prices on the behavior of customers settled according to zonal tariffs expressed by the concept of price elasticity of demand.
On the basis of the presented graphs, it can be stated that the energy consumption is significantly higher in off-peak periods (o) of the G12 zonal tariff customers in relation to the G11 flat tariff customers. In addition, a greater use of energy in peak periods (p) outside the heating season by customers of the G11 group may be observed. During the heating season, an increasing use of energy in the peak period in the G12 profile in relation to the G11 profile is noted for the periods of short winter days in which low outside temperatures are usually encountered. In order to describe these observation quantitatively, the following assumptions were made:
The starting days Ds and the ending days De of the non-heating season are the days designated as points of intersection of the downward trend line of off-peak energy consumption EaG12o in the spring season and the increase in off-peak energy consumption EaG12o in autumn with the average off-peak electricity consumption EaG12o beyond the heating season, which is approximately constant value;
In the non-heating season, the reduction of energy consumption in the peak zone of G12 tariff consumers in relation to consumption of G11 tariff consumers is offset by the increase in G12 consumption in relation to G11 consumers in the off-peak zone—this phenomenon is caused by the transfer of household appliances use by G12 tariff consumers to the off-peak zone and occurs uniformly to the same extent on all days of the year;
The main increase in the load of consumers in the G12 tariff in relation to the G11 tariff is the increase caused by the use of electricity for residential space heating purposes in the off-peak zone during the heating season;
During the heating season in the G12 tariff, a slight increase in energy use for heating purposes may be noted also during the peak period, which offsets to a certain extent the transfer of household appliances usage to the off-peak zone during this period—this is due to the occurrence of cold days and, at the same time, the possible use of already installed easily accessible sources of additional heat using electricity during peak periods of the G12 tariff.
An exemplary analysis of the electricity consumption trend line in the off-peak zone of G12 customers for 2017 profiles allows for setting the beginning of the non-heating season at Ds = 125th day of the year, i.e., 5 May 2017. Analogical analysis for the consumption increase in G12 off-peak period for heating in the autumn–winter period allows to determine the end of the non-heating season at De = 265th day of the year, i.e., 22 September 2017.
The annual energy consumption of the G11 tariff consumer is assumed at
EaG11 level and the consumption of the G12 tariff consumer at
EaG12 level. Based on the analysis of standard load profiles for these tariff groups in the non-heating season, on the example of 2017 shown in
Figure 3, using the assumption (b) presented above, an equation can be formulated to determine the relation of annual
EaG12 consumption of a representative G12 tariff consumer and annual
EaG11 consumption of a representative G11 tariff consumer. The shift in energy consumption of G12 customers in this period is due to their transition from settlements according to G11 tariff to settlements according to G12 tariff and the use of reduced prices in the off-peak zone in the non-heating season for the operation of household appliances, mainly between 13:00 and 15:00. G11 consumers should have greater consumption of electricity in the peak period of the non-heating season differing by the same amount in relation to the consumption of G12 consumers during this period. To fulfill the above-mentioned assumption, the difference between energy consumption in the peak period of G11 tariff (
EaG11p) and G12 tariff (
EaG12p) should be equal to the difference between energy consumption in the off-peak period of G12 (
EaG12o) and G11 tariff (
EaG11o), which may be described with a following Equation (2):
where:
Ds,
De indicate the beginning and the end of the non-heating period,
p means the peak period,
o indicates the off-peak period,
HGxxi means
ith relative hourly energy consumption values for the considered profiles of standard tariff groups Gxx in relation to total annual electricity consumption
EaGxx.
Having performed the mathematical transformations of Equation (2) defined above, the annual energy consumption of a representative G11 tariff consumer before their transition to G12 tariff can be calculated as follows:
Equation (3) allows to determine the mutual relation between annual energy consumption of a representative consumers of considered tariff systems in the result of a decision to change the tariff settlement from one-zone to double-zone tariff, taking into account the load profiles data published by the DSOs. In particular, based on this relation, the annual equivalent energy consumption of G11 consumers with a given level of annual consumption in the G12 tariff may be determined, which reflects changes in the manner and purposes of electricity use of those consumers settled for electricity according to particular tariffs following the load consumptions patterns given by the considered standard load profiles. This mutual relation is graphically shown in
Figure 3 where the consumption level of G12 customer is assumed to be average annual electricity consumption for G12 consumers based on statistical data [
56], the G11 annual consumption level reflects the consumption of considered representative G12 customer before the change of energy use settlement to G12 tariff calculated using Equation (3) while the shapes of electricity consumption profiles for both tariffs are based on the standard load profiles.
The determined annual energy consumption of G11 tariff consumer group EaG11 corresponding to its electricity consumption in the G12 tariff EaG12 after changing its energy settlement from tariff G11 to G12 allows to calculate the average price elasticity of demand significant for energy suppliers in terms of increased consumption in the long term due to average price reduction for the G12 tariff taking into account the energy consumption shift from peak to off-peak periods influencing the final settlement for energy use. The methodology for determining the above-mentioned price elasticity of demand is presented below.
3.4. Average Price Elasticity of Demand Calculation for TOU Customers
The method of establishing the mutual relation of annual electricity consumption of the consumer changing the settlement from G11 to G12 allows also to determine the average daily load shift Δ
Edp→o of household appliances to the off-peak period by the TOU tariff consumers. This value can be calculated based on the difference in energy consumption in the non-heating season in tariffs G12 and G11 for certain annual electricity consumption values
EaG11 and
EaG12, taking into account the number of days of the non-heating season, according to the equation:
It is assumed that G12 tariff customers make such an average shift on each day of the year. Multiplying the value obtained from the Equation (4) by the number of days in the year
Da, a total load shift from the peak zone to the off-peak zone of household appliances Δ
Epdoo, when using the G12 tariff, may be obtained according to the formula:
In order to determine the additional energy consumed by G12 customers for heating purposes in the off-peak period Δ
EoheatG12, the off-peak energy consumption in the corresponding period for the single-zone tariff
EaG11o should be subtracted from the energy consumption in the TOU tariff
EaG12o according to the Equation (6). The value obtained from the subtraction of hourly profiles should be reduced by the increased daily off-peak consumption summed for each day of this season, as a result of shifting part of the household appliances consumption for each day of this season specified by Equation (4). Equation (7) may be used to determine the off-peak annual consumption of G12 and G11 tariff, respectively,
EaG12o and
EaG11o:
Additionally, slight increase in energy consumption observed in peak periods of the heating season in
Figure 3 for G12 tariff customers should be included in the analysis. Presumably, it results from the use of available heating devices on particularly cold winter days. Thus, the additional energy consumption will be determined as the difference in energy consumption in the peak period
EaG12p and the energy consumption in the same period for the flat tariff
EaG11p. The value obtained from the subtraction of hourly profiles should be increased by the reduced daily peak consumption for the G12 tariff summed for the heating season days due to the household appliances induced consumption shift to off-peak zone determined by (4), which leads to the following relationships:
Equation (9) may be used to determine the peak annual consumption of G12 and G11 tariff consumers EaG12p and EaG11p, respectively.
Calculated components of electricity usage that differentiate its consumption between consumers settled in accordance with G12 and G11 tariff allow to determine the annual average price elasticity of demand based on Equation (1). The initial values are energy consumption in G11 tariff equal to
EaG11 and the price of electricity together with its distribution services
PG11, including fixed fees as well. This price may be calculated as follows:
where:
CEG11 is the unit price of energy in flat tariff,
SvarG11 is the variable rate of distribution fee for flat tariff,
Sq is the variable quality rate, uniform for all tariffs, and
OPG11 stands for the sum of fixed fees in the flat tariff. The first three components of the price
PG11 (10) form the variable part
PvG11 of the energy price together with its distribution services.
In the case of a double-zone settlement, the total price depends on the average settlement price
PavG12 for both zones resulting from the amount of energy consumed in particular zones in the considered calculation period and electricity prices with distribution rates applicable in these zones:
where:
CEG12p,
CEG12o are unit energy prices in the double-zone tariff: Peak and off-peak;
SvarG12p,
SvarG12o are the variable rates of peak and off-peak distribution fees for a double-zone tariff;
OPG12 stands for the sum of fixed fees charged in the double-zone tariff;
EaG12p,
EaG12o are energy consumption values during the peak and off-peak periods in the dual-zone tariff,
EaG12 =
EaG12p +
EaG12o. The first two components of the G12 tariff price (11) form the variable part
PvG12 of the energy price together with its distribution services.
The changes in the average price
PavG12 are affected by changes in energy consumption value in particular zones resulting in its increase in the TOU tariff and the energy consumption shift between zones. The increase in energy consumption value after transferring the settlement to the G12 tariff Δ
EG11→G12 can be determined on the basis of the following equation
The shift of household appliances use from the G11 peak zone to the off-peak G12 will not affect the total increase in energy consumption, because such consumption exists in both tariffs.
Finally, the annual price elasticity of demand of G12 tariff consumers
εa av can be determined using the following relationship:
All components of the Equation (13) may be determined by summing hourly energy consumption determined according the standard load profiles for G12 and G11 tariffs, while maintaining the relation of annual energy consumption between G12 and G11 determined in accordance with relationship (3).
Knowledge of the price elasticity of demand is very important due to the anticipated effects of the introduction of zonal tariffs. The change in energy consumption Δ
E as a result of the introduction of the two-zone tariff can be forecasted using the equation derived from the transformation of the Equation (13) to the form:
Based on this relationship, an appropriate price change may be designed to stimulate desirable changes in energy consumption.
4. Calculation Results—Case Study of Average Annual Price Elasticity of Demand for Sample Distribution System Area in Poland
Based on the presented model, a case-study of price elasticity of demand calculation was performed for the residential consumers located in the area of one of Polish DSOs. To determine the average price elasticity of demand for individual years, the following data was used: Load profiles of one of Polish DSOs (Enea Operator Sp. z o.o.) for tariff groups G11 and G12 for the years 2016 [
57] and 2017 [
58], and tariff prices for one of Polish electricity suppliers (Enea S.A.) [
59,
60], as well as rates for distribution services for Enea Operator [
61,
62]. Tariff prices for considered years are presented in
Table 2 for the years 2016 and 2017. The values of the average annual price elasticity of demand were determined based on the aforementioned data and Equations (2)–(13) presented in
Section 4.
The average annual consumption of the G12 consumer for the considered DSO’s operation area is assumed at a level presented in the first row of
Table 3, for the years 2016 and 2017, and it equals 2687 and 2526 kWh/c/a, respectively, based on the data presented in [
56].
For the considered consumption levels, the customer’s total annual payments for the use of electricity depends on a variable rate in the range of 85% to 90% with the greater influence of fixed rate in 2017 rather than in 2016. Higher fixed rate in G12 tariff creates a threshold for the feasibility of entering zonal settlements to be overcome by higher yearly consumptions.
Using the model for price elasticity of demand determination and specifically the Equations (2)–(13), a case study of average annual elasticity values was carried out. The specific calculation results are presented as subsequent calculation steps in
Table 3.
Based on the calculation results, a load balance may be settled for the peak and off-peak TOU G12 tariff consumption. These balances may be formulated as follows, for the peak and off-peak period:
It should be noted that the value of the average annual price elasticity of demand is determined for a given shape of the energy consumption profiles in G11 and G12 tariffs. On the other hand, settlement prices for electricity use in accordance with the aforementioned tariffs are unchanged as to the value of variable components (independent of the amount of energy consumed) and change with the amount of energy consumed as a result of settling the fixed component for different consumption values of annual energy. Thus, unit prices are not constant for customers having different annual energy consumptions, but slightly decrease with increasing energy consumed to a limit equal to the sum of variable rates at very high energy consumption. The simple relationship (13), used to demonstrate the introduced methodology of elasticity calculation, can be transformed into more complex one after substituting cost of energy usage
PG11 and
PavG12 with their formulas containing fixed tariff rates
OPG11 and
OPG12 and variable tariff rates
PvG11,
PvpG12, and
PvoG12 in (13) in order to illustrate their influence on elasticity. The elasticity values thus change along with the change in the consumer’s annual energy consumption according to the following equation:
where the ratio of
EaG12/
EaG11 is possible to be determined from standard load profiles using the Equation (3), whereas the
β constant is introduced only to clarify the calculation process and entails multiplication product of variable overall peak electricity price
PvpG12 and the sum of hourly consumption values for peak period for all days of the year
Da and multiplication product of variable overall off-peak electricity price
PvoG12 and the sum of hourly consumption values for off-peak period for the days
Da:
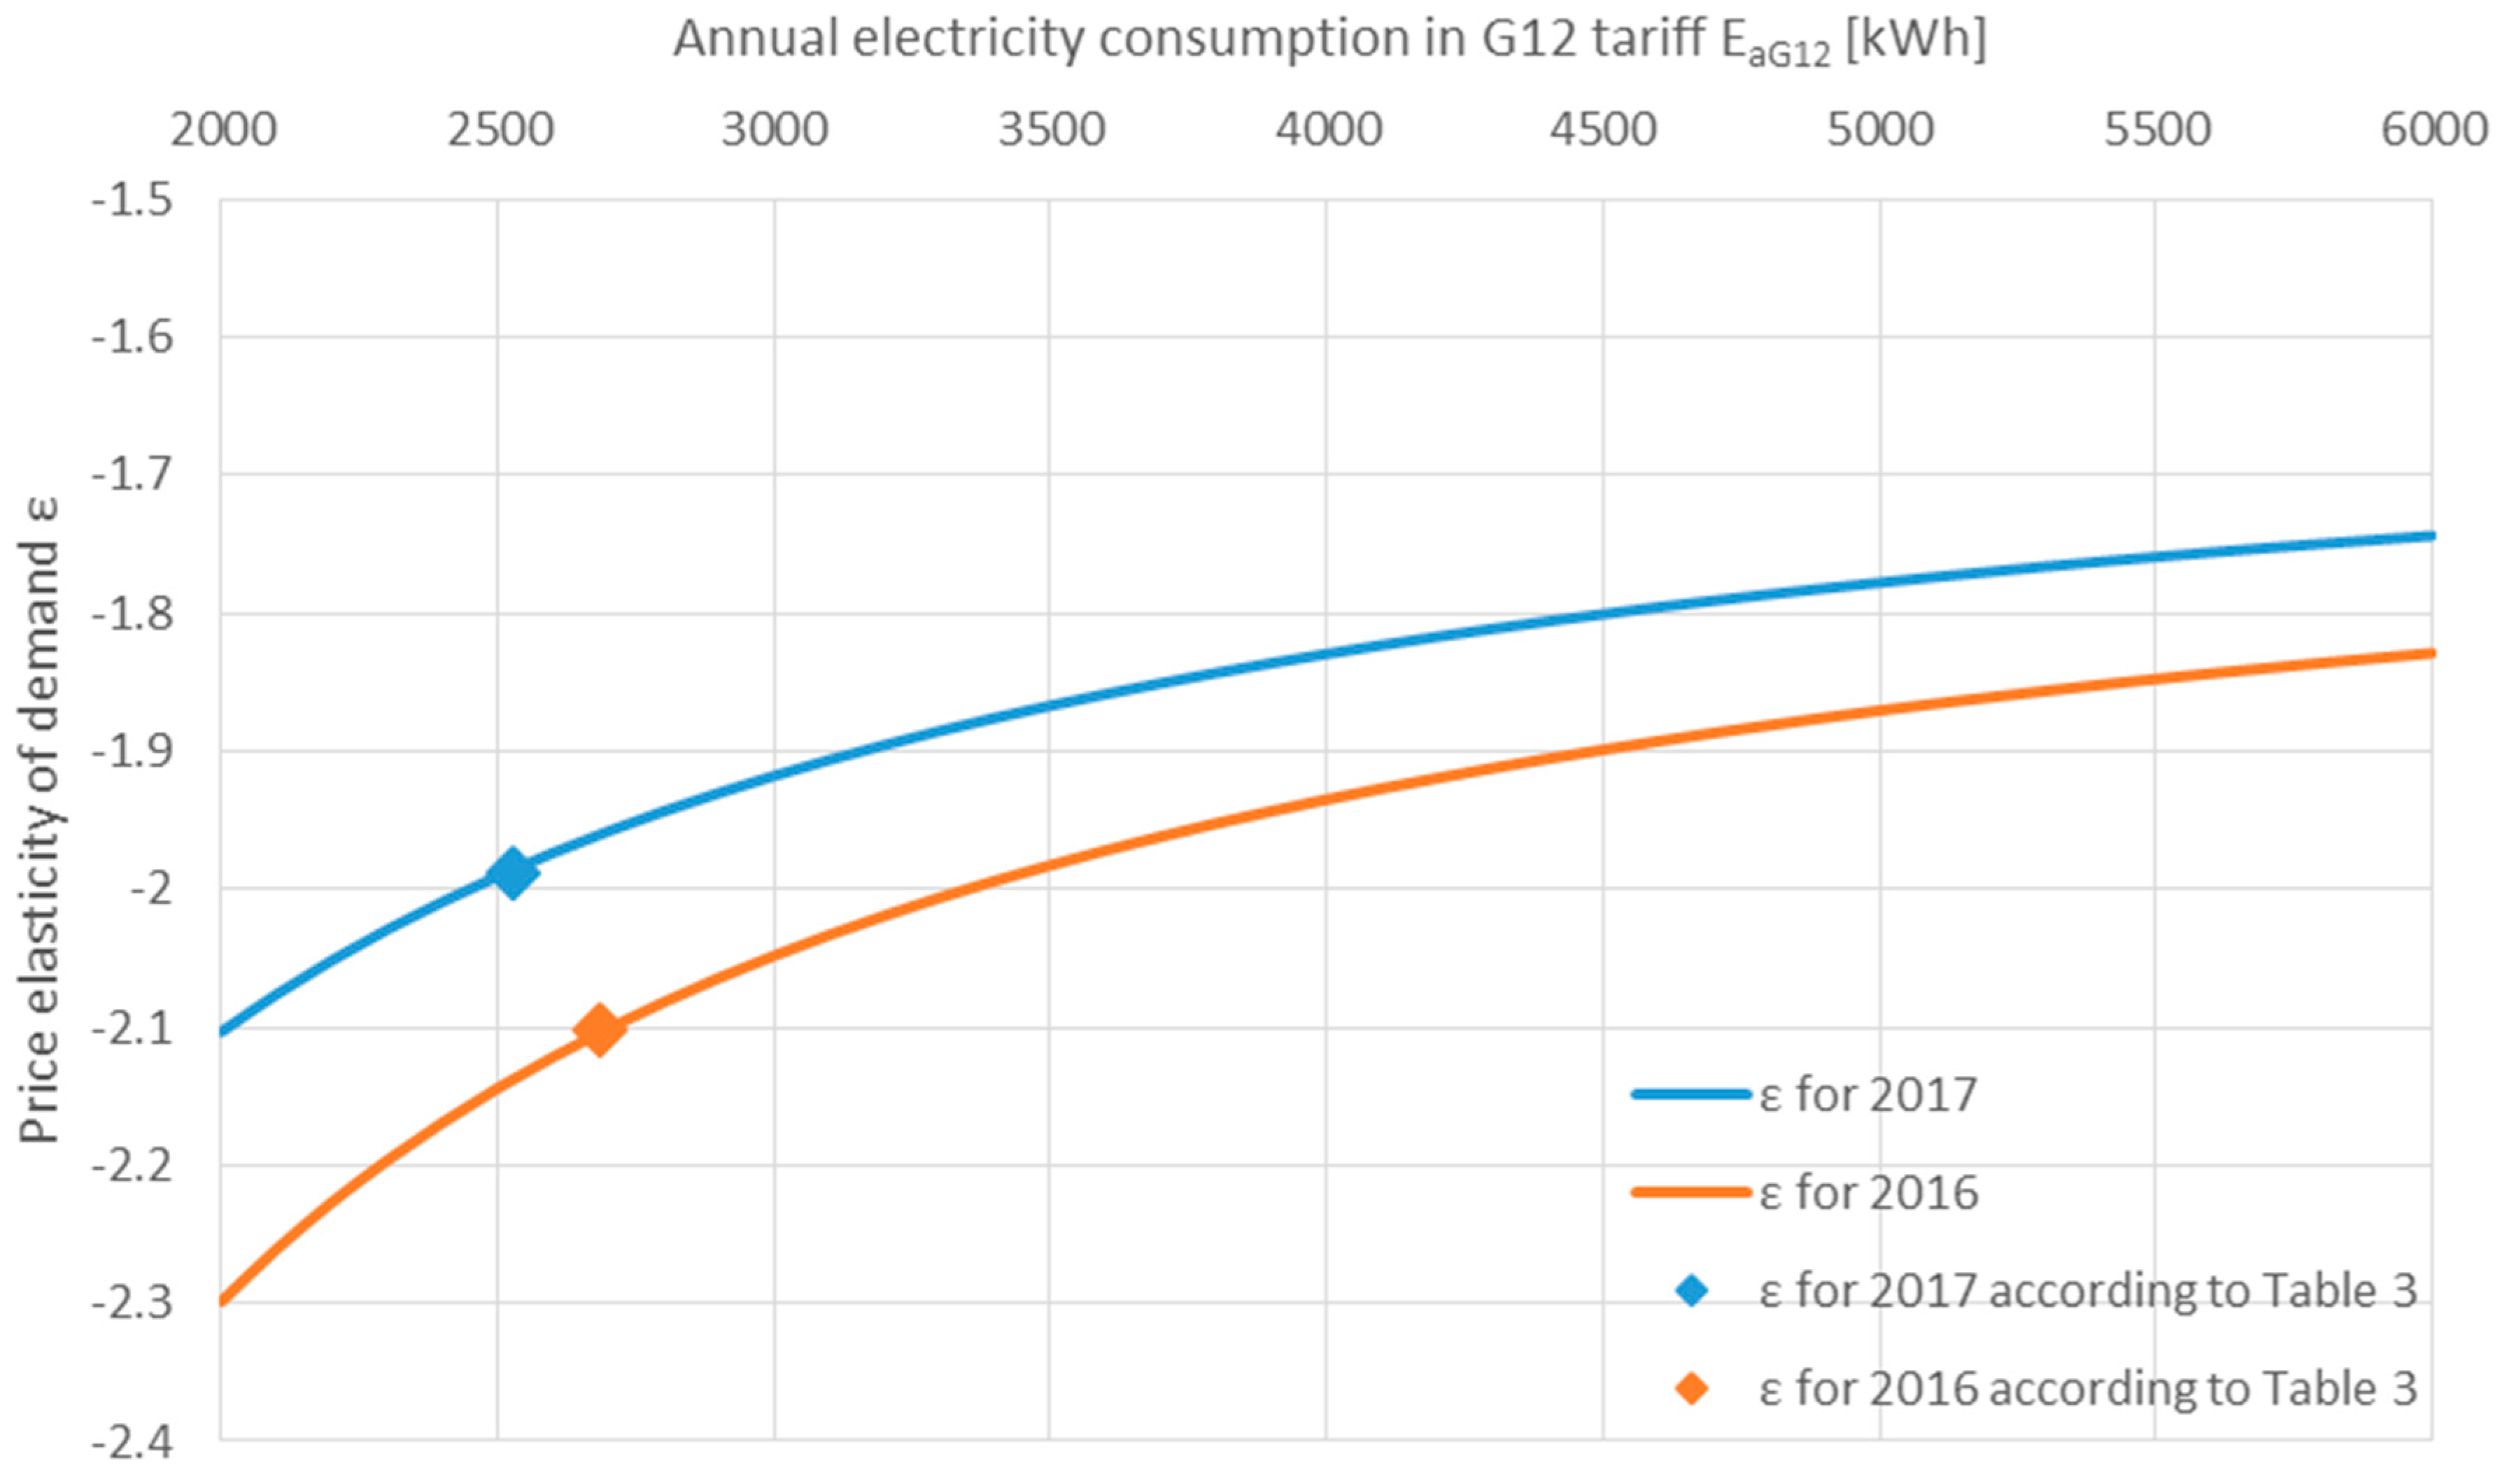
The decrease of unit electricity prices with the increase in energy annual consumption for the adopted, constant in shape, standard load profiles results in the decrease of the average annual value of the price elasticity of demand for the greater annual customer energy use as shown in
Figure 4.
5. Results Concerning Residential Zonal Tariffs’ Efficiency
The main function of zonal tariff is the reduction of energy consumption during the peak zone and the following increase in energy consumption during the off-peak zone. The desired effect can be obtained by shifting energy consumption from the peak prices period to off-peak prices period and by increasing energy use during the off-peak hours. Therefore, the energy efficiency of the zonal tariffs’ operation can be assessed taking into account the desired effects in the form of increases or limitations of energy consumption during G12 tariff zones in relation to energy consumption in corresponding periods in the flat tariff.
The assessment of the annual impact of the G12 tariff composed of two price zones is important especially for energy suppliers and network operators in the aspect of shifting the load from peak periods, when the network devices are overloaded and high energy prices occur in the market, to the load valley, when lower prices and significantly lower loads are encountered. According to the results of the calculations presented in
Table 3, for each zone, the following efficiency coefficients can be proposed:
Energetic efficiency of the peak zone:
Energetic efficiency of the off-peak zone:
Using zonal efficiencies, the suppliers can determine possible savings in energy volumes to be purchased in the peak zone and additional quantities necessary to be acquired in the off-peak zone to cover energy consumption of consumer group settled according to the G12 tariff after the change of settlements from G11 tariff.
Zonal efficiencies defined above allow for the proposition of the annual average energy efficiency calculation of the zonal tariff, using the following Equation (21):
The definition of annual average energy efficiency proposed above, being a function of zonal efficiencies, reflects the correct functionality of the zonal tariff and is the result of the total energy savings made in the peak zone and the increase in consumption in the off-peak zone in relation to energy consumptions in the same periods in G11 tariff.
Zonal efficiencies allow also to determine changes in tariff revenues of energy suppliers and of network operators, as well as in costs incurred by customers as a result of changing the tariff settlement from G11 to G12. Changes in these cash flows can be determined using the prices of energy with its distribution service
PG11 for the G11 tariff given by the Equation (10) and zonal peak and off-peak prices of energy with the distribution service
PG12p and
PG12o for the G12 tariff, which can be as well determined using the Equation (10) by substituting in it the relevant variable charges for each zone from
Table 4 and adding the fixed charges in G12 given in this table divided by
EaG12. The determined values of zonal tariff prices and zonal energy efficiencies allow to calculate the financial cash flow increment of zonal tariff in result of increased customer payments using the following relationship:
The increase in payments by consumers in G12 tariff in relation to the previously used G11, given by the above equation, is usually positive because energy savings in the peak zone may not balance larger energy purchases in the off-peak period, usually consumed for heating purposes.
The best measure of G12 tariff efficiency for the customers may be the average unit cost of using electricity, satisfying their energy need in relation to the equivalent unit cost under G11 tariff. Such indicator, describing electricity price reduction, can be determined using the following relationship:
The energy and financial efficiencies described above resulting from the changing the tariff from G11 to G12 are calculated for the analyzed DSO area using values of the energy consumptions in G11 and G12 tariff given in
Table 3, previously applied to determine the average price elasticity of the demand of the G12 customers, and are presented as percentage values in
Table 4.
The results presented in
Table 4 indicate a much higher efficiency of the zonal tariff operation in the off-peak period compared to the peak period. Average annual energy efficiency, resulting from the average of zonal efficiencies weighted by G11 tariff energy consumptions in the peak and off-peak periods of the G12 tariff, is around 15%.
Financial efficiency reveals the increase in revenues of energy suppliers and network operators resulting from customers switching the tariff from G11 to G12 and its value does not exceed 10%. The considered tariff switching by customers allows them to reduce the electricity settlement price by approximately 6%.
The Equations (21) and (22), which allow to state that the energy efficiencies values of the two-zone tariff, depend only on the mutual relations of parameters of standard load profiles for tariffs G11 and G12 taking into account that the relation between EaG11 and EaG12 is given by relationship (3).
The financial efficiencies, given by relationships (22) and (23), depend on the values of energy prices together with its delivery service, which diminish with the increase of energy consumption as a result of the influence of fixed charges. Therefore, the efficiency depends to a small extent on the ratio of fixed charges and energy consumed under tariffs G12 and G11.
6. Discussion of the Results
The main contribution of the presented study is the new method of determining price elasticity of electricity demand of customers of the dual-zone G12 tariff group. The standard load profiles published by DSOs in Poland for the purpose of hourly settlement of energy suppliers in the wholesale market were used to present the new methodology for determining price elasticity of demand. The key to the analytical determination of price elasticity of the demand of customers using zonal tariffs is the analysis of changes in their energy consumption in individual time zones in flat and TOU tariffs in order to determine the quantitative responses to price signals. In the case of standard load profiles applied to the tariff groups used by households, it was possible to determine the shift of consumption from the peak period to the off-peak period and the consumption changes in both peak and off-peak periods. The quantitative analysis of such changes and their summation in analyzed zones forms the basis for determining the average annual price elasticity of demand of customers using zonal tariffs. The analyzed load profiles indicate that, in winter, contrary to the economic logic, the increases in energy consumption in the peak zone occur as well, as the result of consumers’ behavior forced by the current climatic conditions and easy access to electric heat sources.
The results concerning the customers’ price elasticity of demand values are obtained for representative customers using flat and two-zone tariffs. In the study, only the average consumption and prices differentiation in tariffs’ zones were taken into account, but further studies could be developed on this basis to analyze elasticity values for regional consumers (for instance country or town inhabitants) but adequate data from smart metering systems are necessary to be obtained. Such analysis could be widened on customer groups using specific appliances or heating systems, provided the measurement data from smart metering systems, reflecting the influence of the specific devices comparing to the customers not using them, is available. The average, rather low, level of G12 tariff customer electricity consumption used in the case study, that is 2687 and 2526 kWh/c/a for the years 2016 and 2017, respectively, indicate that they may be equipped with heating systems fuelled by fossil fuels and may be using portable electricity heating devices occasionally during very cold days. Simultaneously, they are trying to increase the savings in the zonal tariff by shifting the appliances’ utilization to off-peak zone. Further differentiations concerning customer elasticity values could be based on their average income, but in such cases additional dedicated customer survey results should be available. It should also be noted that the price elasticity of demand values are not linear in a wide range of price volatility [
10], and the formula (13) is approximately accurate only for small price changes comparing to prices used to determine the average elasticity using standard load profiles for individual tariffs.
Average annual price elasticity of electricity demand values obtained within the study (−2.10 and −1.99 for the years 2016 and 2017, respectively) indicate a very high elasticity of residential customers for price changes. Such high values of price elasticity of demand may only be found in a few other studies [
19,
20,
35], mostly in case of long-term price elasticity of demand. Most of the various, extensive studies, presented in
Table 1, present the price elasticity of electricity demand at a level between 0 and −1, indicating quite low flexibility of household consumers. However, it should be noted that values of price elasticity of demand within the presented study are calculated for the group of customers deciding voluntarily to change their profile of electricity utilization to reach some savings, and that group is responsible for only about 20% of the electricity consumption generated by residential customers in Poland.
In the presented study the influence of fixed distribution rates on price elasticity of demand is also discussed but only in the context of their decreasing importance with the growth of annual energy consumed. Higher fixed rates in G12 tariff create a threshold for the feasibility of entering into zonal settlements to be overcome by higher yearly electricity consumptions. Some tariffs apply significant values of fixed rates to limit their use by customers with lower electricity consumption. The investigation of customers’ elasticities using zonal tariff with various levels of fixed rates and similar energy consumption supplied by different companies could result in fruitful outcomes concerning best strategy of cost allocation into the fixed and variable rates.
Wider application of the proposed methodology can be expected in the future, when more accurate load profiles are available for the presented analyses on the basis of data supplied from smart metering systems, which are going to be more and more commonly used for customer billing.
The new indicators for assessing the efficiency of the tariff’s impact on the customer load profile were also proposed in this paper. The energy indicators, determined for analyzed tariff zones, illustrate the efficiency of the zonal tariff in fulfilling its two functions: The decrease of consumption in the peak zone and energy shifting from peak zone to the off-peak zone, as well as the increase of energy consumption in the off-peak zone. Zonal efficiencies of the G12 tariff are defined to indicate possible profits from electricity consumption, shifting from the peak zone to the off-peak zone, even in the case of zero increase in annual energy consumption, resulting in zero value of customer elasticity, and not only from the simple balance of the increase of energy consumption in the off-peak zone and reduction of energy consumption in the peak zone.
7. Conclusions
Demand side management resources based on tariff systems provide a stable and effective measure to make use of a power system in a more efficient way. Tariff demand management programs play an important role in enabling the transformation of the load profile of electricity consumers as in Poland about 60% of energy is supplied using zonal electricity settlements [
63]. The real impact of tariff programs depends on the universality of their use and on customers’ reactions to the change in the settlement price that is the price for energy supply along with its distribution services. Determining the price elasticity of the demand of customers using zonal tariffs is particularly important for developers of demand management programs, whose aim is to improve the efficiency of the proposed price differentiation within zonal tariff programs. That is the main reason of numerous studies focused on price elasticity determination reported within the literature review in this paper. Common methods of demand price elasticity determination are based on historical data concerning price level development together with their observed influence on electricity consumption level. To explore this influence, some more or less sophisticated mathematical models are used. In the presented method for the given tariff systems, the customer’s decision on tariff system choice and the following changes in his/her electricity utilization are explored. Customers’ load profiles comparison, reflecting the changes in electricity consumption as a result of price offers presented by energy suppliers and DSOs, constitute an interesting basis reflecting the current power supply conditions for determining the price elasticity of the demand of customers responding to these offers.
The goals of this study were reached by presenting the alternative method for determination of the price elasticity of electricity demand for residential customers using zonal tariffs, its application for the selected distribution area in Poland, and evaluation of the efficiency of the zonal tariff investigated. This creates a new tool for organizers of tariff based demand side response programs. It is particularly applicable to customers with rather low electricity consumption, which are usually settled using tariff systems. The presented method allows to improve the tariff system for a group of customers in a steady way, making use of the feedback based on aggregated profiles of their electricity consumption, and thus enabling the corrections in real price elasticity evaluation of customer groups and easing the effect of nonlinearity of its value with the electricity price change. It would be beneficial to develop such a system in the future. As price elasticity of demand is considered nonlinear with changing prices, the possibility to perform an ongoing determination of elasticity value of the customer group being settled according to a considered tariff, resulting in the possibility to introduce some improvements in its efficiency, is the new prospective for supply companies and network operators.
The proposed efficiency indicators can be used as well by regulatory authorities responsible for the approval of electricity tariffs, considering the supply and distribution companies business’ feasibility and customers’ possibilities to participate in power system efficient utilization with the prospective remuneration for undertaking the effort to change their electricity consumption profile. Zonal tariffs’ financial efficiencies reflect the win-win operation of the analyzed zonal tariff demand management program, resulting in the increase in the program organizers’ revenues, i.e., increases in energy and distribution services sales, as well as lowering the average price for satisfying the electricity needs of the customers.
The presented new approach towards elasticity determination should be analyzed in further case studies verifying its usefulness in the proper design of electricity tariffs. The progress in implementation of smart metering systems, being the source of real customer consumption profiles, and their aggregates following the same electricity utilization pattern, create the base for the introduced methodology exploration and more precise control of the effects of tariff demand side response programs implemented. Using the determined elasticity values of their customers settled according to TOU tariffs based on the presented methodology, electricity suppliers, and distribution system operators may easily, quantitatively, estimate the influence of TOU customers on the power system.


