Article

Effect of Mixed-Flow Fans with a Newly Shaped Diffuser on Heat Stress of Dairy Cows Based on CFD

1
College of Water Resources and Civil Engineering, China Agricultural University, Beijing 100083, China
2
Beijing Engineering Research Center of Safety and Energy Saving Technology for Water Supply Network System, Beijing 100083, China
3
Key Laboratory of Agricultural Engineering of Agricultural and Rural Facilities, Beijing 100083, China
*
Author to whom correspondence should be addressed.
Energies 2019, 12(22), 4315; https://doi.org/10.3390/en12224315
Submission received: 16 October 2019 / Revised: 7 November 2019 / Accepted: 8 November 2019 / Published: 12 November 2019
(This article belongs to the Special Issue Large-Eddy Simulations of Turbulent Flows)

Abstract

:
Mixed-flow fans (MFF) are widely used to reduce the heat stress in dairy cows in summer. Our research team developed MFFs with a newly shaped diffuser with the length of 250 mm and the circumferential angle of 150°, which have better performance in terms of maximum flow flux and energy efficiency. However, how the elevation angle of the diffuser influences the performance of MFFs and how the optimal fan perform in the field experiment has not been studied yet. In this paper, the diffuser was optimized by CFD (Computational Fluid Dynamics) simulation of the fan and a laboratory prototype test. An orthogonal test showed no interaction among length, circumferential angle, and elevation angle. The diffuser with an elevation angle of 10° performed better than that with an elevation angle of 0°, showing increased jet lengths, flow flux, and energy efficiency by 0.5 m, 0.69%, and 1.39%, respectively, and attaining greater axial wind speeds and better non-uniformity coefficients at the dairy cattle height. Then, through on-site controlled trials, we found that the 10°/150°/250 mm diffusers increased the overall average wind speeds by 9.4% with respect to the MFFs without a diffuser. MFFs with the newly shaped diffuser were used for field tests, and their effectiveness in alleviating heat stress in dairy cows was evaluated by testing environmental parameters and dairy cows’ physiological indicators. Although the temperature–humidity indexes (THIs) in the experimental barn with the optimized fan at different times were lower than those in the controlled barn, the environmental conditions corresponded to moderate heat stress. However, this was not consistent with cow’s respiratory rate and rectal temperature. Finally, on the basis of the CFD simulation of a dairy cow barn, the equivalent temperature of cattle (ETIC), which takes into account the effect of air velocity, showed that the environment caused moderate heat stress only at 13:00, but not at other times of the day. This shows that ETIC is more accurate to evaluate heat stress.

Graphical Abstract

1. Introduction

In summer, the high air temperature in open cowsheds causes significant heat stress in dairy cows, which results in decreased milk production and increased reproductive problems [1,2,3]. Heat stress causes significant economic losses [4], and mitigation of heat stress is an urgent need.
Mixed-flow fans (MFFs) are commonly installed inside naturally ventilated dairy barns to provide sufficient airflow to cool the animals in high-temperature environment [5]. Ventilation combined with evaporative cooling is often used to mitigate the effects of heat stress [6]. Gebremedhin et al. [7] indicated that evaporation is the dominant form of heat transfer for dairy cows in stressful hot environments, and the evaporative heat transfer effect is proportional to wind speed. Therefore, improving the air velocity by MFFs in open cowsheds can increase heat dissipation and relieve heat stress in dairy cows.
Installing a diffuser in a fan is an effective means to optimize the aerodynamic performance of the fan [8,9,10]. In recent research on agricultural fans, it has been found that MFFs with a newly shaped diffuser have better performance than regular MFFs, with higher flow flux and energy efficiency because of the transformation of dynamic pressure into static pressure [11]. Considering a diffuser with a 150° angle and 250 mm of length, the angle between the diffuser and the fan frame was optimized in this paper using CFD (Computational Fluid Dynamics) simulation and laboratory testing. Then, the effect of heat stress relief was verified in a field test by monitoring environmental indicators of the dairy house and physiological indicators of dairy cattle.
The temperature–humidity index (THI) is one of the most widely used thermal indices [12], which is easy to measure but does not take into account the effect of air velocity [13,14]. Xiaoshuai Wang [15] developed a thermal index named equivalent temperature index for cattle (ETIC) which is derived from equivalent air temperature with respect to relative humidity, air velocity, and solar radiation. In this paper, considering the air velocity in the barn was improved by the optimized MFF, ETIC was used to assess the level of heat stress in cattle based on CFD simulation.

2. Methods

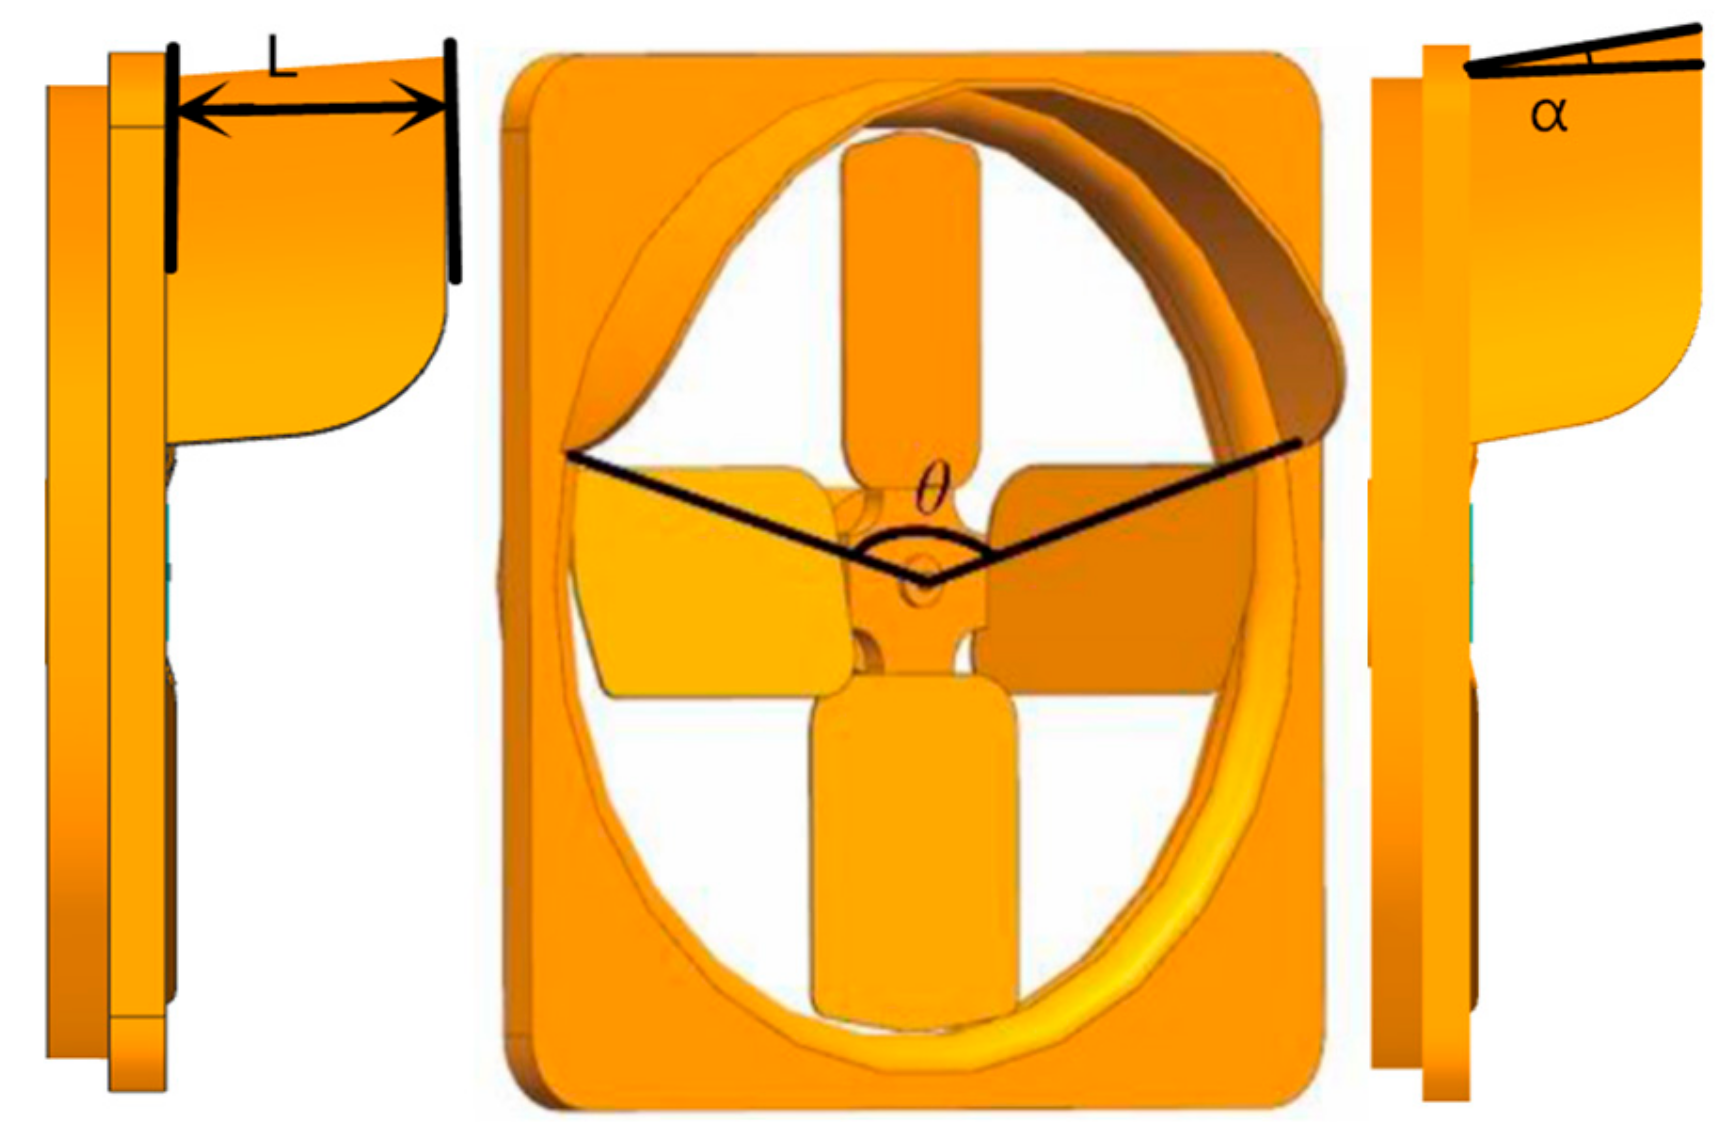
2.1. Optimization of the Geometric Parameters of the Diffuser
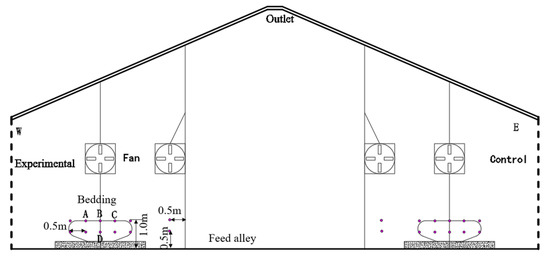
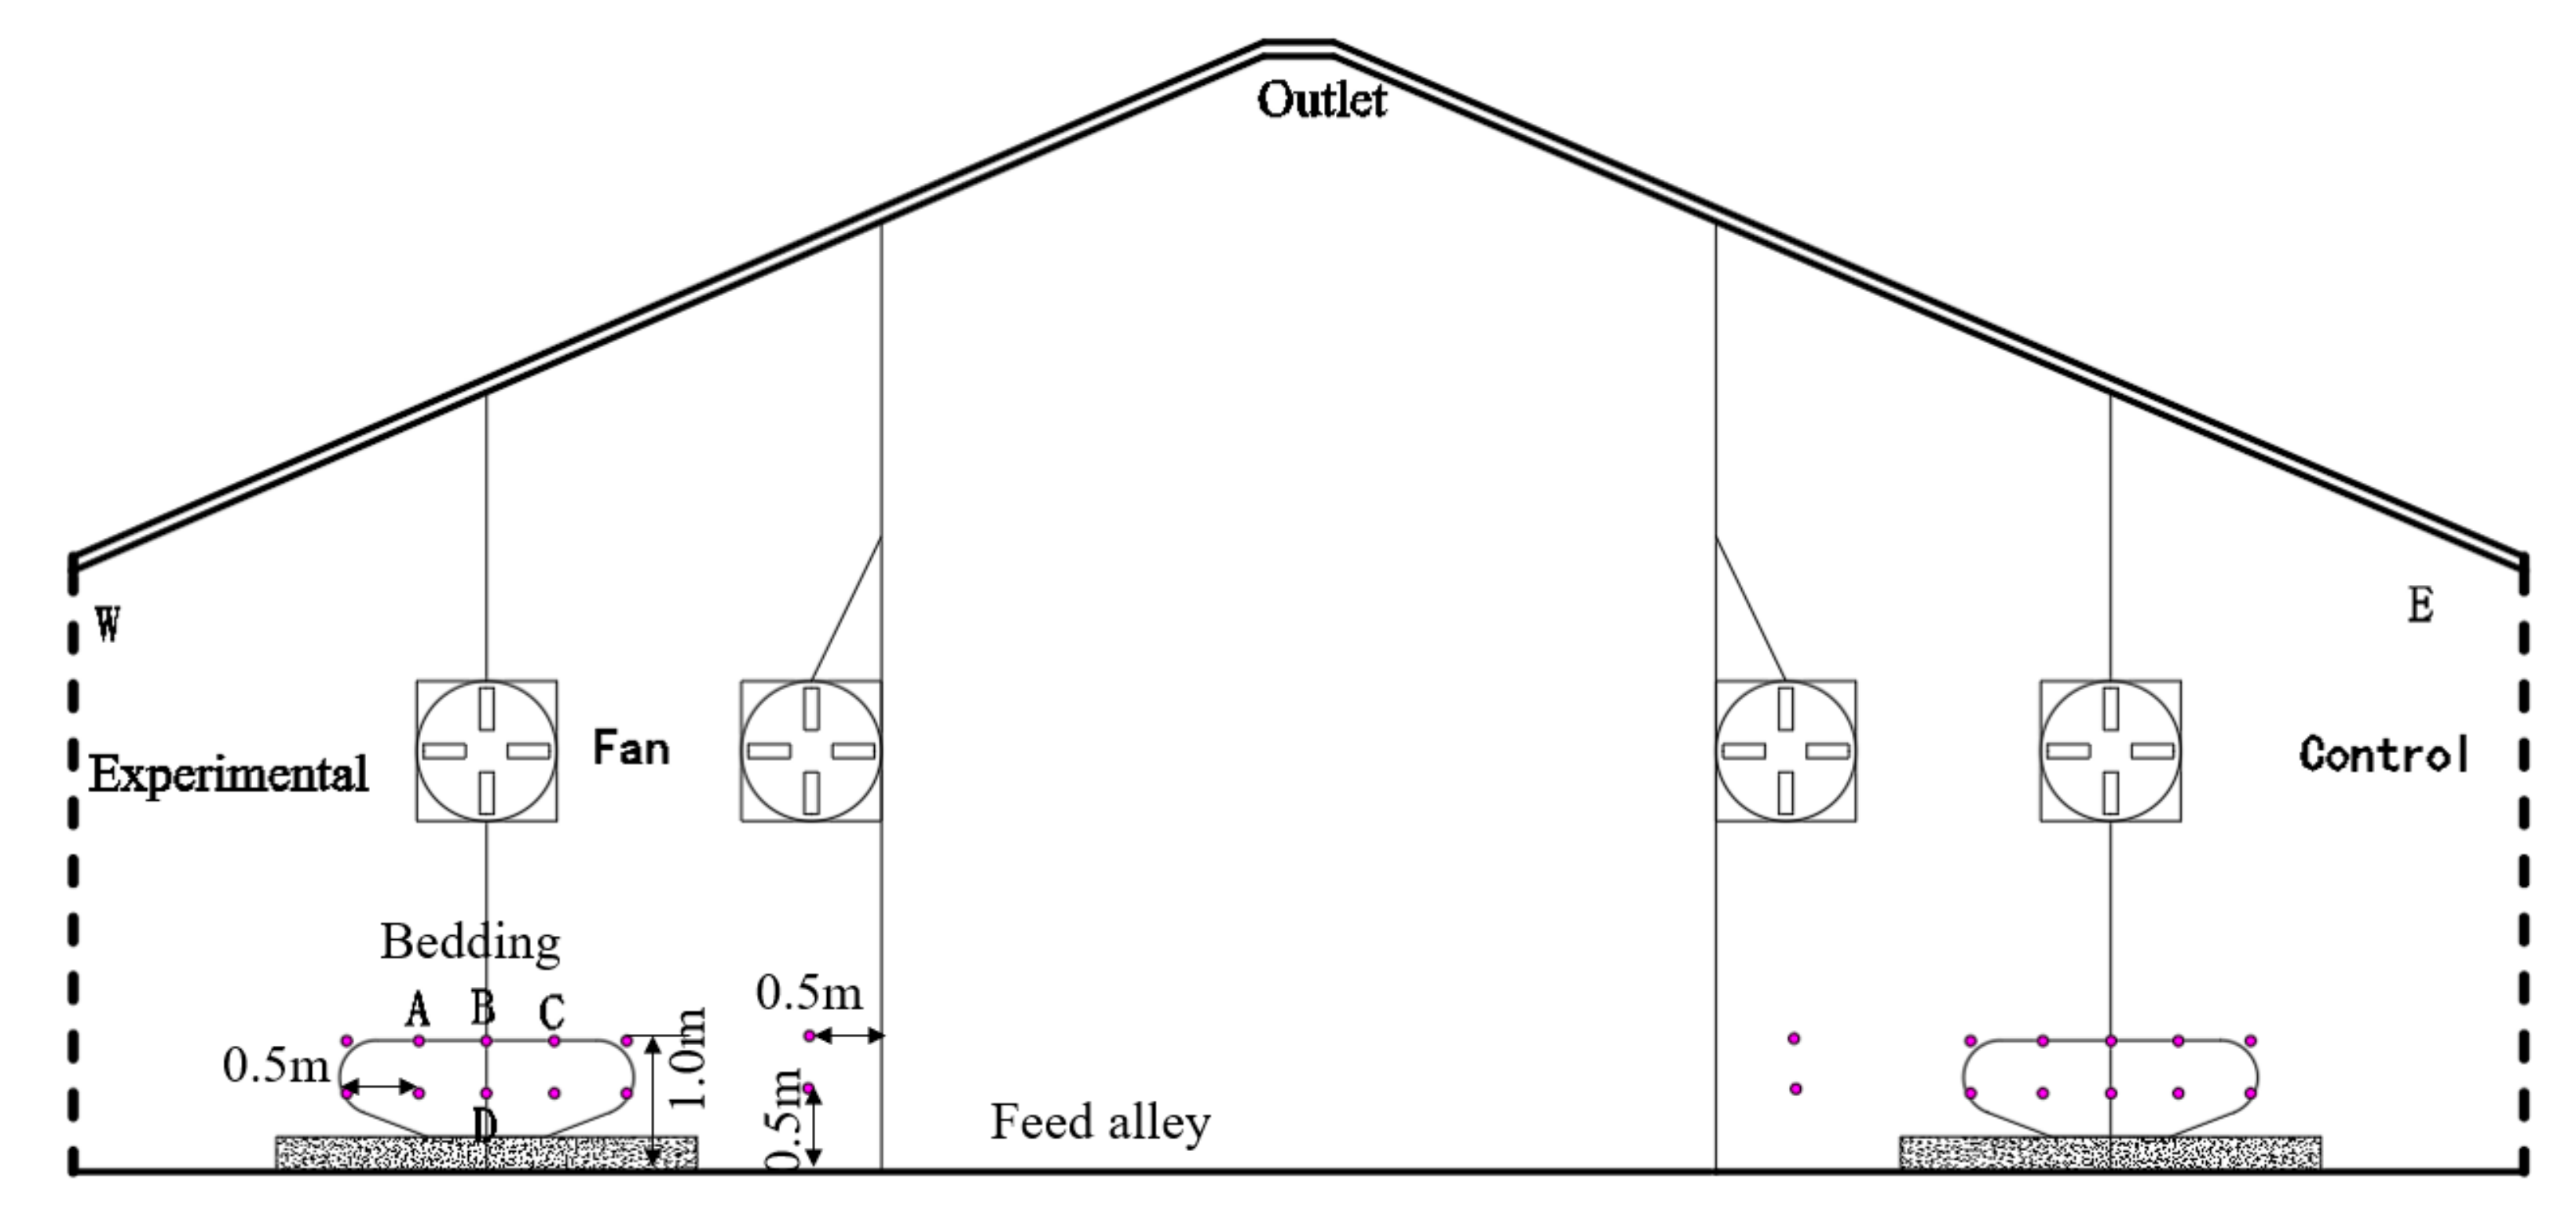
In this paper, the elevation angle of the fan diffuser was optimized by means of CFD simulation and laboratory prototype experiments. The CFD simulation of a prototype fan to obtain the jet length of the fan was successfully validated by [11]. Considering the interaction between the circumferential angle, the length, and the elevation angle of a diffuser, orthogonal tests were designed based on different lengths (250 mm, 350 mm, 450 mm), circumferential angles (150°, 180°, 210°), and elevation angles (5°, 10°, 15°), as showed in Figure 1. The simulation results were analyzed with the jet length as the optimization target.
The RNG k-ε turbulence model of Fluent software (ANSYS CFX17.0, ANSYS, PA, USA) was used to study the turbulence model selection of low-pressure axial fans [11]. The discrete method of governing equations is the finite volume method. The boundary conditions were as follows: the inlet was set as the pressure inlet, and the static pressure value was set as the inlet static pressure value measured during the performance test. The outlet was set as the free outlet, and the relative static pressure was set to 0 Pa due to direct connection with the atmosphere. The solid boundary of the impeller, diffuser, and ground was set as the wall boundary, the rotation domain was set as the rotation speed, that is, the rotation speed under the corresponding static pressure condition.
On the basis of the numerical simulation results, the flow flux, energy efficiency flow, and non-uniformity coefficients were analyzed through laboratory tests to optimize the MFF by testing different diffusers. The details of the laboratory tests are shown in Ref. [11].

2.2. Field Test

A field test at a dairy farm was done to validate the effects of the optimized diffuser identified in the basis of the laboratory study. Two dairy barns with the same structure were selected (Figure 2). The experimental barn was equipped with MFFs with 10°/150°/250 mm diffusers, and the control barn was equipped with the original MFFs. The dimensions of each barn were approximately 12 m in length, 22 m in width, 7 m in roof height, and 4.5 m in eaves height. The MFFs were installed above the beddings and feeding areas at 12 m intervals along the axial direction. The number of MFFs positioned near the bedding and feeding areas were two and three, respectively.
The environments of the dairy houses were monitored from July to August 2017, by recording temperature, relative humidity, wind speed, enclosure temperature, and cow size. The arrangement of the measurement points is shown in Figure 3. The testing heights were 1.0 m and 1.5 m above the floor. The measurement points on the bedding were evenly distributed. The horizontal separation distance was 0.5 m, and the axial separation distance was 1.0 m. The measurement points on the bedding were right behind the center of each fan. The cross-sectional wind speed in the axial direction was calculated from the average value of 13 measurement points in each cross section.
The wind speed at each measurement point was tested by the Kanomax Anemomaster Model 6036, produced by Kanomax (Osaka, Japan), whose test range is 0.01–30.0 m/s, and the accuracy is ±2% m/s. The temperature and relative humidity t each measurement point were tested by a HOBO U14 monitor (Onset Company, USA). The test range and accuracy of the temperature was between −20 and 50 °C ± 0.2 °C, and the relative humidity was 0–100% ± 2.5%.
The THI, calculated by Equation (1) [16,17], was developed as a means of quantifying the level of discomfort experienced by a human during the summer season:
THI = 0.81 T d + ( 0.99 T d 14.3 ) RH + 46.3
where Td is dry bulb temperature in °C, RH is relative humidity (%). The range 68 °C ≤ THI < 72 °C is considered to be mild, the range 72 °C ≤ THI < 80 °C is considered to be moderate, the range 80 °C ≤ THI < 90 °C is considered to be severe, and THI ≥ 90 °C is considered to be emergency.
The infrared image distribution map of the body surface temperature of the cows was acquired by a thermal imager, and the temperature of different points on the cows’ body surfaces was obtained by software processing. The rectal temperature of the cows was measured using an electronic rectal thermometer. A stopwatch was used to record the number of abdominal undulations of the cows within 3 min, representing the respiratory rate. Body surface temperature, rectal temperature, and respiratory rate were measured at 9:00, 12:00, and 15:00 for seven days and averaged.
The infrared imaging distribution of the surface temperature of the cows during the process of spraying was tested by a thermal imager (Model S6; the tested temperature was in the range from −20 to 650 °C, and the test data were displayed with a precision of 0.1 °C, with a measurement accuracy of ±2%). The rectal temperature was tested by an electronic rectal thermometer (Model K-028 SY; precision was ±0.1 °C, from 32 °C to 42.9 °C).
Since the internal and external temperature of livestock as well as the temperature in the center and the end of a barn are different, the average body temperature (ABT, °C) is generally estimated by the following formula:
Average body temperature = 0.7Tr + 0.3Ts
where Tr is the rectal temperature in °C, and Ts is the body temperature in °C.

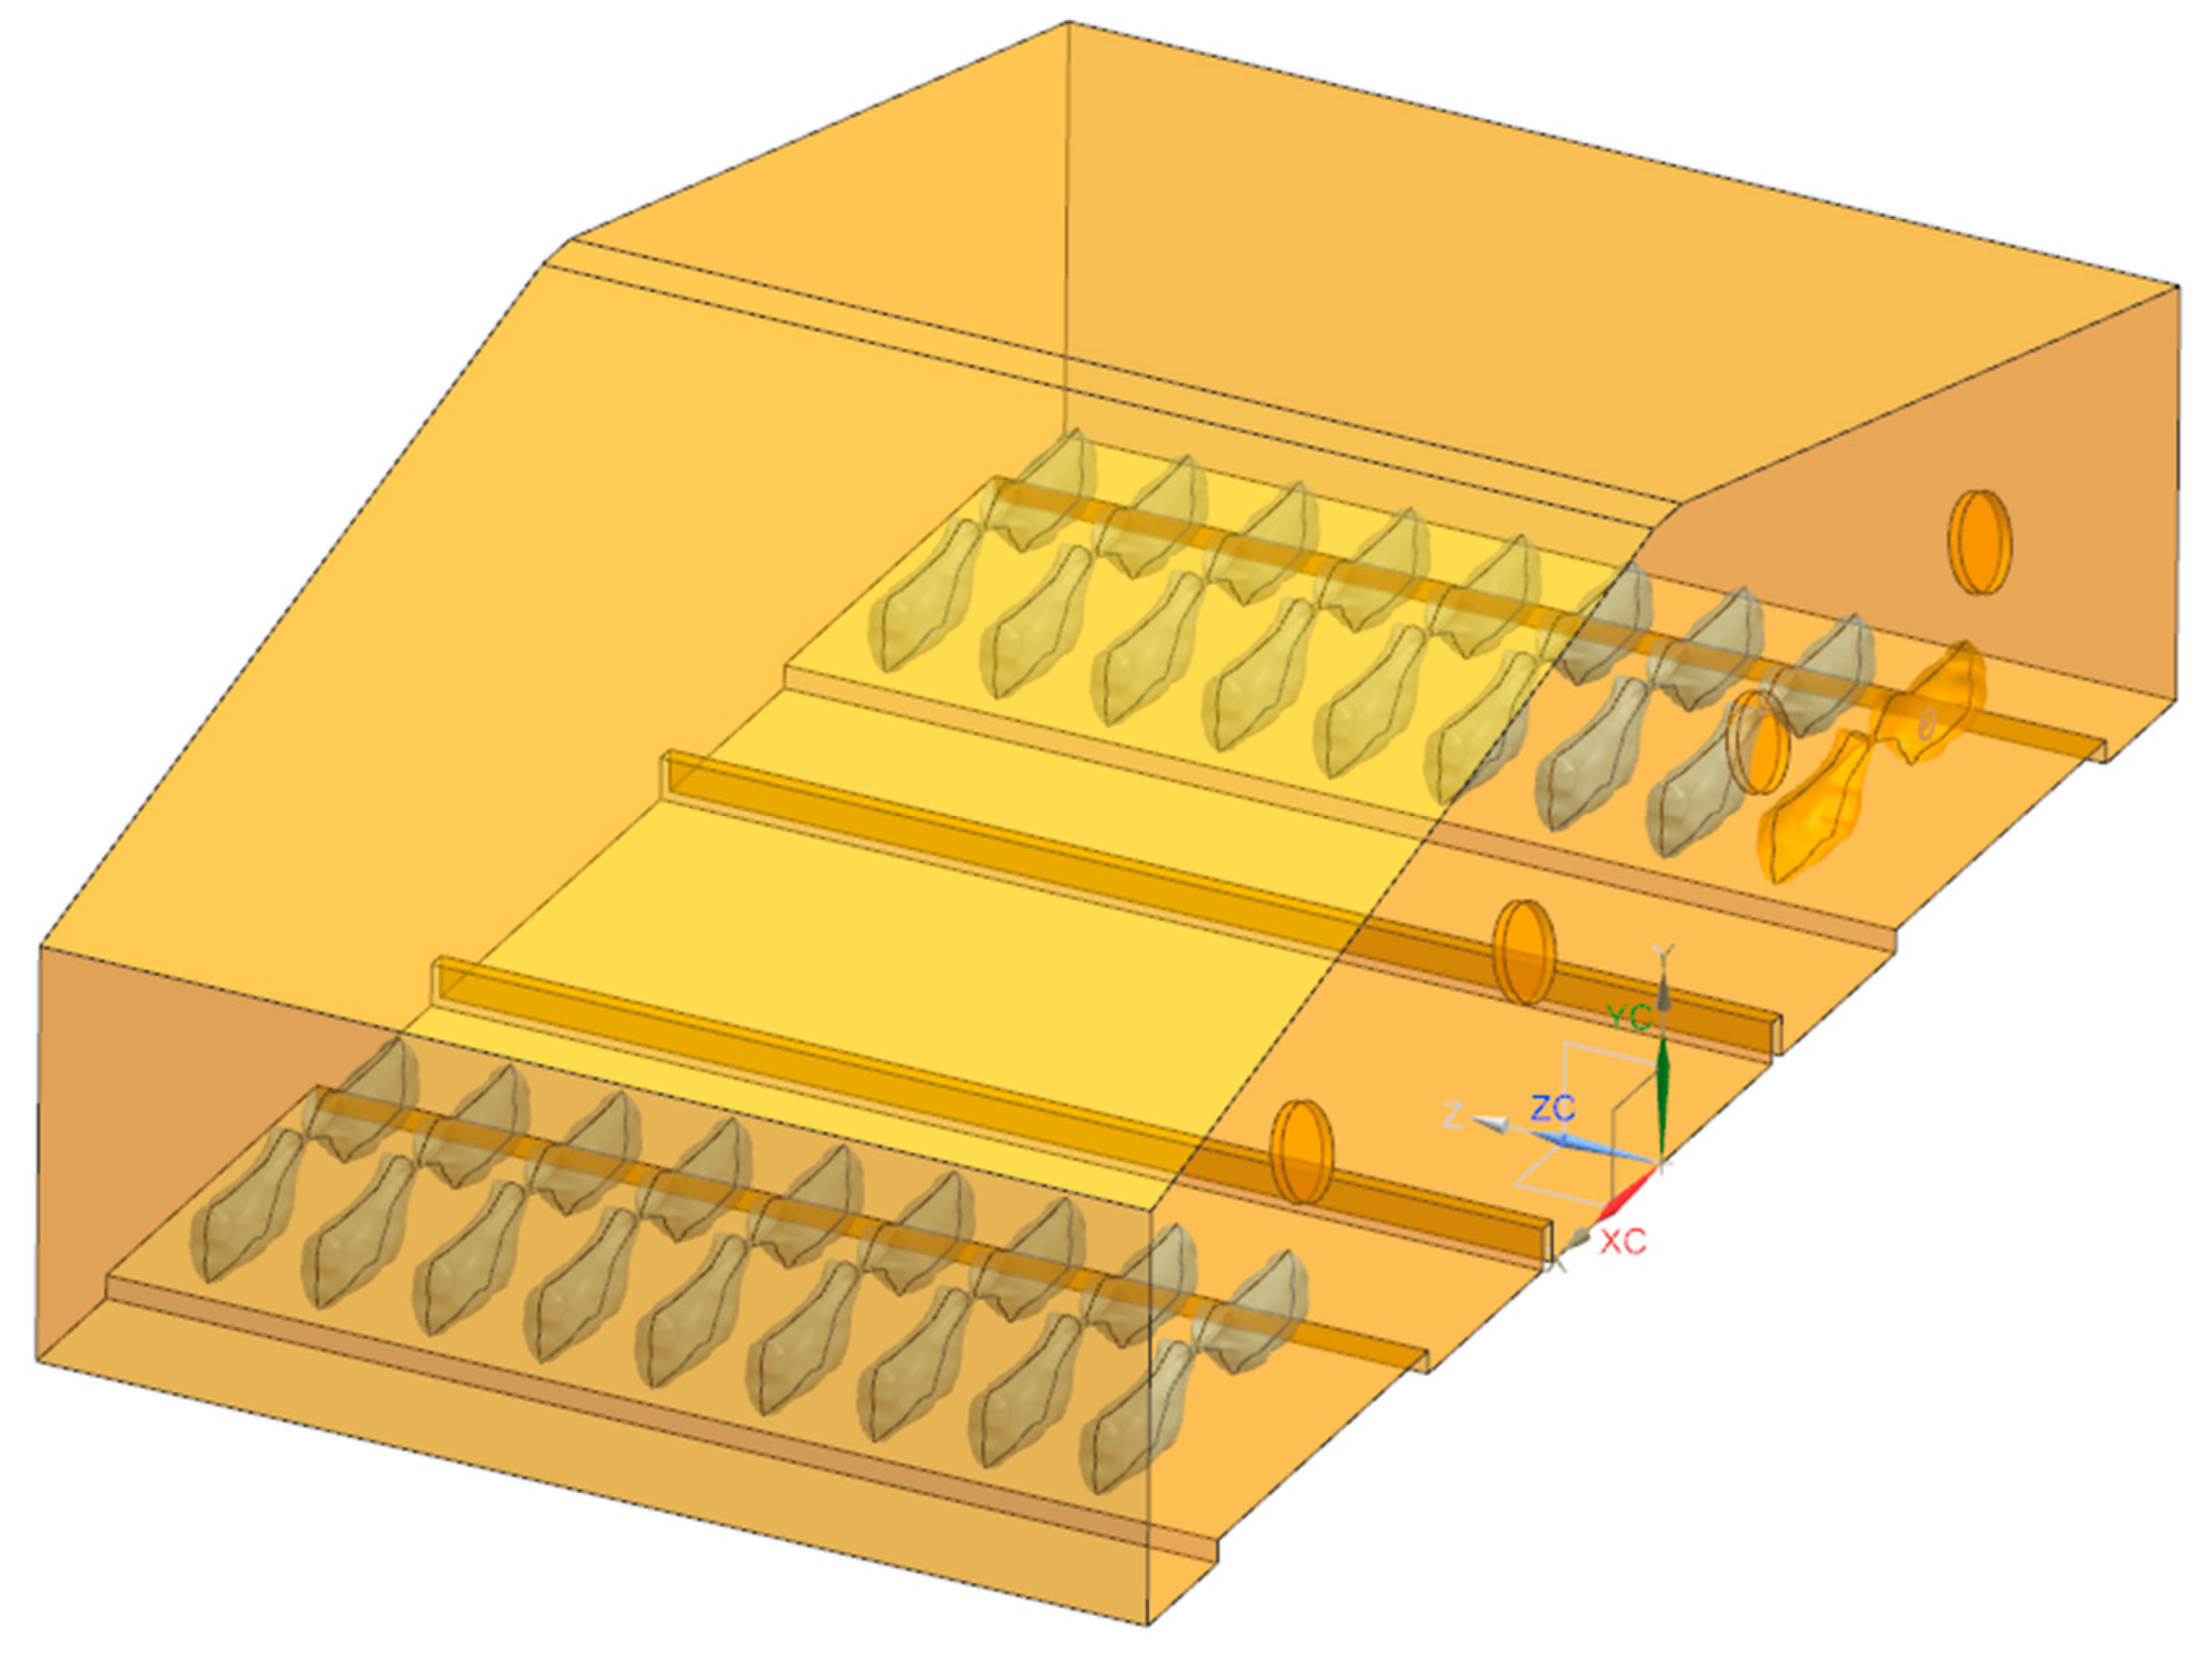
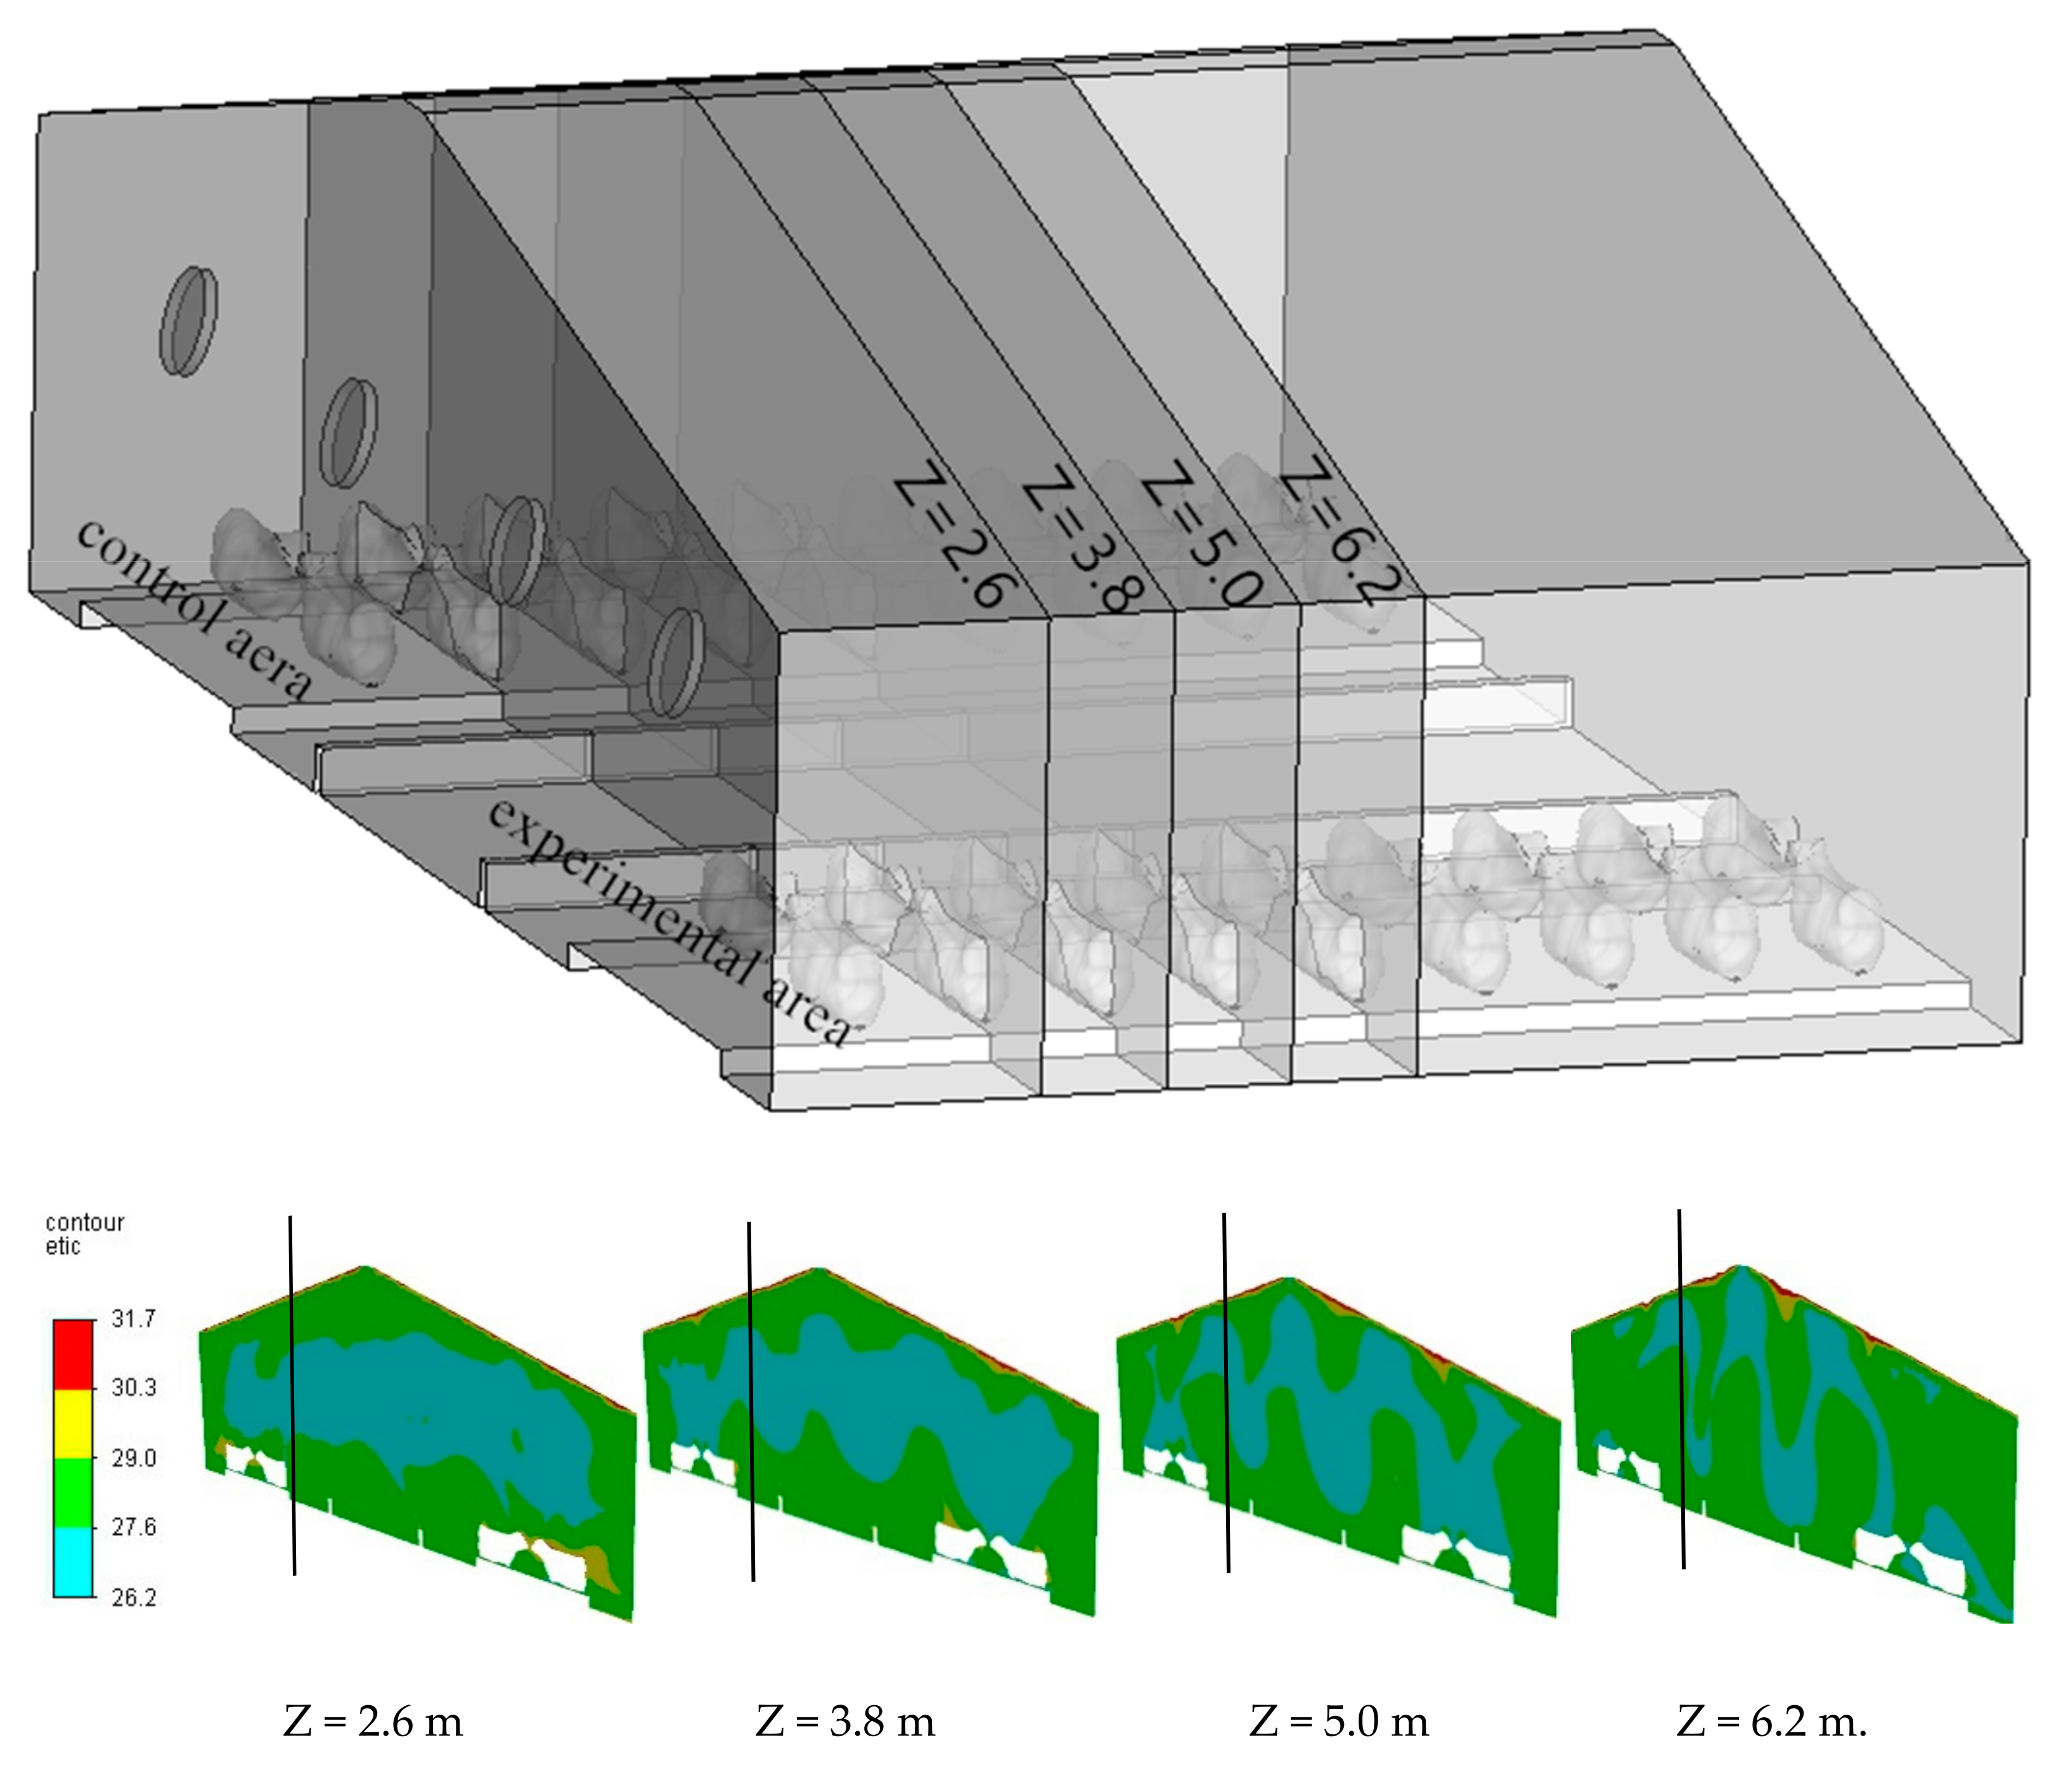
2.3. CFD Simulation of a Barn

The 3D model of a barn is shown in Figure 4. X is the span of the barn (between −11 m and 11 m), Y is perpendicular to the ground (between 0 m and 7 m), and Z is the length of the barn (between 0 m and 12 m). The barn was an open barn. In order to facilitate the calculations, the natural ventilation effect caused by wind pressure was not considered. The model was created in proportion to the physical building. In order to simplify the model, the influence of the bolting railing on the airflow and heat transfer in the barn was ignored. The model simulated the simultaneous operation of four MFFs, two of which were optimized hat-type MFFs placed in the south of the barn, and two were prototype MFFs placed in the north of the barn.
The unstructured tetrahedral mesh was used; the maximum mesh size was 400 mm, and the surface of fan and cow was encrypted in the local mesh. The maximum size of the mesh was 32 mm, and the number of network elements was 6.39 million. The meshes are shown in Figure 5. For the boundary conditions, according to the test results of the fan performance curve, the fan test data were fitted to a second-order polynomial between the fan pressure rise and the wind speed. The cow model was set as source term to calculate the caloric production of a cow and the amount of water vapor produced by evaporation and respiration. According to the literature [18], the heat dissipation of dairy cows and the evaporation of water from the cow’s body surface can be theoretically calculated. According to the measured wind speed in the field test, the wind speed of the fan is 0.8 m/s at the end of the fan installation distance of 12 m. Therefore, 0.8 m/s was used as the north side wind speed inlet boundary in the model, and the temperature and humidity were the indoor temperature and humidity. The east, west, south, and upper vents were pressure outlet boundaries, the relative pressure was 0, and the temperature and humidity were the outside temperature and humidity. The other surfaces were set to the wall boundary, the temperature was measured by an infrared camera, and the heat transfer parameters were determined according to the material.
After obtaining the temperature and humidity parameters of each point in the house, the ETIC was used to evaluate the heat stress state of the cows in the house. Its formula is as follows:
ETIC = T a 0.0038 · T a · ( 100 RH ) 0.1173 · v 0.707 · ( 39.20 T a )
where Ta is the temperature, RH is the relative humidity, and v is the wind speed in m/s. The range 23 °C ≤ ETIC < 26 °C is considered mild, the range 26 °C ≤ ETIC < 31 °C is considered moderate, the range 31°C ≤ ETIC < 37 °C is considered severe, and ETIC ≥ 37 °C is considered emergency.

3. Results and Discussion

3.1. Optimization of the Elevation Angle

The analysis of variance showed that the circumferential angle θ had the greatest influence on the jet length, and the interaction between the factors had no significant effect on the jet length and could be ignored. The relationship between the single factors α, θ, L and the jet length is shown in Figure 6. The wind speed range was defined as the horizontal distance from the center of the MFF to the end of 2 m/s Iso-surface. As can be seen from the figure, because the interaction between the various factors was not obvious (showed by Table 1.), considering the optimization results of the circumferential angles and lengths of the existing diffuser, the circumferential angle and length were taken as 150° and 250 mm, respectively. On this basis, the diffuser elevation angle was obtained. When α increased from 5° to 10°, the wind speed range increased from 4.50 to 4.69, but when α continued to increase to 15°, the wind speed range dropped to 4.25. Therefore, when the wind speed range was used as the evaluation standard, the diffuser of 10°/150°/250 mm (elevation angle/circumferential angle/length) appeared to be optimal.
By comparing the performances of fans with different elevation diffusers shown in Table 2, it was found that compared with the 0°/150°/250 mm diffuser, the 10°/150°/250 mm diffuser increased the fan air volume by 0.69%, while the 5°/150°/250 mm diffuser increased the fan energy efficiency ratio by 1.88%.
The average wind speed of fans with different elevation diffusers at different heights is shown in Figure 7. It was found that at the heights of H3.0, H2.5, and H2.0 (the number represents the height in meters from the ground), that is, at the upper edges, center, lower edges of the fan, the diffuser of 15°/150°/250 mm produced the maximum average wind speed of the fan and was the diffuser whose wind speed of the corresponding fan was higher than that of the fan with an elevation angle of 0°. At the heights of H1.5 and H1.0, the average wind speed of the fan equipped with a 5°/150°/250 mm diffuser was slightly higher than that of fan equipped with other diffusers, and the average wind speed of the fan equipped with a 5°/150°/250 mm diffuser was obviously lower than that of fans equipped with other diffusers.
The comparison of non-uniformity coefficients of fans with different elevation diffusers is shown in Figure 8. At the heights of H3.0, H2.5, and H2.0, the diffuser with 15°/150°/250 mm was characterized by the lowest non-uniformity coefficient of fan flow field and had a certain elevation angle. The non-uniformity coefficient of the corresponding fan flow field was lower than that of the fan with 0 elevation angle. At the heights of H1.5 and H1.0, the non-uniformity coefficient of flow field of the fan with a 10°/150°/250 mm diffuser was smaller than that of the fans with other diffusers.

3.2. Field Test Results
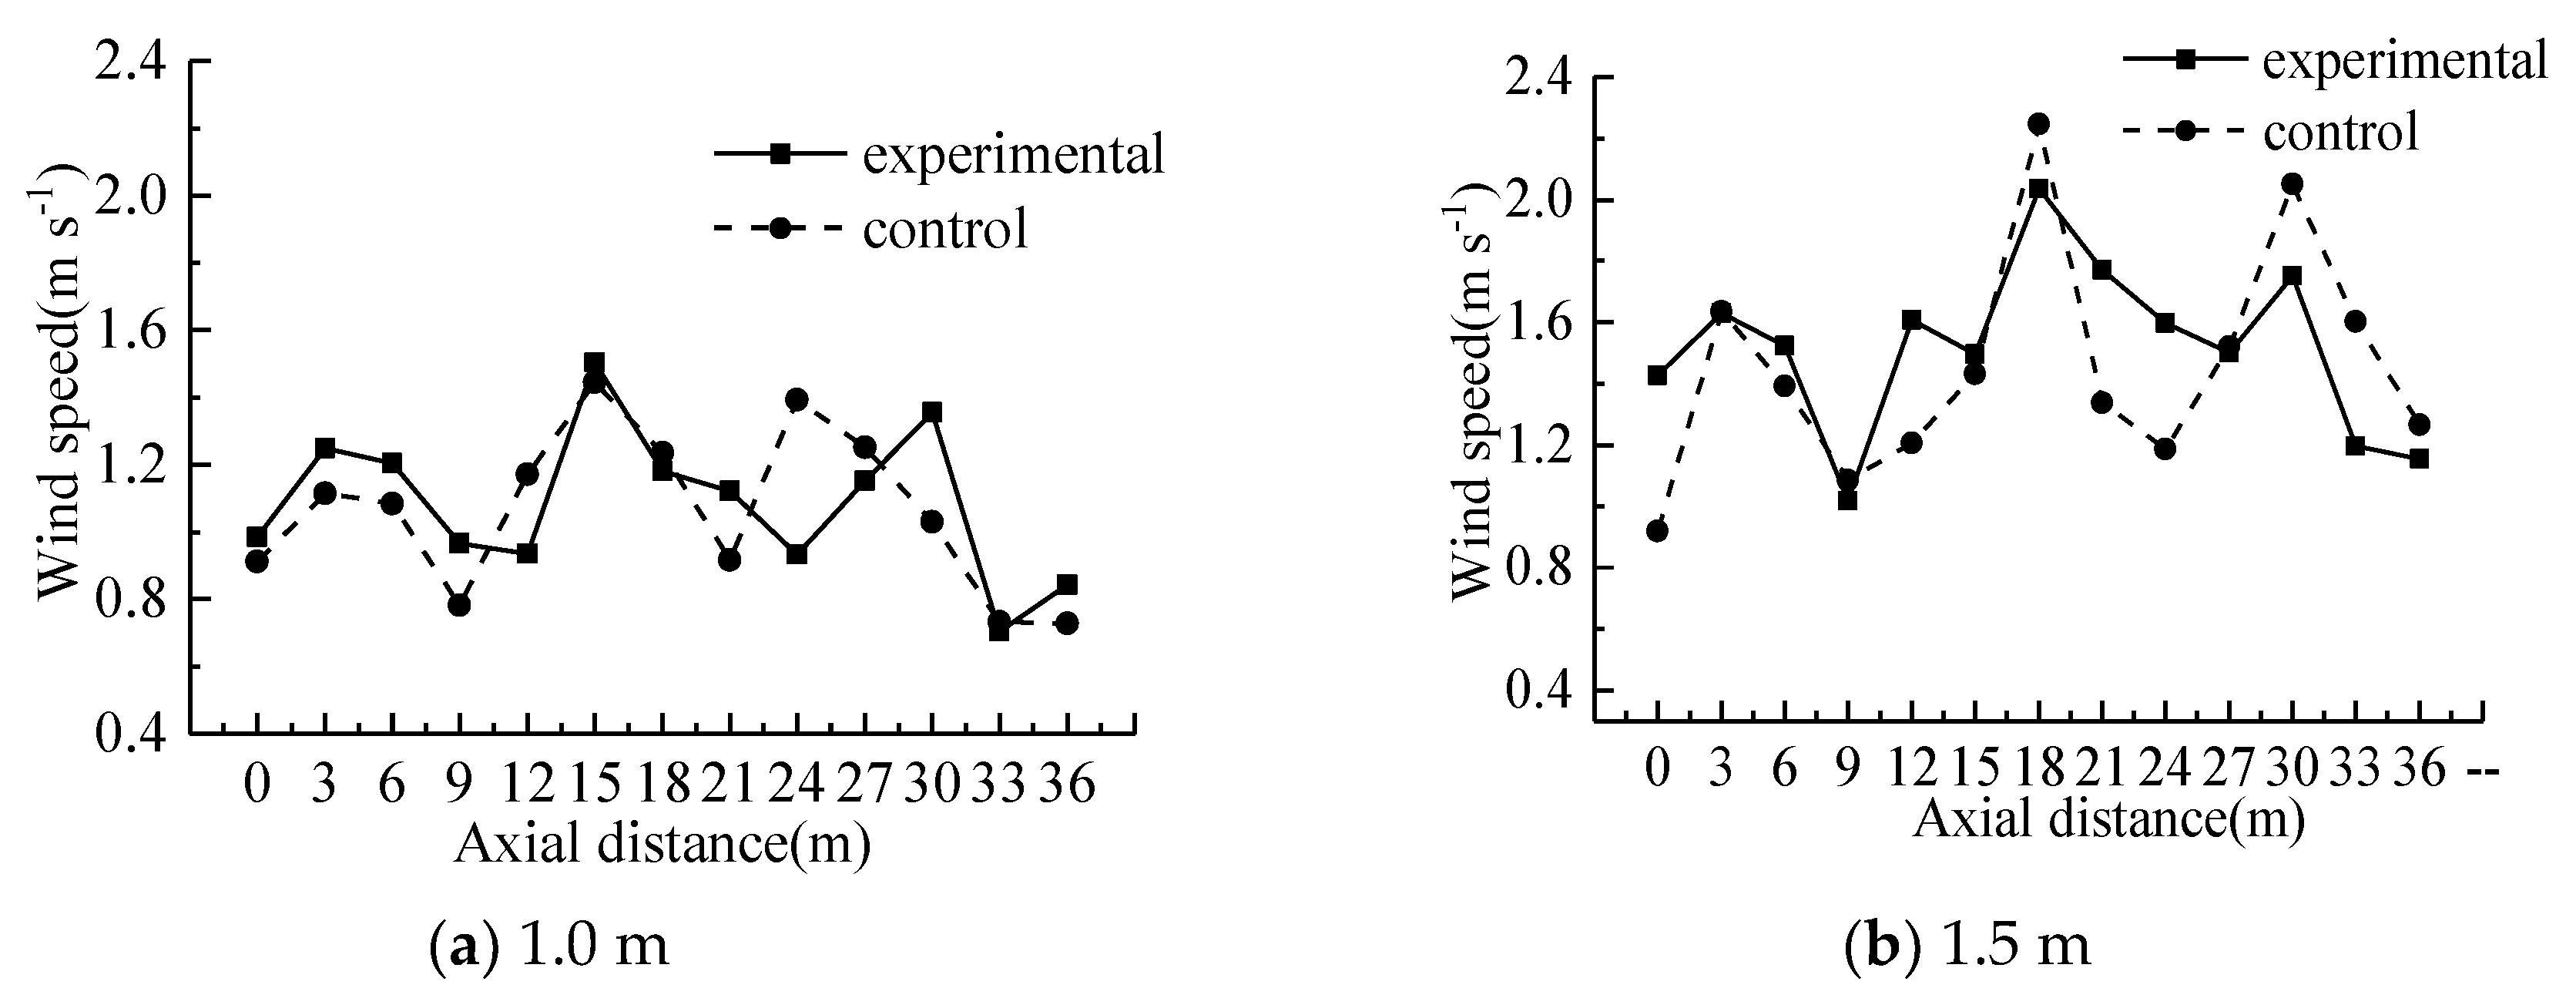
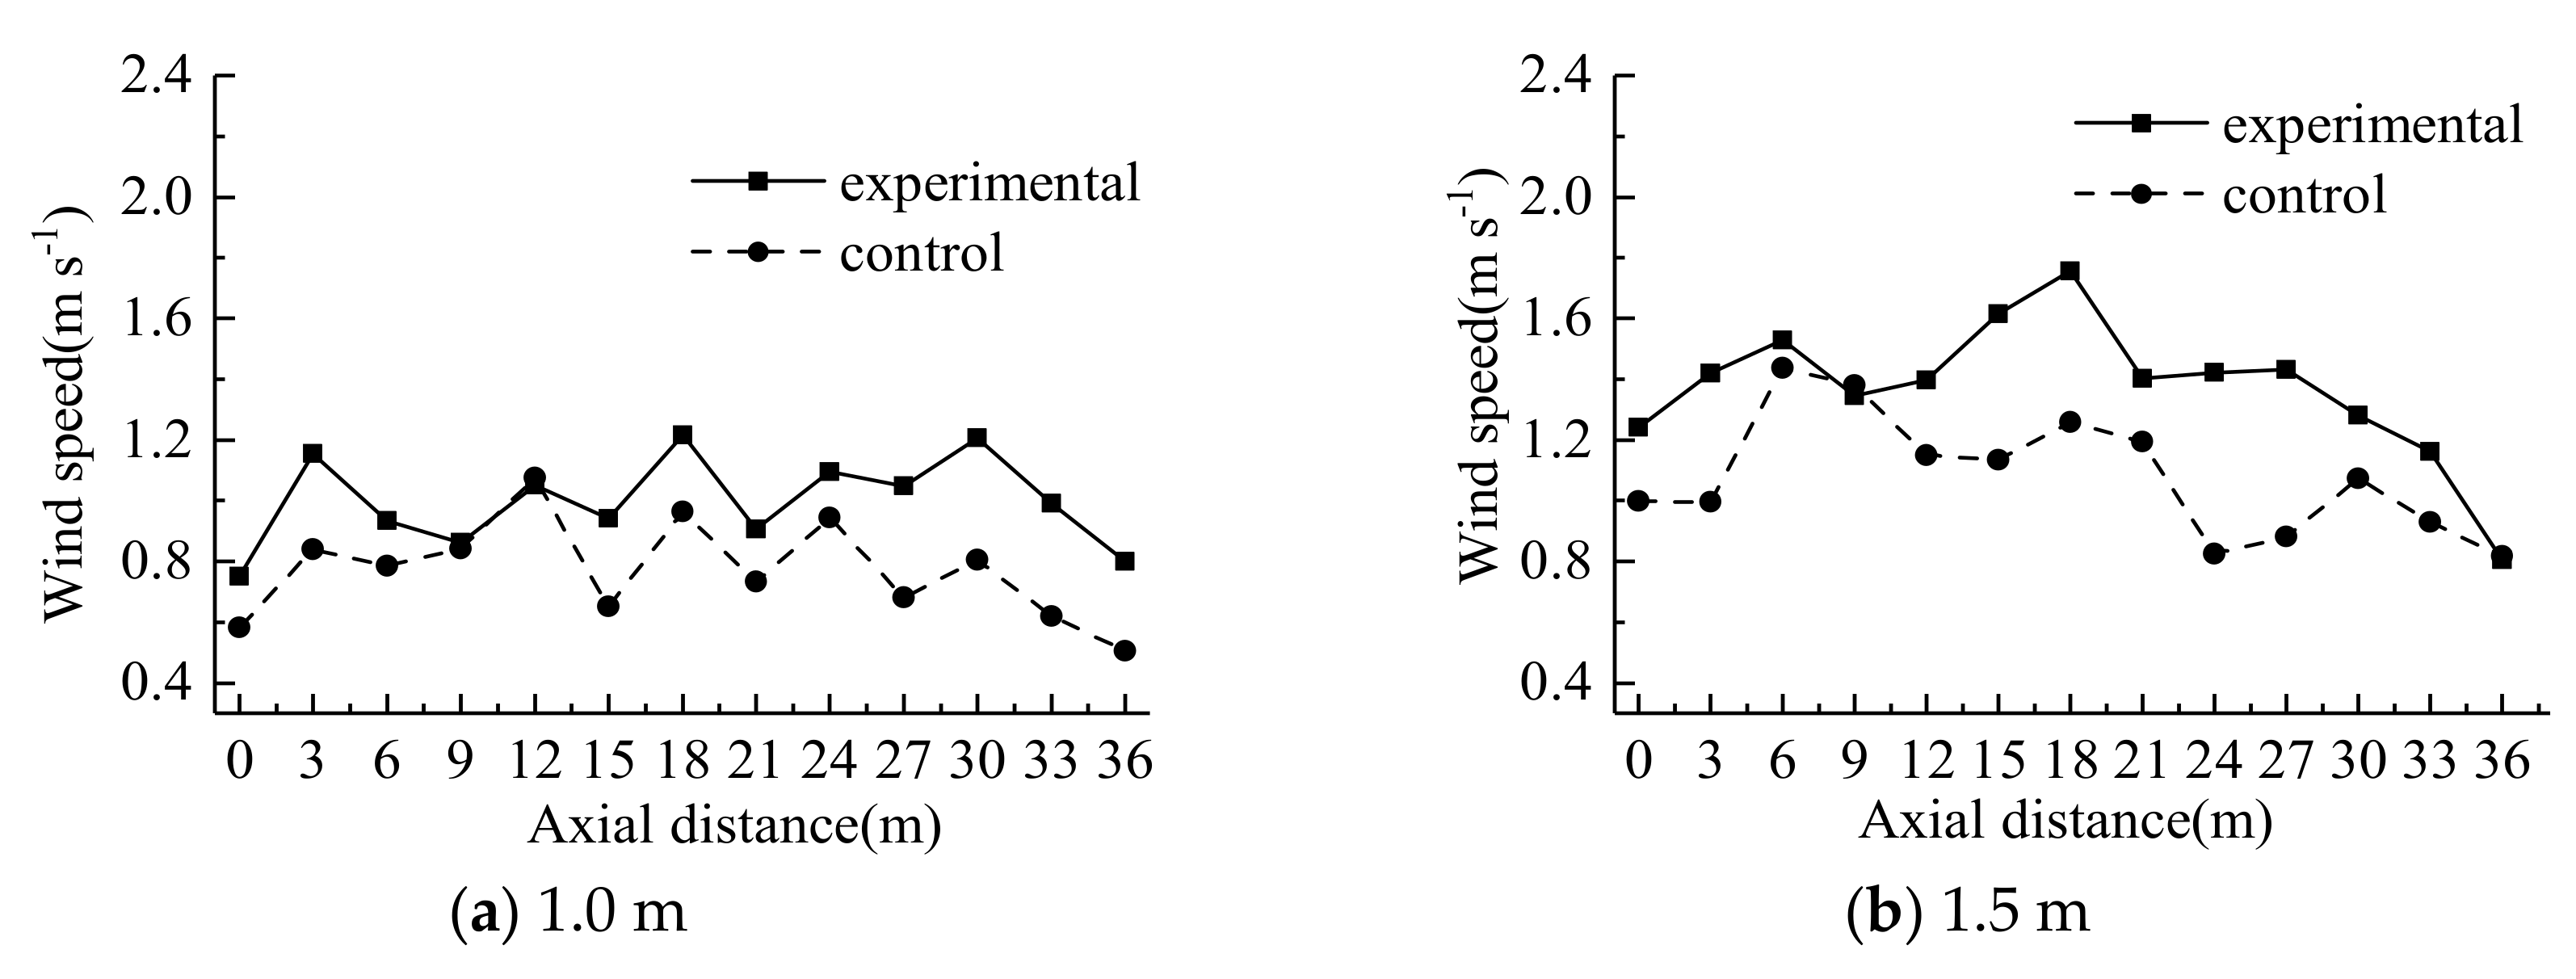
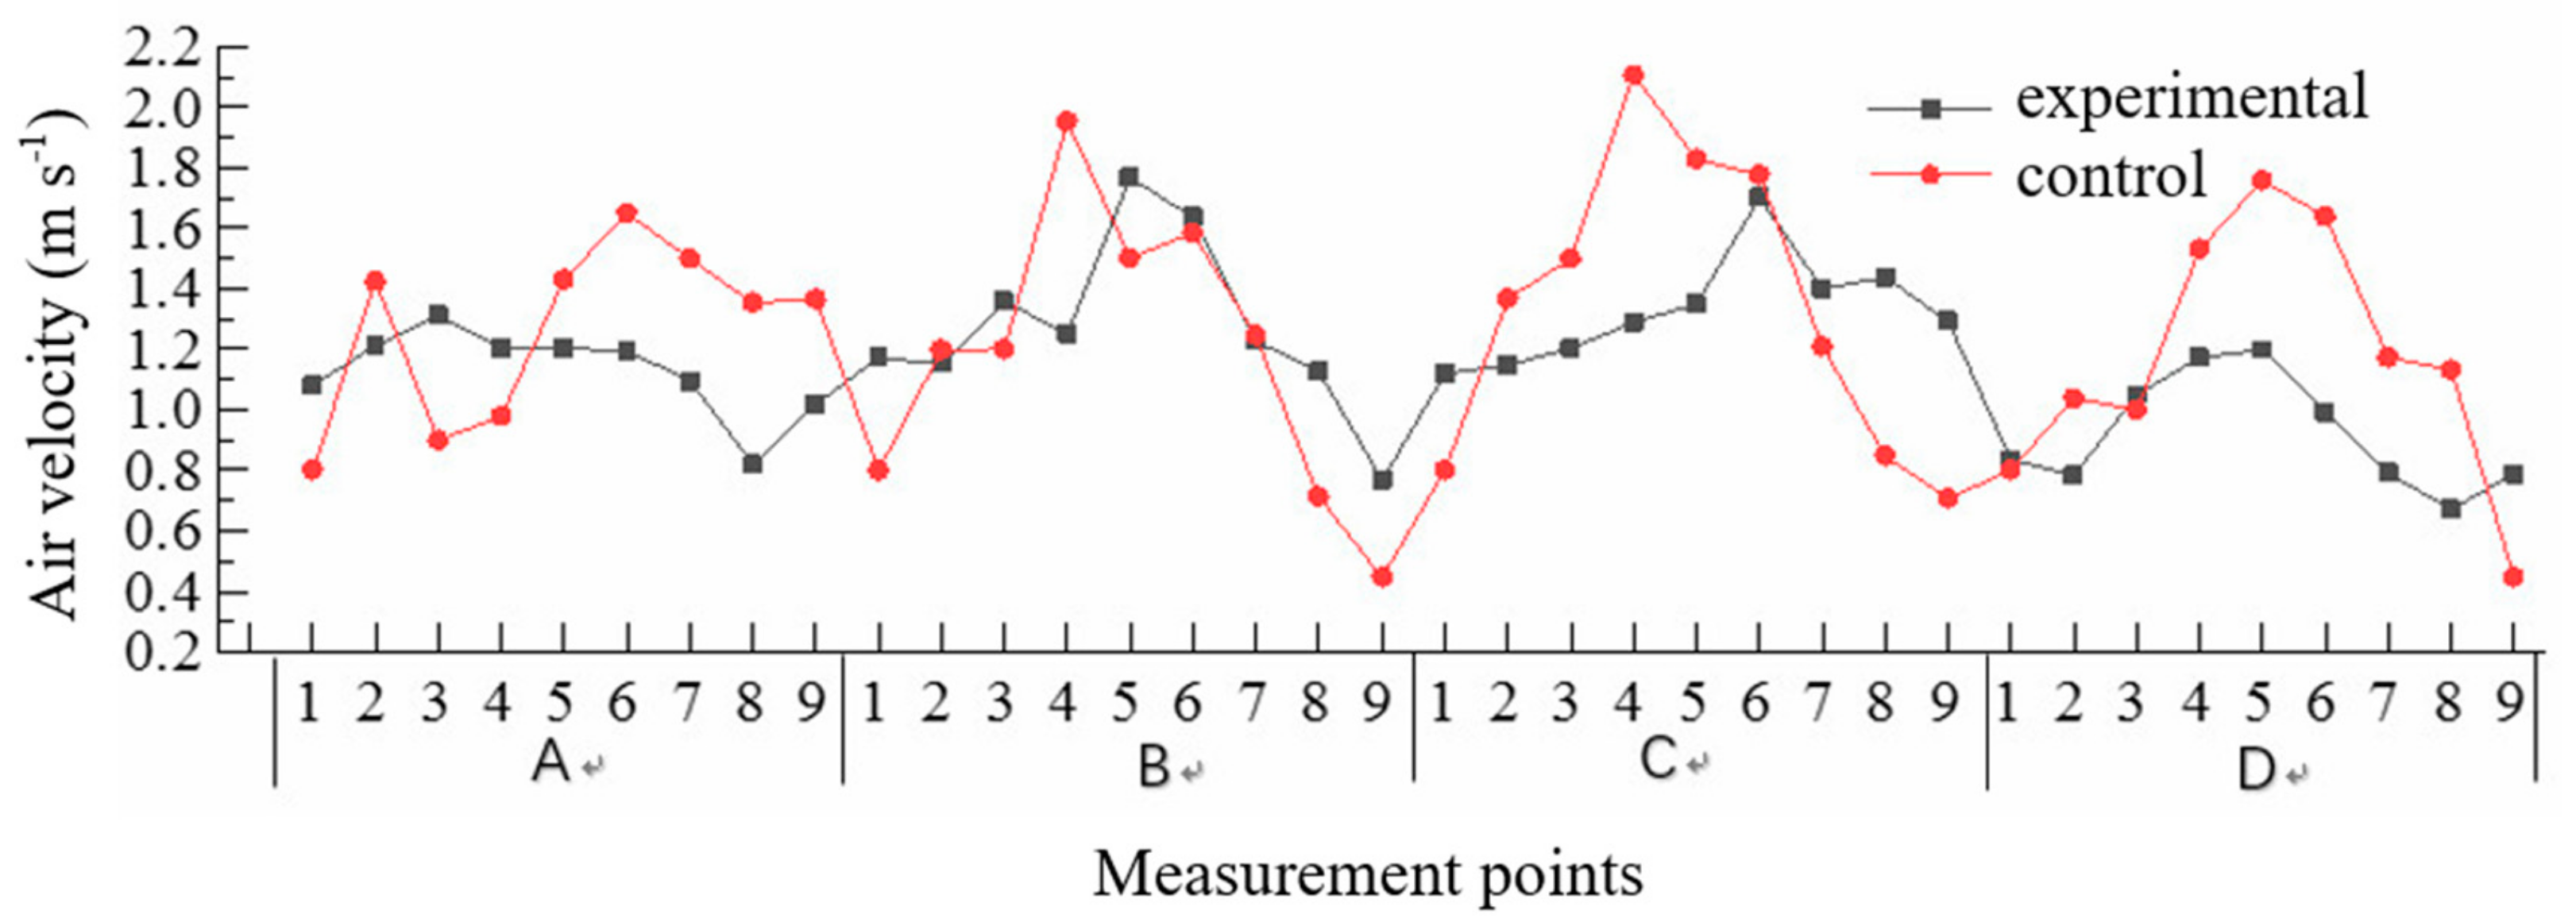
3.2.1. Wind Speed

From Figure 9 and Figure 10, it can be seen that the average wind speed of the fan at a height of 1.5 m was higher than that of a fan at a height of 1.0 m. The variation of wind speed in the experimental area took the transverse distance of 12 m as a cycle and showed a distribution pattern, first increasing and then decreasing in each cycle. It was found that there was little difference in wind speed between the experimental area and the control area at the neck flail position. It was possible that the wind speed was greatly influenced by the outside environment because of the vicinity to the feeding channel. For the bedridden area, it was observed that the wind speed was higher in the experimental area than in the control area.

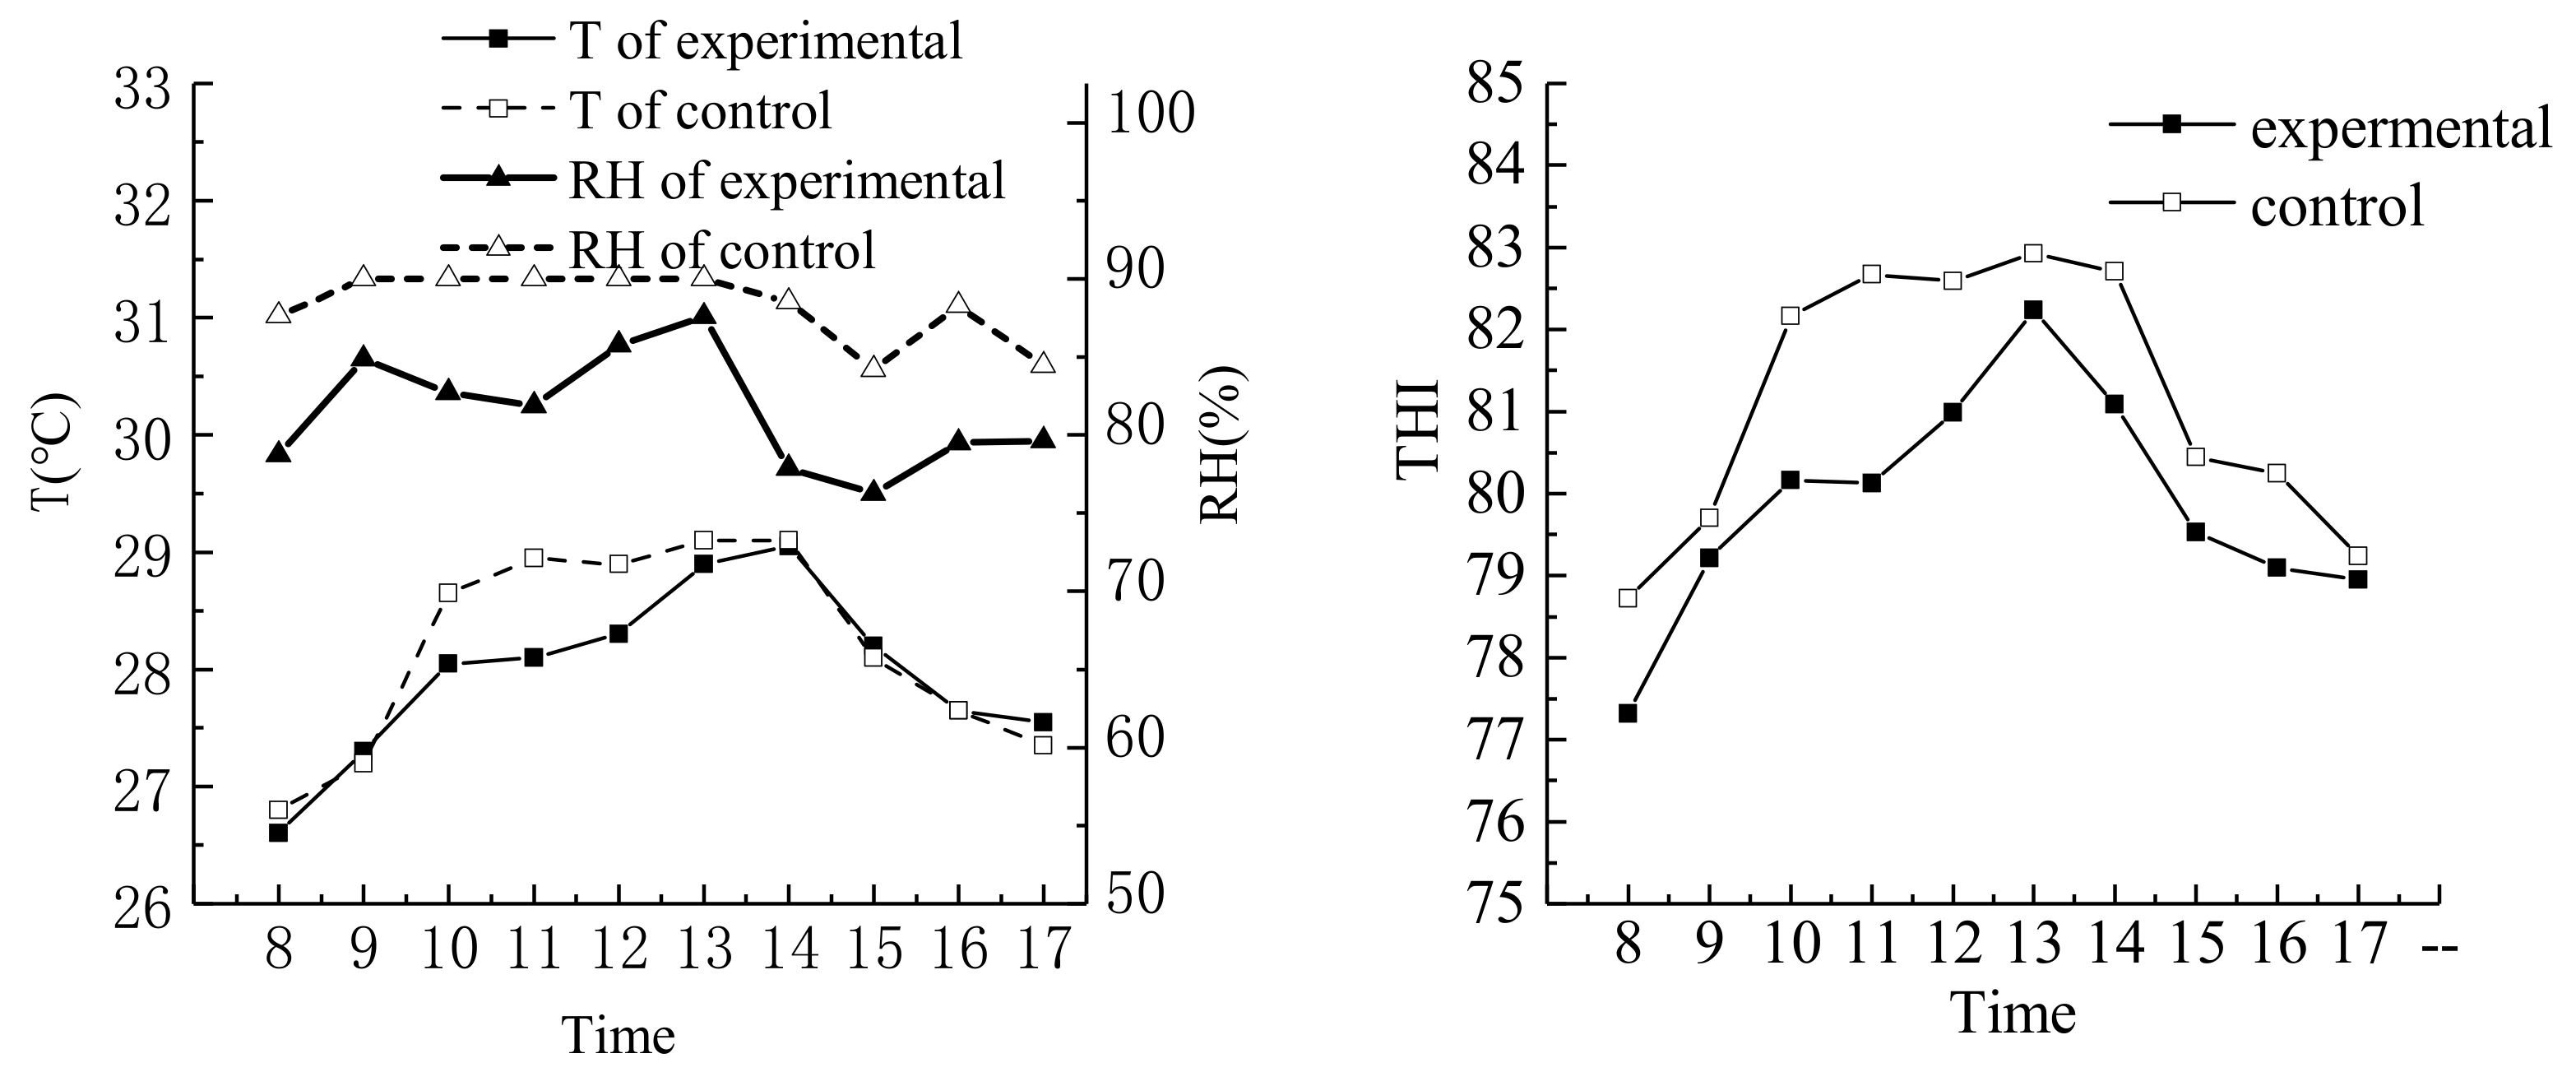
3.2.2. Temperature and Relative Humidity

Figure 11 is a time-dependent curve of temperature, humidity, and THI index in the bedding area during the day. According to the figure, the temperature of the house was 26.5–29 °C and reached a maximum value at 13:00. There was no significant difference in temperature between the experimental and the control rooms. The RH index and the THI in the bedding area were lower than in the control area, and the difference was obvious. It shows that increasing the wind speed can improve the environmental index of the bedding area. However, according to the THI, the environment in the cowshed still caused moderate heat stress to the cattle.

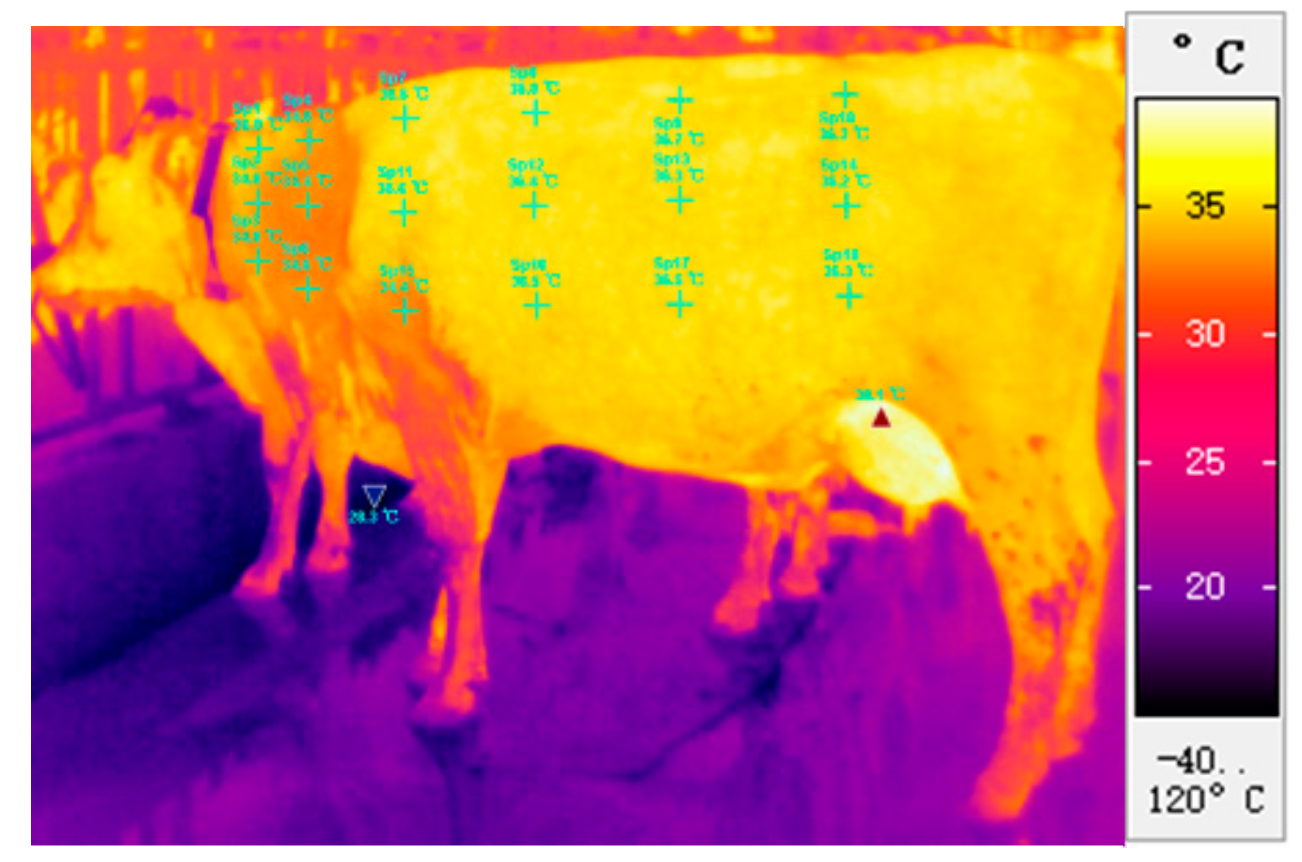
3.2.3. Average Body Temperature

The body temperature of the cows was collected by using a thermal imager, as shown in Figure 12. The numbers indicate the surface temperatures in representative points of cow body. Adult lactating cows were used in the experiment. It was approximately considered that the physiological status of the experimental individuals was the same and that there was no change in the results due to individual differences.
The changes of the average temperature (body surface temperature, rectal temperature) of the dairy cows at different times of the day in the experimental and control areas are shown in Table 3. The experimental results showed that the average temperature of the cows in the experimental area was slightly lower than that in the control area at different times. At different times of the day, the rectal temperature of the dairy cows in the experimental area and in the control area were similar, all within the normal rectal temperature range.

3.2.4. Respiratory Rate of the Cows

The changes of the respiratory frequency of the dairy cows at different times of the day are shown in Table 4. The results showed that the respiratory frequency of the dairy cows was the highest at 12:00, and there was no significant difference in cows’ respiratory frequency between the experimental and the control areas.

3.3. CFD Simulation Results of Cowshed

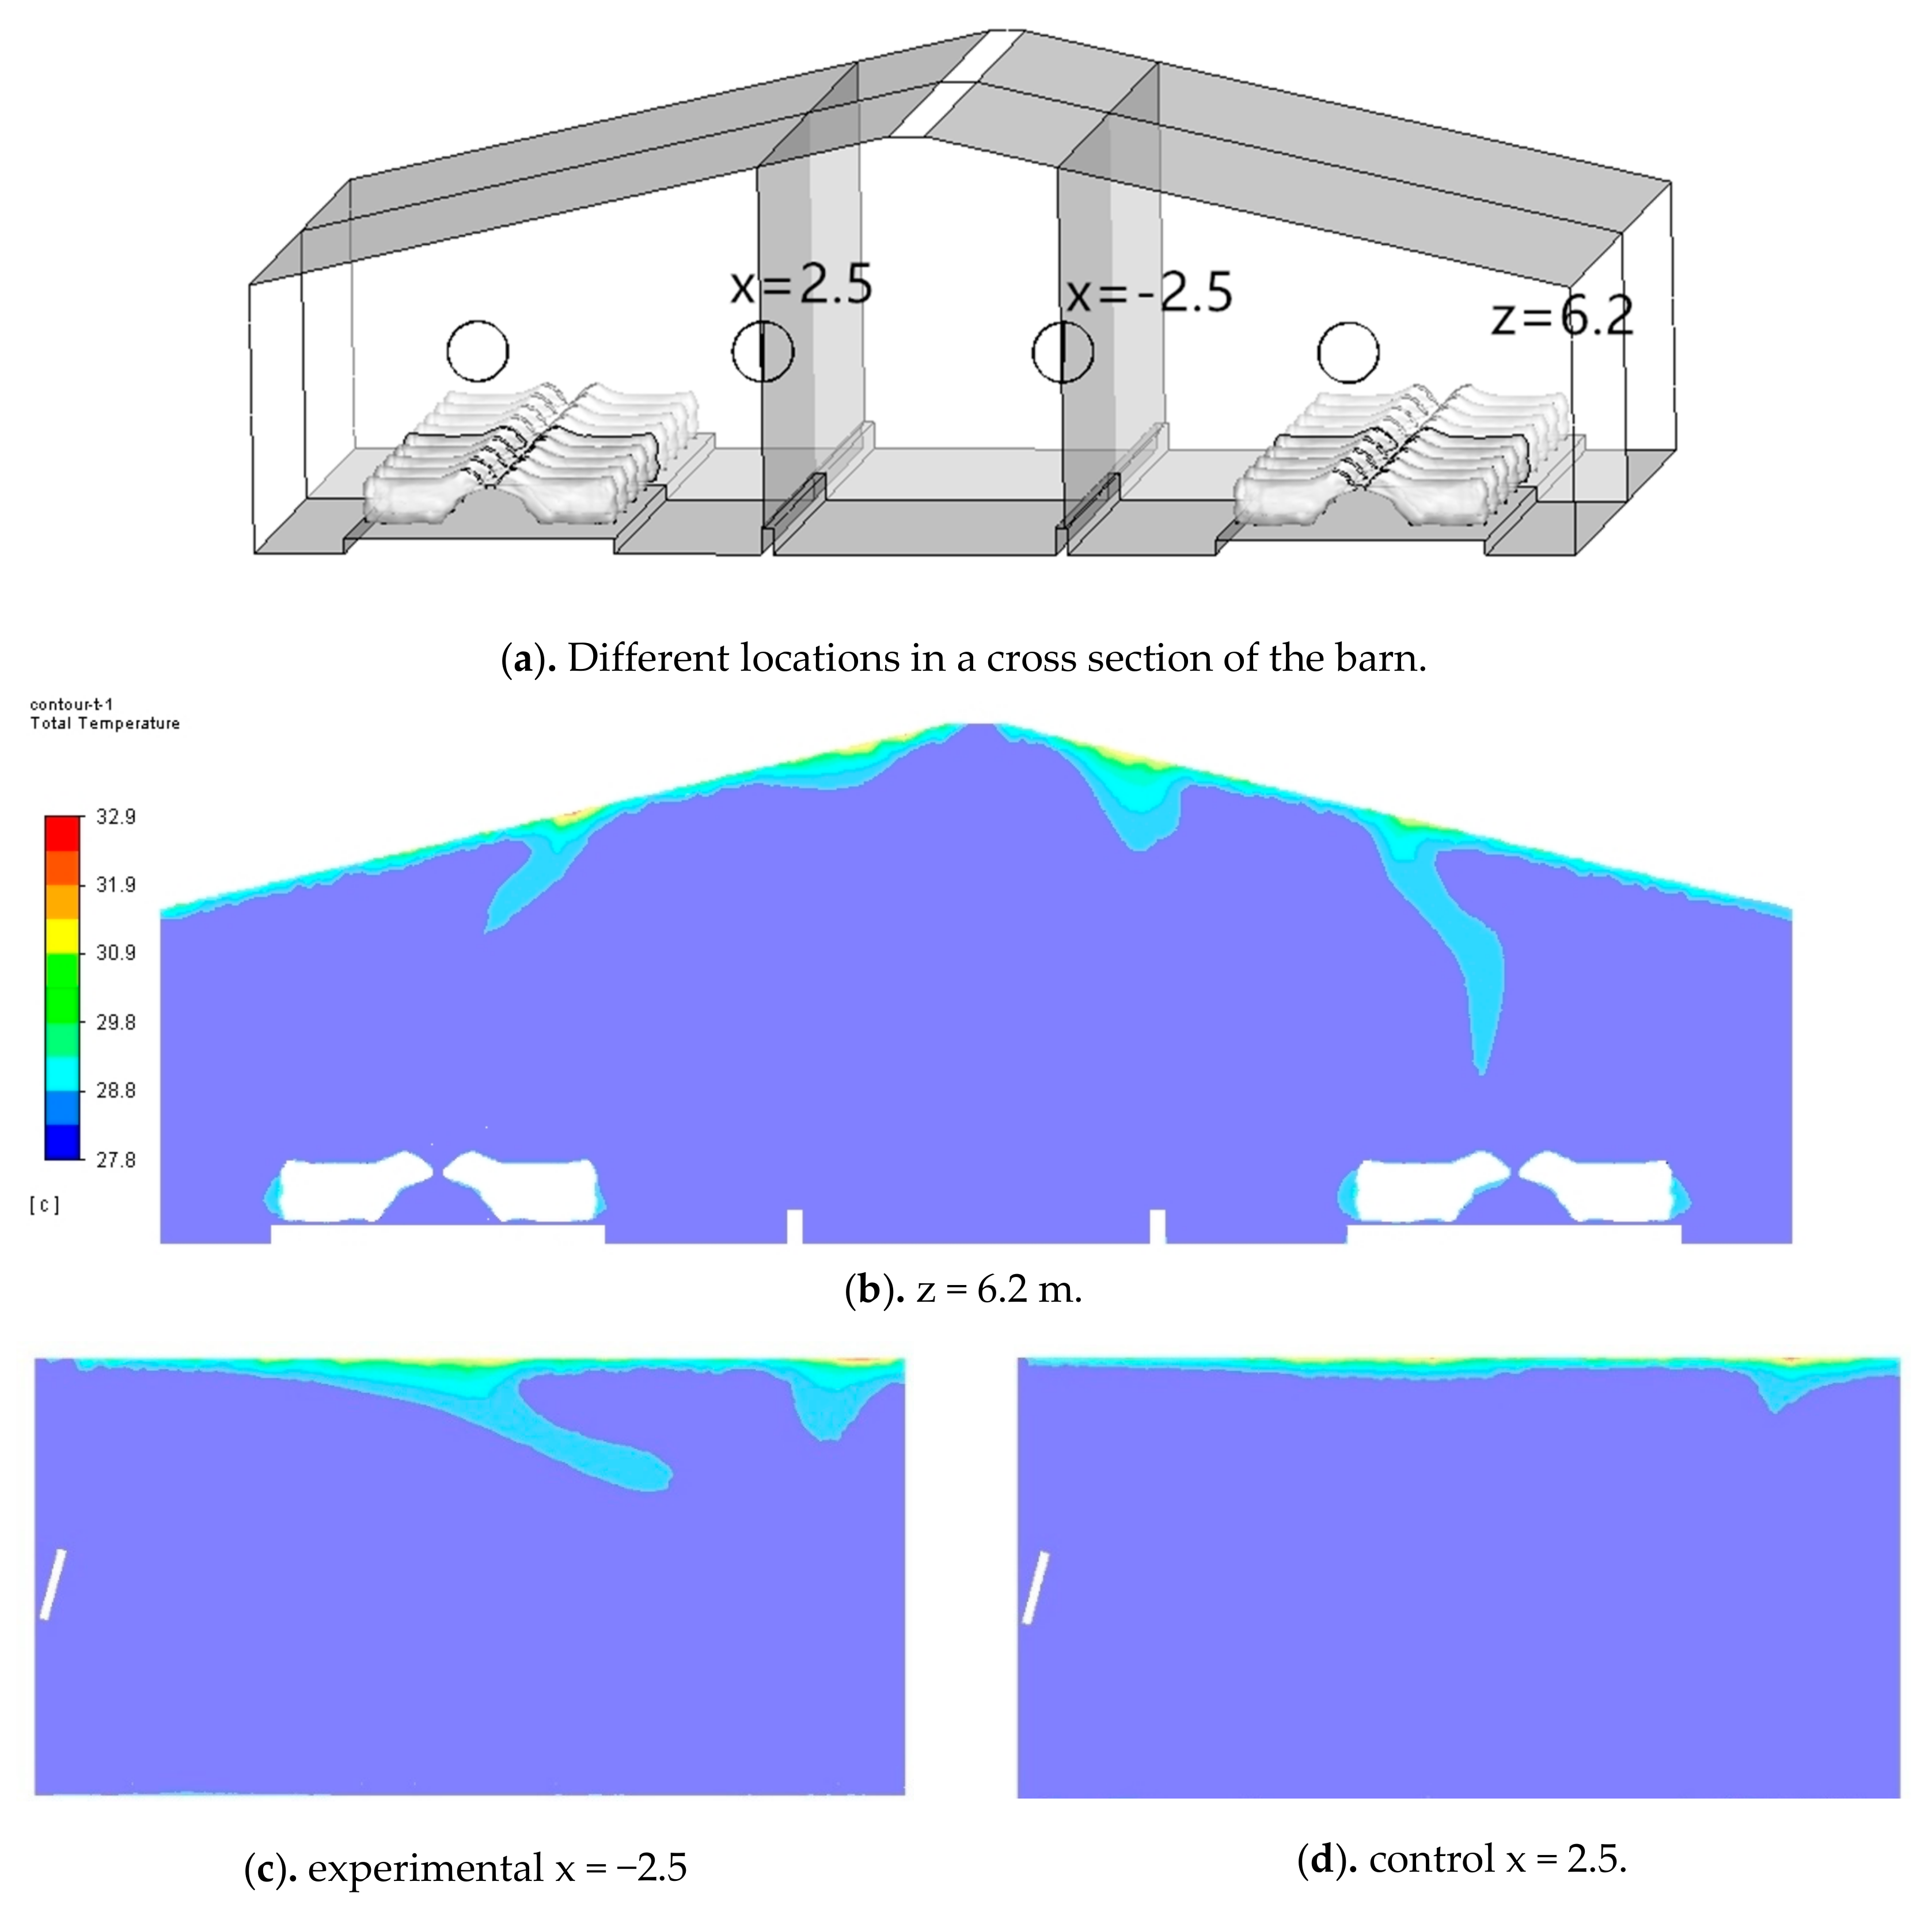
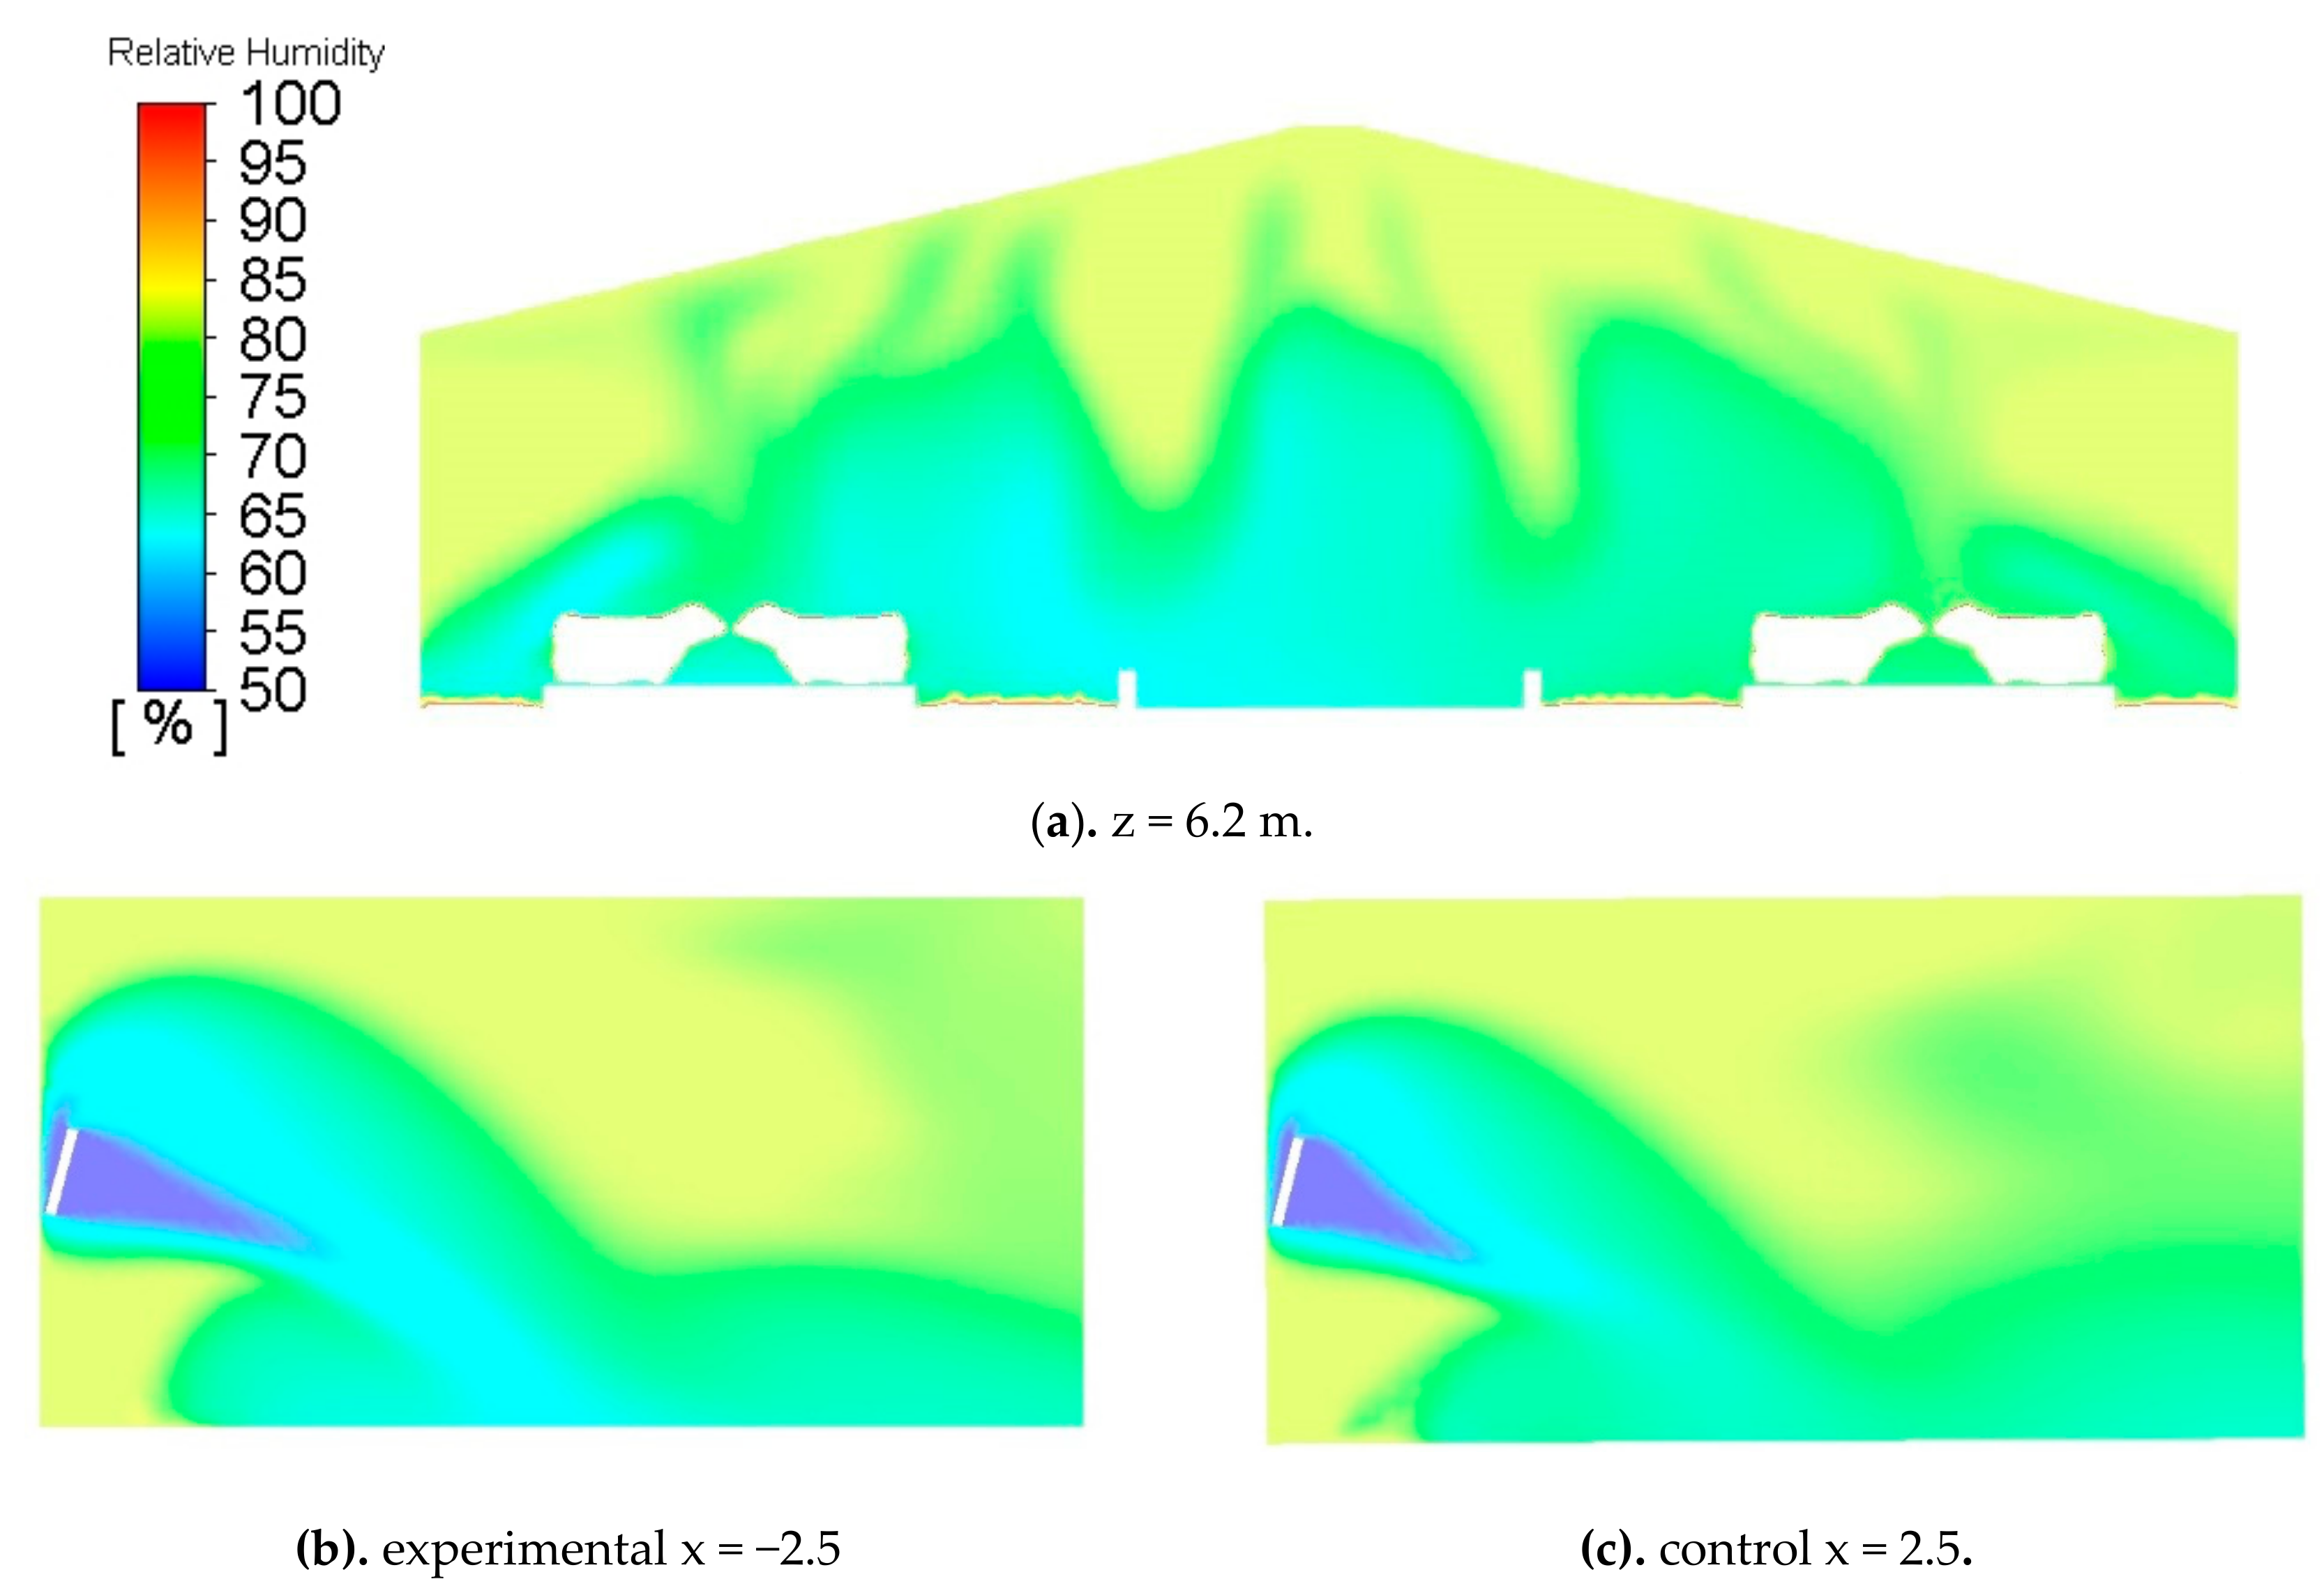
3.3.1. Model Validation
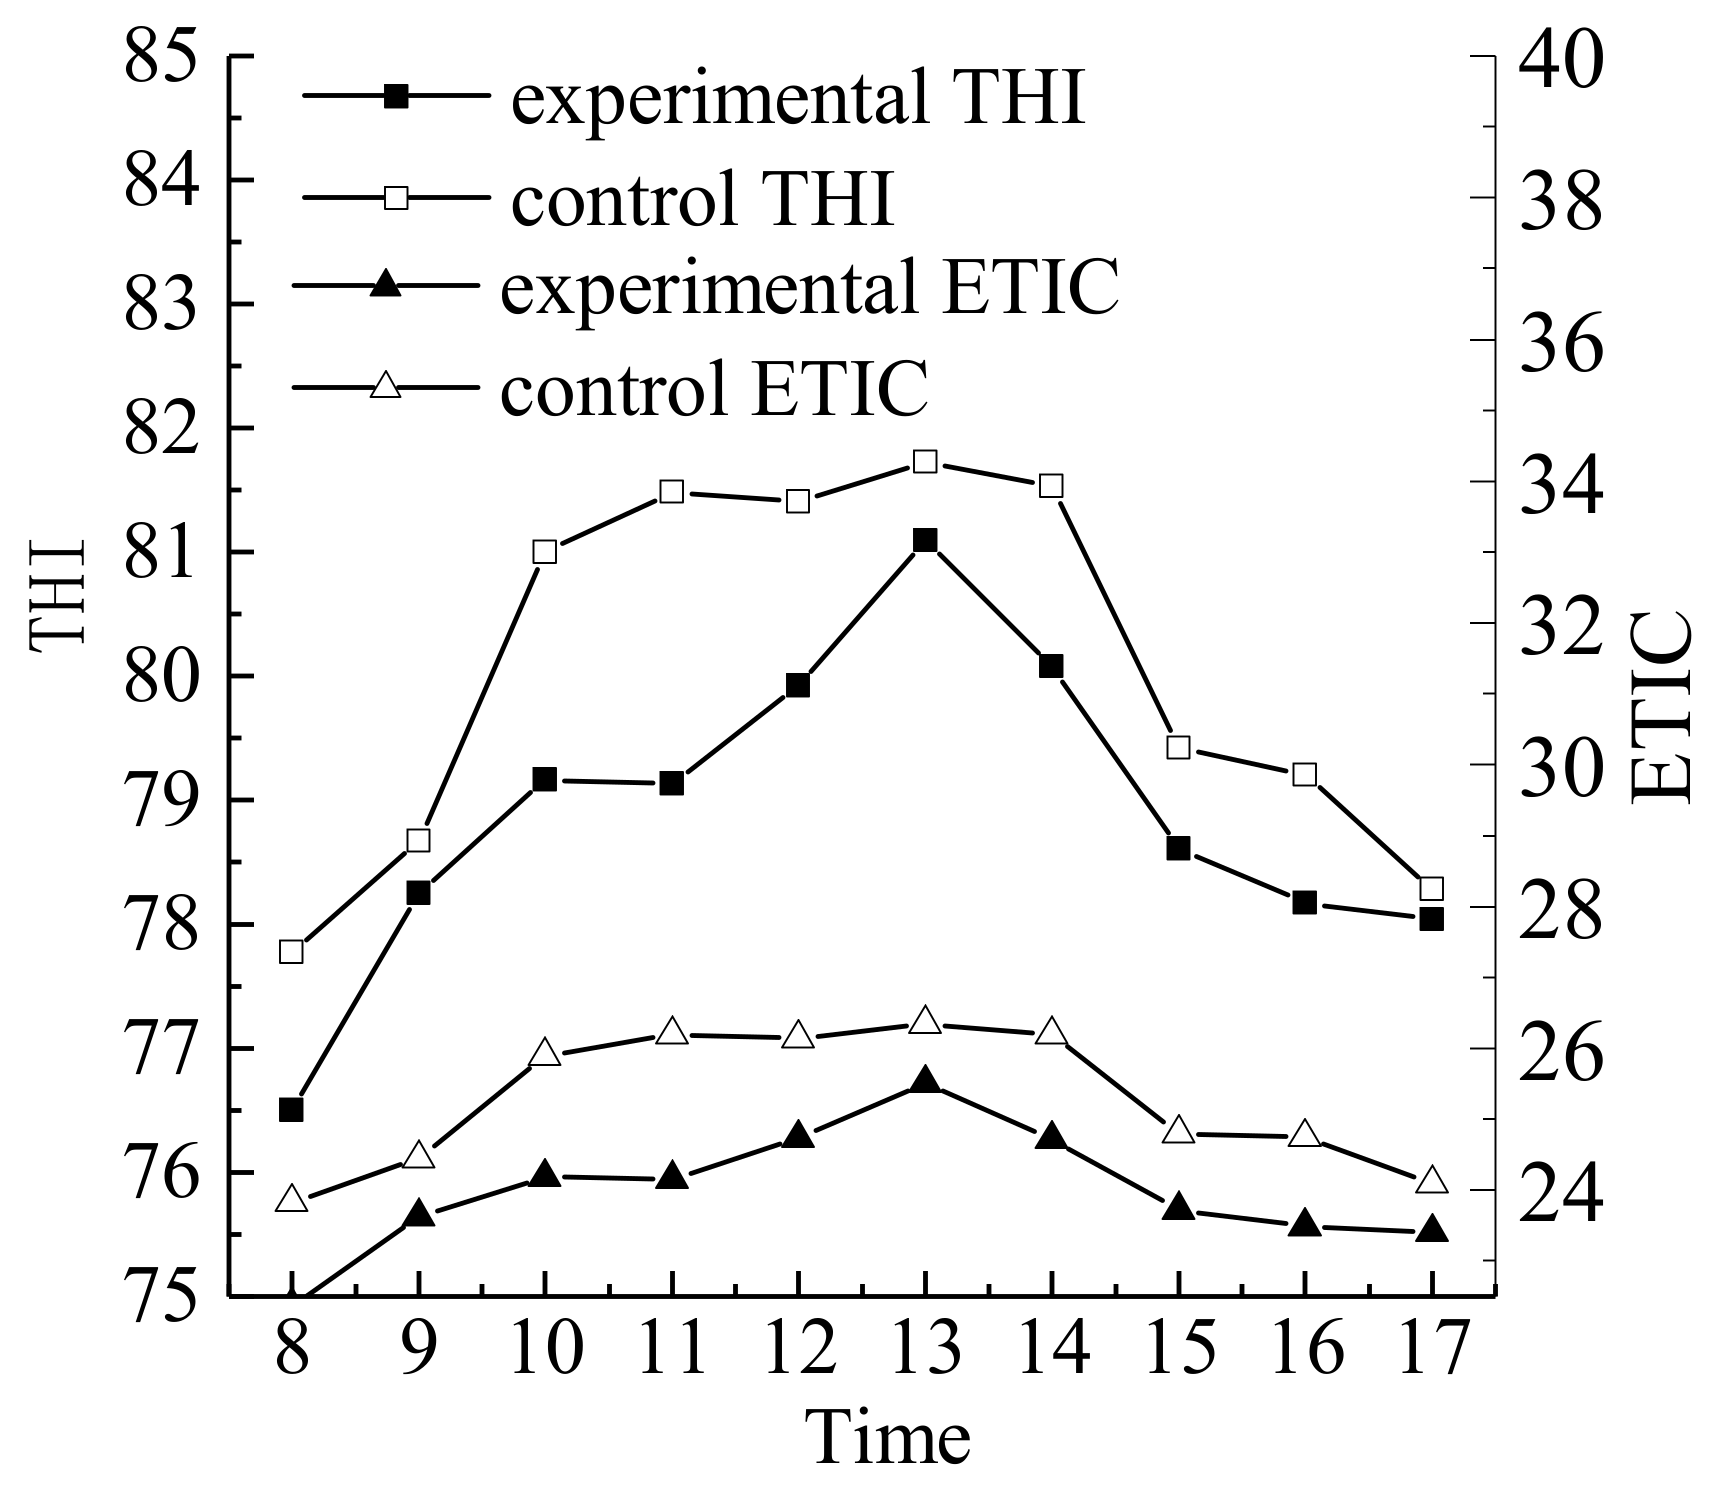
In order to verify the accuracy of the simulation results, four points, shown in Figure 13 (ABCD), were selected to measure the wind speed, and the simulated values were compared with the measured values by a t-test. The variations of wind speed are shown in Figure 13. The test showed p = 0.36, i.e., >0.05. This indicates that there was no significant difference between simulated wind speed and measured wind speed according to the level of alpha = 0.05. For the airflow field, the animal body was simplified to a plate structure in the simulation, and the position of the animal model was fixed; however, cows move during the feeding process, and their position will change in time, which is the main reason for the unsatisfactory verification of wind speed coincidence in simulated and real conditions.
The temperature distribution in the cowshed is shown in Figure 14. The figure shows that in the whole model, the longitudinal depth was only 12 m, and the temperature variation in the cowshed was very small. The simulated temperatures in the chosen positions were 29.3 °C and 29.2 °C, respectively. The temperature value was very close to the given measured temperature of 29 °C. The errors calculated by the ratio between the temperature difference and the experimental value were 0.5% and 2.5%, respectively, when the temperature was 29.05 °C in the experimental zone and 28.5 °C in the control zone at 13:00 pm.
The humidity distribution in the cowshed is shown in Figure 15. From Figure 15, it can be seen that humidity in the cross-sectional area of the cowshed was affected by the air flow and concentrated in the upper part of the shed. The relative humidity in the cows’ area was below 75%.
The simulated humidity values at the corresponding positions were 68.3% and 69.5%, respectively. The errors calculated by the ratio between the temperature difference and the experimental value were −12.2% and −22.8%, respectively. The simulation errors were mainly due to the fact that spraying equipment and water vapor in the tank were not considered.

3.3.2. ETIC

The simulation results of ETIC are shown in Figure 16. ETIC values higher than 31 °C correspond to serious heat stress. As can be seen from the figure, the ETIC values in the barn were all higher than 26 °C and lower than 31 °C. Considering the parameter thresholds, the warm and humid wind environment in the barn will cause a moderate heat stress to the cows.
It was found that the cows in the experimental area were in a comfortable state at all times of the day, except at 13:00. The average ETIC value was 24.8 in the experimental area and 26.1 in the control area. The cows were in a moderate heat stress state.
The change of the ETIC value along the fan axis was analyzed, as shown in Figure 17. It was found that when Z = 2.6 m, the lower ETIC value was mainly in the center of the cowshed. With the increase of the distance from the fan, the lower ETIC value should move to the bedding area, and the area with low EITC gradually decreased. Comparing the results of the experimental area with those of the control area, it was found that the lowest ETIC value of the experimental area was always greater than that of the control area.

4. Conclusions

The simulation results and laboratory study results showed that the diffuser with an elevation angle of 10° performed better than that with an elevation angle of 0°, showing increased jet lengths, flow flux, and energy efficiency by 0.5 m, 0.69%, and 1.39%, respectively, and attaining greater axial wind speeds and better non-uniformity coefficients at the dairy cattle height. Hence, this is the most appropriate diffuser for an MFF prototype.
Through on-site controlled trials, we found the 10°/150°/250 mm diffusers increased the overall average wind speeds by 9.4%. Finally, on the basis of the CFD simulation of a barn, the ETIC, which considers the effect of air velocity, showed that the environment caused moderate heat stress only at 13:00, but not at other times of the day. Therefore, ETIC is more accurate to evaluate cows’ heat stress.

Author Contributions

Formal analysis, Y.Z.; Funding acquisition, Z.S.; Writing—original draft, C.Y.; Writing—review & editing, T.D.

Funding

This study was funded by the National Key Research and Development Program Special Project (2018YFF0213604) and the China Agricultural Research System (CARS-36).

Conflicts of Interest

The authors declare no conflict of interest.

References

  1. Das, R.; Sailo, L.; Verma, N.; Bharti, P.; Saikia, J. Impact of heat stress on health and performance of dairy animals: A review. Vet. World 2016, 9, 260. [Google Scholar] [CrossRef] [PubMed]
  2. Rhoads, R.P.; Baumgard, L.H.; Suagee, J.K.; Sanders, S.R. Nutritional interventions to alleviate the negative consequences of heat stress. Adv. Nutr. 2013, 4, 267–276. [Google Scholar] [CrossRef] [PubMed]
  3. Smith, D.L.; Smith, T.; Rude, B.J.; Ward, S.H. Comparison of the effects of heat stress on milk and component yields and somatic cell score in Holstein and Jersey cows. J. Dairy Sci. 2013, 96, 3028–3033. [Google Scholar] [CrossRef] [PubMed]
  4. St-Pierre, N.R.; Cobanov, B.; Schnitkey, G. Economic Losses from Heat Stress by US Livestock Industries. J. Dairy Sci. 2003, 86, E52–E77. [Google Scholar] [CrossRef]
  5. Bottcher, R.W.; Magura, J.R.; Young, J.S.; Baughman, G.R. Baughman. Effects of Tilt Angles on Airflow for Poultry House Mixing Fans. Appl. Eng. Agric. 1995, 11, 721–730. [Google Scholar] [CrossRef]
  6. Calegari, F.; Calamari, L.; Frazzi, E. Cooling systems of the resting area in free stall dairy barn. Int. J. Biometeorol. 2016, 60, 605–614. [Google Scholar] [CrossRef] [PubMed]
  7. Gebremedhin, K.G.; Wu, B. Simulation of sensible and latent heat losses from wet-skin surface and fur layer. J. Therm. Biol. 1998, 27, 291–297. [Google Scholar] [CrossRef]
  8. Cory, W.T.W. Fans & Ventilation: A Practical Guide; Elsevier: Amsterdam, The Netherlands, 2010. [Google Scholar]
  9. Jung, U.-H.; Kim, J.-H.; Kim, J.-H.; Park, C.-H.; Jun, S.-O.; Choi, Y.-S. Optimum design of diffuser in a small high-speed centrifugal fan using CFD & DOE. J. Mech. Sci. Technol. 2016, 30, 1171–1184. [Google Scholar]
  10. Sasaki, S.; Suzuki, K.; Onomichi, Y.; Hayashi, H. Influence of diffuser on aerodynamic noise of a forward curved fan. J. Therm. Sci. 2013, 22, 433–438. [Google Scholar] [CrossRef]
  11. Ding, T.; Fang, L.; Ni, J.-Q.; Shi, Z.; Sun, B.; Wang, Z.; Yao, C. Optimization of Diffuser Parameters for Mixing Fans in Agricultural Buildings. Appl. Eng. Agric. 2017, 34, 437–444. [Google Scholar] [CrossRef]
  12. Wang, X.; Bjerg, B.S.; Choi, C.Y.; Zong, C.; Zhang, G. A review and quantitative assessment of cattle-related thermal indices. J. Therm. Biol. 2018, 77, 24–37. [Google Scholar] [CrossRef] [PubMed]
  13. Li, S.; Gebremedhin, K.G.; Lee, C.N.; Collier, R.J. Evaluation of Thermal Stress Indices for Cattle. In Proceedings of the 2009 ASABE Annual Meeting, Reno, NV, USA, 21–24 June 2009. [Google Scholar]
  14. Mader, T.L.; Davis, M.S.; Brown-Brandl, T. Environmental factors influencing heat stress in feedlot cattle. J. Anim. Sci. 2006, 84, 712–719. [Google Scholar] [CrossRef] [PubMed]
  15. Wang, X.; Gao, H.; Gebremedhin, K.G.; Bjerg, B.S.; Van Os, J.; Tucker, C.B.; Zhang, G. A Predictive Model of Equivalent Temperature Index for Dairy Cattle (ETIC). J. Therm. Biol. 2018, 76, 165–170. [Google Scholar] [CrossRef] [PubMed]
  16. Bohmanova, J.; Misztal, I.; Cole, J.B. Temperature-Humidity Indices as Indicators of Milk Production Losses due to Heat Stress. J. Dairy Sci. 2007, 90, 1947–1956. [Google Scholar] [CrossRef] [PubMed]
  17. Hahn, G.L.; Mader, T.L.; Eigenberg, R.A. Perspective on development of thermal indices for animal studies and management. EAAP Tech. Ser. 2003, 7, 31–44. [Google Scholar]
  18. Deng, S.; Shi, Z.; Fan, L.; Ding, T. Optimization of installation parameters of mixing fans in open dairy cow house based on CFD. Nongye Jixie Xuebao = Trans. Chin. Soc. Agric. Mach. 2013, 44, 269–274. [Google Scholar]
Figure 1. Length (L), circumferential angles (θ), elevation angles (α) of the diffuser.
Energies 12 04315 g001
Figure 2. Experimental (left) and control (right) barns.
Energies 12 04315 g002
Figure 3. Measurement points.
Energies 12 04315 g003
Figure 4. 3-D model of a barn.
Energies 12 04315 g004
Figure 5. Mesh of the cow body.
Energies 12 04315 g005
Figure 6. Relationship between the parameters of the diffuser and the jet length.
Energies 12 04315 g006
Figure 7. Comparison of average wind speeds.
Energies 12 04315 g007
Figure 8. Comparison of non-uniformity coefficients.
Energies 12 04315 g008
Figure 9. Overall wind speed distribution over the feeding areas in the experimental and control barns.
Energies 12 04315 g009
Figure 10. Overall wind speed distribution over the bedding areas in the experimental and control barns.
Energies 12 04315 g010
Figure 11. Overall temperature (T) and relative humidity (RH) over the bedding areas in the experimental and control barns.
Energies 12 04315 g011
Figure 12. Cow body temperature.
Energies 12 04315 g012
Figure 13. Air velocities in simulated and real conditions.
Energies 12 04315 g013
Figure 14. Temperature profile at different cross-section locations.
Energies 12 04315 g014
Figure 15. Relative humidity distribution at different cross-section locations.
Energies 12 04315 g015
Figure 16. Temperature-humidity index (THI equivalent temperature index for cattle (ETIC) at different times of the day.
Energies 12 04315 g016
Figure 17. Profiles of ETIC values.
Energies 12 04315 g017
Table 1. Variance analysis.
ParametersSum of SquareDegree of FreedomMean Square ErrorFSignificance
α0.61420.3072.141(*)
θ7.75423.87727.032(**)
L1.17620.5884.101(*)
0.58440.1461.021-
a L0.27540.0690.483-
θL0.78840.1971.378-
Error1.14780.143
*, ** represents the importance of various factors on the performance of the MFF based on the F value.
Table 2. Fan performance under different values of α.
α°Average Power
kW
Flow Flux m3/hEnergy Efficiency
(m3/h)/kW
Difference of Flow FluxDifference of Energy Efficiency
prototype57912,91822.3--
057813,27323.0--
557013,33523.40.47%1.88%
1057413,36423.30.69%1.39%
1557613,34523.20.54%0.89%
Table 3. Average cow body temperature at different times of the day.
TimeExperimental Temperature (°C)Control temperature (°C)Difference
BodyRectalAverageBodyRectalAverage°C
9:0034.0 ± 0.2 a38.8 ± 0.2 a35.4435. 0 ± 0.3 a38.8 ± 0.2 b36.14−0.7
12:0034.9 ± 0.8 a38.6 ± 0.2 a36.0135.8 ± 0.6 a38.9 ± 0.3 a36.73−0.72
15:0035.0 ± 0.4 a38.8 ± 0.1 a35.5435.7 ± 0.4 a38.8 ± 0.2 a36.63−1.09
Note: The different letters (a,b) in the table indicate significant differences at p < 0.01 at different times of the day.
Table 4. Average values of respiratory rate of cows at different times of the day.
TimeExperimental
min−1
Control
min−1
Difference
min−1
9:0068.2 ± 1.7 a 69.2 ± 2.3 a −1.0
12:0068.6 ± 1.5 a 69.3 ± 2.1 a −0.7
15:0067.9 ± 0.7 a 67.6 ± 1.6 a 0.3
Note: The different letters in the table indicate significant differences at p < 0.01 at different times of the day.

