Research on the Interrelation between Temperature Distribution and Dry Band on Wet Contaminated Insulators


Abstract
:
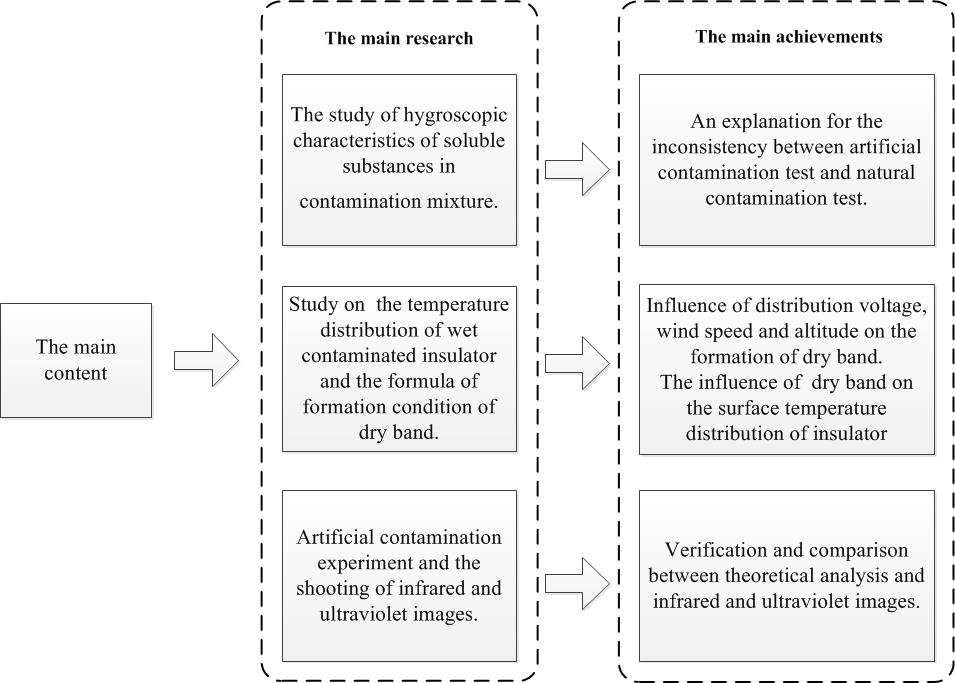
1. Introduction
2. Surface Temperature Distribution of Wet Contaminated Insulators in High Voltage Operation
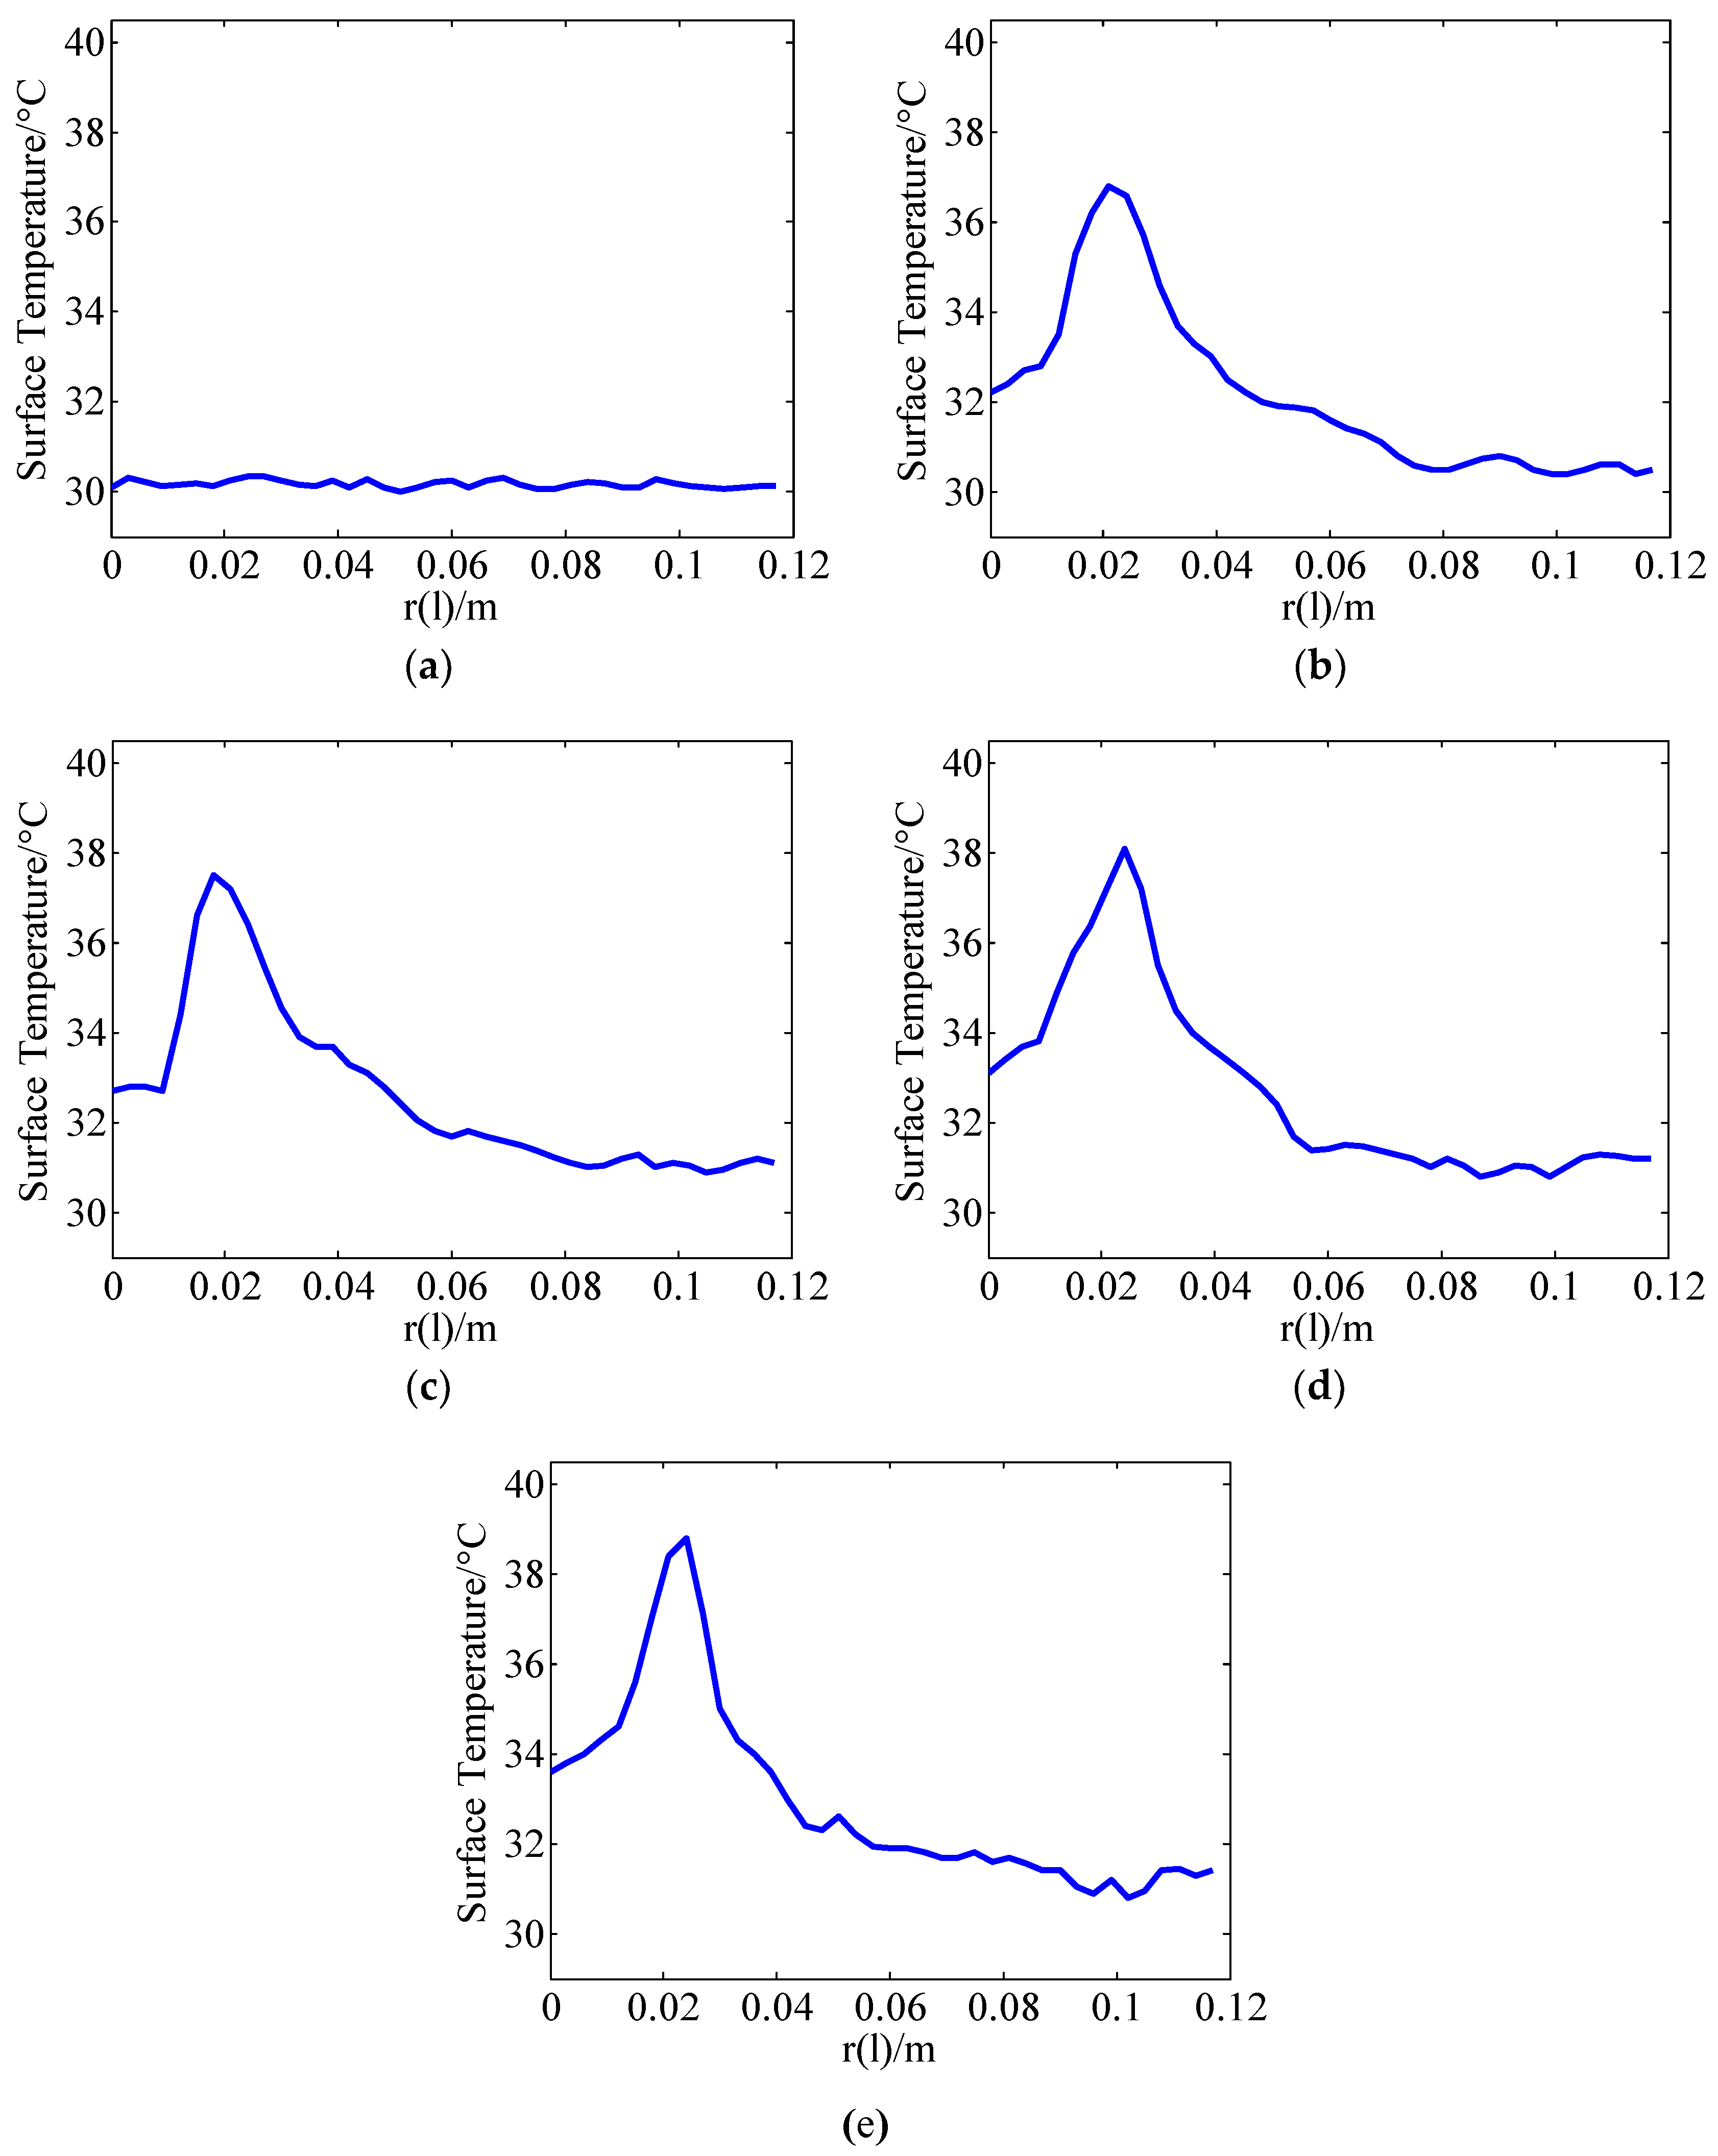
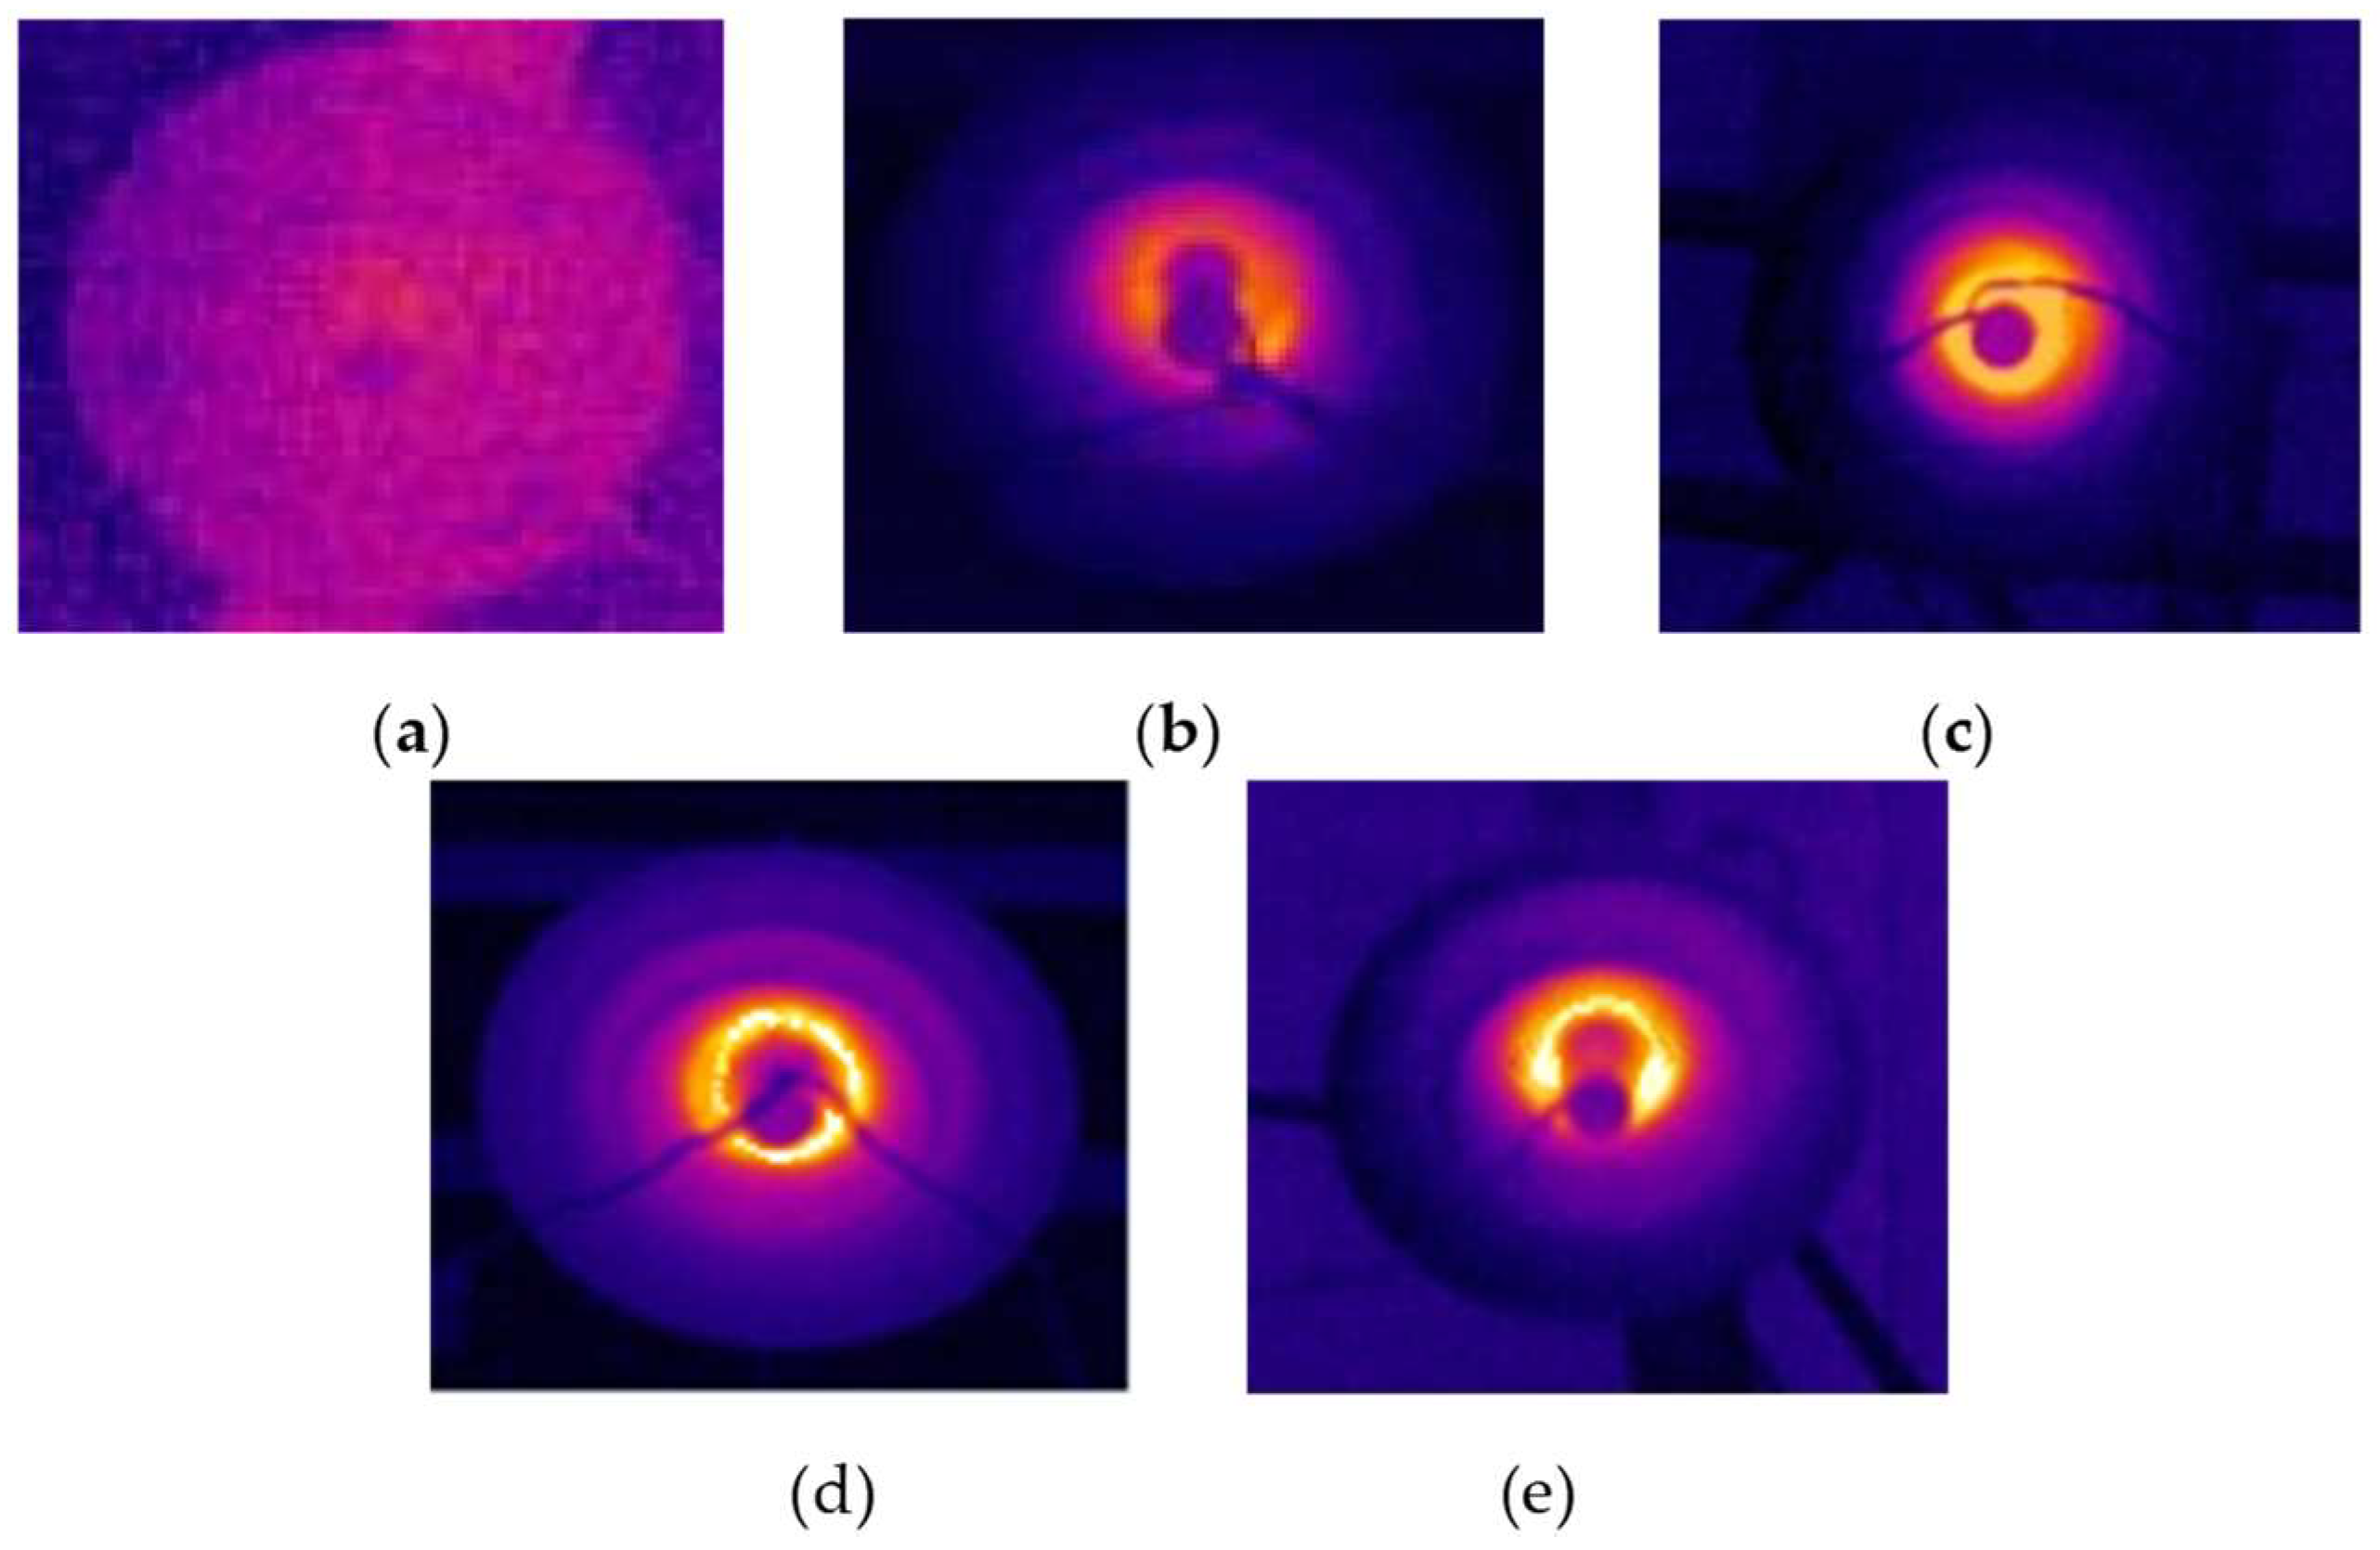
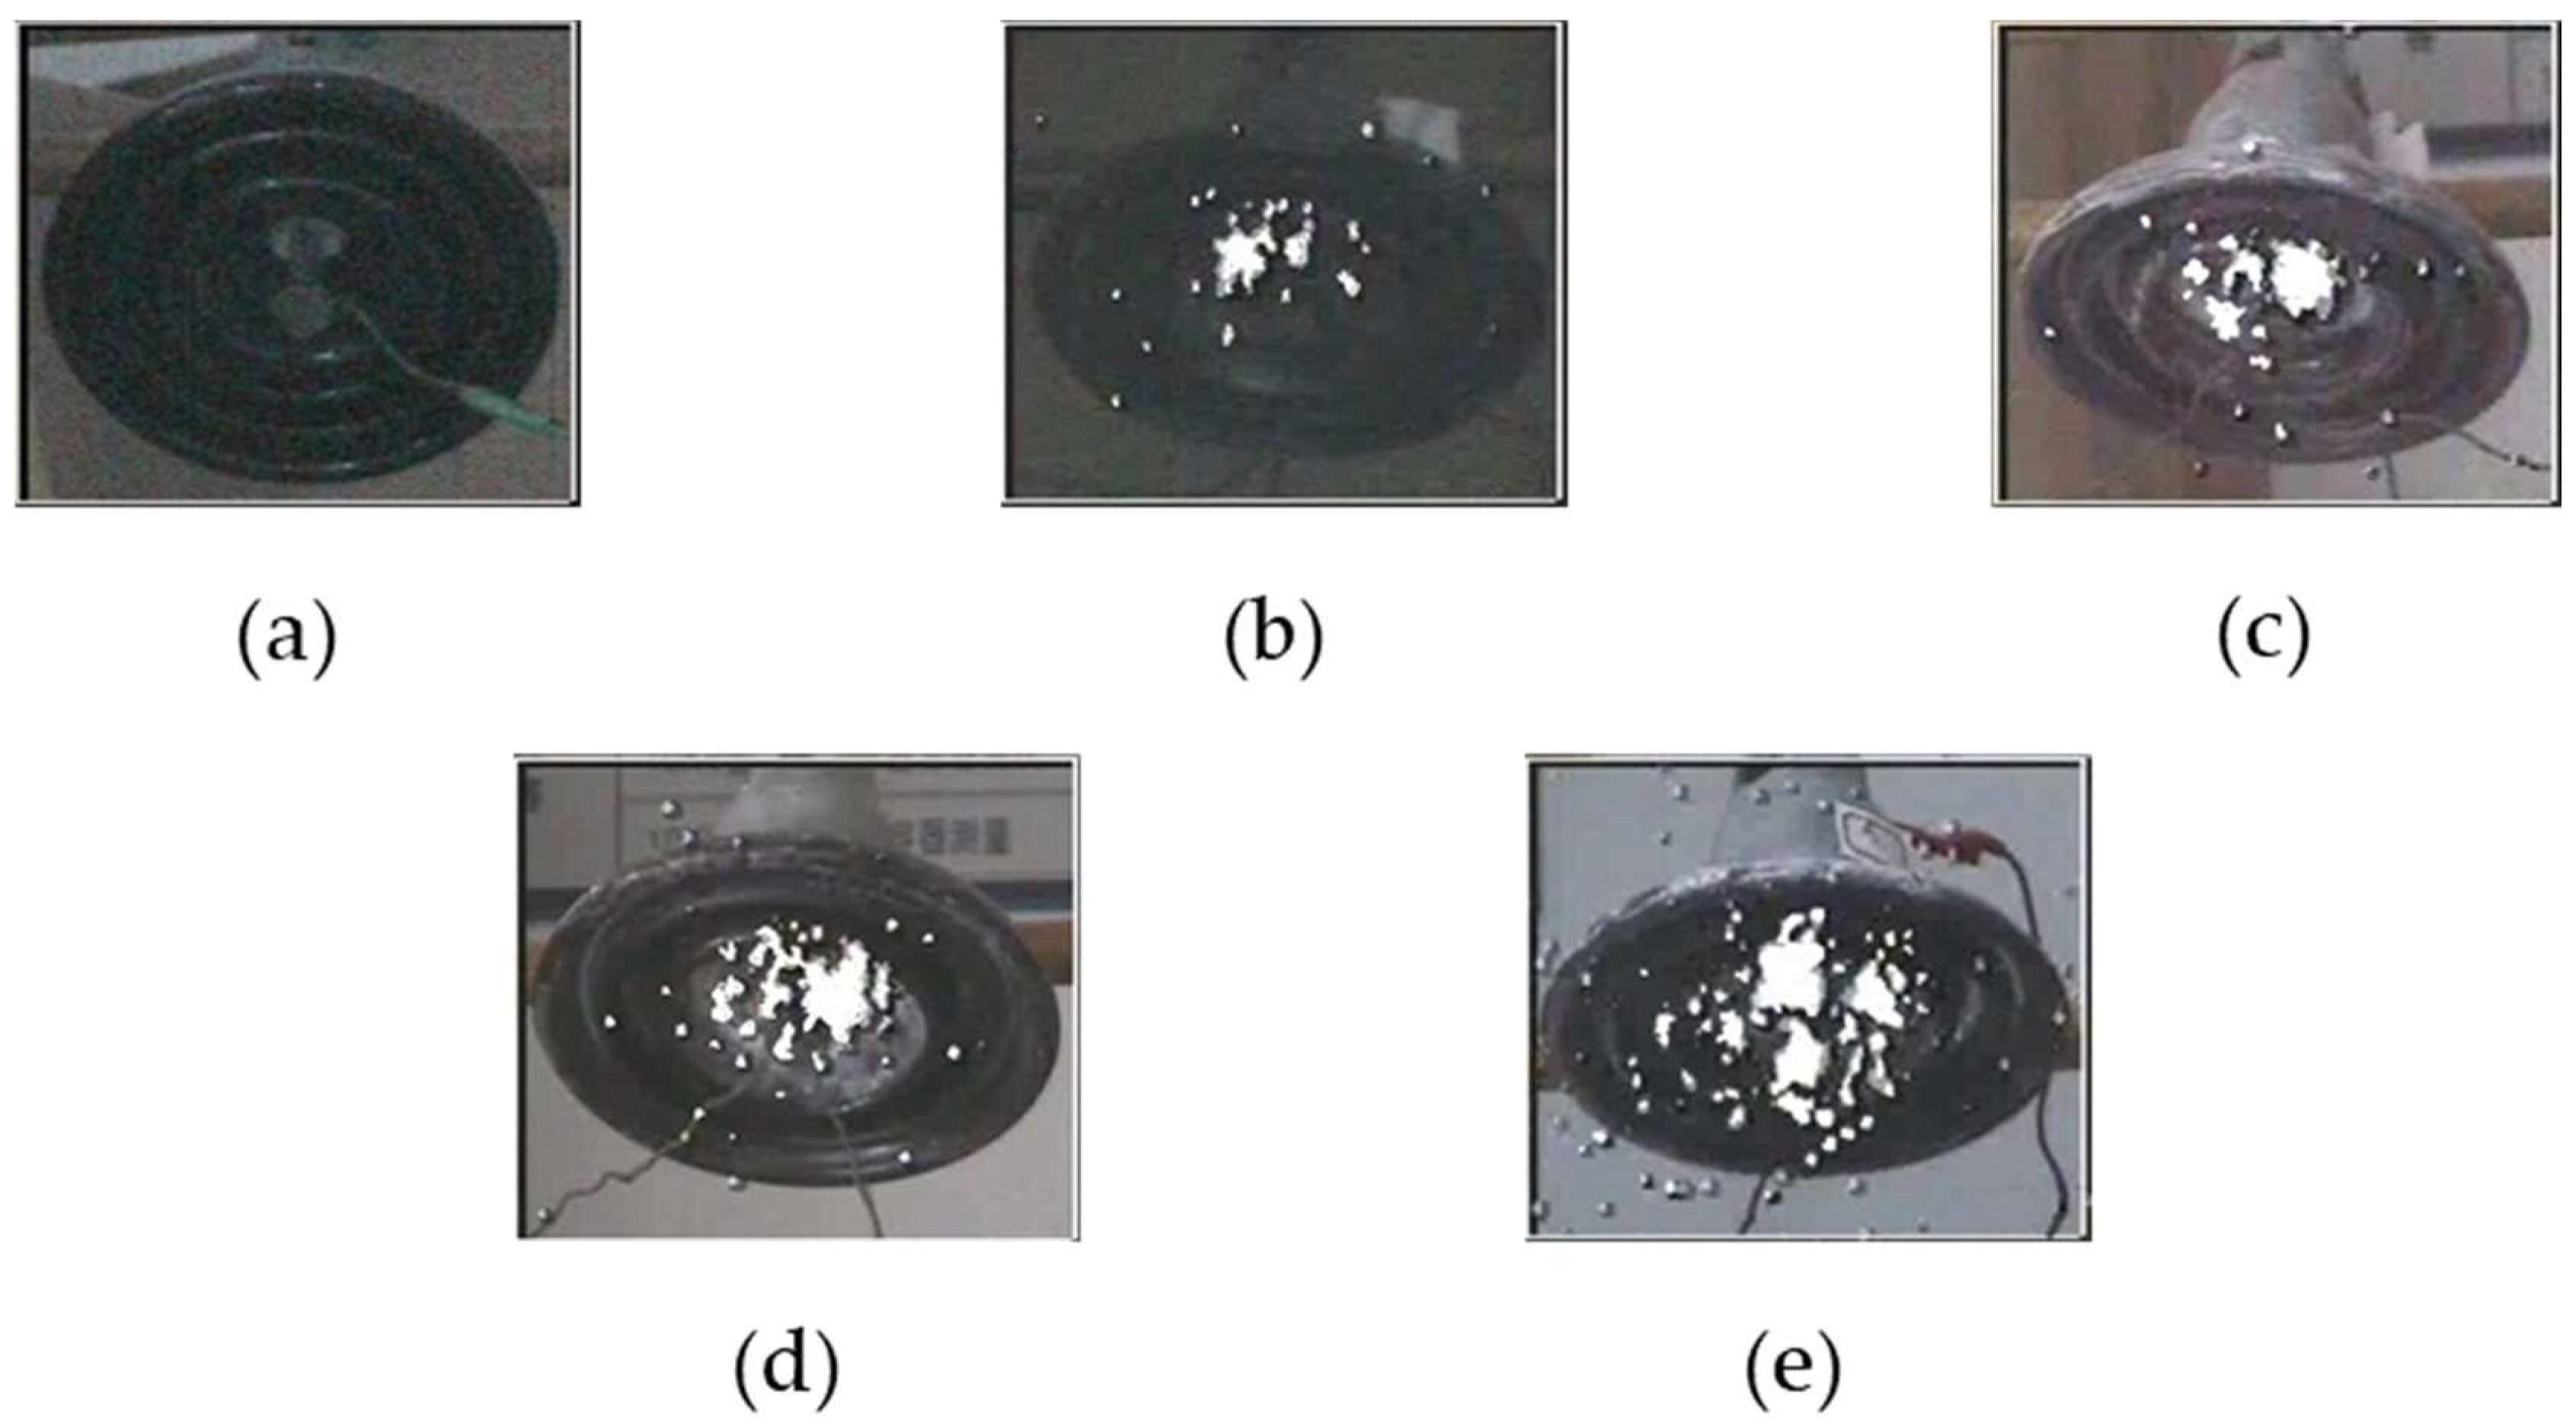
2.1. Measurement of Temperature Distribution on Insulator Surface
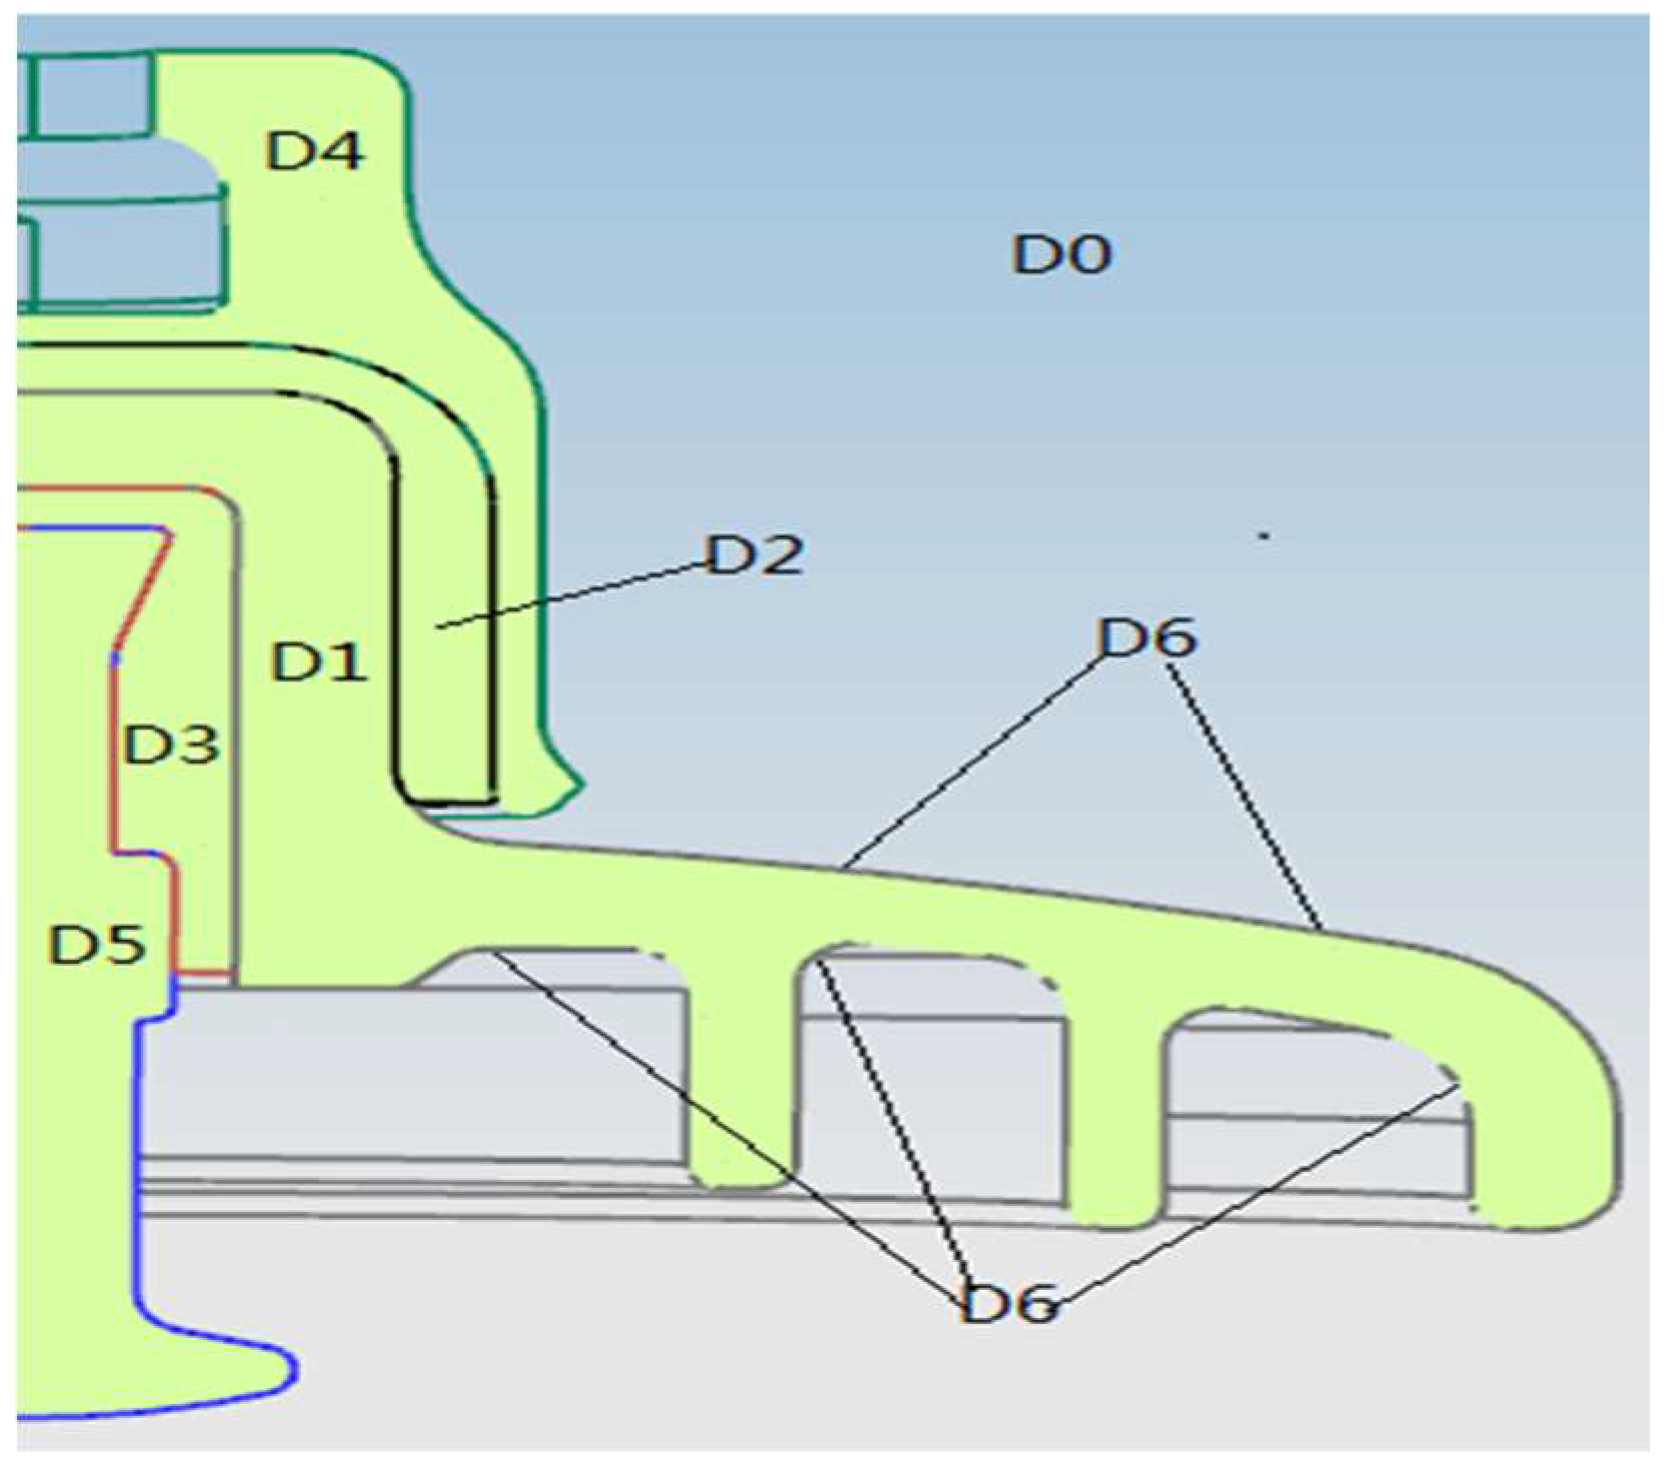
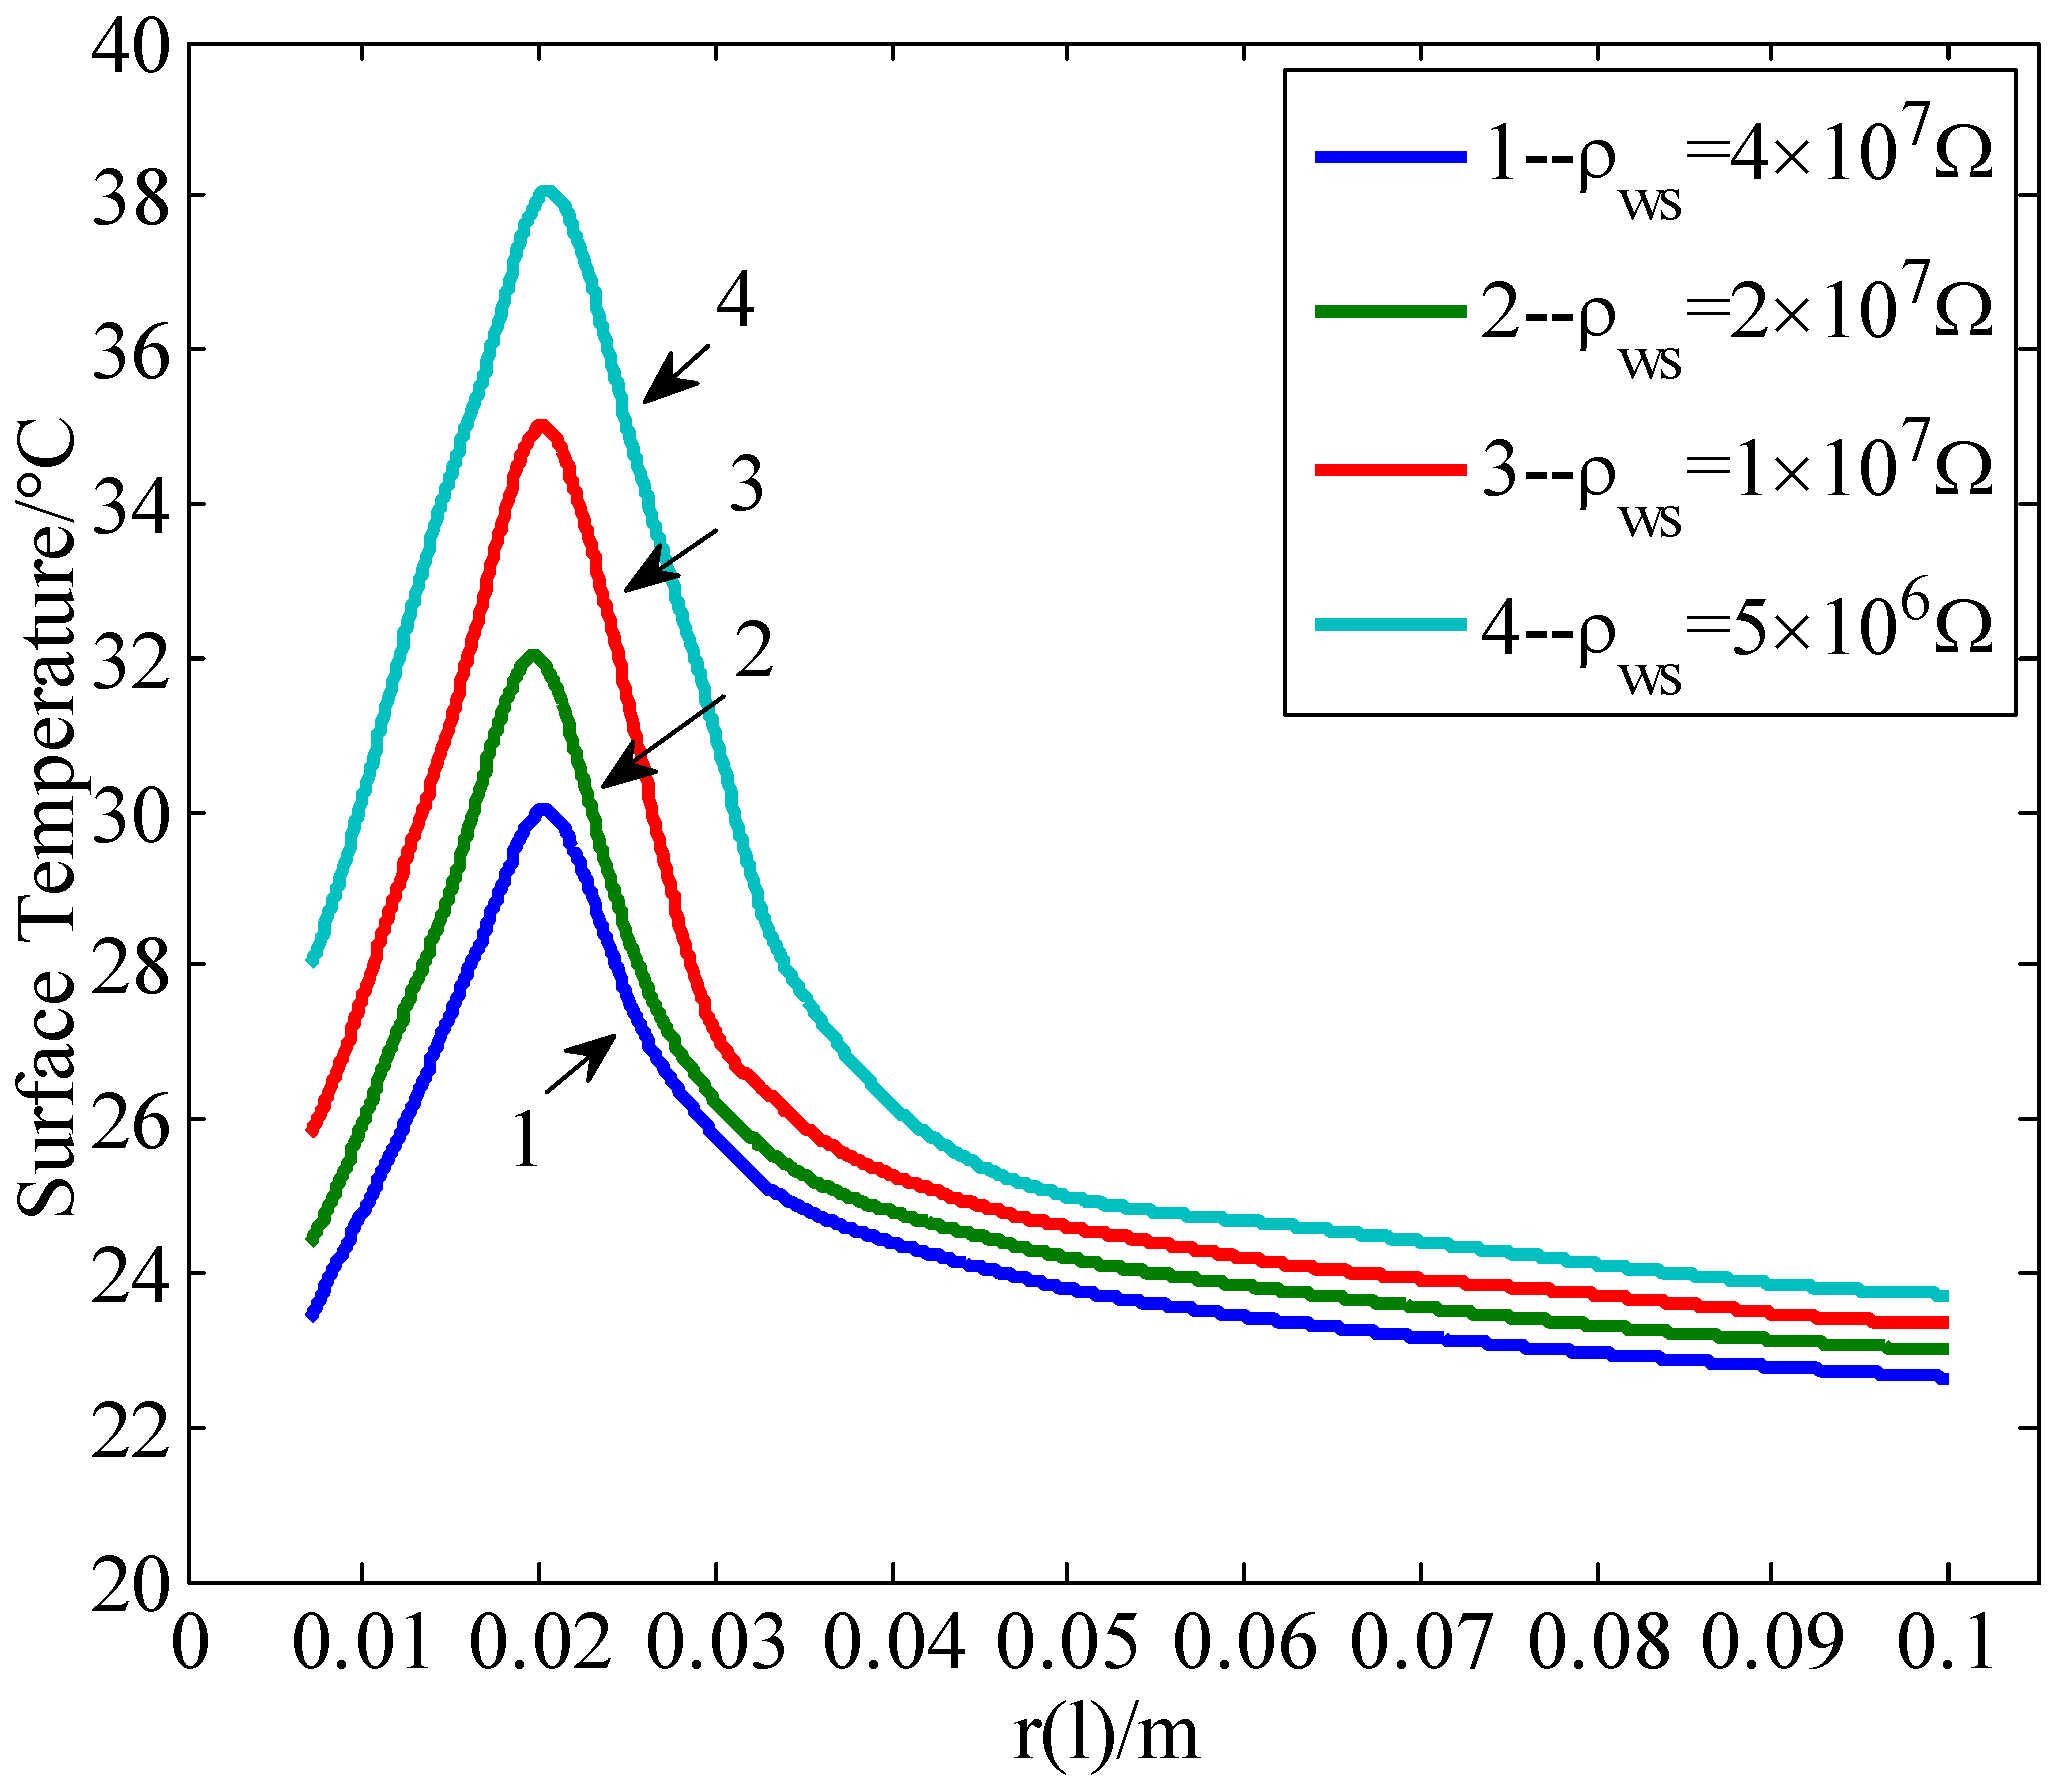
2.2. Analysis of Electrothermal Coupling Temperature Field of Wet Contaminated Insulator
3. Formation of Dry Bands on the Surface of Wet Contaminated Insulators
3.1. Hygroscopicity of Contaminated Layer of Insulator
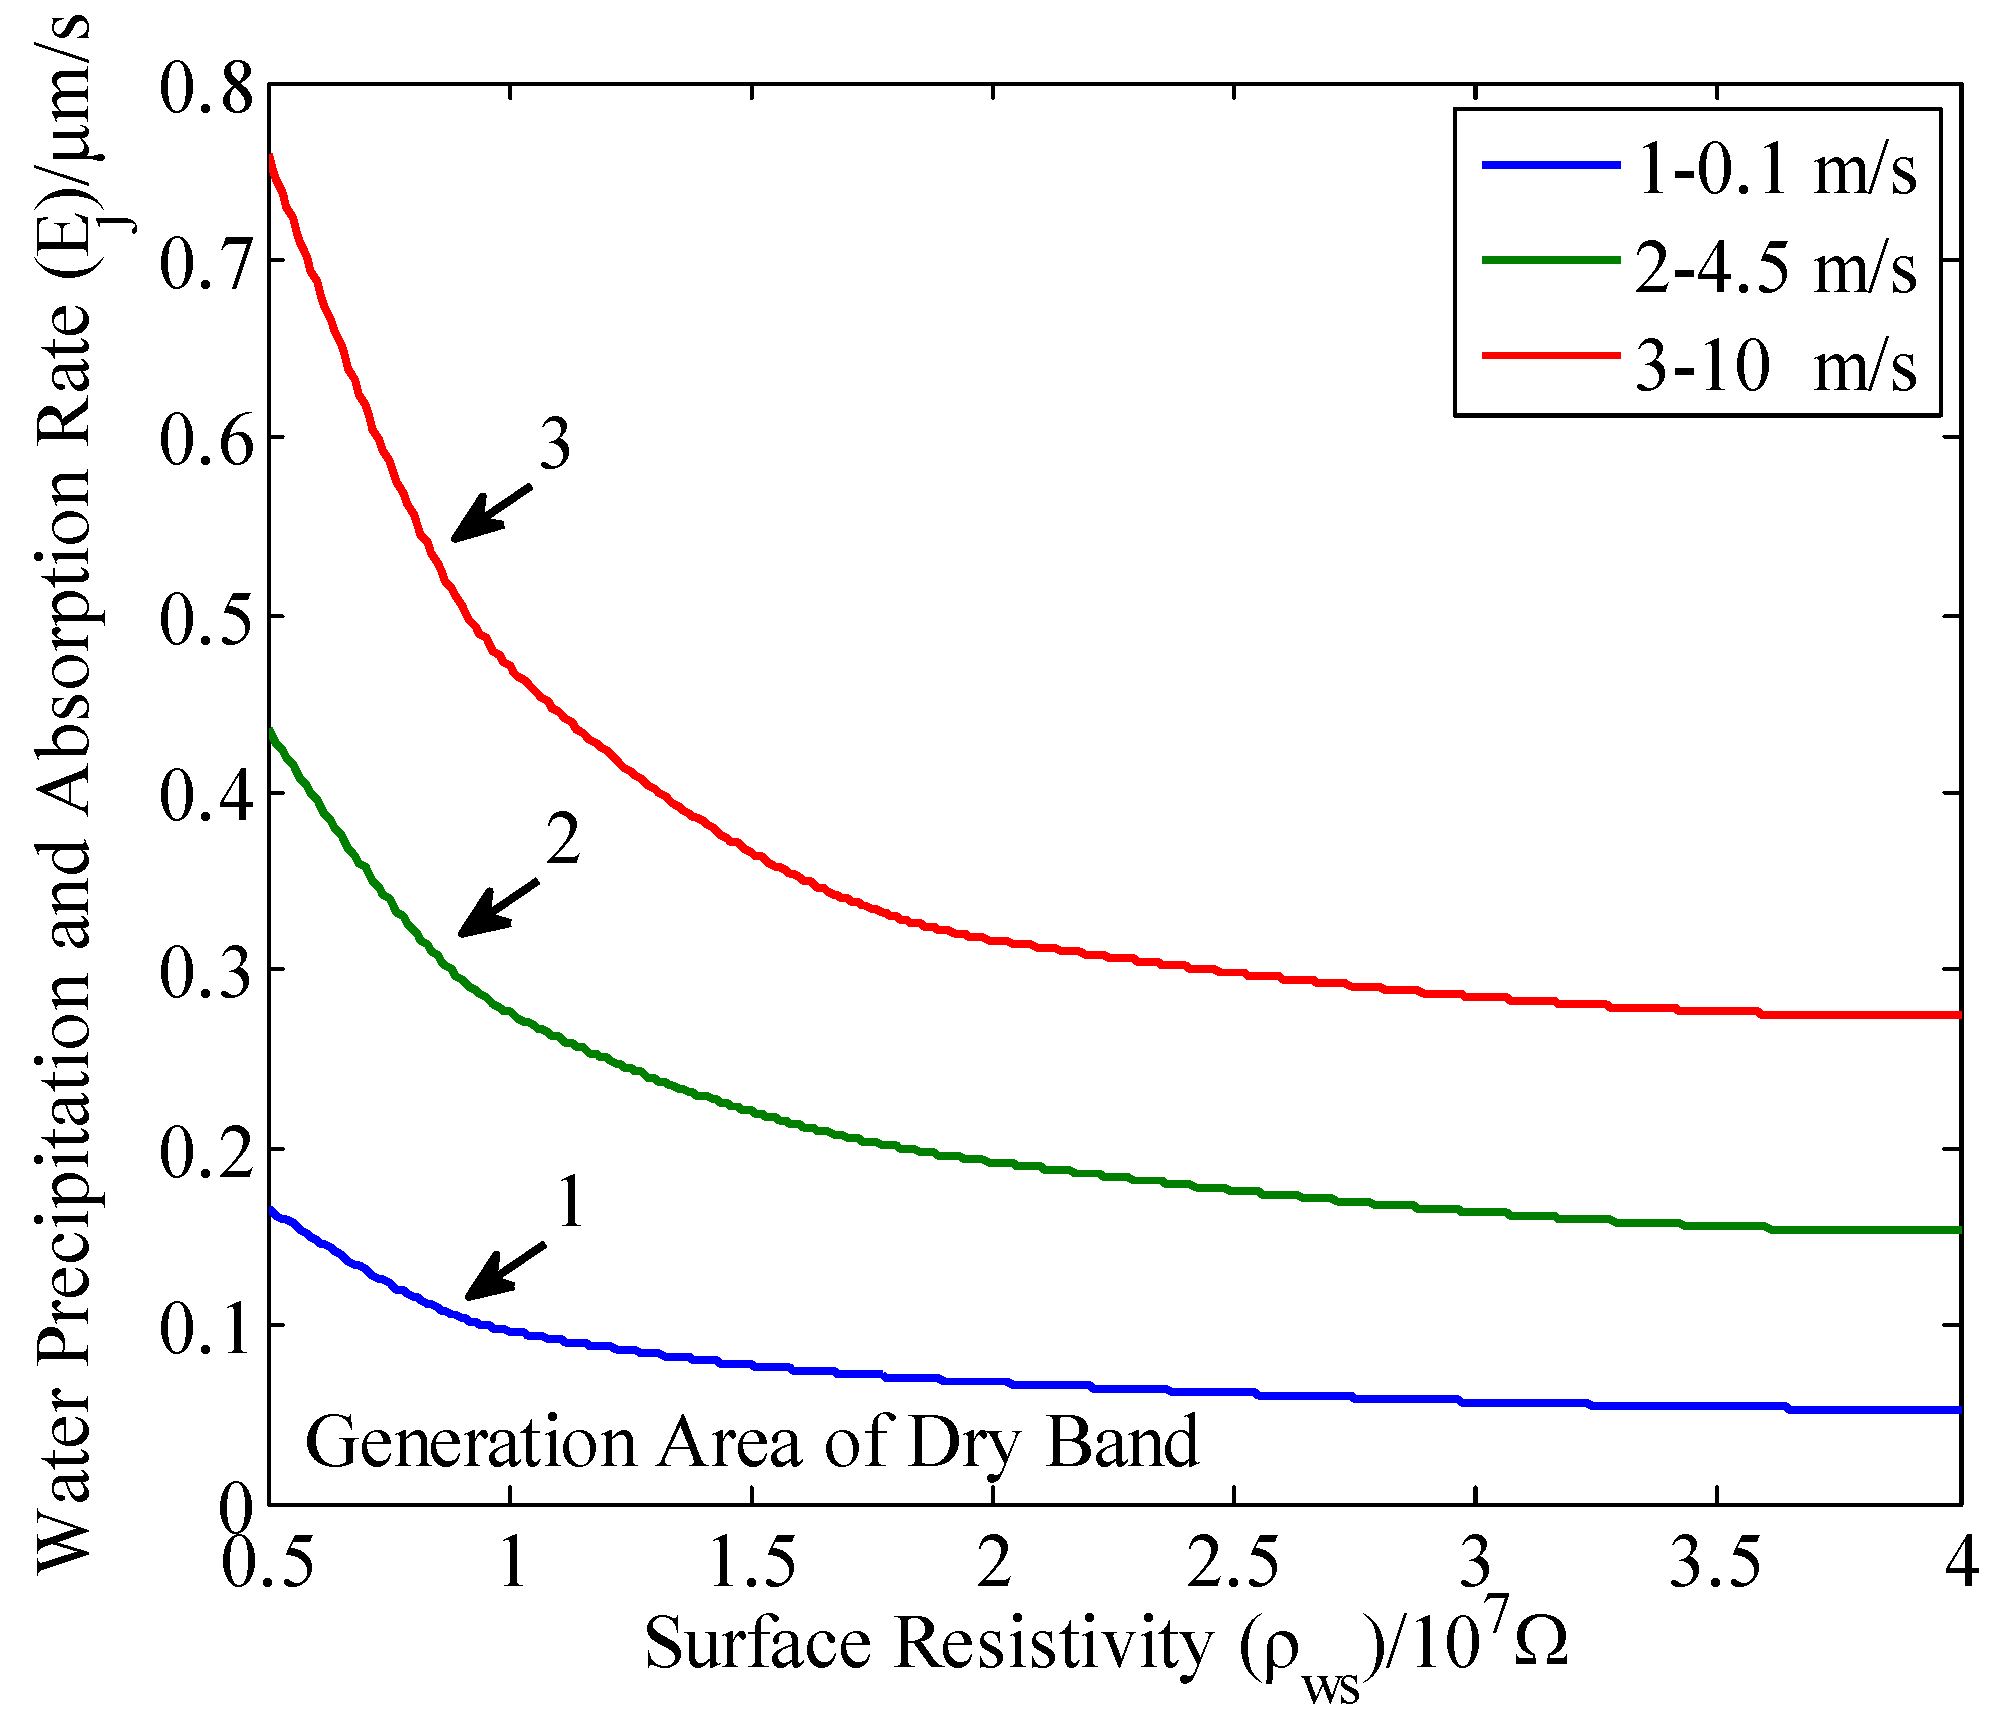
3.2. Evaporation of Water in Contaminated Layer of Insulator
3.3. The Formation of Dry Bands
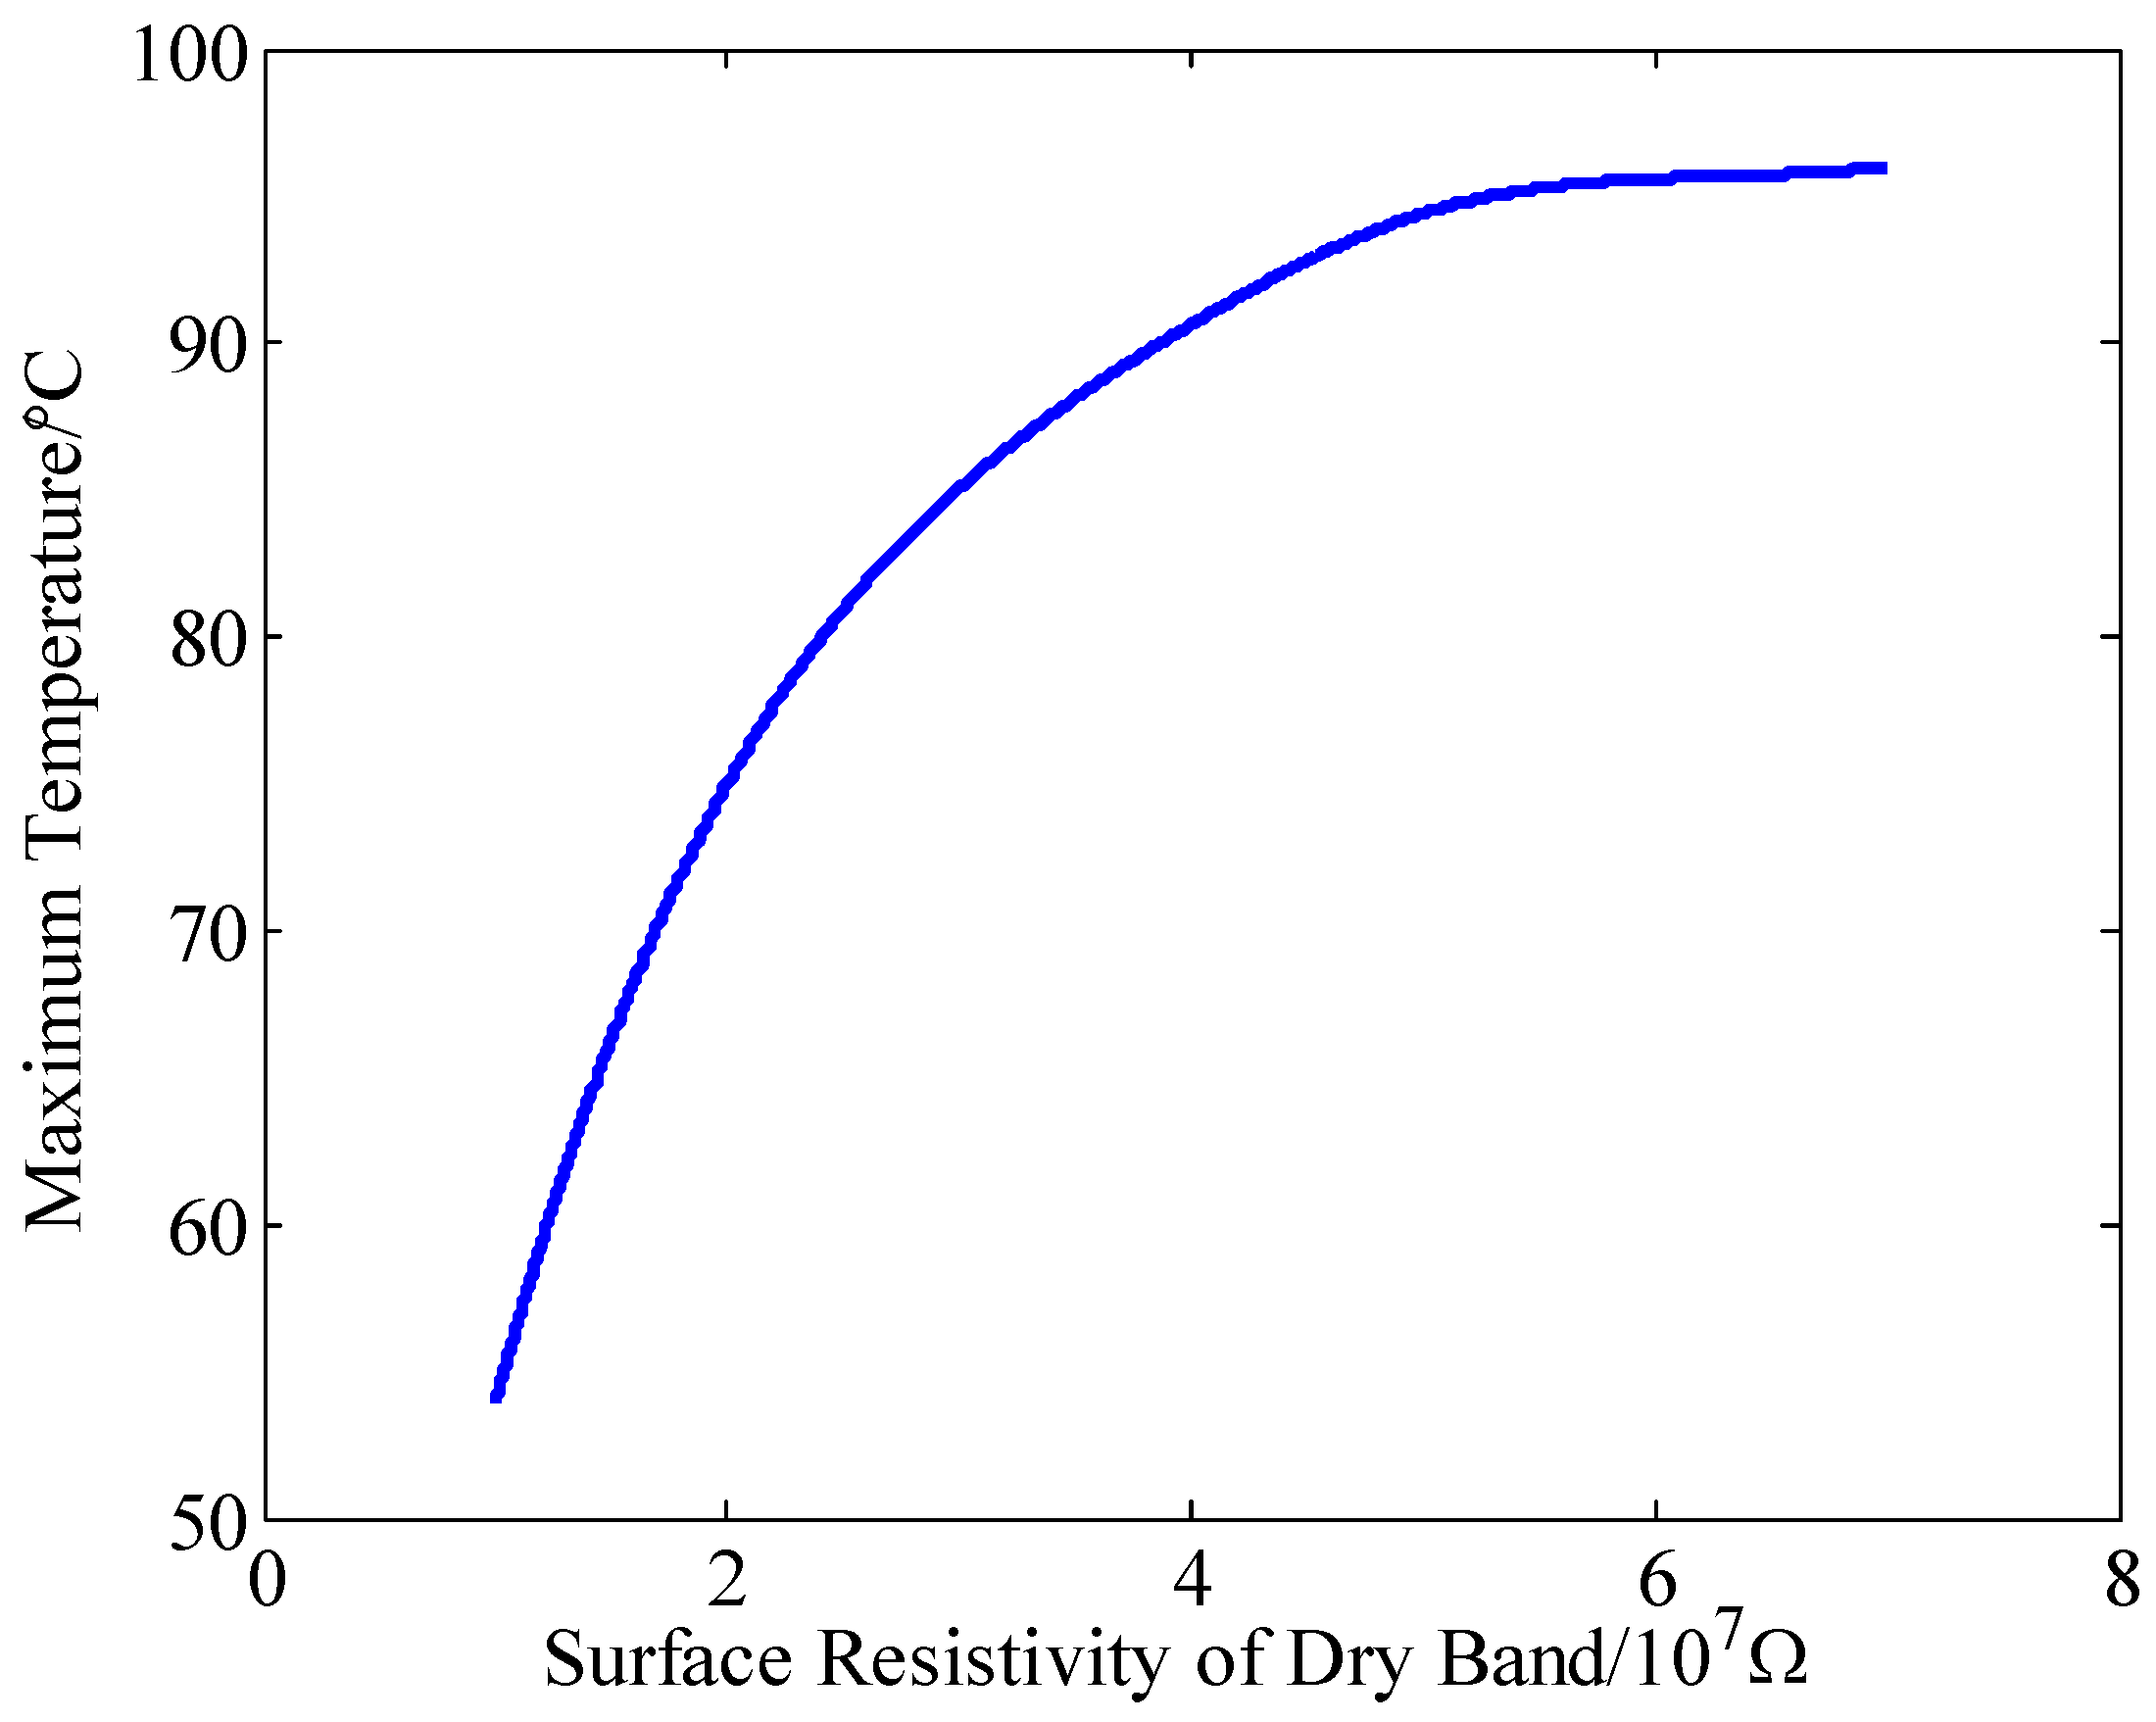
4. Influence of Dry Bands on Temperature Distribution of Insulator Surfaces
5. Conclusions
Author Contributions
Funding
Conflicts of Interest
References
- Zhang, Z.J.; Yang, S.H.; Jiang, X.L.; Qiao, X.H.; Xiang, Y.Z.; Zhang, D.D. DC flashover dynamic model of post insulator under non-uniform pollution between windward and leeward sides. Energies 2019, 12, 2345. [Google Scholar] [CrossRef]
- Albano, M.; Haddad, A.M.; Bungay, N. Is the dry-band characteristic a function of pollution and insulator design? Energies 2019, 12, 3607. [Google Scholar] [CrossRef]
- Qiao, X.H.; Zhang, Z.J.; Jiang, X.L.; Tian, L. Influence of DC electric fields on pollution of HVDC composition insulator short samples with different environmental parameters. Energies 2019, 12, 2304. [Google Scholar] [CrossRef]
- Lv, Y.K.; Zhao, W.P.; Li, J.G.; Zhang, Y.Z. Simulation of contamination deposition on typical shed porcelain insulators. Energies 2017, 10, 1045. [Google Scholar] [CrossRef]
- Vitelli, M.; Tucci, V.; Petrarca, C. Temperature distribution along an outdoor insulator subjected to different pollution level. IEEE Trans. Dielectr. Electr. Insul. 2000, 7, 416–423. [Google Scholar] [CrossRef]
- Yamashita, T.; Furusato, T.; Konishi, R.; Kurokawa, T.; Yaji, K. Critical current for phase shift of dry-band discharge on wet polluted insulators. J. Electrost. 2019, 97, 51–57. [Google Scholar] [CrossRef]
- Reddy, B.S.; Nagabhushana, G.R. Study of temperature distribution along an artificially polluted insulator string. Plasma Sci. Technol. 2003, 5, 1715–1720. [Google Scholar] [CrossRef]
- Saiful, M.I.S.; Nouruddeen, B.; Nor, A.M.; Nurun, N.A.R.; Noor, A.A.; Mohd, N.A.R. Surface discharge analysis of high voltage glass insulators using ultraviolet pulse voltage. Energies 2019, 12, 204. [Google Scholar]
- Yang, L.; Bi, J.K.; Zhang, F.; Hao, L.C.; Liao, Y.F.; Zhang, F.Z. Effects of structure and material of polluted insulators on the wetting characteristics. IET Sci. Meas. Technol. 2019, 13, 131–138. [Google Scholar] [CrossRef]
- Li, H.; Gorur, R.S. Source strength impact analysis on polymer insulator flashover under contaminated conditions and a comparison with porcelain. IEEE Trans. Dielectr. Electr. Insul. 2016, 23, 2189–2195. [Google Scholar]
- Pernebayeva, D.; Irmanova, A.; Sadykova, D.; Bagheri, M.; James, A. High voltage outdoor insulator surface condition evaluation using aerial insulator images. High. Volt. 2019, 4, 178–185. [Google Scholar] [CrossRef]
- Zhang, C.Y.; Wang, L.M. Experimental investigation on pollution flashover performance of multiple parallel suspension insulators. IEEE Trans. Dielectr. Electr. Insul. 2016, 23, 2840–2849. [Google Scholar] [CrossRef]
- Slama, M.E.; Hadi, H.; Flazi, S. Study on influence of the no-uniformity of pollution at the surface of HVAC lines insulators on flashover probability. In Proceedings of the Annual Report Conference on Electrical Insulation and Dielectric Phenomena, Vancouver, BC, Canada, 14–17 October 2007; IEEE Press: Piscataway, NJ, USA, 2007; pp. 562–566. [Google Scholar]
- Kehlbeck, F. The Influence of Solar Radiation on Bridge Structure; China Railway Publishing House: Beijing, China, 1982; pp. 32–33. [Google Scholar]
- Zhang, D. Research of heating and discharge mechanism of wet contaminated insulators. High. Volt. Eng. 2013, 39, 787–795. [Google Scholar]
- Li, H.Z.; Liu, G.; Li, L.C. Study status and prospect of natural contamination component on insulator surface. Proc. CSEE 2011, 31, 128–135. [Google Scholar]
- Lin, Y.H. Formulas for calculating the evaporation of indoor swimming pools. J. HV AC 2012, 6, 68–69. [Google Scholar]
- Li, Z.S.; Yao, J.G.; Yang, Y.J.; Chen, F.; Jin, Y.S.; Miao, Z.Q. Heating model of polluted and wetted insulators. Trans. China Electrotech. Soc. 2009, 24, 21–27. [Google Scholar]
- Sun, C.X.; Sima, W.X.; Shu, L.C. Atmospheric Environment and Electrical Insulation; China Electric Power Press: Beijing, China, 2002; pp. 27–40. [Google Scholar]


© 2019 by the authors. Licensee MDPI, Basel, Switzerland. This article is an open access article distributed under the terms and conditions of the Creative Commons Attribution (CC BY) license (http://creativecommons.org/licenses/by/4.0/).
Share and Cite
Zhang, D.; Meng, F. Research on the Interrelation between Temperature Distribution and Dry Band on Wet Contaminated Insulators. Energies 2019, 12, 4289. https://doi.org/10.3390/en12224289
Zhang D, Meng F. Research on the Interrelation between Temperature Distribution and Dry Band on Wet Contaminated Insulators. Energies. 2019; 12(22):4289. https://doi.org/10.3390/en12224289
Chicago/Turabian StyleZhang, Da, and Fancui Meng. 2019. "Research on the Interrelation between Temperature Distribution and Dry Band on Wet Contaminated Insulators" Energies 12, no. 22: 4289. https://doi.org/10.3390/en12224289
APA StyleZhang, D., & Meng, F. (2019). Research on the Interrelation between Temperature Distribution and Dry Band on Wet Contaminated Insulators. Energies, 12(22), 4289. https://doi.org/10.3390/en12224289