Energy Poverty and Life Satisfaction: Structural Mechanisms and Their Implications


Abstract
1. Introduction
2. Theoretical Background
3. Methods and Data
4. Results
5. Discussion, Conclusions, and Research Limitations
Author Contributions
Funding
Conflicts of Interest
References
- Gillingham, K.; Newell, R.G.; Palmer, K. Energy Efficiency Economics and Policy. Annu. Rev. Resour. Econ. 2009, 1, 597–620. [Google Scholar] [CrossRef]
- Omer, A.M. Energy, environment and sustainable development. Renew. Sustain. Energy Rev. 2008, 12, 2265–2300. [Google Scholar] [CrossRef]
- Soytas, U.; Sari, R. Energy consumption, economic growth, and carbon emissions: Challenges faced by an EU candidate member. Ecol. Econ. 2009, 68, 1667–1675. [Google Scholar] [CrossRef]
- Casillas, C.E.; Kammen, D.M. The Energy-Poverty-Climate Nexus. Science 2010, 330, 1181–1182. [Google Scholar] [CrossRef]
- Gillard, R.; Snell, C.; Bevan, M. Advancing an energy justice perspective of fuel poverty: Household vulnerability and domestic retrofit policy in the United Kingdom. Energy Res. Soc. Sci. 2017, 29, 53–61. [Google Scholar] [CrossRef]
- Bouzarovski, S. Understanding Energy Poverty, Vulnerability and Justice. In Energy Poverty: (Dis)Assembling Europe’s Infrastructural Divide; Bouzarovski, S., Ed.; Springer International Publishing: Cham, Switzerland, 2018; pp. 9–39. ISBN 978-3-319-69299-9. [Google Scholar]
- Bouzarovski, S.; Petrova, S.; Tirado-Herrero, S. From Fuel Poverty to Energy Vulnerability: The Importance of Services, Needs and Practices.; Social Science Research Network: Rochester, NY, USA, 2014. [Google Scholar]
- Nussbaumer, P.; Bazilian, M.; Modi, V. Measuring energy poverty: Focusing on what matters. Renew. Sustain. Energy Rev. 2012, 16, 231–243. [Google Scholar] [CrossRef]
- Bazilian, M.; Modi, V.; Nussbaumer, P.S.; Yumkella, K.K. Measuring Energy Poverty: Focusing on What Matters; Oxford Poverty & Human Development Initiative: Oxford, UK, 2011; ISBN 978-1-907194-26-9. [Google Scholar]
- Mendoza Aguilar, J.; Ramos-Real, F.J.; Ramírez-Díaz, A.J. Improving Indicators for Comparing Energy Poverty in the Canary Islands and Spain. Energies 2019, 12, 2135. [Google Scholar] [CrossRef]
- Kasperowicz, R.; Pinczyński, M.; Khabdullin, A. Modeling the power of renewable energy sources in the context of classical electricity system transformation. J. Int. Stud. 2017, 10, 264–272. [Google Scholar] [CrossRef]
- Kharlamova, G.; Chernyak, O.; Nate, S. Renewable energy and security for Ukraine: Challenge or smart way? J. Int. Stud. 2016, 9, 88–115. [Google Scholar] [CrossRef][Green Version]
- Shindina, T.; Streimikis, J.; Sukhareva, Y.; Nawrot, Ł. Social and Economic Properties of the Energy Markets. Econ. Sociol. 2018, 11, 334–344. [Google Scholar] [CrossRef]
- Simionescu, M.; Bilan, Y.; Krajňáková, E.; Streimikiene, D.; Gędek, S. Renewable Energy in the Electricity Sector and GDP per Capita in the European Union. Energies 2019, 12, 2520. [Google Scholar] [CrossRef]
- Tvaronavičienė, M.; Prakapienė, D.; Garškaitė-Milvydienė, K.; Prakapas, R.; Nawrot, Ł. Energy Efficiency in the Long-Run in the Selected European Countries. Econ. Sociol. 2018, 11, 245–254. [Google Scholar] [CrossRef] [PubMed]
- Emmel, J.M.; Lee, H.-J.; Cox, R.H.; Leech, I. Low-Income Households’ Response to Higher Home Energy Costs. Fam. Consum. Sci. Res. J. 2010, 38, 372–386. [Google Scholar] [CrossRef]
- Hills, J. Getting the Measure of Fuel Poverty: Final Report of the Fuel Poverty Review. In CASE Report 72; London School of Economics and Political Science: London, UK, 2012. [Google Scholar]
- Bouzarovski, S.; Tirado Herrero, S. The energy divide: Integrating energy transitions, regional inequalities and poverty trends in the European Union. Eur. Urban Reg. Stud. 2017, 24, 69–86. [Google Scholar] [CrossRef]
- Healy, J.D. Housing, Fuel Poverty, and Health: A Pan-European Analysis; Routledge, Taylor & Francis: London, UK, 2016; ISBN 978-1-138-26662-9. [Google Scholar]
- Boardman, B. Fuel Poverty: From Cold Homes to Affordable Warmth; Belhaven Press: London, UK; New York, NY, USA, 1991; ISBN 978-1-85293-139-1. [Google Scholar]
- Koh, L.; Marchand, R.; Genovese, A.; Brennan, A. Fuel Poverty: Perspectives from the Front Line; Fuel Poverty Series; The University of Sheffield, Centre for Energy Environment and Sustainability: Sheffield, UK, 2012. [Google Scholar]
- Lewis, P. Fuel Poverty Can Be Stopped; National Right to Fuel Campaign: Bradford, UK, 1982. [Google Scholar]
- Dubois, U.; Meier, H. Energy affordability and energy inequality in Europe: Implications for policymaking. Energy Res. Soc. Sci. 2016, 18, 21–35. [Google Scholar] [CrossRef]
- Healy, J.D.; Clinch, J.P. Fuel Poverty in Europe: A Cross-Country Analysis Using a New Composite Measure; Environmental Studies Research Series; University College Dublin: Dublin, Ireland, 2002. [Google Scholar]
- Thomson, H.; Snell, C. Quantifying the prevalence of fuel poverty across the European Union. Energy Policy 2013, 52, 563–572. [Google Scholar] [CrossRef]
- Thomson, H.; Snell, C.; Bouzarovski, S. Health, Well-Being and Energy Poverty in Europe: A Comparative Study of 32 European Countries. Int. J. Environ. Res. Public. Health 2017, 14, 584. [Google Scholar] [CrossRef]
- Pye, S.; Dobbins, A.; Baffert, C.; Brajković, J.; Deane, P.; De Miglio, R. Addressing Energy Poverty and Vulnerable Consumers in the Energy Sector Across the EU. Eur. En Form. 2015, 378, 64. [Google Scholar] [CrossRef]
- Energy Poverty and Vulnerability: A Global Perspective; Simcock, N., Thomson, H., Petrova, S., Eds.; Routledge Explorations in Energy Studies; Routledge, Taylor & Francis Group: New York, NY, USA, 2018; ISBN 978-1-138-29445-5. [Google Scholar]
- Wooliscroft, B.; Scott, M.; Lawson, R.; McKague, F. Understanding energy poverty through the energy cultures framework. In Energy Poverty and Vulnerability; Routledge: Abington, UK, 2017; pp. 33–45. [Google Scholar]
- Bollino, C.A.; Botti, F. Energy Poverty in Europe: A Multidimensional Approach; Social Science Research Network: Rochester, NY, USA, 2018. [Google Scholar]
- Fowler, T.; Southgate, R.J.; Waite, T.; Harrell, R.; Kovats, S.; Bone, A.; Doyle, Y.; Murray, V. Excess Winter Deaths in Europe: A multi-country descriptive analysis. Eur. J. Public Health 2015, 25, 339–345. [Google Scholar] [CrossRef]
- Liddell, C.; Morris, C. Fuel poverty and human health: A review of recent evidence. Energy Policy 2010, 38, 2987–2997. [Google Scholar] [CrossRef]
- Rudge, J.; Gilchrist, R. Excess winter morbidity among older people at risk of cold homes: A population-based study in a London borough. J. Public Health 2005, 27, 353–358. [Google Scholar] [CrossRef] [PubMed]
- Lacroix, E.; Chaton, C. Fuel poverty as a major determinant of perceived health: The case of France. Public Health 2015, 129, 517–524. [Google Scholar] [CrossRef] [PubMed]
- Ommen, O.; Janssen, C.; Neugebauer, E.; Bouillon, B.; Rehm, K.; Rangger, C.; Erli, H.J.; Pfaff, H. Trust, social support and patient type--associations between patients perceived trust, supportive communication and patients preferences in regard to paternalism, clarification and participation of severely injured patients. Patient Educ. Couns. 2008, 73, 196–204. [Google Scholar] [CrossRef] [PubMed]
- Wilkinson, P.; Smith, K.R.; Joffe, M.; Haines, A. A global perspective on energy: Health effects and injustices. Lancet 2007, 370, 965–978. [Google Scholar] [CrossRef]
- Lund, C.; Breen, A.; Flisher, A.J.; Kakuma, R.; Corrigall, J.; Joska, J.A.; Swartz, L.; Patel, V. Poverty and common mental disorders in low and middle income countries: A systematic review. Soc. Sci. Med. 2010, 71, 517–528. [Google Scholar] [CrossRef]
- Pye, S.; Dobbins, A.; Baffert, C.; Brajković, J.; Deane, P.; De Miglio, R. Energy Poverty Across the EU. In Europe’s Energy Transition—Insights for Policy Making; Elsevier: Amsterdam, The Netherlands, 2017; pp. 261–280. ISBN 978-0-12-809806-6. [Google Scholar]
- Idler, E.L.; Benyamini, Y. Self-Rated Health and Mortality: A Review of Twenty-Seven Community Studies. J. Health Soc. Behav. 1997, 38, 21. [Google Scholar] [CrossRef]
- Locker, D.; Clarke, M.; Payne, B. Self-perceived Oral Health Status, Psychological Well-being, and Life Satisfaction in an Older Adult Population. J. Dent. Res. 2000, 79, 970–975. [Google Scholar] [CrossRef]
- Zullig, K.J.; Valois, R.F.; Huebner, E.S.; Drane, J.W. Adolescent health-related quality of life and perceived satisfaction with life. Qual. Life Res. 2005, 14, 1573–1584. [Google Scholar] [CrossRef]
- Parkerson, G.R.; Broadhead, W.E.; Tse, C.K. The health status and life satisfaction of first-year medical students. Acad. Med. 1990, 65, 586–588. [Google Scholar] [CrossRef]
- Oakes, J.M.; Rossi, P.H. The measurement of SES in health research: Current practice and steps toward a new approach. Soc. Sci. Med. 2003, 56, 769–784. [Google Scholar] [CrossRef]
- Kraus, M.W.; Keltner, D. Signs of Socioeconomic Status: A Thin-Slicing Approach. Psychol. Sci. 2009, 20, 99–106. [Google Scholar] [CrossRef] [PubMed]
- Cappelletti, E.R.; Kreuter, M.W.; Boyum, S.; Thompson, T. Basic needs, stress and the effects of tailored health communication in vulnerable populations. Health Educ. Res. 2015, 30, 591–598. [Google Scholar] [CrossRef] [PubMed]
- Kumar, M.K. Important factors of self-efficacy and its relationship with life satisfaction and self-esteem–with reference to gen y and gen z individuals. IOP Conf. Ser. Mater. Sci. Eng. 2018, 390, 012007. [Google Scholar] [CrossRef]
- Middlemiss, L.; Gillard, R. Fuel poverty from the bottom-up: Characterising household energy vulnerability through the lived experience of the fuel poor. Energy Res. Soc. Sci. 2015, 6, 146–154. [Google Scholar] [CrossRef]
- Unanue, W.; Gómez, M.E.; Cortez, D.; Oyanedel, J.C.; Mendiburo-Seguel, A. Revisiting the Link between Job Satisfaction and Life Satisfaction: The Role of Basic Psychological Needs. Front. Psychol. 2017, 8, 680. [Google Scholar] [CrossRef]
- Cheung, F.; Lucas, R.E. Assessing the validity of single-item life satisfaction measures: Results from three large samples. Qual. Life Res. 2014, 23, 2809–2818. [Google Scholar] [CrossRef]
- Eroğlu, S.E.; Bozgeyikli, H.; Çalişir, V. Life Satisfaction Depending on Socio-Economic Status and Gender among Turkish Students. Policy Futur. Educ. 2009, 7, 379–386. [Google Scholar] [CrossRef]
- Gustafsson, P.E.; Janlert, U.; Theorell, T.; Westerlund, H.; Hammarstrom, A. Socioeconomic status over the life course and allostatic load in adulthood: Results from the Northern Swedish Cohort. J. Epidemiol. Community Health 2011, 65, 986–992. [Google Scholar] [CrossRef]
- Gustafsson, P.E.; Janlert, U.; Theorell, T.; Hammarström, A. Life-course socioeconomic trajectories and diurnal cortisol regulation in adulthood. Psychoneuroendocrinology 2010, 35, 613–623. [Google Scholar] [CrossRef]
- Buzar, S. When Homes Become Prisons: The Relational Spaces of Postsocialist Energy Poverty. Environ. Plan. Econ. Space 2007, 39, 1908–1925. [Google Scholar] [CrossRef]
- Diener, E.; Suh, E. Measuring Quality of Life: Economic, Social, And Subjective Indicators. Soc. Indic. Res. 1997, 40, 189–216. [Google Scholar] [CrossRef]
- Frijters, P.; Haisken-DeNew, J.P.; Shields, M.A. Investigating the Patterns and Determinants of Life Satisfaction in Germany Following Reunification. J. Hum. Resour. 2004, XXXIX, 649–674. [Google Scholar] [CrossRef]
- Lucas, R.E. Adaptation and the Set-Point Model of Subjective Well-Being: Does Happiness Change After Major Life Events? Curr. Dir. Psychol. Sci. 2007, 16, 75–79. [Google Scholar] [CrossRef]
- Crowley, F.; Walsh, E. How Important are Personal Ties, Trust and Tolerance for Life Satisfaction in Europe? SRERC Working Paper Series; University College Cork: Cork, Ireland, 2018. [Google Scholar]
- Bjørnskov, C. The Happy Few: Cross–Country Evidence on Social Capital and Life Satisfaction. Kyklos 2003, 56, 3–16. [Google Scholar] [CrossRef]
- Vemuri, A.W.; Costanza, R. The role of human, social, built, and natural capital in explaining life satisfaction at the country level: Toward a National Well-Being Index (NWI). Ecol. Econ. 2006, 58, 119–133. [Google Scholar] [CrossRef]
- Inaba, Y.; Wada, Y.; Ichida, Y.; Nishikawa, M. Which part of community social capital is related to life satisfaction and self-rated health? A multilevel analysis based on a nationwide mail survey in Japan. Soc. Sci. Med. 2015, 142, 169–182. [Google Scholar] [CrossRef]
- Gallie, D.; Russell, H. Unemployment and life satisfaction: A cross-cultural comparison. Eur. J. Sociol. Arch. Eur. Sociol. 1998, 39, 248–280. [Google Scholar] [CrossRef]
- Kassenboehmer, S.C.; Haisken-DeNew, J.P. You’re Fired! the Causal Negative Effect of Entry Unemployment on Life Satisfaction. Econ. J. 2009, 119, 448–462. [Google Scholar] [CrossRef]
- Globalization and Health; Kawachi, I., Wamala, S.P., Eds.; Oxford University Press: Oxford, UK; New York, NY, USA, 2007; ISBN 978-0-19-517299-7. [Google Scholar]
- Bambra, C.; Eikemo, T.A. Welfare state regimes, unemployment and health: A comparative study of the relationship between unemployment and self-reported health in 23 European countries. J. Epidemiol. Community Health 2009, 63, 92–98. [Google Scholar] [CrossRef]
- Drydakis, N. The effect of unemployment on self-reported health and mental health in Greece from 2008 to 2013: A longitudinal study before and during the financial crisis. Soc. Sci. Med. 2015, 128, 43–51. [Google Scholar] [CrossRef]
- Paul, K.I.; Moser, K. Unemployment impairs mental health: Meta-analyses. J. Vocat. Behav. 2009, 74, 264–282. [Google Scholar] [CrossRef]
- Böckerman, P.; Ilmakunnas, P. Unemployment and self-assessed health: Evidence from panel data. Health Econ. 2009, 18, 161–179. [Google Scholar] [CrossRef] [PubMed]
- Pachauri, S.; Rao, N.D. Gender impacts and determinants of energy poverty: Are we asking the right questions? Curr. Opin. Environ. Sustain. 2013, 5, 205–215. [Google Scholar] [CrossRef]
- The Berlin Aging Study: Aging from 70 to 100; A Research Project of the Berlin-Brandenburg Academy of Sciences; Baltes, P.B., Mayer, K.U., Eds.; 1. paperback printing.; Cambridge University Press: Cambridge, UK, 2001; ISBN 978-0-521-00003-1. [Google Scholar]
- Deeks, A.; Lombard, C.; Michelmore, J.; Teede, H. The effects of gender and age on health related behaviors. BMC Public Health 2009, 9, 213. [Google Scholar] [CrossRef] [PubMed]
- Ferrini, R.; Edelstein, S.; Barrettconnor, E. The Association Between Health Beliefs and Health Behavior Change in Older Adults. Prev. Med. 1994, 23, 1–5. [Google Scholar] [CrossRef] [PubMed]
- Baird, B.M.; Lucas, R.E.; Donnellan, M.B. Life Satisfaction Across the Lifespan: Findings from Two Nationally Representative Panel Studies. Soc. Indic. Res. 2010, 99, 183–203. [Google Scholar] [CrossRef] [PubMed]
- Carstensen, L.L.; Fung, H.H.; Charles, S.T. Socioemotional Selectivity Theory and the Regulation of Emotion in the Second Half of Life. Motiv. Emot. 2003, 27, 103–123. [Google Scholar] [CrossRef]
- Carstensen, L.L.; Isaacowitz, D.M.; Charles, S.T. Taking time seriously: A theory of socioemotional selectivity. Am. Psychol. 1999, 54, 165–181. [Google Scholar] [CrossRef]
- Joreskog, K.G.; Wold, H. The ML and PLS techniques for modeling with latent variables: Historical and comparative aspects. In Systems under Indirect Observation: Part I; Joreskog, K.G., Wold, H., Eds.; Elsevier: Amsterdam, North–Holland, The Netherlands, 1982; pp. 263–270. [Google Scholar]
- Kock, N. From composites to factors: Ridging the gap between PLS and covariance-based structural equation modelling. Inf. Syst. J. 2019, 29, 674–706. [Google Scholar] [CrossRef]
- Kock, N. Non-Normality Propagation among Latent Variables and Indicators in PLS-SEM Simulations. J. Mod. Appl. Stat. Methods 2016, 15, 299–315. [Google Scholar] [CrossRef]
- Kock, N. Advanced Mediating Effects Tests, Multi-Group Analyses, and Measurement Model Assessments in PLS-Based SEM. Int. J. E-Collab. 2014, 10, 1–13. [Google Scholar] [CrossRef]
- Kock, N. How Likely is Simpson’s Paradox in Path Models? Int. J. E-Collab. 2015, 11, 1–7. [Google Scholar] [CrossRef]
- Haenlein, M.; Kaplan, A.M. A Beginner’s Guide to Partial Least Squares Analysis. Underst. Stat. 2004, 3, 283–297. [Google Scholar] [CrossRef]
- Hair, J.F.; Ringle, C.M.; Sarstedt, M. PLS-SEM: Indeed a Silver Bullet. J. Mark. Theory Pract. 2011, 19, 139–152. [Google Scholar] [CrossRef]
- Bouzarovski, S. Energy poverty in the European Union: Landscapes of vulnerability. Wiley Interdiscip. Rev. Energy Environ. 2014, 3, 276–289. [Google Scholar] [CrossRef]
- Bouzarovski, S.; Petrova, S. A global perspective on domestic energy deprivation: Overcoming the energy poverty–fuel poverty binary. Energy Res. Soc. Sci. 2015, 10, 31–40. [Google Scholar] [CrossRef]
- Nunnally, J.C.; Bernstein, I.H. Psychometric Theory, 3rd ed.; McGraw-Hill: New York, NY, USA, 1994; ISBN 978-0-07-047849-7. [Google Scholar]
- Nunnally, J.C. Psychometric Theory; McGraw-Hill Series in Psychology, 2nd ed.; McGraw-Hill: New York, NY, USA, 1978; ISBN 978-0-07-047465-9. [Google Scholar]
- Kennedy, P. A Guide to Econometrics, 6th ed.; Wiley-Blackwell: Malden, MA, USA, 2008; ISBN 978-1-4051-8257-7. [Google Scholar]
- Hu, L.; Bentler, P.M. Cutoff criteria for fit indexes in covariance structure analysis: Conventional criteria versus new alternatives. Struct. Equ. Model. Multidiscip. J. 1999, 6, 1–55. [Google Scholar] [CrossRef]
- Dear, K.B.G.; McMichael, A.J. The health impacts of cold homes and fuel poverty. BMJ 2011, 342, d2807. [Google Scholar] [CrossRef]
- Stewart, J.; Habgood, V. Benefits of a health impact assessment in relation to fuel poverty: Assessing Luton’s Affordable Warmth Strategy and the need for a national mandatory strategy. J. R. Soc. Promot. Health 2008, 128, 123–129. [Google Scholar] [CrossRef]
- Haller, M.; Hadler, M. How Social Relations and Structures can Produce Happiness and Unhappiness: An International Comparative Analysis. Soc. Indic. Res. 2006, 75, 169–216. [Google Scholar] [CrossRef]
- Gómez-Baya, D.; Lucia-Casademunt, A.; Salinas-Pérez, J. Gender Differences in Psychological Well-Being and Health Problems among European Health Professionals: Analysis of Psychological Basic Needs and Job Satisfaction. Int. J. Environ. Res. Public. Health 2018, 15, 1474. [Google Scholar] [CrossRef] [PubMed]
- Regitz-Zagrosek, V. Sex and gender differences in health. EMBO Rep. 2012, 13, 596–603. [Google Scholar] [CrossRef] [PubMed]
- Hindman Persson, T. Women’s Health Choices and the Effects on Child Health. SSRN Electron. J. 2001. [Google Scholar] [CrossRef]
- Kangasniemi, M.; Blomberg, K.; Korhonen, A. Mothers’ perceptions of their health choices, related duties and responsibilities: A qualitative interview study. Midwifery 2015, 31, 1039–1044. [Google Scholar] [CrossRef] [PubMed]
- Bird, C.E.; Rieker, P.P. Gender and Health: The Effects of Constrained Choices and Social Policies; Cambridge University Press: Cambridge, UK; New York, NY, USA, 2008; ISBN 978-0-521-86415-2. [Google Scholar]
- Cohen, J. Statistical Power Analysis for the Behavioral Sciences, 2nd ed.; Routledge: Hillsdale, MI, USA, 1988; ISBN 978-0-8058-0283-2. [Google Scholar]
- Mroczek, D.K.; Kolarz, C.M. The effect of age on positive and negative affect: A developmental perspective on happiness. J. Pers. Soc. Psychol. 1998, 75, 1333–1349. [Google Scholar] [CrossRef]
- Biermann, P. How Fuel Poverty Affects Subjective Well-Being: Panel Evidence from Germany, Oldenburg Discussion Papers in Economics. Ph.D. Thesis, University of Oldenburg, Oldenburg, Germany, 2016. [Google Scholar]
- Rodriguez-Alvarez, A.; Orea, L.; Jamasb, T. Fuel poverty and Well-Being: A consumer theory and stochastic frontier approach. Energy Policy 2019, 131, 22–32. [Google Scholar] [CrossRef]
- Welsch, H.; Biermann, P. Energy Affordability and Subjective Well-Being: Evidence for European Countries. Energy J. 2017, 38, 159–176. [Google Scholar] [CrossRef]
- Walton, G.M.; Spencer, S.J. Latent Ability: Grades and Test Scores Systematically Underestimate the Intellectual Ability of Negatively Stereotyped Students. Psychol. Sci. 2009, 20, 1132–1139. [Google Scholar] [CrossRef]
- Dlouhy, M. Mental health policy in Eastern Europe: A comparative analysis of seven mental health systems. BMC Health Serv. Res. 2014, 14, 42. [Google Scholar] [CrossRef]


| Manifest Variables | Item | Mean | Standard Variation | ||
|---|---|---|---|---|---|
| 1 | 2 | 3 | 4 | ||
| Energy poverty | Can you afford adequate heating of your dwelling? | - | |||
| Yes = 1 | 93.5% | ||||
| No = 2 | 6.5% | ||||
| Health status | How would you assess your health? 5-point Likert scale, from Very good = 1, to Very bad = 5 | 2.51 | 0.92 | ||
| Work status | Did you work during the past 12 months? | - | |||
| Yes = 1 | 61.4% | ||||
| No = 2 | 38.6% | ||||
| Age | Respondent’s age (years) | 51.88 | 17.74 | ||
| Gender | Male = 1 | 44.1% | - | ||
| Female = 2 | 55.9% | ||||
| Intolerance | Percentage of affirmative responses to the question: “Could you please mention any that you would not like to have as neighbors? Families with children/Pedophiles/Drug addicts/People of a different race/People who have AIDS/Elderly people/Immigrants/Foreign workers/Homosexuals/Gypsies/People of a different religion/Poor people/Heavy drinkers/Unmarried couples living together/Jewish people/People who speak a different language” | 4.29 | 2.888 | ||
| Exogenous Latent Variables | Items Rated on 5-Point Likert Scale, From 1 = Strongly Disagree to 5 = Strongly Agree | Factor Loadings | D.G. rho | AVE | Cronbach’s Alpha |
| Economic environment improvement | The economic situation in our country is better today than around 4 years ago | 0.889 | 0.888 | 0.726 | 0.811 |
| The political situation in our country is better today than around 4 years ago | 0.860 | ||||
| On the whole, I am satisfied with the present state of the economy | 0.805 | ||||
| Satisfaction with socioeconomic status | My household lives better nowadays than around 4 years ago | 0.750 | 0.831 | 0.621 | 0.693 |
| All things considered, I am satisfied with my job as a whole | 0.760 | ||||
| All things considered, I am satisfied with my financial situation as a whole | 0.850 | ||||
| Endogenous (Outcome) Variable | Item Rated on 5-Point Likert Scale, From 1 = Strongly Disagree to 5 = Strongly Agree | Mean | Standard Variation | ||
| Life satisfaction | All things considered, I am satisfied with my life now | 3.5 | 1.06 | ||
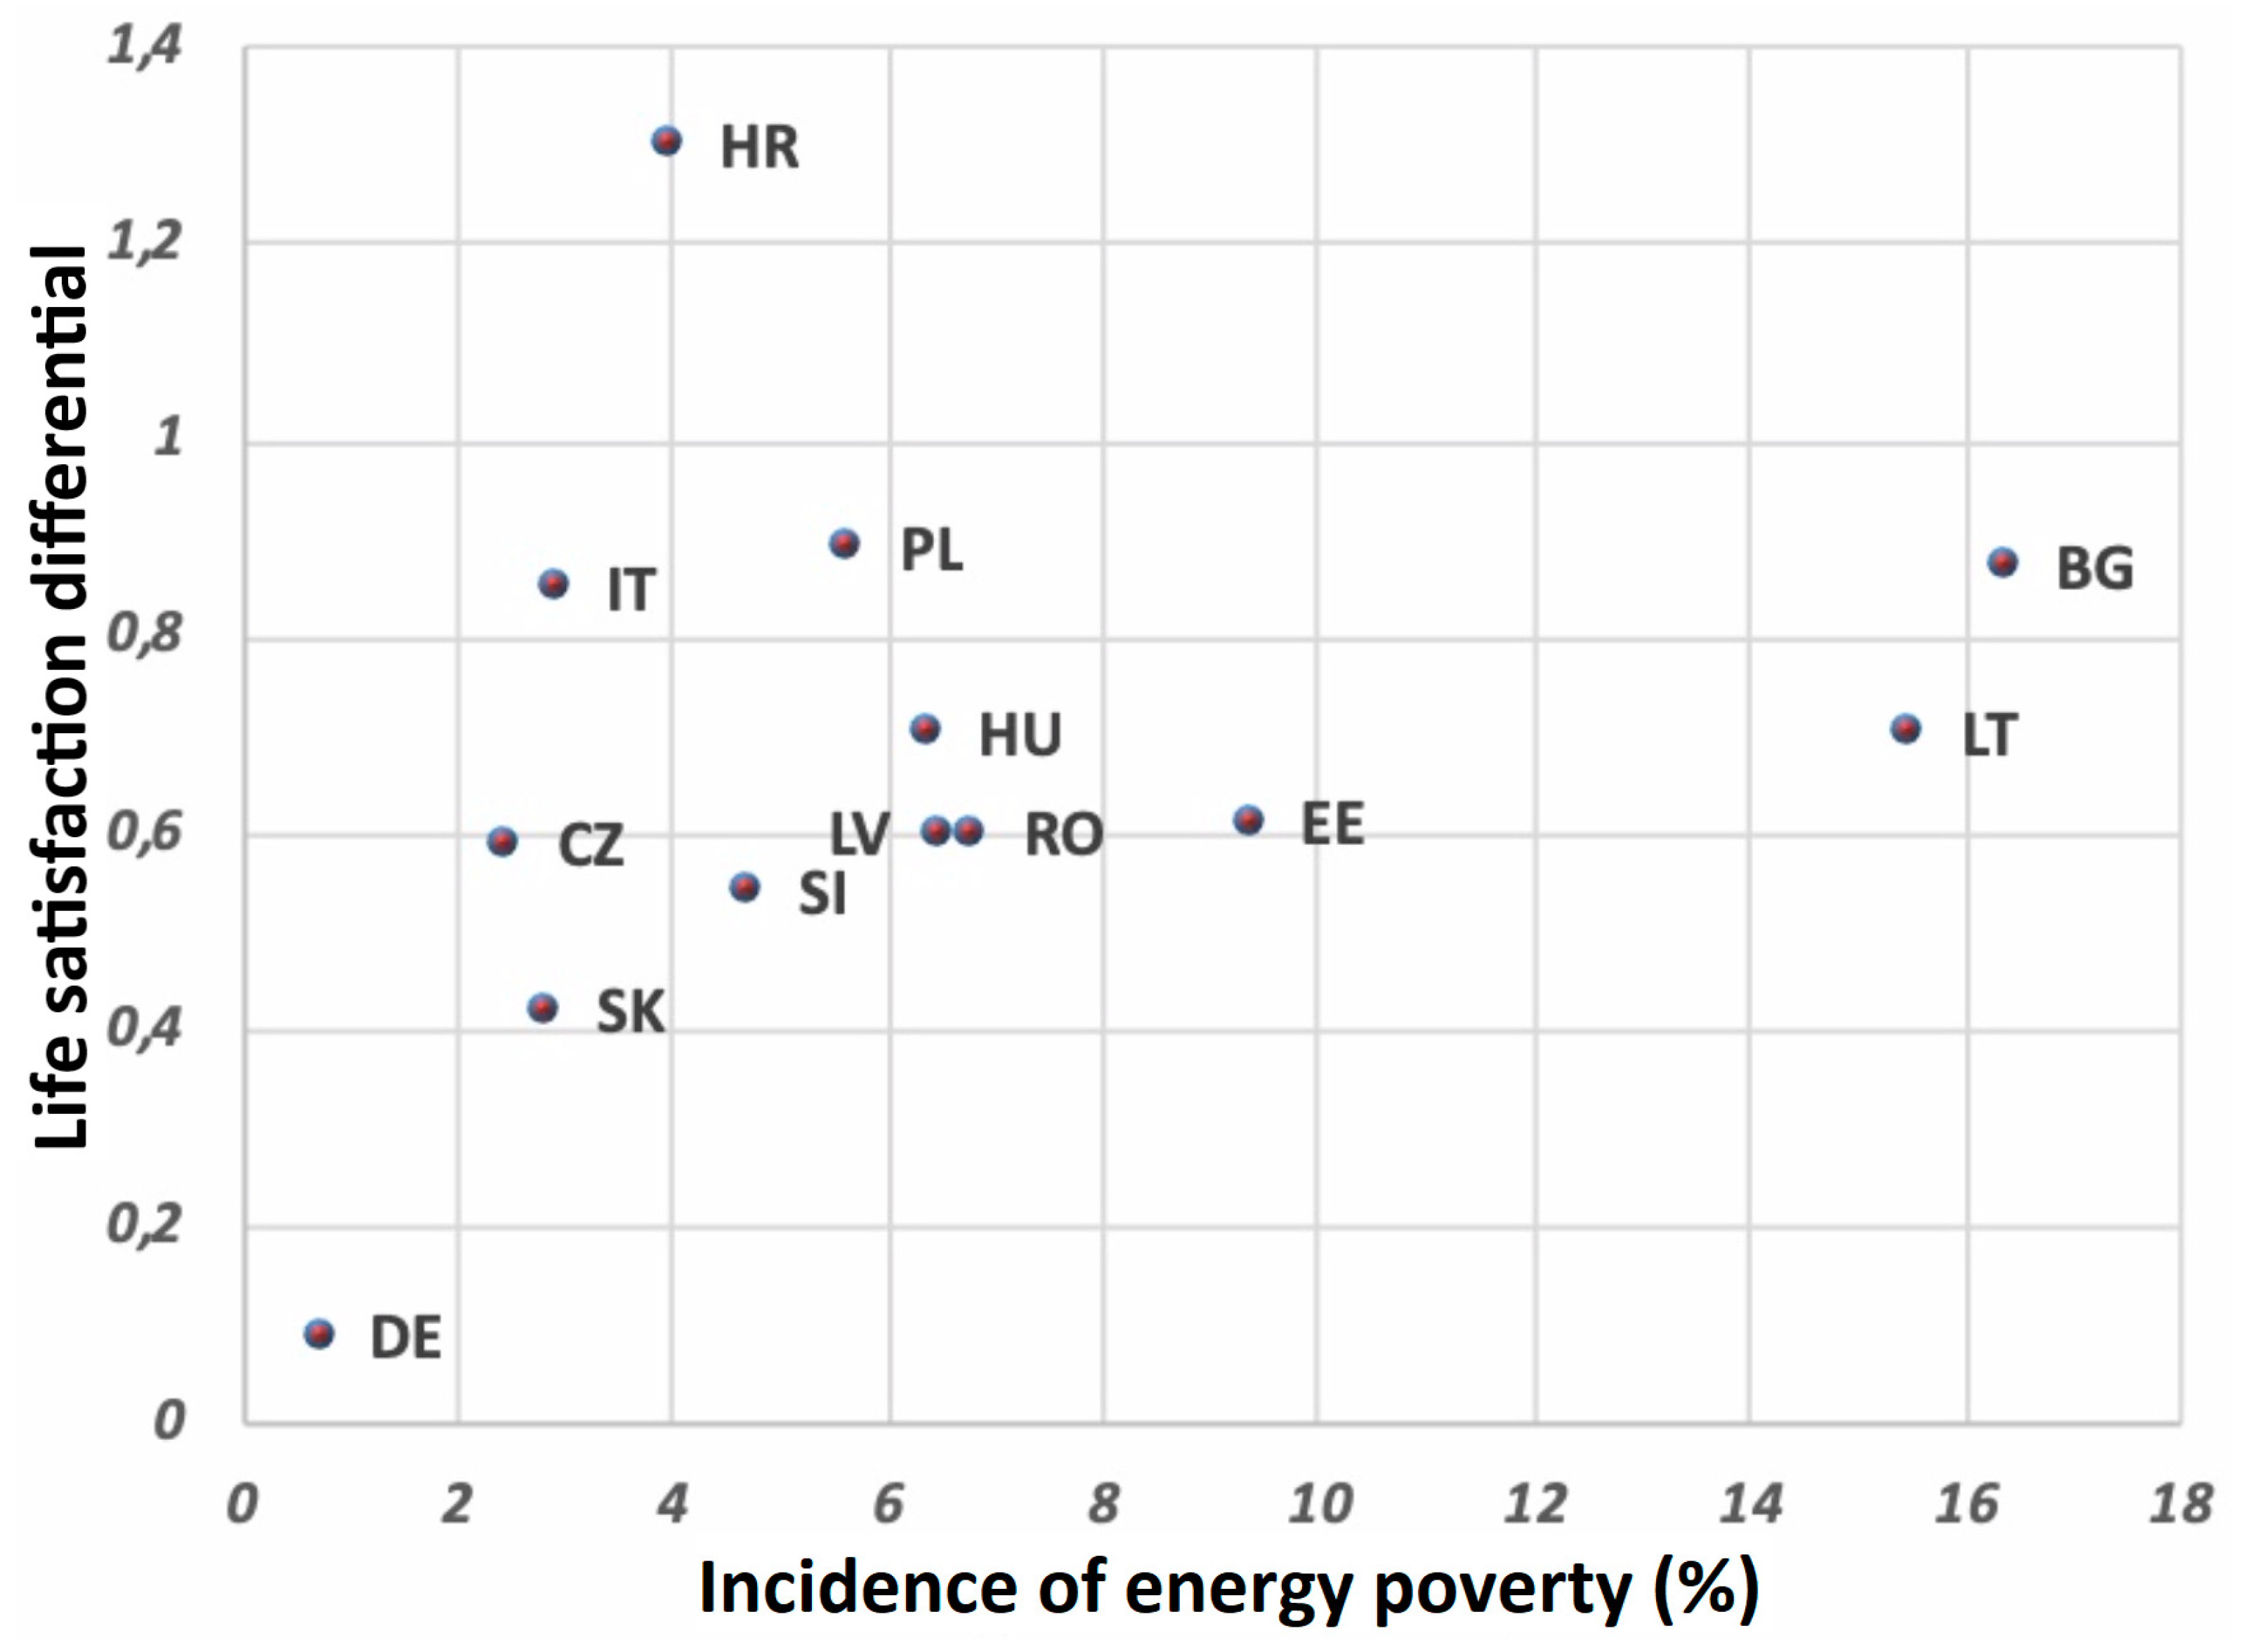
| Country | Mean Life Satisfaction for Non-Energy Poverty Group | Mean Life Satisfaction for Energy Poverty Group | Difference in Mean Life Satisfaction | t-Statistic | p-Value |
|---|---|---|---|---|---|
| Bulgaria | 3.000 | 2.135 | 0.87 | 11.03 | <2.2 × 10⁻¹⁶ |
| Croatia | 3.490 | 2.186 | 1.30 | 7.6346 | 1.806 × 10⁻¹⁰ |
| Czech Rep. | 3.537 | 2.946 | 0.59 | 3.6643 | 0.0007592 |
| Estonia | 3.611 | 3.000 | 0.61 | 6.1917 | 4.927 × 10⁻⁹ |
| Germany | 3.909 | 3.818 | 0.09 | 0.345 | 0.7373 |
| Hungary | 2.909 | 2.211 | 0.70 | 5.295 | 6.42 × 10⁻⁷ |
| Italy | 3.189 | 2.341 | 0.85 | 5.364 | 2.621 × 10⁻⁶ |
| Latvia | 3.496 | 2.897 | 0.60 | 4.9781 | 2.521 × 10⁻⁶ |
| Lithuania | 3.432 | 2.733 | 0.70 | 8.95 | <2.2 × 10⁻¹⁶ |
| Poland | 3.479 | 2.588 | 0.89 | 7.151 | 2.116 × 10⁻¹⁰ |
| Romania | 3.129 | 2.525 | 0.60 | 5.146 | 1.143 × 10⁻⁶ |
| Slovak Rep. | 3.327 | 2.909 | 0.42 | 2.7793 | 0.007898 |
| Slovenia | 3.622 | 3.085 | 0.54 | 3.9022 | 0.0002071 |
| Latent Variable | Satisfaction with Socioeconomic Status | Environmental Improvement |
|---|---|---|
| Satisfaction with socioeconomic status | 0.788 | 0.506 |
| Economic environment improvement | 0.506 | 0.852 |
| Header Variables | Direct Effects | Direct Effect Sizes (f2) | ||||
|---|---|---|---|---|---|---|
| - | Health Status | Satisfaction with Socioeconomic Status | Life Satisfaction | Health Status | Satisfaction with Socioeconomic Status | Life Satisfaction |
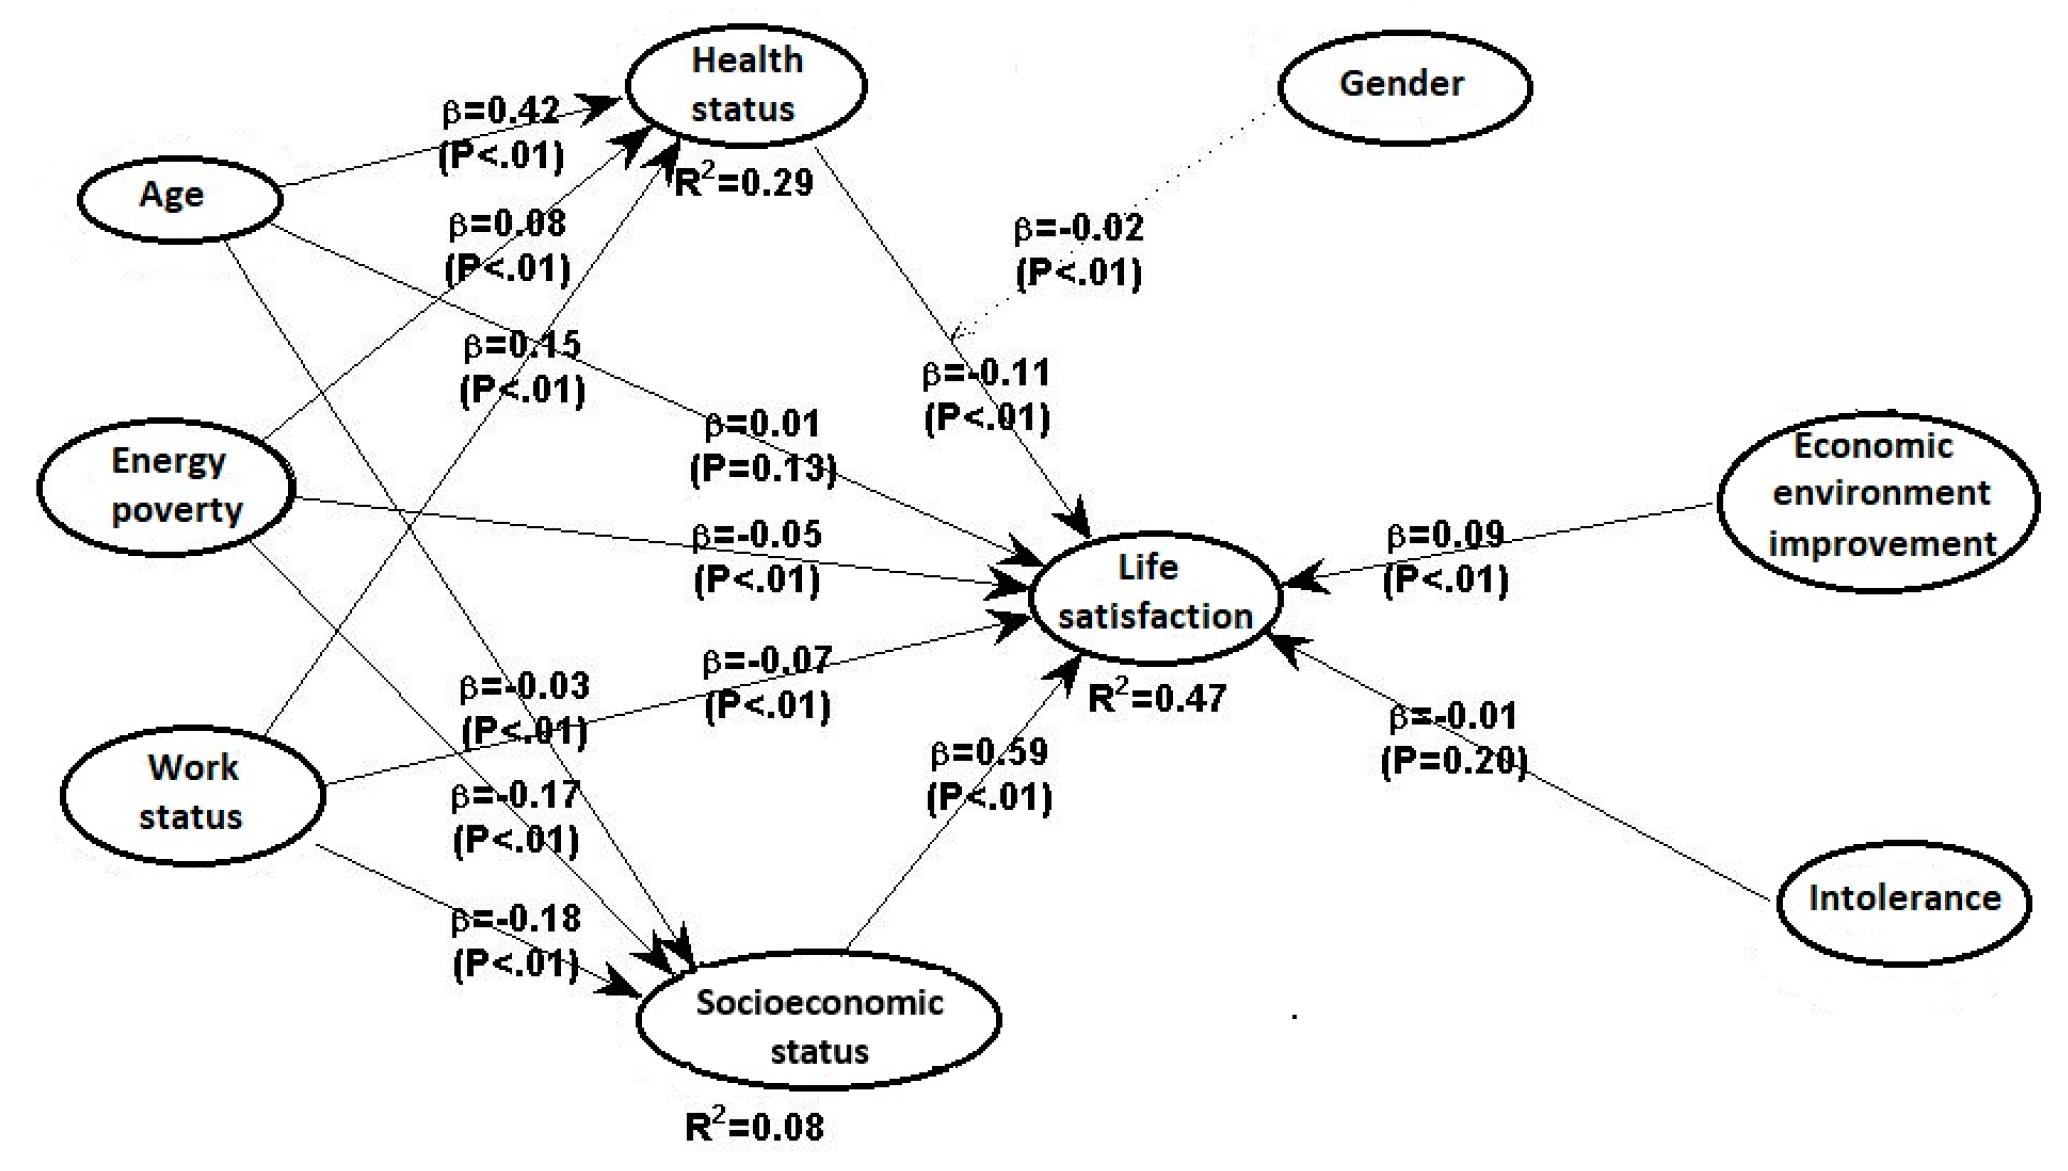
| Health status | - | - | −0.112 *** (0.007) | - | - | 0.030 |
| Satisfaction with socioeconomic status | - | - | 0.592 *** (0.007) | - | - | 0.394 |
| Energy poverty No: reference Yes | Reference 0.085 *** (0.007) | Reference −0.173 *** (0.007) | Reference −0.050 *** (0.007) | 0.011 | 0.033 | 0.009 |
| Work status Yes: reference (employment) No | Reference 0.149 *** (0.007) | Reference −0.209 *** (0.007) | Reference −0.060 *** (0.007) | 0.060 | 0.047 | 0.007 |
| Age | 0.424 *** (0.007) | - | −0.002 (0.007) | 0.219 | - | 0.000 |
| Economic environment improvement | - | - | 0.087 *** (0.007) | - | - | 0.035 |
| Intolerance | - | - | −0.006 (0.007) | - | - | 0.000 |
| Health status * Gender | - | - | −0.017 * (0.007) | - | - | 0.002 |
| R2/ Adjusted R2 | 28.9%/28% | 8%/7.8% | 47.9%/47% | - | - | - |
| Header Variables | Sum of Indirect Effects | Total Effects (Direct Effect + Sum of Indirect Effects Via Mediators) | Effect Sizes for Total Effects |
|---|---|---|---|
| Health status | - | −0.112 *** (0.007) | 0.030 |
| Satisfaction with Socioeconomic Status | - | 0.592 *** (0.007) | 0.394 |
| Energy poverty No: reference Yes | Reference −0.112 *** (0.007) | Reference −0.162 *** (0.007) | 0.030 |
| Work status Yes: reference (employment) No | Reference −0.140 *** (0.007) | Reference −0.200 *** (0.007) | 0.025 |
| Age | −0.047 *** (0.005) | −0.049 *** (0.007) | 0.005 |
| Economic environment improvement | - | 0.087 *** (0.007) | 0.035 |
| Intolerance | - | −0.006 (0.007) | 0.000 |
| Health status * Gender | - | −0.017 * (0.007) | - |
| Variable | Economic Environment Improvement | Intolerance | Health Status | Socioeconomic Status | Age | Energy Poverty | Work Status | Gender * Health |
|---|---|---|---|---|---|---|---|---|
| Bulgaria Versus Italy | ||||||||
| Life satisfaction | 0.020 (0.290) | 0.025 (0.249) | 0.053 (0.071) | 0.057 (0.051) | 0.016 (0.331) | 0.040 (0.135) | 0.028 (0.224) | 0.034 (0.174) |
| Health status | - | - | - | - | 0.066 * (0.031) | 0.066 * (0.034) | 0.201 *** (<0.001) | - |
| Socioeconomic status | - | - | - | - | 0.041 (0.128) | 0.099 ** (0.003) | 0.079 * (0.014) | - |
| Croatia Versus Italy | ||||||||
| Life satisfaction | 0.030 (0.205) | 0.010 (0.389) | 0.030 (0.205) | 0.085 (0.008) | 0.009 (0.401) | 0.015 (0.340) | 0.052 (0.077) | 0.038 (0.146) |
| Health status | - | - | - | - | 0.059 * (0.048) | 0.021 (0.283) | 0.089 ** (0.007) | - |
| Socioeconomic status | - | - | - | - | 0.065 * (0.038) | 0.101 ** (0.002) | 0.051 (0.080) | - |
| Czech Republic Versus Italy | ||||||||
| Life satisfaction | 0.111 *** (<0.001) | 0.022 (0.270) | 0.017 (0.320) | 0.105 ** (0.001) | 0.116 *** (<0.001) | 0.030 (0.202) | 0.056 (0.062) | 0.001 (0.487) |
| Health status | - | - | - | - | 0.079 * (0.012) | 0.014 (0.350) | 0.084 * (0.010) | - |
| Socioeconomic status | - | - | - | - | 0.047 (0.099) | 0.016 (0.330) | 0.051 (0.080) | - |
| Estonia Versus Italy | ||||||||
| Life satisfaction | 0.065 * (0.036) | 0.028 (0.217) | 0.033 (0.184) | 0.128 *** (<0.001) | 0.086 * (0.009) | 0.004 (0.460) | 0.036 (0.164) | 0.028 (0.220) |
| Health status | - | - | - | - | 0.054 (0.062) | 0.031 (0.196) | 0.147 *** (<0.001) | - |
| Socioeconomic status | - | - | - | - | 0.171 *** (<0.001) | 0.053 (0.073) | 0.077 * (0.017) | - |
| Hungary Versus Italy | ||||||||
| Life satisfaction | 0.071 * (0.025) | 0.027 (0.231) | 0.025 (0.242) | 0.014 (0.343) | 0.098 ** (0.004) | 0.006 (0.433) | 0.052 (0.075) | 0.036 (0.159) |
| Health status | - | - | - | - | 0.119 *** (<0.001) | 0.026 (0.238) | 0.169 *** (<0.001) | - |
| Socioeconomic status | - | - | - | - | 0.072 * (0.024) | 0.007 (0.428) | 0.107 ** (0.002) | - |
| Latvia Versus Italy | ||||||||
| Life satisfaction | 0.050 (0.085) | 0.008 (0.414) | 0.047 (0.097) | 0.151 *** (<0.001) | 0.044 (0.114) | 0.019 (0.304) | 0.085 ** (0.009) | 0.011 (0.377) |
| Health status | - | - | - | - | 0.088 ** (0.006) | 0.024 (0.250) | 0.136 *** (<0.001) | - |
| Socioeconomic status | - | - | - | - | 0.042 (0.124) | 0.015 (0.343) | 0.064 * (0.038) | - |
| Lithuania Versus Italy | ||||||||
| Life satisfaction | 0.092 ** (0.006) | 0.009 (0.399) | 0.003 (0.470) | 0.151 *** (<0.001) | 0.082 * (0.012) | 0.035 (0.165) | 0.069 * (0.029) | 0.112 ** (0.001) |
| Health status | - | - | - | - | 0.033 (0.172) | 0.017 (0.316) | 0.118 *** (<0.001) | - |
| Socioeconomic status | - | - | - | - | 0.138 *** (<0.001) | 0.102 ** (0.002) | 0.049 (0.089) | - |
| Poland Versus Italy | ||||||||
| Life satisfaction | 0.066 * (0.034) | 0.097 ** (0.004) | 0.046 (0.100) | 0.032 (0.179) | 0.024 (0.251) | 0.027 (0.230) | 0.069 * (0.028) | 0.006 (0.440) |
| Health status | - | - | - | - | 0.041 (0.124) | 0.042 (0.122) | 0.107 ** (0.002) | - |
| Socioeconomic status | - | - | - | - | 0.077 * (0.017) | 0.049 (0.085) | 0.049 (0.085) | - |
| Romania Versus Italy | ||||||||
| Life satisfaction | 0.026 (0.237) | 0.018 (0.314) | 0.012 (0.366) | 0.019 (0.289) | 0.037 (0.156) | 0.012 (0.366) | 0.053 (0.071) | 0.050 (0.086) |
| Health status | - | - | - | - | 0.063 * (0.038) | 0.055 (0.063) | 0.159 *** (<0.001) | - |
| Socioeconomic status | - | - | - | - | 0.124 *** (<0.001) | 0.049 (0.087) | 0.012 (0.368) | - |
| Slovak Rep. Versus Italy | ||||||||
| Life satisfaction | 0.115 *** (<0.001) | 0.023 (0.264) | 0.001 (0.487) | 0.108 *** (<0.001) | 0.049 (0.088) | 0.048 (0.094) | 0.032 (0.185) | 0.001 (0.487) |
| Health status | - | - | - | - | 0.050 (0.076) | 0.042 (0.123) | 0.144 *** (<0.001) | - |
| Socioeconomic status | - | - | - | - | 0.031 (0.198) | 0.016 (0.324) | 0.010 (0.387) | - |
| Slovenia Versus Italy | ||||||||
| Life satisfaction | 0.021 (0.285) | 0.026 (0.238) | 0.062 * (0.043) | 0.204 *** (<0.001) | 0.091 ** (0.006) | 0.002 (0.476) | 0.034 (0.176) | 0.033 (0.181) |
| Health status | - | - | - | - | 0.111 *** (<0.001) | 0.028 (0.220) | 0.121 *** (<0.001) | - |
| Socioeconomic status | - | - | - | - | 0.024 (0.254) | 0.003 (0.467) | 0.018 (0.305) | - |
© 2019 by the authors. Licensee MDPI, Basel, Switzerland. This article is an open access article distributed under the terms and conditions of the Creative Commons Attribution (CC BY) license (http://creativecommons.org/licenses/by/4.0/).
Share and Cite
Druică, E.; Goschin, Z.; Ianole-Călin, R. Energy Poverty and Life Satisfaction: Structural Mechanisms and Their Implications. Energies 2019, 12, 3988. https://doi.org/10.3390/en12203988
Druică E, Goschin Z, Ianole-Călin R. Energy Poverty and Life Satisfaction: Structural Mechanisms and Their Implications. Energies. 2019; 12(20):3988. https://doi.org/10.3390/en12203988
Chicago/Turabian StyleDruică, Elena, Zizi Goschin, and Rodica Ianole-Călin. 2019. "Energy Poverty and Life Satisfaction: Structural Mechanisms and Their Implications" Energies 12, no. 20: 3988. https://doi.org/10.3390/en12203988
APA StyleDruică, E., Goschin, Z., & Ianole-Călin, R. (2019). Energy Poverty and Life Satisfaction: Structural Mechanisms and Their Implications. Energies, 12(20), 3988. https://doi.org/10.3390/en12203988