Abstract
This paper presents a fuel saving double channel wing (FADCW) configuration for a propeller driven aircraft to reduce fuel consumption. In pursuit of this objective, FADCW configuration combines the tractor propeller layout and over-the-wing propeller layout. The basic idea is to improve the wing lift-to-drag ratio by taking advantage of the beneficial propeller influence on the wing. Based on a multi reference frame method solving Reynolds averaged Navier-Stokes equations, the contrastive study of this configuration and a traditional tractor propeller-wing layout is conducted. It is shown that the propeller slipstream in the tractor propeller configuration leads to a 10.28% reduction in the wing lift-to-drag ratio. With the same reference wing area and the propeller rotation speed; however, the FADCW configuration can reduce the wing drag by 10.41% and increase its lift-to-drag ratio by 13.29%, which results in a 20.15% reduction in the fuel consumption compared with the traditional tractor propeller configuration.
1. Introduction
The rapid development of the aviation industry has brought about huge fuel consumption. Since aircraft aerodynamic design is one of the key elements that have critical effect on fuel consumption, designing a fuel saving aircraft has always been an important goal for aircraft designers. For a low speed fixed wing aircraft, a propeller has been a widely used propulsion model for a long time because of its high propulsion efficiency. Among propeller driven aircraft, a tractor propeller configuration (TPC) is the most widely used one, which can be seen frequently on many transport aircraft and a lot of low speed unmanned aerial vehicles. In this configuration, the propeller is located in front of the wing; its high speed slipstream, washing the wing directly and strongly, affects the pressure distribution of the wing significantly and thus generates a considerable impact on the aircraft’s stability, maneuverability, range, fuel consumption, and so on. For distributed propeller driven aircraft, the aerodynamic interaction between propellers and the wing will be more complex and stronger because of the enlarged area of the wing immersed in the distributed propeller slipstreams. Take the Helios solar-powered UAV (Unmanned Aerial Vehicle) [1] for example, about 50% of the wing is directly affected by propeller slipstreams. In recent years, with the rise of the distributed electric propulsion (DEP) aircraft [2,3,4], the percent of the wing area submerged in the propeller slipstream has been almost 100%. Therefore, the fuel consumption for a propeller driven aircraft heavily depends on the aerodynamic performance of the propeller-wing interaction.
The propeller-wing aerodynamic interference has drawn extensive attention for a long time. Many researchers have studied the aerodynamic behavior of the wing under the propeller interference.
Experimental measurements tested by Makino and Nagai [5] revealed that the propeller slipstream can delay or eliminate the separation bubble on the wing surface and thereby increase the wing lift in a flow of low Reynolds number. A numerical simulation on the DEP aircraft conducted by Stoll et al. [6] indicated that distributed propeller slipstreams can augment the maximum lift coefficient of the wing to 5.2. Regarding the drag of a wing for a propeller driven aircraft, Kroo’s analyses [7] showed that the propeller-wing interaction can reduce the wing drag obviously. However, Fratello et al. [8] drew a contrary conclusion. Their experiment revealed that the wing drag with the propeller influence is five times larger than that of a clean wing. Through the wind tunnel test, Ma et al. [9] also found that the propeller increases the wing drag and decreases its lift-to-drag ratio considerably. Miranda and Brennan [10] studied a wingtip mounted propeller configuration using a vorticity model and they suggested that whether the propeller-wing interaction is beneficial will strongly depend on the propeller rotation direction and installation position. Therefore, the aerodynamic behavior of the wing, especially the variation of the drag, is very sensitive to the influence of the propeller slipstream; more attention should be paid to employing the favorable influence of the propeller on the wing and avoiding its disadvantageous impact as much as possible.
In view of the important influence of the propeller on the wing, some authors [11,12,13] have made airfoil and wing shape optimizations considering the propeller interference to promote the aerodynamic performance of the wing and acquired many good results. However, these works mainly focused on the tractor propeller configurations, where only the influence of the slipstream behind the propeller disk was investigated; the potential favorable effects upstream of the propeller blade on the wing are rarely considered.
The goal of the present work is to improve the aerodynamic behavior of the wing and thus reduce the fuel consumption of a propeller driven aircraft. The basic idea is to take advantage of the favorable effects at both sides of the propeller disk. The performances of a tractor propeller-wing configuration and an isolated propeller are analyzed firstly to investigate their aerodynamic behavior and flow characteristics using CFD (Computational Fluid Dynamics) method. Based on these analyses, a fuel saving double channel wing (FADCW) configuration is proposed and its aerodynamic characteristics are discussed in detail to validate the design idea.
2. Numerical Method
A commercial software, ANSYS Fluent, solving Reynolds-averaged Navier-Stokes (RANS) equations, is used to conduct the complex simulation of the propeller-wing aerodynamic interaction. The turbulence model is selected as the k- shear stress transport (SST) model [14] with a low Reynolds number correction for all computations.
Considering the rotation of the propeller, three kinds of simulation methods (i.e., an actuator disk method [15], a multiple reference frame (MRF) [16] method, and an unsteady sliding mesh [17] method) are often used to simulate the interference of a propeller or a fan. In the actuator disk method, the propeller is replaced with a thin disk so as to improve the computational efficiency. Although the unsteady sliding mesh method can simulate the propeller rotation and has a higher accuracy than that of the actuator disk method, it needs more computational costs when there are a lot of flight states needed to be simulated. In order to balance the requirements between the computational efficiency and accuracy, the MRF method with a lower computational cost and no geometry simplification is employed to solve the rotating field surrounding the propeller blade. The spatial discretization and the temporal discretization are accomplished by the second-order Roe flux-difference method and the implicit LU-SGS (Lower upper symmetric Gauss-Seidel) [18] method, respectively, for all the CFD computations.
Due to the importance of an accurate solution of the propeller flow field to the investigation of the wing performance, two wind tunnel models (i.e., a ducted propeller and a two-blade rotor) are simulated and tested to validate the accuracy of the MRF method.
2.1. Ducted Propeller
The three-blade geometry model of the ducted propeller (Langley Research Center, Hampton, VA, USA) is shown in Figure 1. The diameter of the propeller and the chord of the duct are 0.381 and 0.262 m, respectively. At a wind tunnel speed of 30.48 m/s, the tested Reynolds number based on the duct chord is 5 × 10⁵ and the tested propeller rotation speed is selected as 8000 r/min. The other propeller-blade and duct geometric parameters can be found in [19].
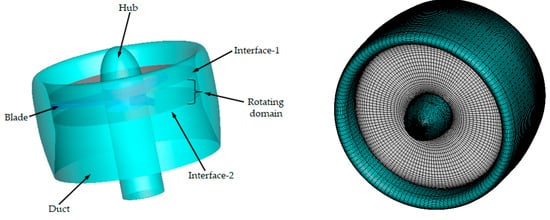
Figure 1.
Three-blade ducted propeller and its surface mesh.
For the convenience of simulating the interaction between the rotating propeller and the stationary duct, a structured and unstructured hybrid grid approach is adopted to improve the efficiency of the grid generation. Considering the highly twisted blade of the propeller, the rotating domain (i.e., a cylindrical enclosed field surrounding the propeller blade) is discretized by an unstructured mesh with 2.5 million grid cells. The stationary domain containing the rest of the field is discretized by 5 million structured grid cells. An O-grid topology is set around the duct and the hub. A distance of 50 times the chord of the duct is used in each direction from the ducted propeller to create the stationary domain. A pressure far field boundary condition is applied in the boundary of the stationary domain and a non-slip boundary condition is utilized on the surfaces of the duct, blade, and hub. Two interfaces, where the stationary domain and the rotating domain share the same boundary, are established (named as Interface-1 and Interface-2 in Figure 1) to exchange the flow information by using an interpolation method.
Table 1 compares the propeller thrust coefficients of the experimental data and the calculated results. Although there is a strong interference between the propeller blades and the duct, the results of the CFD method show good agreement with the experimental measurements. The deviation from the experiment has an increase when the angle of attack increases to 10° or 20°. The reason for this change is that a separation phenomenon occurs in the flow field at a large angle of attack which reduces the accuracy of the CFD method.

Table 1.
Comparison of the propeller thrust coefficient between the experiment and CFD methods.
2.2. Two-Blade Rotor
The Caradonna-Tung two-blade rotor (Ames Research Center, Moffett Field, CA, USA) [20] uses an NACA (National Advisory Committee for Aeronautics) 0012 profile and has an untwisted rectangular shape with an aspect ratio (span-to-chord ratio) of 6. The chord of the blade is 0.1905 m and the radius is 1.143 m. More detailed geometric parameters and experimental data can be found in [20]. In this section, a collective pitch angle of 8° and two tested rotation speeds (1750 and 2250 r/min) at a hover state are simulated to further evaluate the accuracy of the CFD method. The experimental static pressure is 103,027 Pa, temperature 289.75 K, and density 1.2389 kg/m3. The process of the grid generation is in accordance with the one from the ducted propeller.
Table 2 lists the rotor thrust coefficients [21] of the experiment and CFD method at different rotation speeds. Three mesh densities are used to conduct the grid dependence study: a coarse grid of 3.7 million cells, a medium grid of 7.5 million cells (about 5 million cells in the stationary domain and 2.5 million cells in the rotating domain), and a fine grid of 15 million cells. Figure 2 shows the convergence of the rotor thrust coefficients for different grid sizes. It is obvious that the calculated results are very close to the experimental data and the errors between them are acceptable. Figure 3 presents the chordwise pressure distribution for two blade stations at a rotation speed of 1750 r/min. On the whole, the computed pressures fall close to the measurements and the small deviations between them could be caused by the uncertainty of the experiment [22] or the numerical simulation. It indicates that the MRF method has good accuracy in capturing the characteristics in a rotating field.
Table 2.
Rotor thrust coefficients at different rotation speeds.
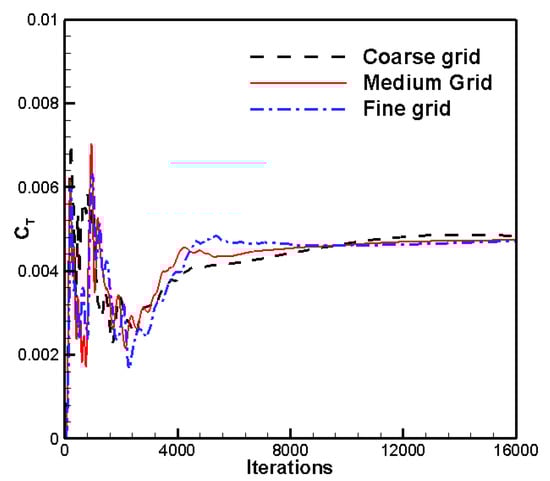
Figure 2.
Convergence of the rotor thrust coefficient for different mesh densities ( 1750 r/min).
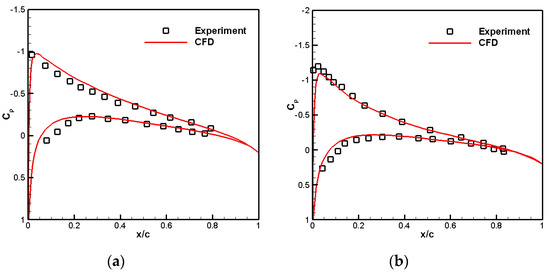
Figure 3.
Chordwise pressure distribution on the rotor blade at a rotation speed of 1750 r/min: (a) r/R = 0.68; (b) r/R = 0.89.
3. Configurations
3.1. Tractor Propeller-Wing Interaction
For a tractor propeller driven aircraft, a portion of the wing is submerged in the propeller slipstream, and its flow characteristic will be different from that of the wing outside of the slipstream because of the strong propeller interference. In this section, a tractor propeller configuration (TPC), as depicted in Figure 4, is analyzed to investigate the basic aerodynamic characteristic of the wing influenced by the propeller. The relevant calculating parameters are as follow: Reynolds number, , Mach number, Ma = 0.1017, angle of attack . The wing has a chord of 2.6 m, an aspect ratio (wing span to chord ratio) of 2, and an incidence angle of 4°. The propeller radius is 0.4125 m. The process of the mesh generation and the types of the boundary conditions for this configuration are the same as those described in Section 2. A medium gird size (i.e., about 5 million grid cells in the stationary domain and 2.5 million grid cells in the rotating domain) is used for this tractor propeller configuration to conduct the simulations.
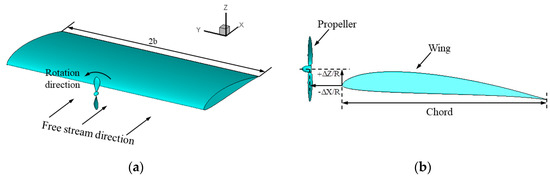
Figure 4.
A tractor propeller-wing configuration: (a) Oblique view; (b) side view.
In Figure 4a, the propeller has a clockwise rotating direction and its rotation speed is chosen to be 4400 r/min so that the propeller thrust equals the drag of the wing. For the convenience of description, the axial and vertical spacings between the propeller centerline and the wing leading edge are nondimensionalized by propeller radius R and denoted as and , respectively. It should be noted that only the influence of the vertical installation position of the propeller is considered in this section. The propeller chordwise and spanwise positions are kept as constants and located at and , respectively.
Figure 5 presents the variation of lift and drag coefficients of the wing for different propeller positions. In Figure 5a, the propeller slipstream causes a slight increase of the wing lift coefficient within a range of = 0 − 1.5 and an obvious augmentation of the drag for all . The maximal increments of CL and CD occur at = 0.75, where = 1.1% and = 18.39% compared with a clean wing with the same reference area. Due to the larger magnitude of than that of , the lift-to-drag ratio of the wing is decreases for all and the maximal reduction is observed to be by 13.33% (see Figure 5b).
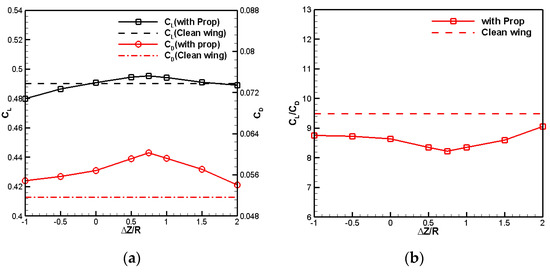
Figure 5.
Variations of lift and drag coefficients of the wing for different : (a) Lift and drag coefficients versus ; (b) lift-to-drag ratio versus . (Ma = 0.1017, , , medium grid).
The propeller injects energy into the free stream through its rotation and causes an apparent axial acceleration on the free stream, which is helpful to augment the lift of the wing. The obvious increase of the wing drag can be attributed to the increased pressure drag and skin friction drag. When the slipstream encounters the wing, the wing’s blocking effect reduces the air speed and causes the total pressure of the stagnation point at the wing leading edge to be greater than that of a clean wing, and finally leads to an increase of the pressure drag of the wing. In addition, the propeller can easily cause a turbulence boundary layer [23] for the portion of the wing immersed in the slipstream, which will have an impact on the skin friction drag of the wing. Figure 6 compares the distribution of of the clean wing and the tractor propeller configuration under the same calculation conditions. The comparison demonstrates that the increased of the wing mainly comes from the propeller slipstream region (between the two red dashed lines in Figure 6b). In this region, on one hand, the normal velocity gradient of the air near the surface of the wing is enhanced by the axial acceleration action of the propeller slipstream; on the other hand, a lot of complex high-level turbulence flow is generated in this region caused by the propeller rotation. It is these two factors that cause an increase in the skin friction drag of the wing. Since the main portion of the wing drag is the skin friction drag, its reduction through a flow control approach [24] or an outstanding aerodynamic design should draw enough attention.
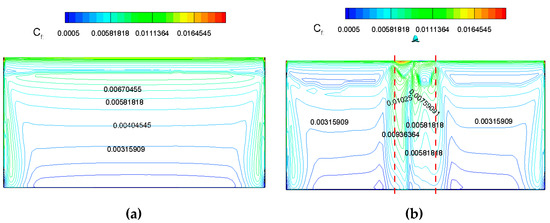
Figure 6.
Comparison of the skin friction drag coefficient distribution between the clean wing and the TPC: (a) on the clean wing; (b) in TPC configuration. (Ma = 0.1017, , , medium grid).
Except for the direct influence of the slipstream, the propeller vertical installation position also has a non-ignorable effect on the wing. With the variation of , the ratio between the slipstreams flowing through the top and bottom surface of the wing will be changed. When has a negative value, the area strongly affected by the propeller is mainly the bottom surface of the wing, where the axial acceleration effect of the propeller slipstream decreases the static pressure of the air and hence causes a reduction in the wing lift. Once the propeller is moved upward and has a small positive value, the acceleration effect makes the static pressure on the top surface of the wing more negative, which means that the suction force on this surface is enhanced and more lift can be obtained. When is further increased to be higher than 0.75, the beneficial influence of the propeller on the wing is weakened because of a far distance between them. As a result, the values of the lift and drag of the wing gradually return to those of a clean wing without the slipstream interference.
In order to demonstrate further the propeller influence on the wing, Figure 7 presents the pressure distribution along the wing span at different chordwise positions of x/c. It should be noted that y/b = −1 and y/b = 1 in this figure represent the left and right wing tips, respectively, and the propeller is located at a spanwise position of y/b = 0.
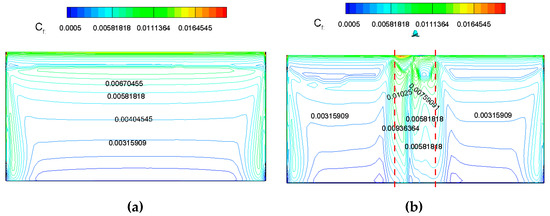
Figure 7.
Spanwise pressure distribution of the wing: (a) x/c = 0.25; (b) x/c = 0.5. (Ma = 0.1017, , , medium grid).
Since a chordwise position of x/c = 0.25 (see Figure 7a) on the wing is very close to the propeller blade, an apparent lift enhancing effect caused by the slipstream acceleration action occurs at the segment of the wing within a scope of the propeller diameter when is raised. For the portion of the wing outside of the propeller diameter; however, the pressure coefficient is almost identical to that of the clean wing. This result demonstrates that the influenced range on the wing is very limited; its width is slightly larger than the propeller diameter Dp. In addition, the curve trends in the scope of the propeller diameter for = −0.5 and 0.5 show that an asymmetry pressure distribution occurs at two sides of the propeller axis (y/b = 0). The reason for this phenomenon is the upwash and downwash effects induced by the corresponding up-going and down-going propeller blades. These two effects increase and decrease the local effective angle of attack of the wing, respectively, and then result in the difference at the symmetry locations with respect to the propeller axis. The locations of upwash and downwash regions depend on the propeller rotation direction, and the final shape of the spanwise pressure distribution curve will be determined simultaneously by the propeller mounted position and its rotation direction.
When the propeller slipstream flows downstream, its kinetic energy decreases rapidly due to the viscous dissipation of the air. As a result, the axial acceleration action is correspondingly weakened. Meanwhile, the presence of the wing divides the slipstream into two parts, and it suppresses the circumferential rotation of the slipstream obviously, which causes the upwash and downwash effects also to be weakened. Due to the diminished influence of the propeller, the lift increment at x/c = 0.5 is less than that at x/c = 0.25, and the curve of the spanwise pressure distribution is restored basically to be symmetry.
3.2. Fuel Saving Double Channel Wing Configuration
The results presented in Figure 5 indicate that the tractor propeller slipstream increases the lift and drag of the wing and results in a considerable reduction in its lift-to-drag ratio. Moreover, the variation of the vertical installation position of the propeller can affect this aerodynamic behavior of the wing significantly. For some values of , the propeller slipstream will be helpful for the wing to reduce its drag, despite the fact that the wing drag affected by the propeller is larger than that of a clean wing. Based on the above results, there is a possibility that the wing drag could be further reduced to a magnitude which is smaller than that of the clean wing and then the lift-to-drag ratio is improved apparently if the propeller is located at a reasonable position. In order to realize this possibility, in this section, an analysis of an isolated propeller (see Figure 8) flow characteristic is necessary and important.
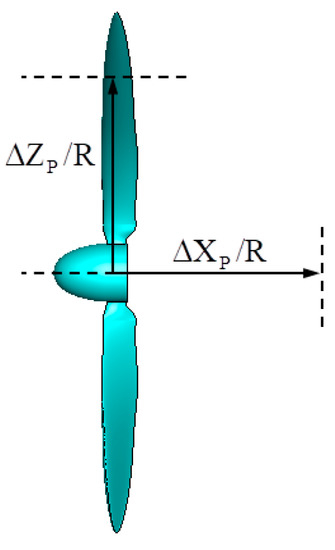
Figure 8.
Axial and radial positions of an isolated propeller.
The induced velocity distribution of an isolated propeller is described in Figure 9, whose calculation parameters are as follows: Rotation speed, , propeller radius, R = 0.4125 m, Mach number, Ma = 0.1017, angle of attack , the Reynolds number based on the wing chord in Figure 4 is unchanged (i.e., ). A medium grid size of 7.5 million is used again for the simulation of the propeller. In this figure, and are the dimensionless axial and radial positions, respectively, is an increment of the local axial velocity and is the free stream velocity.
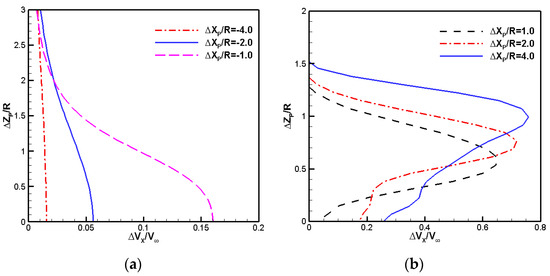
Figure 9.
Distributions of the propeller induced velocity for different locations: (a) Upstream of the propeller disk; (b) downstream of the propeller disk. (Ma = 0.1017, , , medium grid size).
It indicates that the induced velocity distributions upstream and downstream of the propeller disk are quite different from each other. In Figure 9a, a low pressure region is generated in front of this disk by the propeller rotation and it produces a suction action on the free stream. The closer to the propeller disk, the more dimensionless increment of the axial speed, denoted as in Figure 9, can be obtained. Take the case of as an example, the rapidly increases from 0.015 to 0.16 when changes from a value of −4.0 to −1.0. Obviously, this suction action can be apparently enhanced as approaches zero.
Compared with the result in Figure 9a, Figure 9b demonstrates that the axial acceleration effect of the slipstream behind the propeller is stronger than that induced by the suction effect. For , the maximal increment of the air speed is about four times that at . Although the propeller slipstream accelerated the free stream considerably, the scope of the inducing action caused by the slipstream is very limited. Taking the result of as an example again, the maximal radial distance from the propeller axis affected by the slipstream is slightly larger than the propeller radius. For the case of depicted in Figure 9a; however, this radial distance can be three times the propeller radius.
So the slipstream behind the propeller disk has a stronger action than the suction effect in front of the propeller in accelerating the free stream. However, the latter can generate a larger region to increase the air velocity. Considering their respective advantages, perhaps both beneficial effects can be used simultaneously to reduce the wing drag and increase its lift-to-drag ratio. In order to realize this goal, a new configuration is needed.
For the purpose of utilizing the suction effect ahead of the propeller, it is better that the propeller is placed above the wing, which is called over-the-wing (OTW) propeller configuration [25,26,27]. The experimental result demonstrates that the OTW configuration has an excellent advantage of reducing the wing drag through the propeller blade suction compared with a tractor propeller arrangement, while its lift enhancing capability is slightly weaker than the latter. In order to make good use of the potential favorable effects occurring at both sides of the propeller disk to influence the wing, combining the advantages of TPC and OTW into a new configuration is probably an effective way.
In order to maximize the suction strength of the propeller, the induced velocity distribution in Figure 9a needs to be analyzed again. For , it is seen that there is a rapid increment of the free-stream velocity once , and the magnitude is very close to the maximum when . Therefore, it is necessary to make the propeller as close as possible to the wing in the vertical direction to enforce the suction effect to be effective. A preferable way is to set the vertical distance between them to be smaller than 1.0 R. According to the demands described above, a fuel saving double channel wing (FADCW) configuration is proposed and is shown in Figure 10.
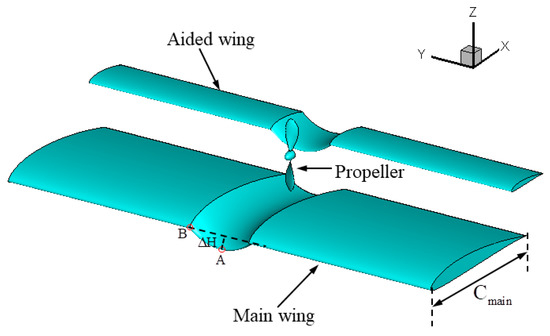
Figure 10.
Fuel saving double channel wing configuration.
In this configuration, the portion of the main wing under the propeller is designed into an arched shape [28,29] to meet the requirement of a low propeller installation position in the vertical direction. The circle center of the arc coincides with the propeller axis. In addition, the aided wing is also designed into the shape of a circular arc with the same radius as the main wing in order to avoid the center of the propeller being lower than the leading edge of the aided wing. A concept of embedding depth is adopted for the convenience of describing the bending degree of the arced wing. It is defined as the vertical distance between point A (a midpoint) and point B shown in Figure 10, and is dimensionless with the propeller radius (denoted as ). In this paper, the influence of the embedding depth is not discussed here and only the impact of is used to carry out the analysis of the aerodynamic characteristic for the FADCW configuration.
It should be noted that the chord length of the aided wing is scaled to 1/4 of that depicted in Figure 4 to avoid a significant increase of the wing drag caused by the propeller slipstream. Meanwhile, the main wing chord is reduced to 3/4 C to ensure that the total reference area of these two wings is equal to the wing in the TPC configuration. The propeller is located at 70% of the main wing chord in order to increase the wing lift as much as possible on the premise of a smaller drag than the clean wing. The vertical distance between the trailing edges of these two wings is selected as 30% of the chord of the main wing. The Reynolds number based on the wing chord in Figure 4 is still and the Mach number is Ma = 0.1017.
An aircraft’s fuel consumption depends heavily on its aerodynamic design. For a long endurance cruise, the lift-to-drag ratio is a critical parameter to measure the aerodynamic performance of an aircraft. Hence it closely relates to the fuel consumption. In order to measure and compare quantitatively the fuel saving ability between the TPC and FADCW configurations used in this paper, a relationship between the fuel consumption and the lift-to-drag ratio is necessary. Assume that these two configurations fly at the same altitude and weight, so the fuel consumption (FC) ratio for them will be proportional to the ratio of their cruise power, which can be expressed as follows:
where FC represents the fuel consumption, T and V are the thrust and cruise speed at a cruise state, respectively.
Since the thrust at a cruise state should be equal to the drag of an aircraft in order to maintain a steady flight, the thrust T in Equation (1) can be replaced by:
where W is the weight of the aircraft, is the lift-to-drag ratio.
In addition, with the same weight and reference wing area, the relation between the cruise speed V and the lift coefficient for TPC and PADCW configurations can be expressed as:
Substituting Equations (2) and (3) into Equation (1), the expression of the relationship between the fuel consumption and the lift-to-drag ratio is:
Equation (4) indicates that the fuel consumption ratio between TPC and FADCW configurations is inversely proportional to their ratio of , which means that an aircraft with a high lift-to-drag ratio () has a low fuel consumption at the cruise state.
Figure 11 compares the lift, drag coefficients, and lift-to-drag ratio at different angles of attack of the clean wing, TPC, and FADCW configurations. A grid-dependence study is conducted for the FADCW configuration and the results are also shown in this figure. The grid sizes used here are a coarse grid of 3.7 million cells, a medium grid of 7.5 million cells, and a fine grid of 15 million cells.
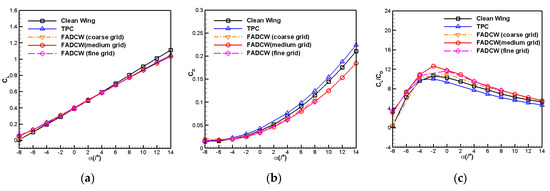
Figure 11.
Comparisons of aerodynamic forces for different configurations (Ma = 0.1017, ): (a) , (b) , (c) .
The results show that there is a good linear relationship between the lift coefficient (Figure 11a) and the angle of attack in the TPC and FADCW configurations, even if the propeller aerodynamic interference is strong and complex. The lift for the TPC and FADCW are almost the same for all angles of attack. When , the lift coefficient for the FADCW is slightly larger than that of the clean wing. While the opposite is true when . Therefore, the lift slope for FADCW decreases slightly by 3.8% compared with the clean wing.
In Figure 11b, the drag coefficient for the FADCW begins to be smaller than that of the clean wing and the TPC when . The larger the angle of attack, the greater the decrement of the drag that can be obtained. Benefiting from the drag reduction, the lift-to-drag ratio for the FADCW is augmented apparently at large range of . With the help of the propeller interference, the FADCW configuration has capabilities of decreasing the wing drag and increasing its aerodynamic efficiency.
For the further comparison, Table 3 lists the detailed calculation results at an angle of attack of . It should be noted that all the changes in value in this table are relative to the clean wing.
Table 3.
Comparisons of CL, CD, and CL/CD at (Ma = 0.1017, , medium grid).
It is seen that the FADCW has a slight advantage over the TPC in increasing the wing lift. Considering the computational error; however, this advantage is so small that it can even be neglected. As for the drag coefficient, there is an increment of 11.59% for TPC but a decrement of 10.41% for the FADCW. As a result, the lift-to-drag ratios of these two configurations are reduced and augmented by 10.28% and 13.29%, respectively. According to Equation (4), the fuel consumption ratio between FADCW and TPC configurations is
This result means that the FADCW configuration can reduce the fuel consumption by 20.15% compared with the TPC configuration. So the comparisons described above demonstrate that it is effective for FADCW to make good use of the suction action in front of the propeller and the slipstream acceleration behind the propeller to improve the wing performance, especially for drag reduction. The design idea has been proven to be reasonable and successful.
The primary advantage of the FADCW is its ability of reducing the drag. To be able to make sure of the reason for the decreased total drag in the FADCW, Table 4 compares the pressure and skin-friction drag coefficients between the TPC and FADCW. For an intuitive observation, the results are given in terms of their respective increments compared to the clean wing. It is seen that with the favorable propeller influence, the pressure drag coefficient (denoted as ) of the wing in FADCW is reduced by 7.40%, and the skin friction drag coefficient is only 66.37% of that in TPC. Therefore, the decrease of the total drag in FADCW can be attributed to the simultaneous reduction in and , which is contrary to the result of TPC.
Table 4.
Comparison of drag coefficient between the TPC and FADCW. (Ma = 0.1017, , , medium grid).
Figure 12 presents the pressure distribution for the TPC and FADCW, respectively. For the tractor propeller configuration shown in Figure 12a, the presence of the wing retards the high speed propeller slipstream and then causes the static pressure and the affected area at the leading edge of the wing (marked with a black oval dashed line) to be larger than those at other positions. Although the low pressure area on the upper surface of the wing covers about 90% of the wing span, the propeller slipstream only increases the negative pressure of the wing in the slip zone and there is no apparent favorable interference in the region outside of the slip.
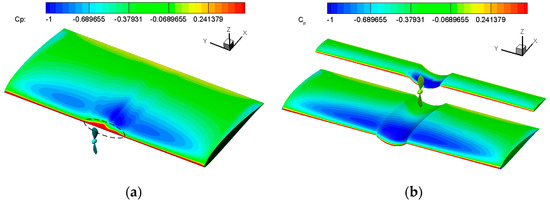
Figure 12.
Pressure distributions in TPC and FADCW configurations: (a) TPC; (b) FADCW. (Ma = 0.1017, , , medium grid).
For the FADCW shown in Figure 12b, the propeller and the main wing constitute an over-the-wing propeller arrangement. The influence of the propeller on the wing is mainly caused by the suction action in front of the propeller blade. Because of this effect, the negative pressure on the top surface of the main wing is enhanced further and the width of the influenced area along the wing span is enlarged to be at least four times the propeller radius, which are helpful in aiding a considerable reduction of the pressures drag coefficient for the main wing. In addition, the aft of the main wing’s top surface and the bottom surface of the induced wing form a rectangular duct. When the free stream approaches this duct gradually, its velocity will be increased because of the contraction of the cross area of this duct, which is also beneficial for the decrease of the main wing’s pressure drag.
Regarding the induced wing, the flow characteristics of the propeller-wing interaction shown in Figure 12a are also reflected here. Since the chord of the induced wing is only 1/4 of that in TPC, the blocking effect caused by the induced wing on the slipstream is weakened significantly, which leads to a small pressure drag on the induced wing.
The main reason for the decreased skin friction drag coefficient in the FADCW configuration is the considerable reduction of the wing area strongly washed by the propeller. In the flow field downstream of the propeller disk, most of the free stream turbulence is augmented due to the propeller interference, and it results in an increase of for the portion of the wing submerged in the slipstream. Since the propeller is located over the main wing, there is no direct washing action of the slipstream on the main wing. Although indirect interaction between the propeller slipstream and the main wing exists, it mainly occurs at the aft of the main wing. Therefore, the area of the main wing affected by the propeller is much smaller than that in the TPC. As for the induced wing, a segment of it is washed strongly and directly by the slipstream; however, the shortened chord reduces its wetted area to be 1/4 of the clean wing in Figure 4, and then causes an apparent decrease of . The calculated result indicates that the skin friction drag of the induced wing is about 20% of the original wing.
Figure 13 describes the effect of the propeller rotation speed on the aerodynamic forces of the wing for the TPC and FADCW. The results show that the lift and drag coefficients increase nearly linear with the augmentation of the propeller rotation speed. When , the FADCW begins to have a lift-enhancing capability. A maximal increment of 11.07% relative to the clean wing can be acquired when the rotation speed is increased to . The comparison between the lift curve slopes of the TPC and FADCW demonstrates that the FADCW has a higher growth rate for and its lift is more sensitive to the change of the propeller rotation speed. Regarding the drag coefficient shown in Figure 13b, it is seen that the FADCW reduces the wing drag for all of the calculation speeds. Although the has a maximum at , it still decreases by 2.16% compared with the clean wing. Due to the decreased drag, the lift-to-drag ratio of the FADCW increases for all of the rotation speeds and the maximum occurs at , where the increment reaches 14.45%.
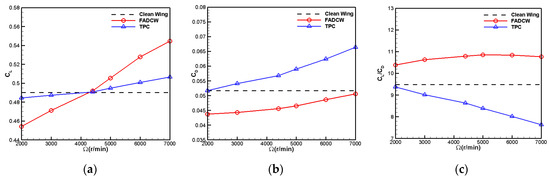
Figure 13.
The effect of the propeller rotation speed on TPC and FADCW (Ma = 0.1017, , medium grid): (a) ; (b) ; (c) .
Figure 14 compares the pressure distribution of y/b = 0 at different propeller rotation speeds. When , the pulling force of the propeller is almost zero and the suction action in front of the propeller blade is so slight that it fails to produce a significant acceleration on the air flowing across the upper surface of the main wing. Once the rotation speed increases (see Figure 14b); however, the enhanced suction effect strengthens the negative pressure on the wing’s upper surface and in front of the propeller disk, as a result, the chordwise range of this low pressure zone is enlarged. In addition, for a high rotation speed, the stronger slipstream behind the propeller also increase greatly the suction force on the top surface of the induced wing, which improves the contribution of the induced wing lift to the total one from 10.4% () to 12.5% (). Regarding the composition of the drag, the induced wing maintains a contribution of about 19% for all calculated rotation speeds.
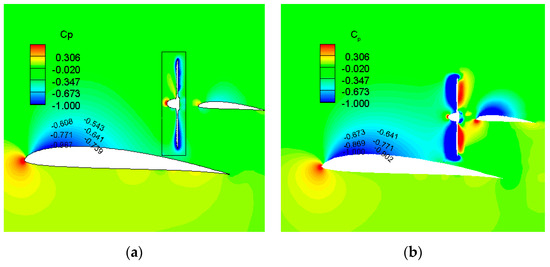
Figure 14.
Pressure contours at different rotation speeds: (a) 2000 r/min; (b) 4000 r/min. (Ma = 0.1017, , medium grid).
4. Conclusions
This paper proposes a fuel saving double-channel wing (FADCW) configuration and investigates its aerodynamic performance using the CFD method. The basic idea of the FADCW configuration is to improve the lift-to-drag ratio and thus reduce the fuel consumption by making use of the favorable effects of a propeller.
For the tractor propeller-wing arrangement analyzed in this paper, the propeller slipstream washes the wing directly and strongly and increases the wing lift and drag. The results indicate that there is a small augmentation in lift while the wing drag is increased by 11.59%, which leads to a detrimental reduction of 10.28% in the lift-to-drag ratio of the wing compared with an isolated wing with the same reference area.
Except for the slipstream behind the propeller disk, a suction action is also generated in front of the propeller disk. Although this effect induces a relatively smaller velocity increment compared with the slipstream, its influencing scope on the free stream is at least twice that of the slipstream. The FADCW configuration combines advantages of a tractor propeller configuration and an over-the-wing propeller configuration. Hence, it can make use of the suction effect upstream of the propeller and the slipstream acceleration downstream of the propeller to improve the aerodynamic performance of the wing. With the aid of the propeller, the FADCW increases the lift-to-drag ratio by 13.29% and reduces the fuel consumption by 20.15% compared with the TPC. It proves that the design idea presented in this paper is shown to be feasible to reduce the fuel consumption of a propeller-driven aircraft and thus enlarges its range or loiter time.
Author Contributions
Conceptualization, H.W. and W.G.; methodology, H.W. and W.G.; software, H.W.; validation, W.G. and D.L; formal analysis, H.W. and W.G.; writing—original draft preparation, H.W.; writing—review and editing, W.G. and D.L.
Funding
This research was funded by the National Natural Science Foundation of China (Grant No. 11902018) and the Pre-Research Field Fund of Equipment of China (Grant No. 61402060103 and No.61403110103).
Conflicts of Interest
The authors declare no conflicts of interest.
Nomenclature
| Re | Reynolds number, | C | wing chord, m |
| density of air, kg/m3 | Cmain | chord of the main wing for FADCW, m | |
| reference length, m | axial position of propeller centerline relative to the wing leading edge | ||
| dynamic viscosity | vertical position of propeller centerline relative to the wing leading edge | ||
| Ma | Mach number, Ma = free-stream velocity/sound speed | CT | thrust coefficient, |
| angle of attack | lift coefficient | ||
| R | propeller or rotor radius, m | drag coefficient | |
| r/R | radial coordinate along rotor radius | lift-to-drag ratio | |
| propeller or rotor rotation speed, r/min | skin friction drag coefficient | ||
| pressure coefficient, | pressure drag coefficient | ||
| static pressure, pa | increment of skin friction drag coefficient | ||
| X/C | streamwise coordinate along wing chord | increment of pressure drag coefficient | |
| b | semi span of wing, m | increment of axial free stream velocity | |
| y/b | spanwise position along wing span | free stream velocity |
References
- Noll, T.E.; Ishmael, S.D.; Henwood, B.; Perez-Davis, M.E.; Tiffany, G.C.; Madura, J.; Gaier, M.; Brown, J.M.; Wierzbanowski, T. Technical Findings, Lessons Learned, and Recommendations Resulting from the Helios Prototype Vehicle Mishap; NASA Langley Research Center: Hampton, VA, USA, 2007; NASA-20070022260.
- Borer, N.K.; Patterson, M.D.; Viken, J.K.; Moore, M.D.; Clarke, S.; Redifer, M.E.; Christie, R.J.; Stoll, A.M.; Dubois, A.; Bevirt, J.; et al. Design and performance of the NASA SCEPTOR distributed electric propulsion flight demonstrator. In Proceedings of the 16th AIAA Aviation Technology, Integration, and Operations Conference, Washington, DC, USA, 13–17 June 2016. AIAA 2016-3920. [Google Scholar]
- Goldberg, C.; Nalianda, D.; MacManus, D. Method for simulating the performance of a boundary layer ingesting propulsion system at design and off-design. Aerosp. Sci. Technol. 2018, 78, 312–319. [Google Scholar] [CrossRef]
- Patterson, M.D.; Derlaga, J.M.; Borern, N.K. High-lift propeller system configuration selection for NASA’s SCEPTOR distributed electric propulsion flight demonstrator. In Proceedings of the 16th AIAA Aviation Technology, Integration, and Operations Conference, Washington, DC, USA, 13–17 June 2016. AIAA 2016-3922. [Google Scholar]
- Makino, F.; Nagai, H. Propeller slipstream interference with wing aerodynamic characteristics of mars airplane at low Reynolds Number. In Proceedings of the 52nd Aerospace Sciences Meeting, National Harbor, MD, USA, 13–17 January 2014. AIAA 2014-0744. [Google Scholar]
- Stoll, A.M.; Bevirt, J.B.; Moore, M.D.; Fredericks, W.J.; Borer, N.K. Drag reduction through distributed electric propulsion. In Proceedings of the 14th AIAA Aviation Technology, Integration, and Operations Conference, Atlanta, GA, USA, 16–20 June 2014; 2014. AIAA 2014-2851. [Google Scholar]
- Kroo, I. Propeller-wing integration for minimum induced loss. J. Aircr. 1986, 23, 561–562. [Google Scholar] [CrossRef]
- Fratello, G.; Favier, D.; Maresca, C. Experimental and numerical study of the propeller/fixed wing interaction. J. Aircr. 1991, 28, 365–373. [Google Scholar]
- Ma, S.; Qiu, M.; Wang, J.T.; Miao, T.; Jiang, X. Application of CFD in slipstream effect on propeller aircraft research. Acta Aeronaut. Astronauct. Sin. 2019, 40, 622365. (In Chinese) [Google Scholar]
- Miranda, L.R.; Brennan, J.E. Aerodynamic Effects of Wingtip-Mounted Propellers and Turbines. In Proceedings of the 4th Applied Aerodynamics Conference, San Diego, CA, USA, 9–11 June 1986. AIAA 86-1802. [Google Scholar]
- Veldhuis, L.L.M.; Heyma, P.M. Aerodynamic optimisation of wings in multi-engined tractor propeller arrangements. Aircr. Des. 2000, 3, 129–149. [Google Scholar] [CrossRef]
- Rakshith, B.R.; Deshpande, S.M.; Narasimha, R. Optimal low-drag wing planforms for tractor-configuration propeller-driven aircraft. J. Aircr. 2015, 52, 1791–1801. [Google Scholar] [CrossRef]
- Xu, J.K.; Bai, J.Q.; Huang, J.T.; Qiao, L.; Dong, J.H.; Lei, W.T. Aerodynamic optimization design of wing under the interaction of propeller slipstream. Acta Aeronaut. Astronaut. Sinica 2014, 35, 2910–2920. (In Chinese) [Google Scholar]
- Gan, W.B.; Zhang, X.C. Design optimization of a three-dimensional diffusing S-duct using a modified SST turbulent model. Aerosp. Sci. Technol. 2017, 63, 63–72. [Google Scholar] [CrossRef]
- Thouault, N.; Breitsamter, C.; Gologan, C.; Adams, N.A. Numerical analysis of design parameters for a generic fan-in-wing configuration. Aerosp. Sci. Technol. 2010, 14, 65–77. [Google Scholar] [CrossRef]
- Dumakude, N.; Kamper, M.J. Validation of BEM using CFD MRF method coupled with axial and radial induction factors. In Proceedings of the 8th AIAA Theoretical Fluid Mechanics Conference, Denver, CO, USA, 5–9 June 2017. AIAA 2017-3484. [Google Scholar]
- Liu, T.L.; Pan, K.C. Application of the sliding mesh technique for helicopter rotor flow simulation. J. Aeronaut. Astronaut. Aviat. 2012, 44, 201–210. [Google Scholar]
- Yoon, S.; Jameson, A. A lower upper symmetric Gauss-Seidel method for the Euler and Navier-Stokes equations. AIAA J. 1988, 26, 1025–1026. [Google Scholar] [CrossRef]
- Grunwald, K.J.; Kenneth, W.G. Aerodynamic Loads on an Isolated Shrouded-Propeller Configuration for Angles of Attack from −10° to 110°; NASA Langley Research Center: Hampton, VA, USA, 1962; NASA TN D-995.
- Caradonna, F.X.; Tung, C. Experimental and Analytical Studies of a Model Helicopter Rotor in Hover; Ames Research Center: Mountain View, CA, USA, 1981; NASA TM-81232. [Google Scholar]
- Brand, A.G.; McMahon, H.M.; Komerath, N.M. Surface pressure measurements on a body subject to vortex wake interaction. AIAA J. 1989, 27, 569–574. [Google Scholar] [CrossRef]
- Rezaeiravesh, S.; Vinuesa, R.; Liefvendahl, M.; Schlatter, P. Assessment of uncertainties in hot-wire anemometry and oil-film interferometry measurements for wall-bounded turbulent flows. Eur. J. Mech. B Fluids 2018, 72, 57–73. [Google Scholar] [CrossRef]
- Vinuesa, R.; Negi, P.S.; Atzori, M.; Hanifi, A.; Henningson, D.S.; Schlatter, P. Turbulent boundary layers around wing sections up to Rec = 1000000. Int. J. Heat Fluid Flow 2018, 72, 86–99. [Google Scholar] [CrossRef]
- Atzori, M.; Vinuesa, R.; Stroh, A.; Frohnapfel, B.; Schlatter, P. Assessment of skin-friction-reduction techniques on a turbulent wing section. arXiv 2018, arXiv:1812.03762. [Google Scholar]
- Veldhuis, L.L.M. Propeller Wing Aerodynamic Interference. Ph.D. Thesis, Delft University of Technology, Delft, The Netherlands, 2005. [Google Scholar]
- Wang, H.B.; Zhu, X.P.; Zhou, Z. Influence analysis of propeller location parameters on wings using a panel/viscous vortex particle hybrid method. Aeronaut. J. 2018, 122, 21–41. [Google Scholar] [CrossRef]
- Marcus, E.A.P.; Vries, R.; Kulkarni, A.R.; Veldhuis, L.L.M. Aerodynamic investigation of an over-the-wing propeller for distributed propulsion. In Proceedings of the 2018 AIAA Aerospace Sciences Meeting, Kissimmee, FL, USA, 8–12 January 2018. AIAA 2018-2053. [Google Scholar]
- Gunther, C.L.; Marchman, J.F.; VanBlarcom, R. Comparison of channel wing theoretical and experimental performance. In Proceedings of the 38th Aerospace Sciences Meeting and Exhibit, Reno, NV, USA, 10–13 January 2000. AIAA 2000-16170. [Google Scholar]
- Müller, L.; Heinze, W.; Kožulović, D. Aerodynamic installation effects of an over-the-wing propeller on a high-lift configuration. J. Aircr. 2014, 51, 249–258. [Google Scholar] [CrossRef]
© 2019 by the authors. Licensee MDPI, Basel, Switzerland. This article is an open access article distributed under the terms and conditions of the Creative Commons Attribution (CC BY) license (http://creativecommons.org/licenses/by/4.0/).