Article

Separation Flow Control of a Generic Ground Vehicle Using an SDBD Plasma Actuator

State Key Laboratory of Automotive Simulation and Control, Jilin University, Changchun 130025, China
*
Author to whom correspondence should be addressed.
Energies 2019, 12(20), 3805; https://doi.org/10.3390/en12203805
Submission received: 12 August 2019 / Revised: 26 September 2019 / Accepted: 30 September 2019 / Published: 9 October 2019

Abstract

:
Quiescent flow and wind tunnel tests were performed to gain additional physical insights into flow control for automotive aerodynamics using surface dielectric barrier discharge plasma actuators. First, the aerodynamic characteristics of ionic wind were studied, and a maximum induced velocity of 3.3 m/s was achieved at an excitation voltage of 17 kV. Then, the optimal installation position of the actuator and the influence of the excitation voltage on flow control at different wind speeds were studied. The conclusions drawn are as follows. The effect of flow control is better when the upper electrode of the actuator is placed at the end of the top surface, increasing the likelihood of the plasma generation region approaching the natural separation location. The pressure on top of the slanted surface is primarily affected by airflow acceleration at a low excitation voltage and by the decrease of the separation zone at a high excitation voltage. The maximum drag reduction can be realized when the maximum velocity of ionic wind reaches 1.71 m/s at a wind speed of 10 m/s and 2.54 m/s at a wind speed of 15 m/s. Moreover, effective drag reduction can be achieved only by continuing to optimize the actuator to generate considerable thrust at a high wind speed.

Graphical Abstract

1. Introduction

When vehicles are driven at a speed of over 80 km/h, more than 60% of their energy consumption is generated by drag. In addition, the energy consumption can be reduced by 3.5–8% for every 10% reduction of the drag coefficient. The increasingly stringent fuel consumption regulations and the urgent need for electric vehicles to improve the one-charge driving distance pose immense challenges to energy conservation and emission reductions. However, the drag reduction ability of traditional passive flow control methods, such as optimizing automobile styling [1] and installing aerodynamic accessories [2], is limited and has even basically reached its limitation. To address this issue, several new active flow control methods that use external energy to change the topological structure of the airflow around a vehicle’s body have been developed. Such methods provide the possibility of further reducing the drag of vehicles.
The key concept of active flow control is to achieve effective separation flow control by directly injecting momentum into the boundary layer and changing or overcoming the adverse pressure gradient. Common momentum injection methods include mixed jets [3], pulse jets [4,5], fluidic oscillators [6], and surface dielectric barrier discharge (SDBD) plasma actuators [7,8]. Compared with mechanical synthetic jets, an SDBD plasma actuator is a new type of active flow control device. It features a fast response and low power consumption, and does not involve moving mechanical parts and changing the shape of the controlled body [9]. However, this actuator still suffers from several debilities in terms of the durability and maximum induced flow velocity [10]. Most of the electrical energy of SDBD plasma actuators is converted into heat, and thus, their effective utilization rate is less than 0.1% [11] and the generated driving force is small. Nevertheless, SDBD plasma actuators provide a new concept for flow control, with particular advantages over other flow control methods. The momentum conversion efficiency and driving force of this type of plasma actuator have gradually been enhanced with the breakthrough in plasma theory and technology. In addition, the application prospect of SDBD plasma actuators is extremely promising [12].
The mechanisms of plasma formation are complicated and not well-understood, but the following concepts are commonly accepted. In accordance with the theory of electrohydrodynamics, the air molecules above a dielectric will be ionized when the excitation voltage reaches the breakdown value and the charged particles will move under the action of the electric field force. When ions collide with neutral particles in the gas around the actuator, the local momentum of airflow in the region is increased and ionic wind is induced [13,14]. Therefore, a plasma actuator achieves flow control by injecting momentum into the boundary layer [15,16]. This control method has been extensively studied in many fields. Most studies have focused on controlling the flow separation of airfoils [17,18,19], achieving an effective lift increase and drag reduction. Several studies have addressed aerodynamic noise control [20], icing control [21], and other issues, but research on the drag reduction of ground vehicles remains limited. The present study applies plasma actuator technology to ground vehicles. Although the speed of ground vehicles is considerably less than that of aircraft, aerodynamics has become an important issue in the current energy-conscious world.
Kim [22] used a plasma actuator on a train model for drag reduction, achieving a drag reduction of 3.3% at a wind speed of 15 m/s. Vernet [23] investigated the effect of an actuator on the flow separation of the A-pillar of a modern truck under crosswind conditions. The study showed that drag reduction could reach approximately 20% at the largest yaw angle (9°), and drag reduction was smaller at lower yaw angles. Roy [24] found that the serpentine design of plasma actuators is more effective on a near-wall flow structure than the linear design through a quiescent test. Furthermore, the drag of a 1:60 scale tractor trailer model was reduced by over 14% at 26.8 m/s (60 mph) and over 10% at 31.3 m/s (70 mph). Khalighi [25] placed actuators on the four rounded edges of an Ahmed body’s rear end (rear slant angle of 0°), achieving a drag reduction of 20% at 15 m/s. Boucinha [26] arranged actuators at different positions on the slanted surface of an Ahmed model (rear slant angle of 25°). The maximum drag reduction of 8% at a 10 m/s wind speed was achieved when an actuator was arranged on top of the slanted surface. Shadmani [27] used the steady and unsteady excitation of a plasma actuator to reduce the drag of an Ahmed model (rear slant angle of 25°) and found that drag reduction was better with the former than with the latter.
The Ahmed body [28] is a simplified geometry of automobiles with different tail characteristics. The wake flow topology of an Ahmed body changes drastically and causes a corresponding change in drag as the rear slant angle evolves from 0° to 90°. From 12° to 15°, airflow does not separate on the slanted surface and transverse vorticity is produced. This type of wake flow is occasionally considered quasi-2D [29]. From 15° to 30°, wake flow is highly 3D, with the airflow being partially separated on the slant surface, forming strong streamwise vortices. Beyond 30°, separation can also be considered quasi-2D due to the massive separation from the top of the rear slant. Figure 1 [30] shows the mean flow topology of an Ahmed body at 25° with a 3D wake flow and a high drag coefficient. This wake flow is characterized by a large separation bubble over the slanted surface and highly energetic C-pillar vortexes created along the slant side edges. Such features make an Ahmed body a good test model for studying drag reduction.
The present work conducted further experimental research on an Ahmed body (rear slant angle of 25°) to comprehensively explore the mechanism and regulation of flow control based on the research of Boucinha [26] and Shadmani [27]. First, the optimal excitation voltage and the maximum induced wind speed were obtained by studying the aerodynamic characteristics of ionic wind under different excitation voltages Vpp (peak-to-peak voltage) through a quiescent flow test. Subsequently, the upper electrode of an actuator was first arranged at the trailing edge of the top surface and then at the leading edge of the slanted surface to compare the control effect and determine the optimal installation position of the actuator. Lastly, the influence of the excitation voltage on the control effect of wake flow was studied under different Reynolds numbers.

2. Experimental Equipment

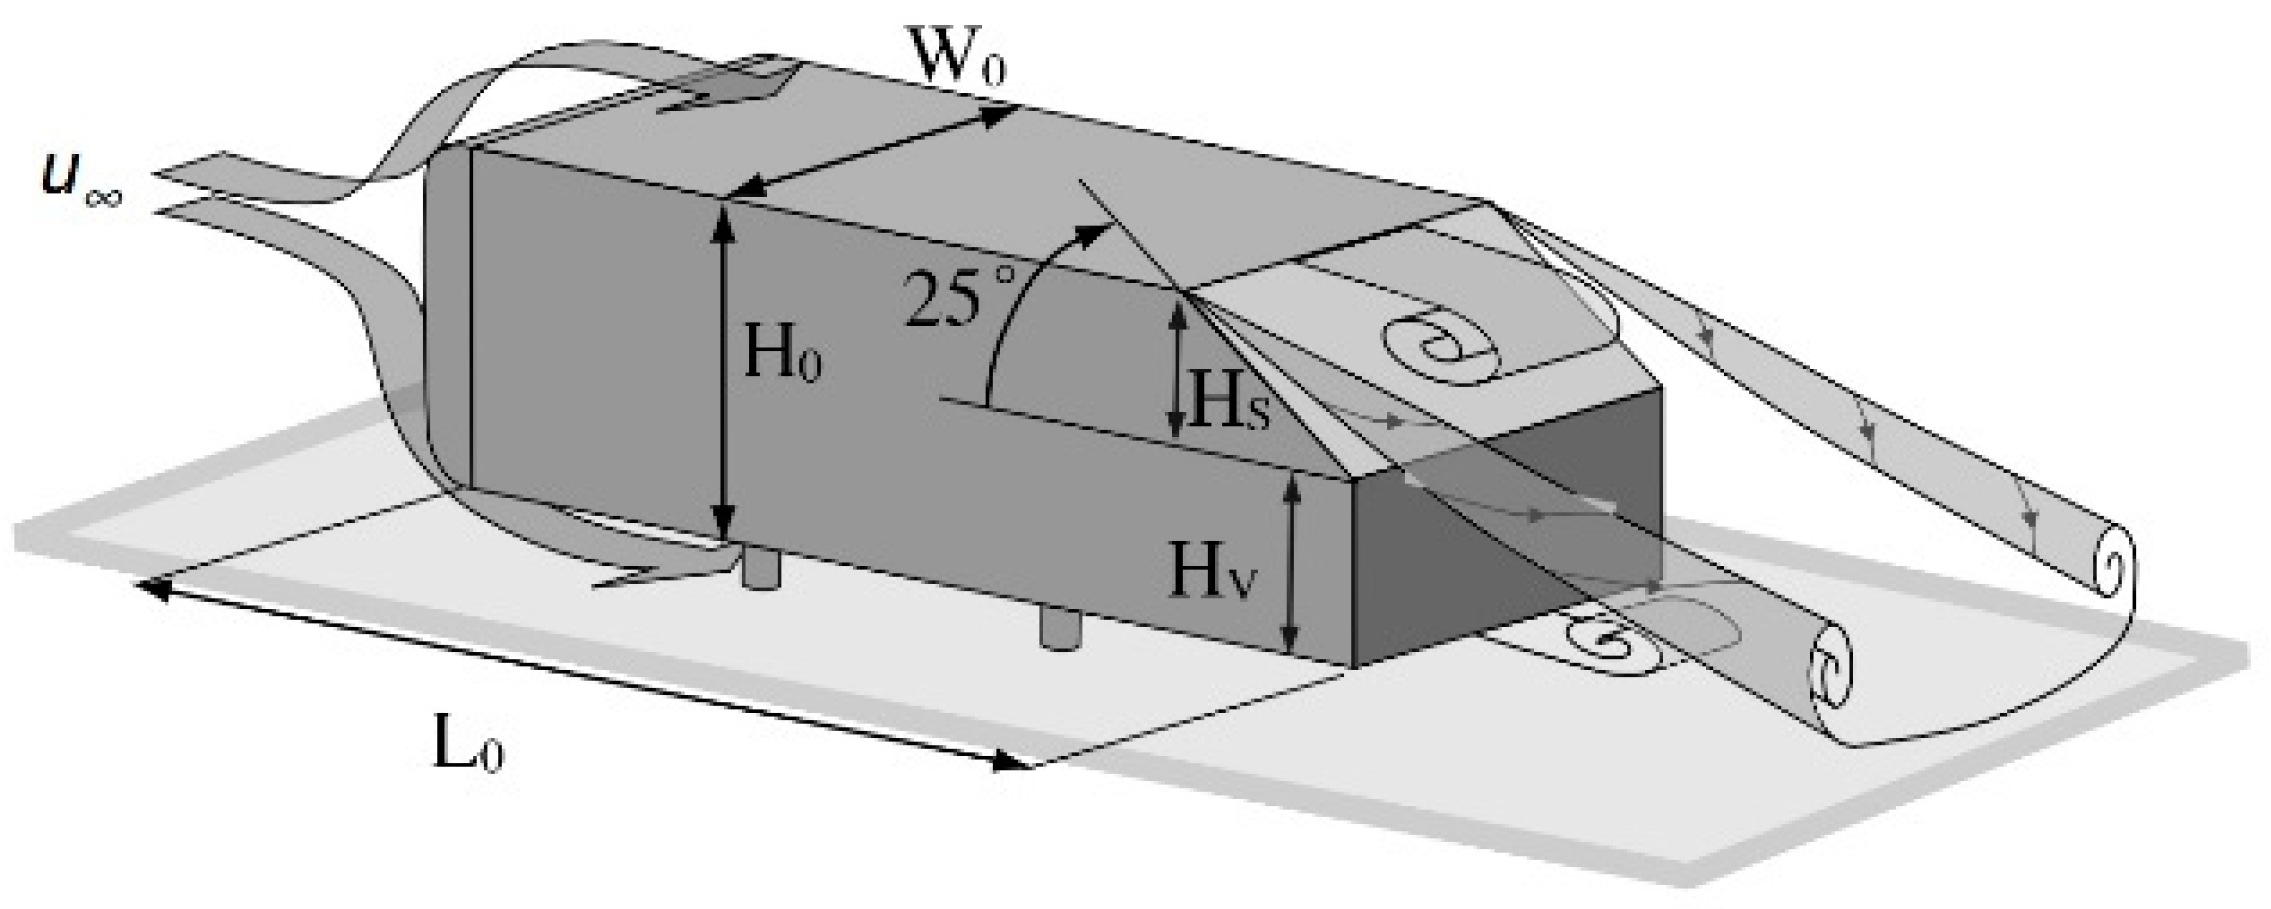
2.1. Vehicle Geometry

The present study focuses on the wake flow of the rear body with a slant angle of 25°. The dimensions of the model are as follows (Figure 1): the length L0 is 1.044 m, the height H0 is 0.288 m, and the width W0 is 0.389 m. The height of the rear slanted surface HS and rear base HV is 0.094 m and 0.194 m, respectively. The diameter of the supporting cylinder is 0.03 m, and the ground clearance of the model is 0.05 m.

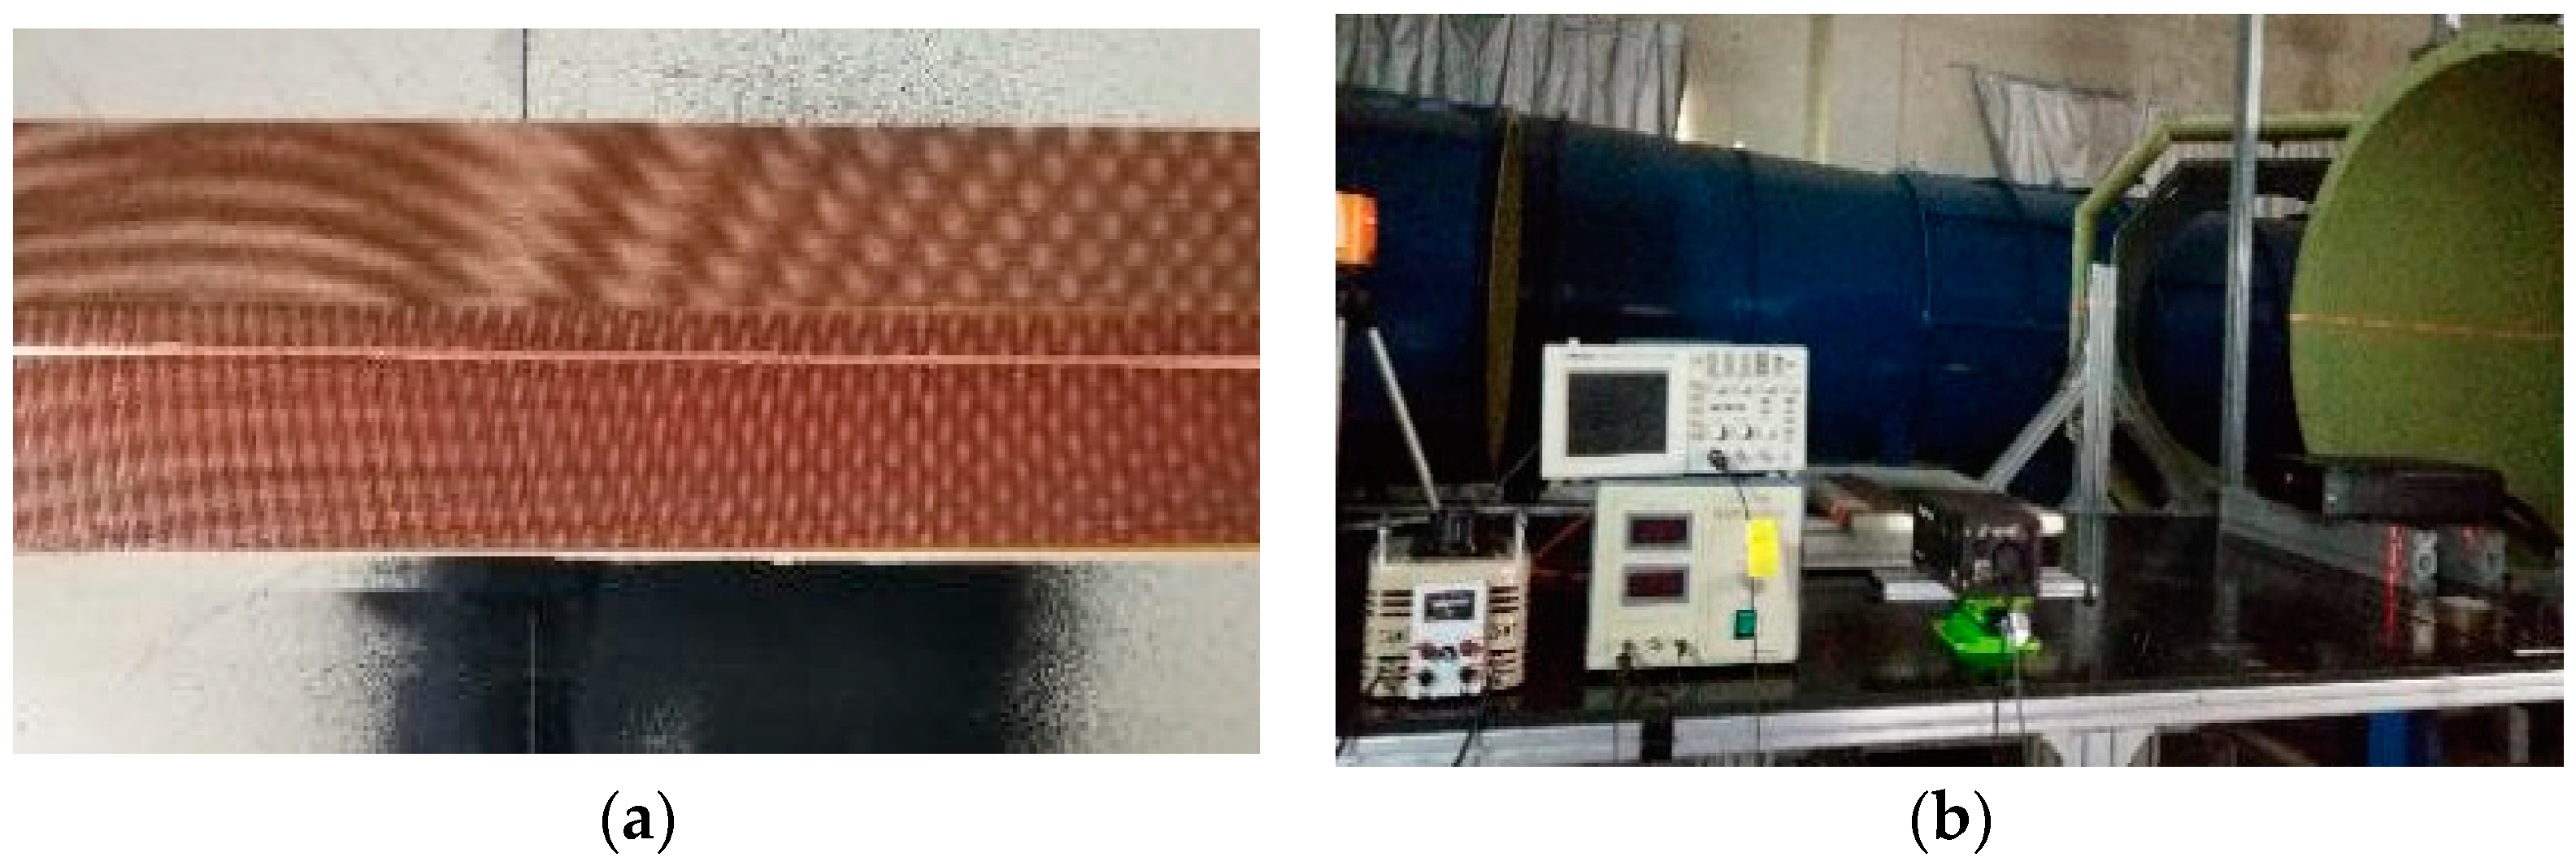
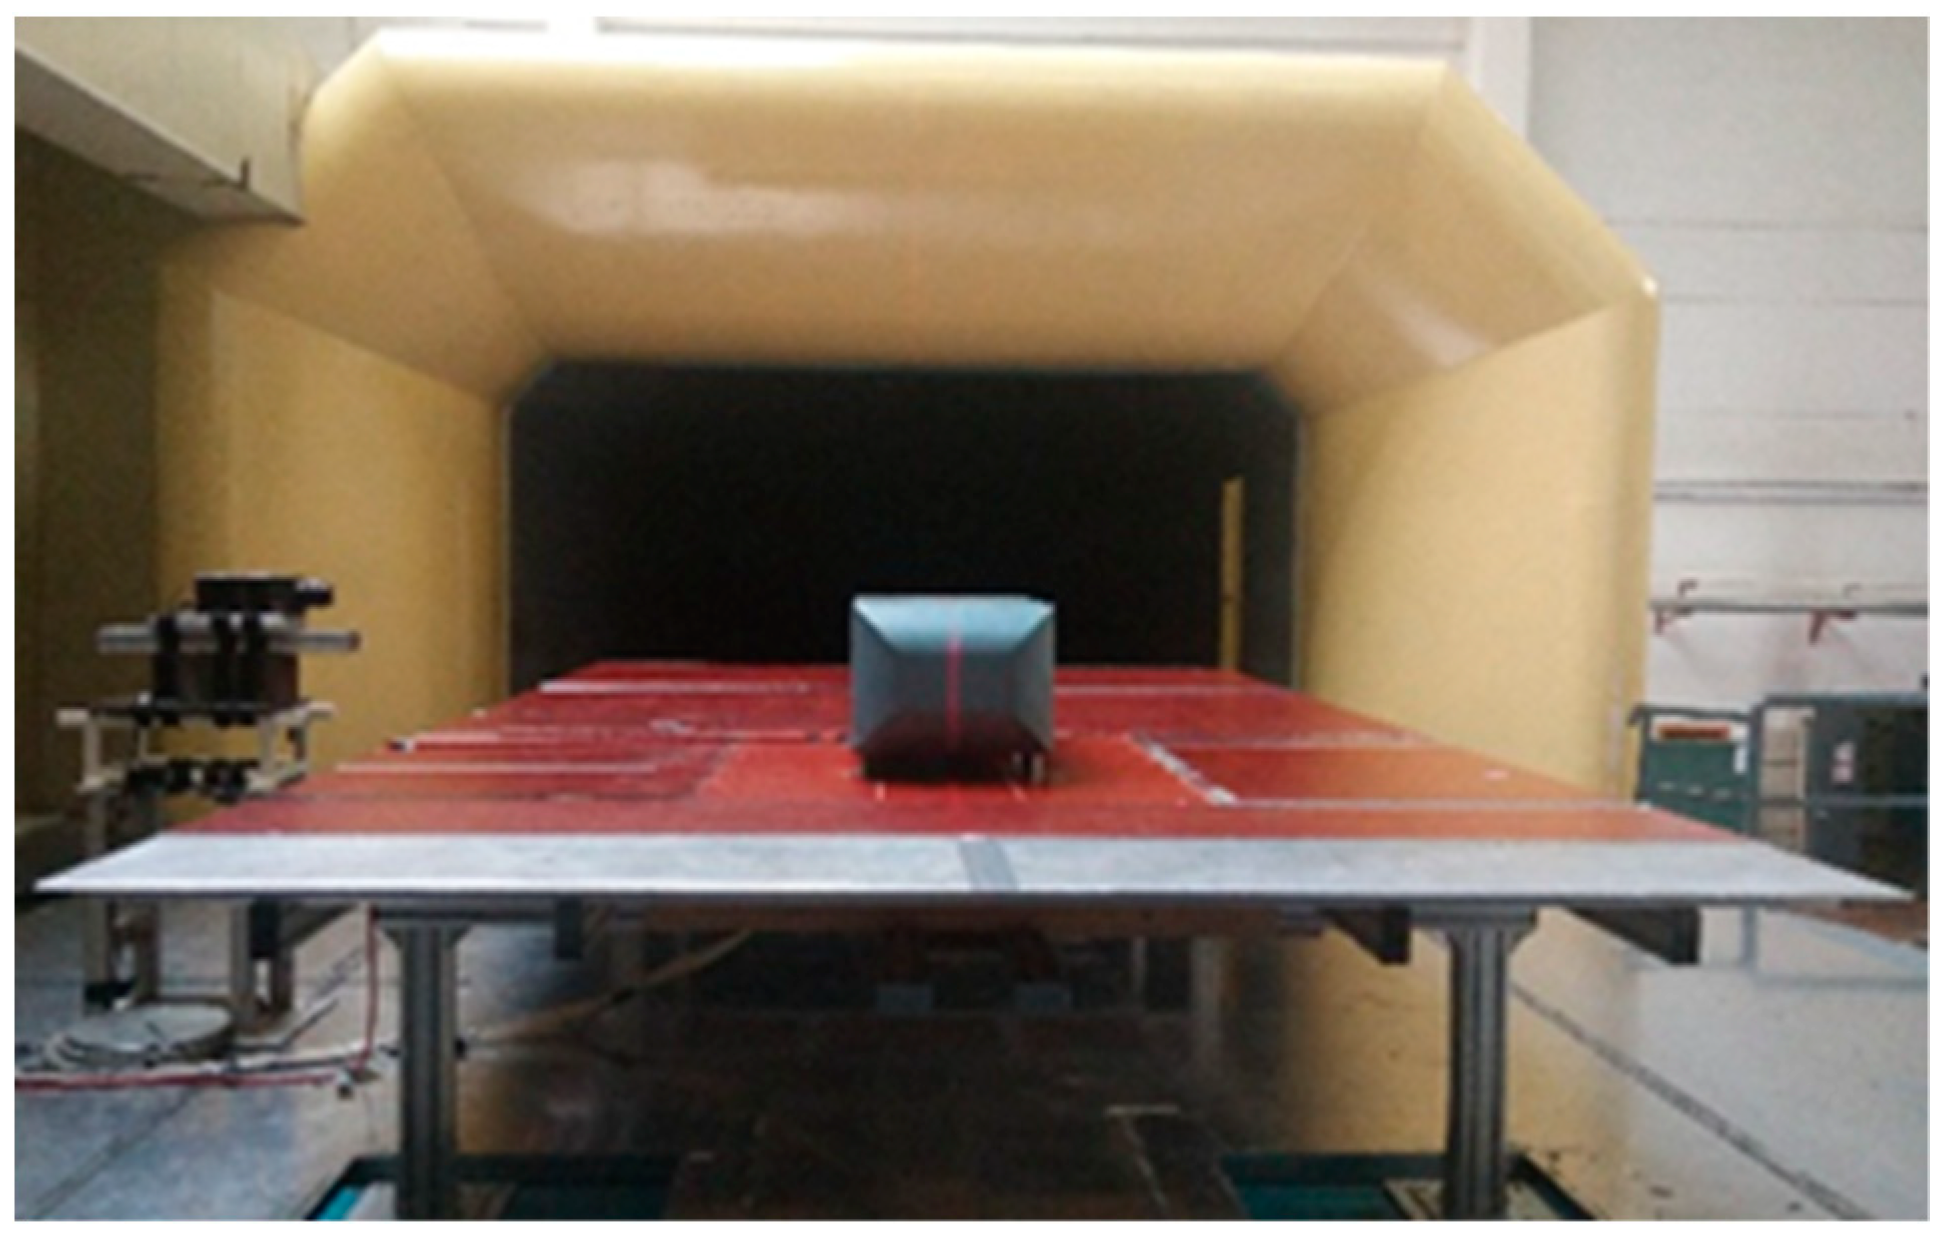
2.2. Wind Tunnel and Measuring Instrument

The model test was conducted in the return-flow automotive wind tunnel of Jilin University. The size of the wind tunnel nozzle is 4.4 m × 2 m, the length of the test section is 8 m, and the inflow turbulence intensity is less than 0.5%. The surface pressure of the model was measured using a 96-channel pressure scanner with a range of 1 psi and an accuracy of ±0.05%. Drag was measured using a six-component balance with an X-direction range of 200 N and an accuracy of 0.05%. Then, 2D particle image velocimetry (PIV) was performed to measure the flow velocity. In contrast with a pitot tube and a hot wire, this process does not produce interference on the flow field and can measure the flow velocity of the entire plane and display it visually. A PIV laser can produce a 532 nm wavelength laser with a maximum laser energy of 200 mJ, and the charge-coupled device (CCD) camera has 1024 × 1280 pixels. Narrow-band filters were attached to the lens of the CCD camera and flat lacquer was sprayed on the wall to avoid near-wall reflection. Paraffin oil droplets are nontoxic, can stay in the air for several hours, and have uniform diameters (1 μm). Hence, paraffin oil droplets were used as tracer particles for plasma-induced flow and wind tunnel measurements.

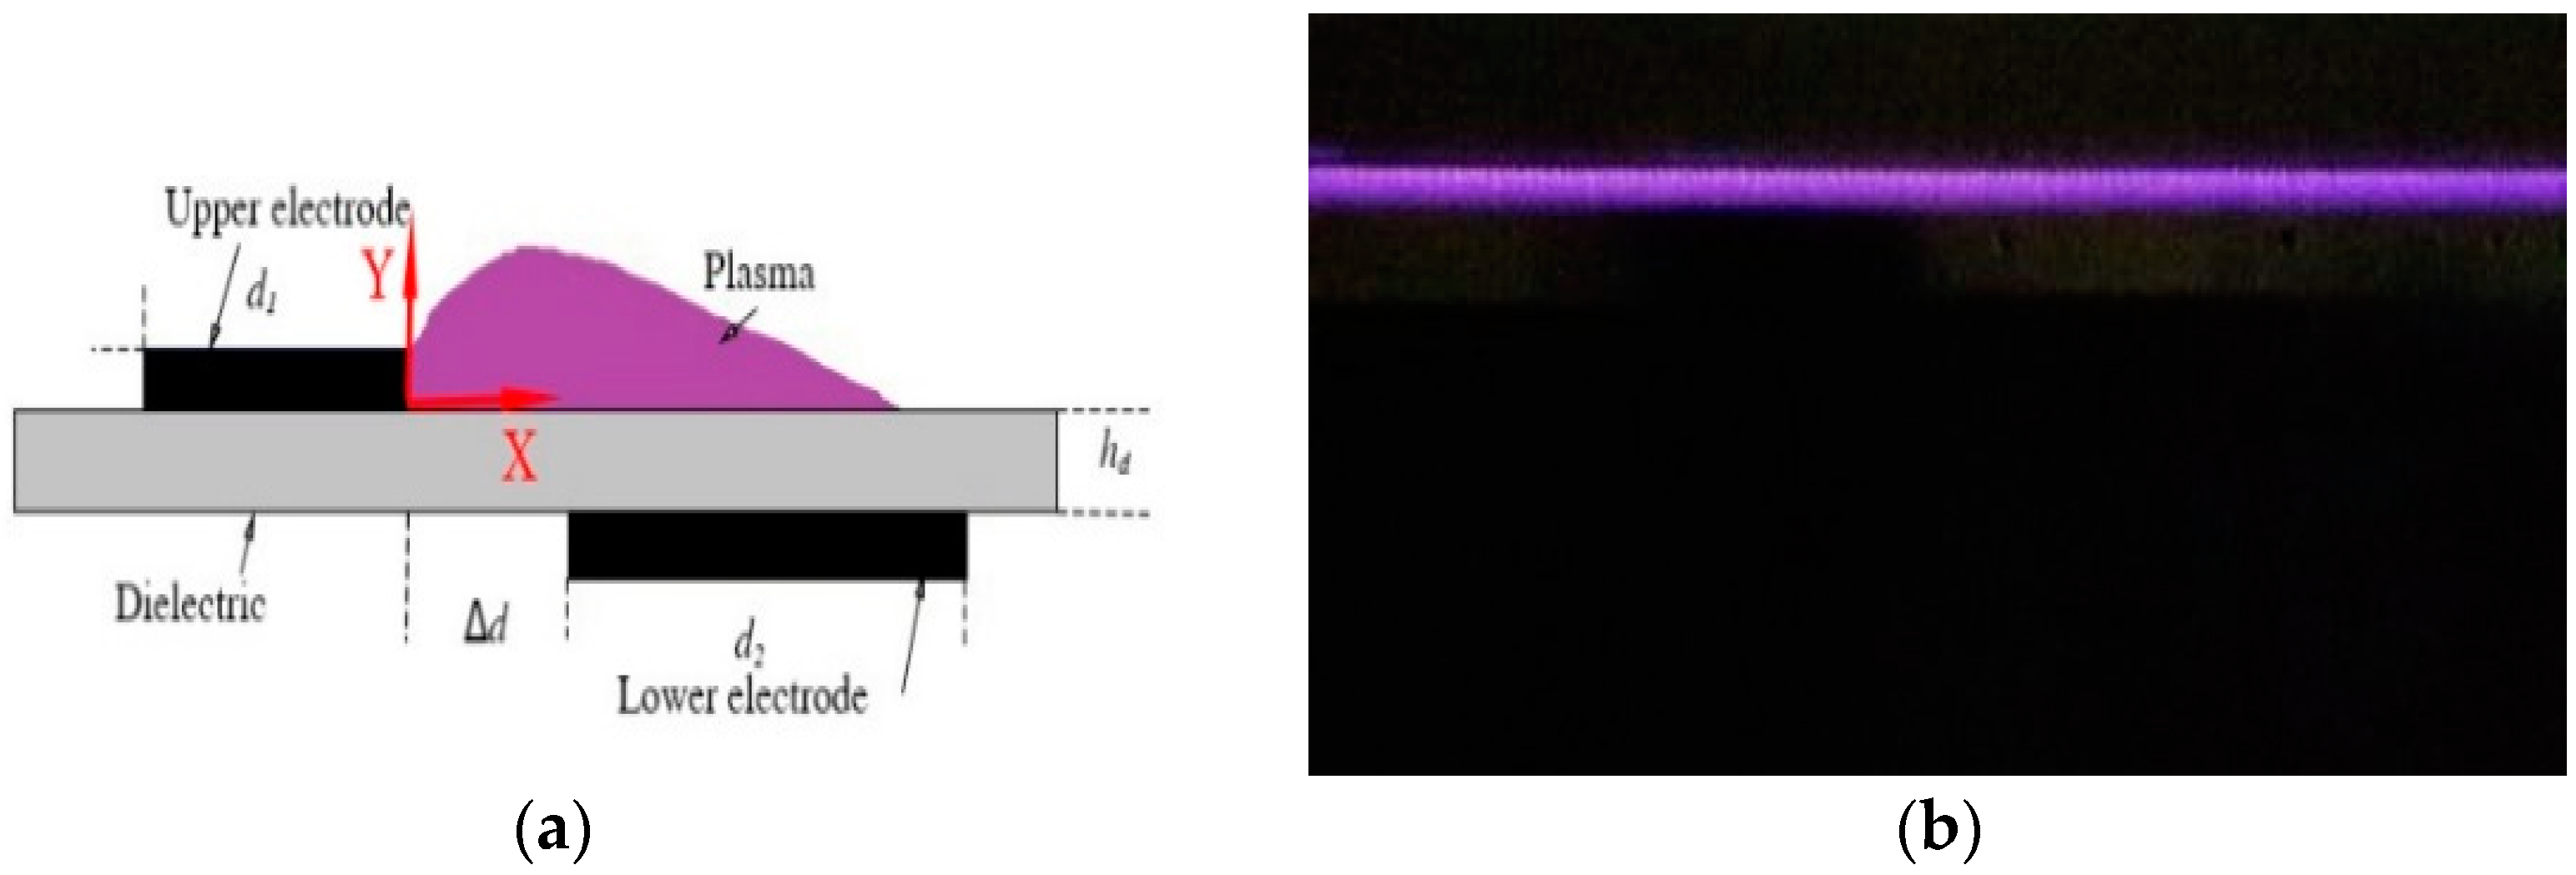
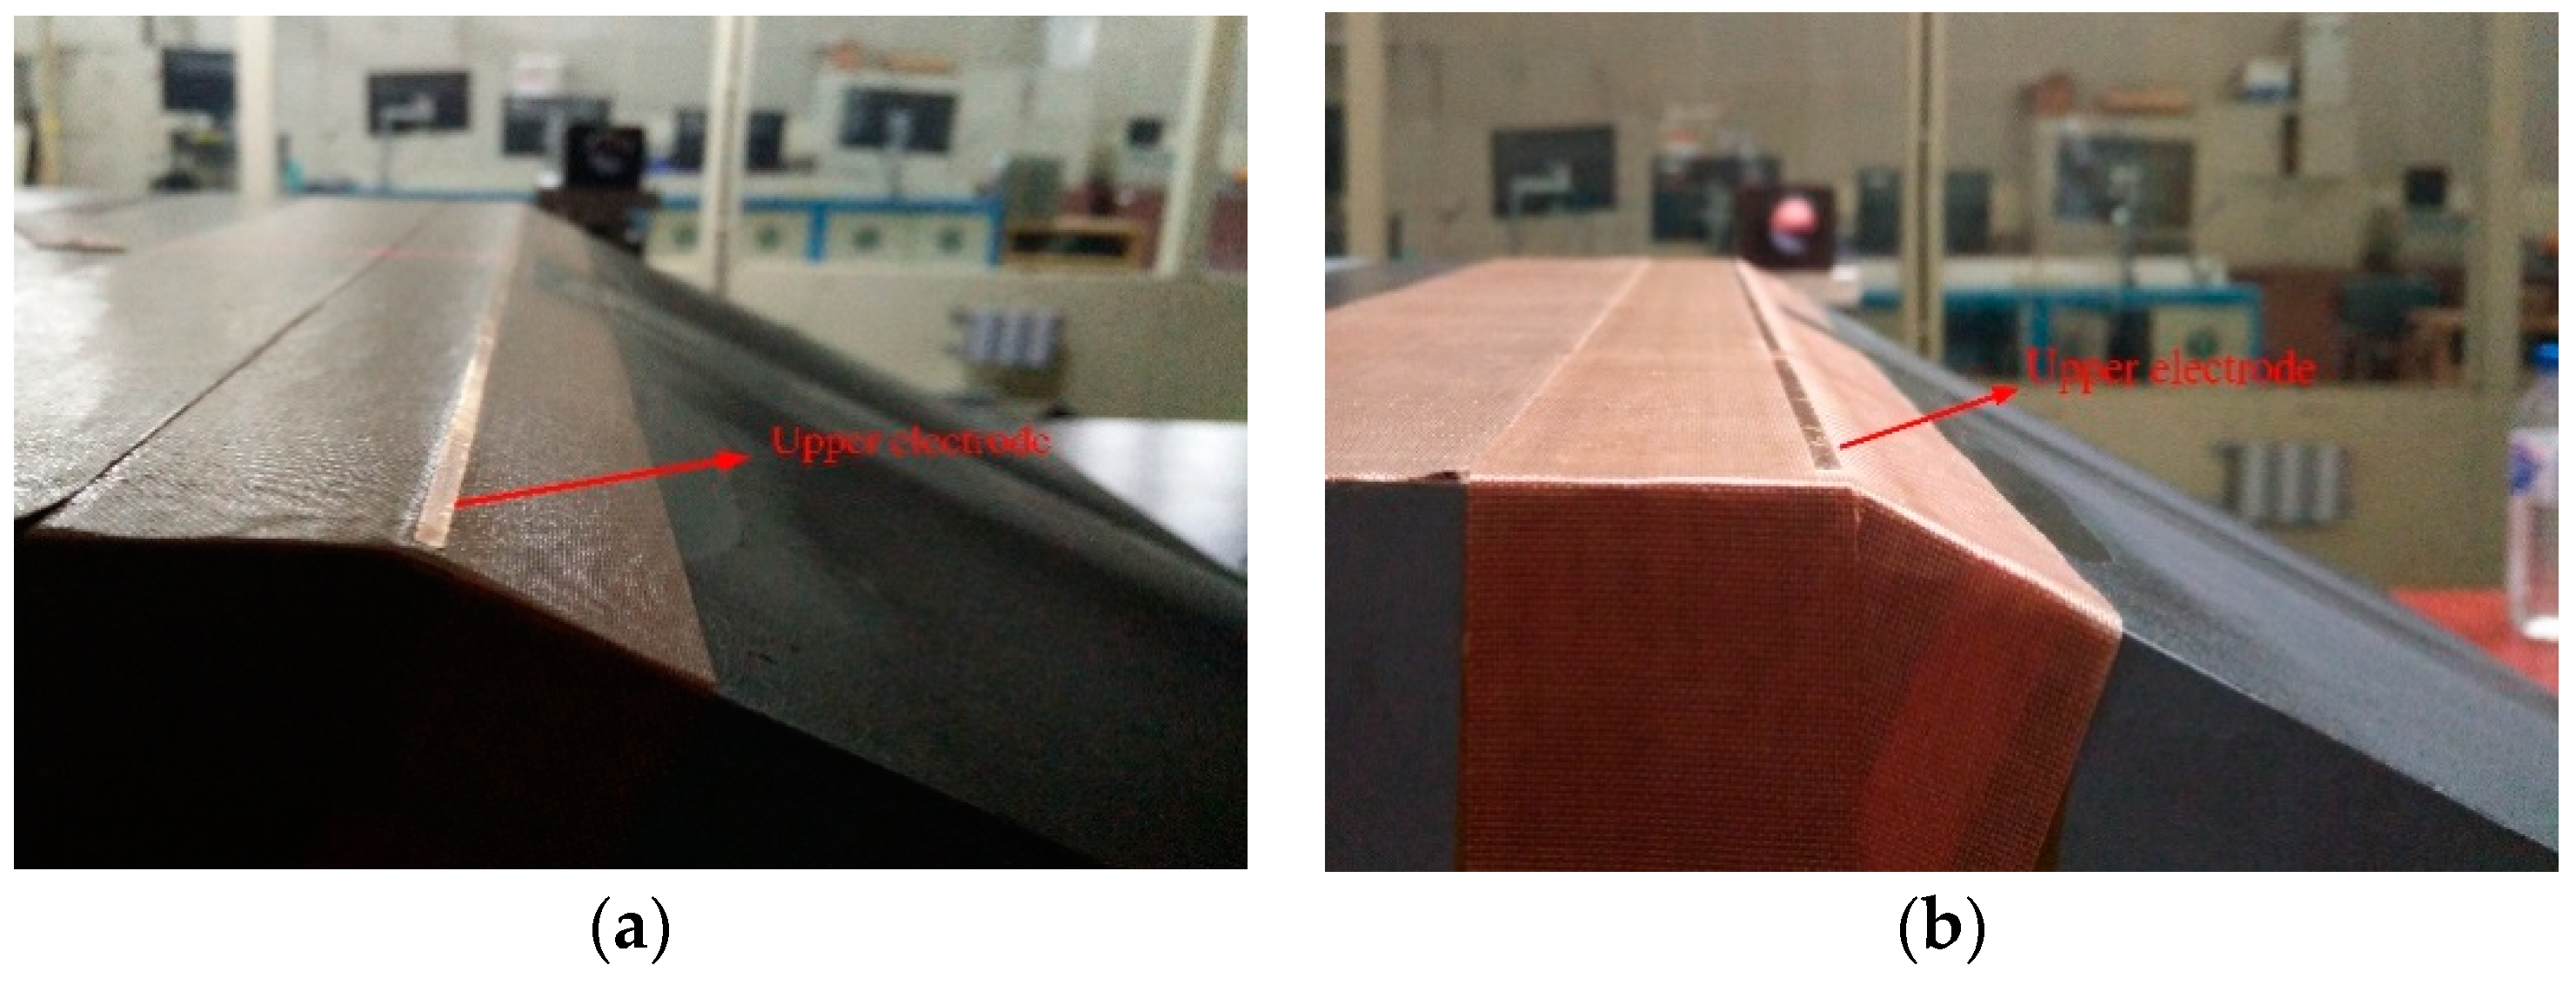
2.3. SDBD Plasma Actuator

The design of an actuator is crucial to the performance of the induced ionic wind. A thick medium, a narrow upper electrode, a wide lower electrode, and a reasonable electrode gap can induce a strong ionic wind for an actuator [31,32]. In this study, the plasma actuator used was composed of two electrodes of the same thickness of 0.06 mm with the electrode gap Δd of 1mm. The width of the upper electrode d1 was 2 mm and that of the lower electrode d2 was 20 mm. Kapton is a type of dielectric material that exhibits a good performance due to its low thickness (0.05 mm) and large relative permittivity constant (εr = 3.5). It is widely used in the design of SDBD plasma actuators. However, its poor high-temperature resistance results in the short service life of actuators. Therefore, six layers of Kapton were selected as the primary dielectric material, and a layer of Teflon (with a thickness of 0.13 mm, εr = 2.6) with high-temperature resistance was used to cover the surface in order to effectively improve the service life of the exciter. The electrodes were connected to a high-voltage AC power supply (CTP-2000K, Nanjing Suman Company, Nanjing) that provided a peak voltage of 0–30 kV and a maximum output power of 500 W. The excitation frequency of the actuator used in this study was 6.7 kHz.

3. Aerodynamic Characteristics of the Ionic Wind Induced by the SDBD Actuator

3.1. Arrangement of the Quiescent Flow Test

The actuator was arranged on a flat plate in a quiescent environment to study the aerodynamic characteristics of ionic wind, as shown in Figure 2. Consistent with the actuator installed on the Ahmed model, the effective discharge width of the actuator was 0.389 m. The excitation voltage ranged from 9 kV to 18 kV, with an increase interval of 1 kV. PIV was used to obtain the time-averaged velocity within the vertical plane of the symmetry of the actuator with an interrogation window of 32 × 32 pixels and an overlap of 50%. In addition, 500 pairs of independent images were captured for each test configuration. Figure 3a shows that the horizontal direction was set as the X-axis, the vertical direction was set as the Y-axis, and the end of the upper electrode was set as the coordinate origin in the PIV velocity field.

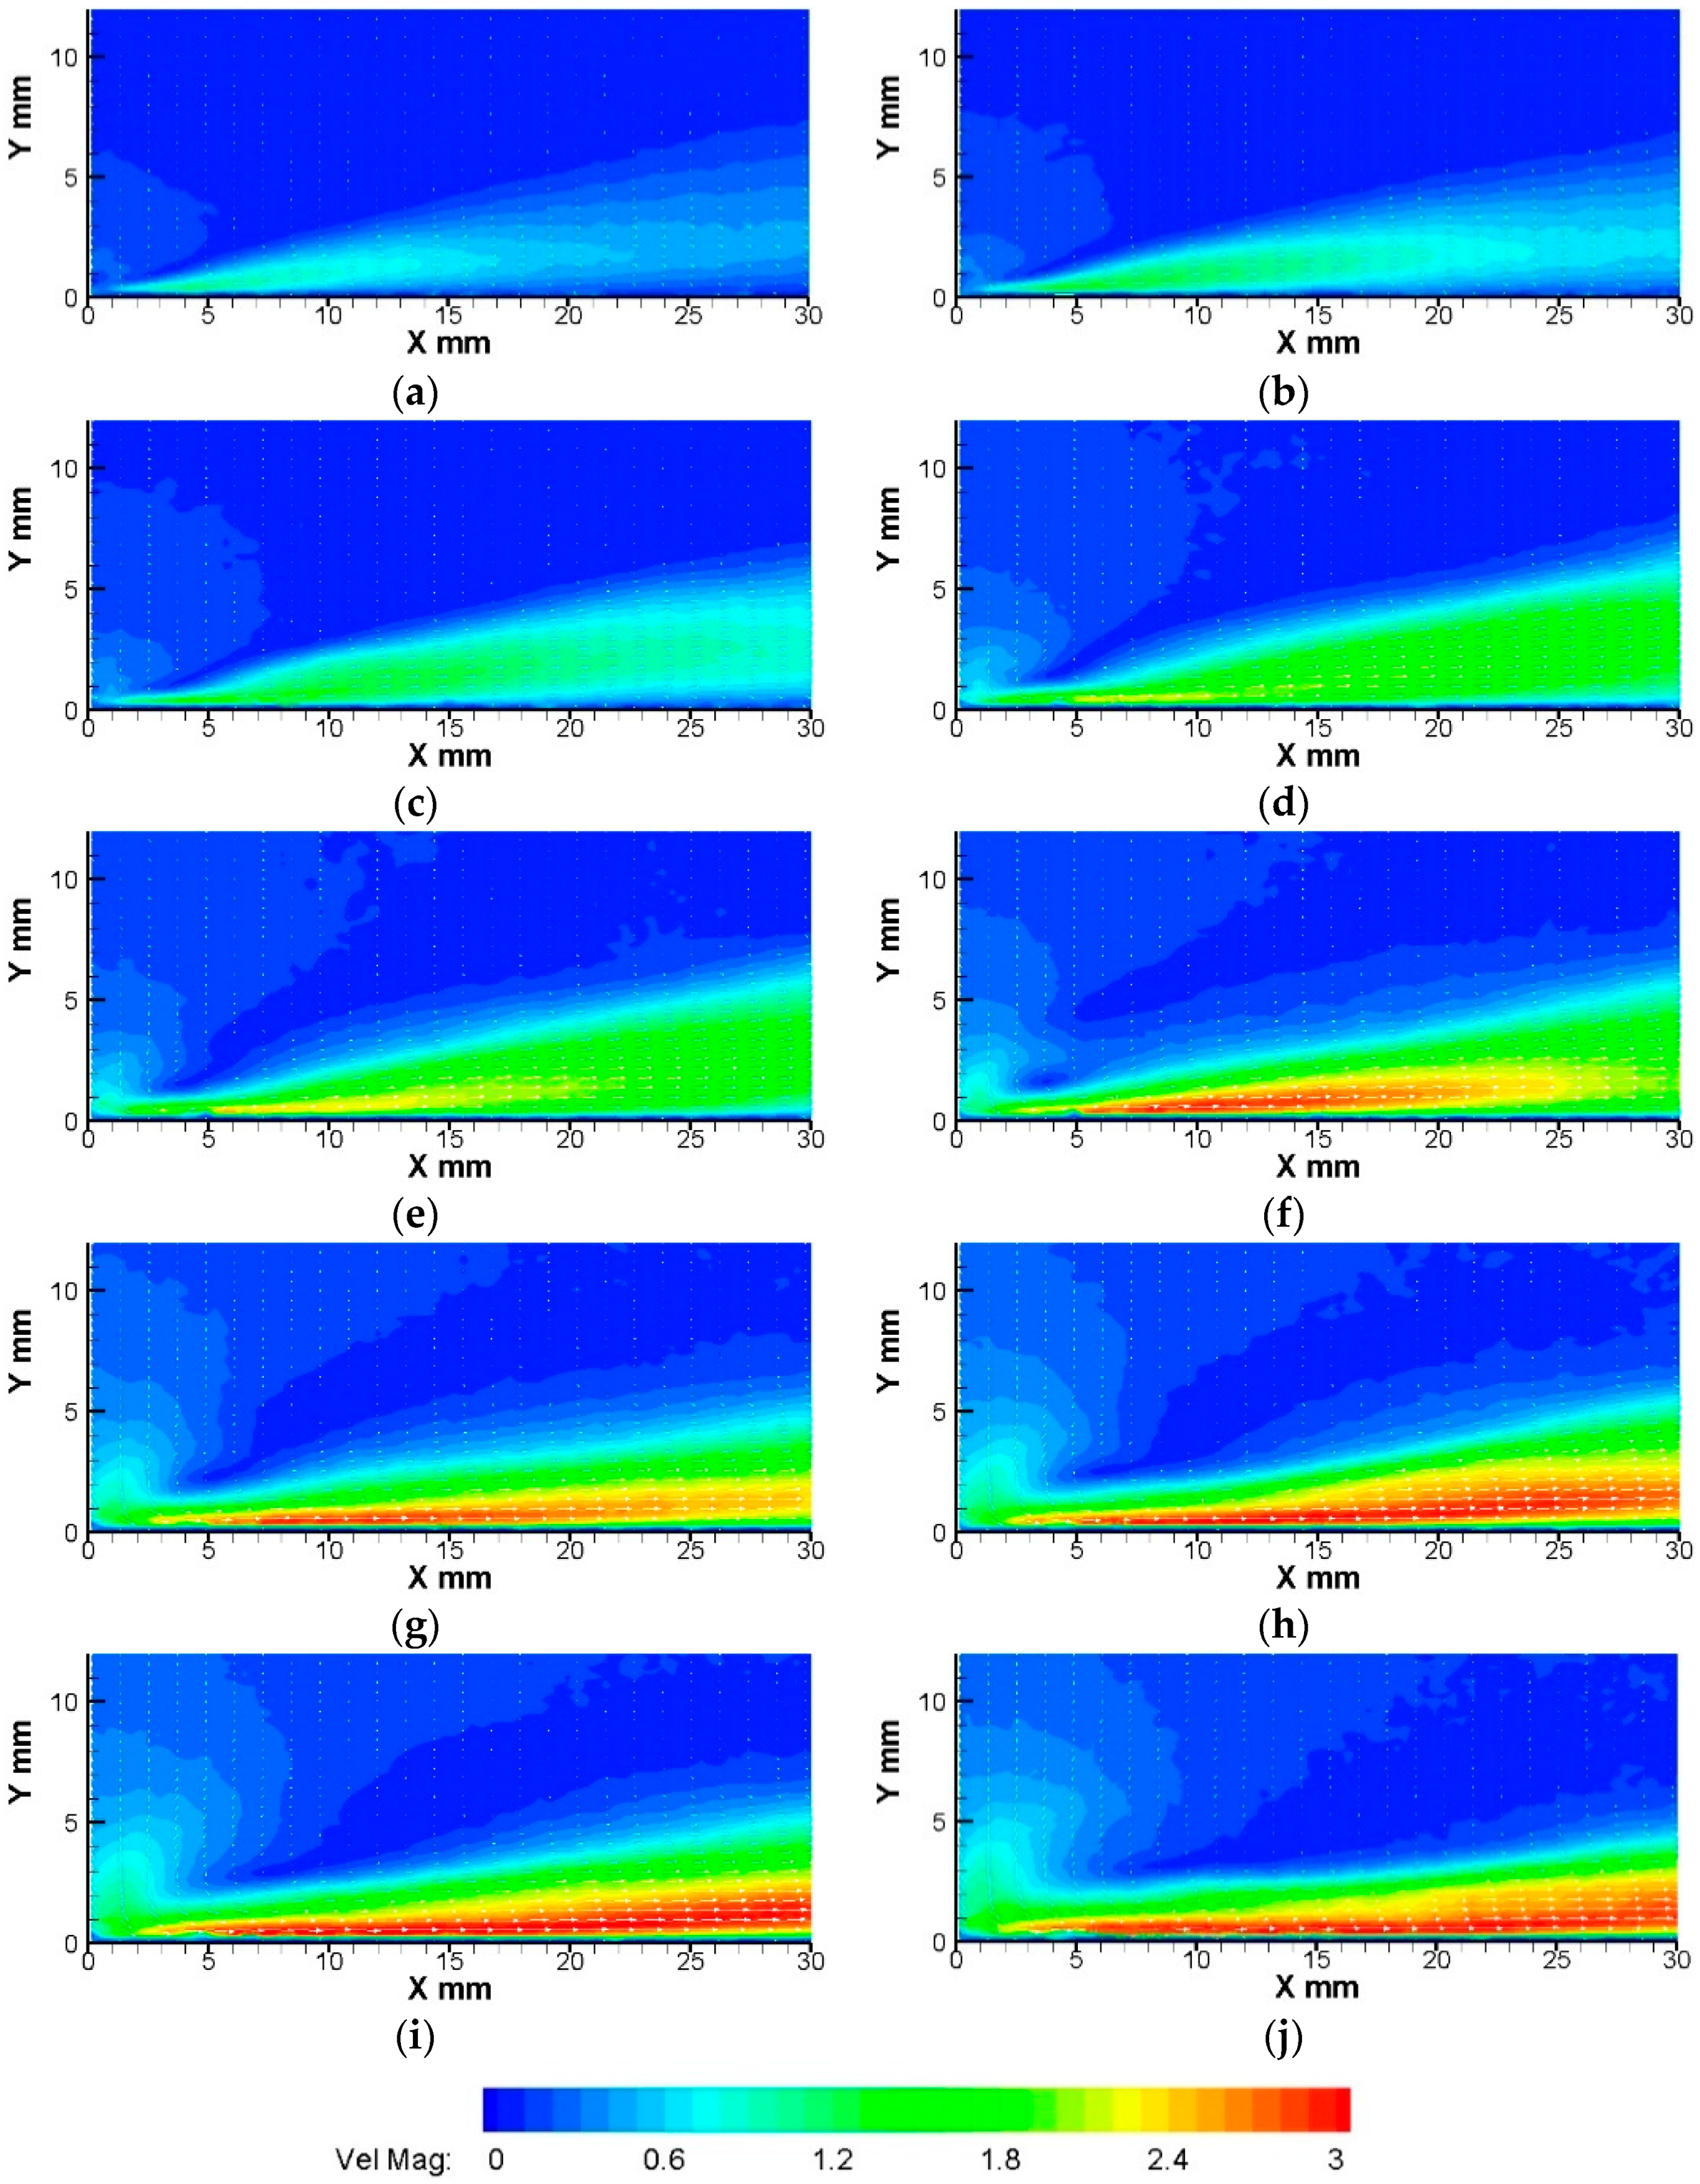
3.2. Velocity Measurement

Figure 4 shows the time-averaged velocity magnitude field of ionic wind at different excitation voltages. When the actuator is working, ambient air flows into the plasma region and is accelerated, forming a jet near the wall. In the downstream area of the actuator, the development of ionic wind is similar to that of a classical wall jet in static air. The thrust generated by the actuator is gradually weakened until it disappears as the plasma concentration gradually decreases, and the velocity gradually decreases, moves away from the wall surface, and slowly increases in height. The discharge between electrodes becomes increasingly intense as the excitation voltage increases. Furthermore, the length of ionic wind increases gradually until the excitation voltage exceeds 17 kV; at this point, the length of ionic wind stops increasing. Moreover, ionic wind mostly exists within the height range of 5 mm from the wall. In contrast with the time-averaged ionic wind velocity field, the generation of ionic wind is unsteady, the vortex structure is periodically induced, and its pulsation frequency is the same as the excitation frequency of the actuator [33]. The pulsation period of ionic wind is within the order of 10−4 s, which is considerably shorter than the time scale of the flow response of 10−2 s. Hence, most researchers believe that the effect of an actuator on the external flow field is steady under continuous excitation of a high-frequency AC voltage [34].
Table 1 lists the maximum induced velocity, Umax, under different excitation voltages, Vpp. The maximum induced velocity rises with an increase in the excitation voltage and reaches its maximum value of 3.3 m/s at 17 kV. However, the maximum induced velocity decreases with a further increase in the excitation voltage. This result is consistent with the trend of the velocity field in Figure 4. This reaction is attributed to the plasma actuator reaching a saturated state, causing the plasma state to change from a uniform mode to a filamentary mode when the voltage is sufficiently high. In such a case, plasma is expelled at a high density due to the high conductivity, lowering the plasma density in the region, reducing the thrust of the actuator, and decreasing the induced velocity [35]. In accordance with the velocity characteristics and maximum velocity of ionic wind, the velocity of ionic wind increases slowly when the voltage exceeds 14 kV, indicating that plasma gradually becomes saturated. Consequently, the optimal excitation voltage of the actuator designed in the present study is 17 kV, and the flow control of the Ahmed body is studied within this voltage range.

4. Wake Flow Control of the Ahmed Body

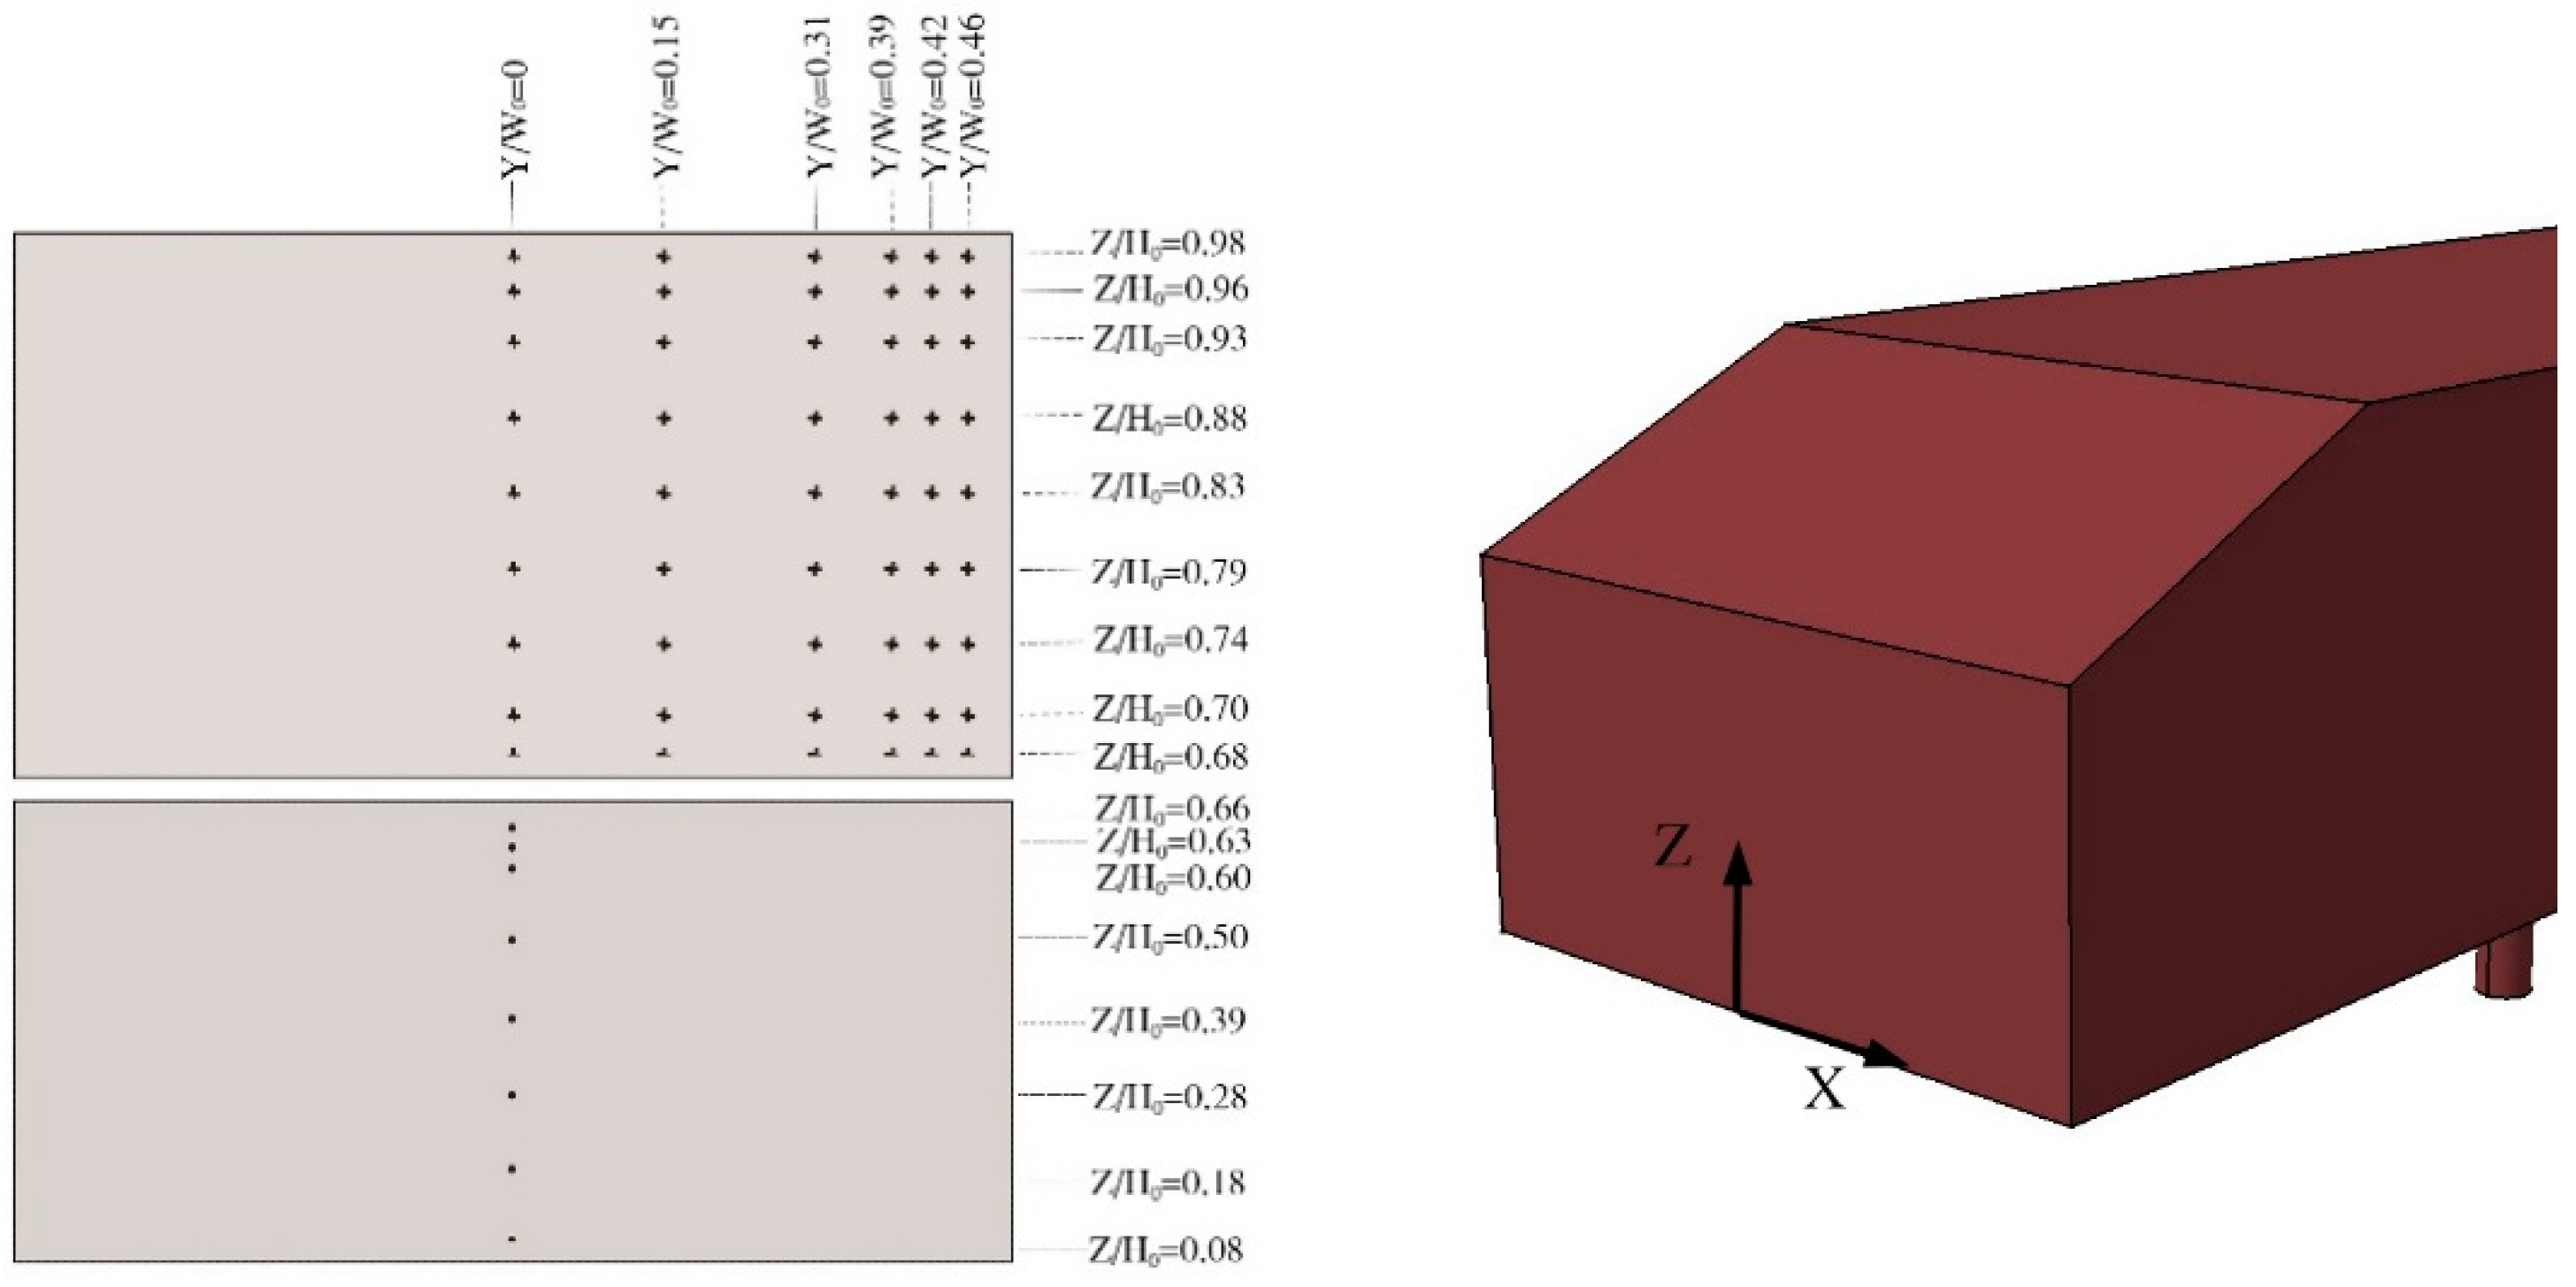
4.1. Arrangement of the Wind Tunnel Experiment

The flow control effects of the plasma actuator on the Ahmed body were experimentally studied in a wind tunnel using PIV velocity field, surface pressure, and aerodynamic resistance measurements. All the aforementioned test methods have never been used simultaneously in previous studies. Figure 5 shows that the Ahmed model is fixed on a platform at a height of 0.5 m above the wind tunnel ground to avoid the influence of the ground boundary layer, and the leading edge of the platform is chamfered to avoid boundary layer separation in this area. The distance between the model and the front–rear edge of the platform is 1L0 and 3L0, respectively, and the total width of the platform is 7W0. The PIV laser was arranged at the end of the platform, and a CCD camera was set outside the platform on the side of the model. Pressure sensors were connected to the pressure tap on the slanted surface through the inside of the body. Moreover, the upstream locations of the actuator were flattened with insulating tape. The experimental blocking ratio was less than 2%.
When the Reynolds number reaches 0.7 × 10⁶, the contribution of negative pressure around the slanted surface and the vertical base to the total aerodynamic drag is approximately 80% for the Ahmed body with a rear slant angle of 25° [25]. Therefore, only the wake flow control was investigated in this study.

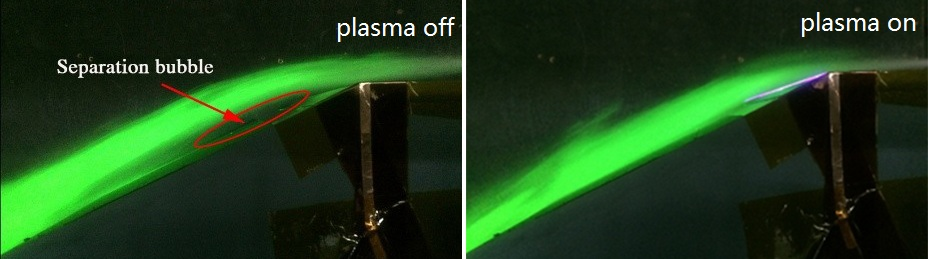
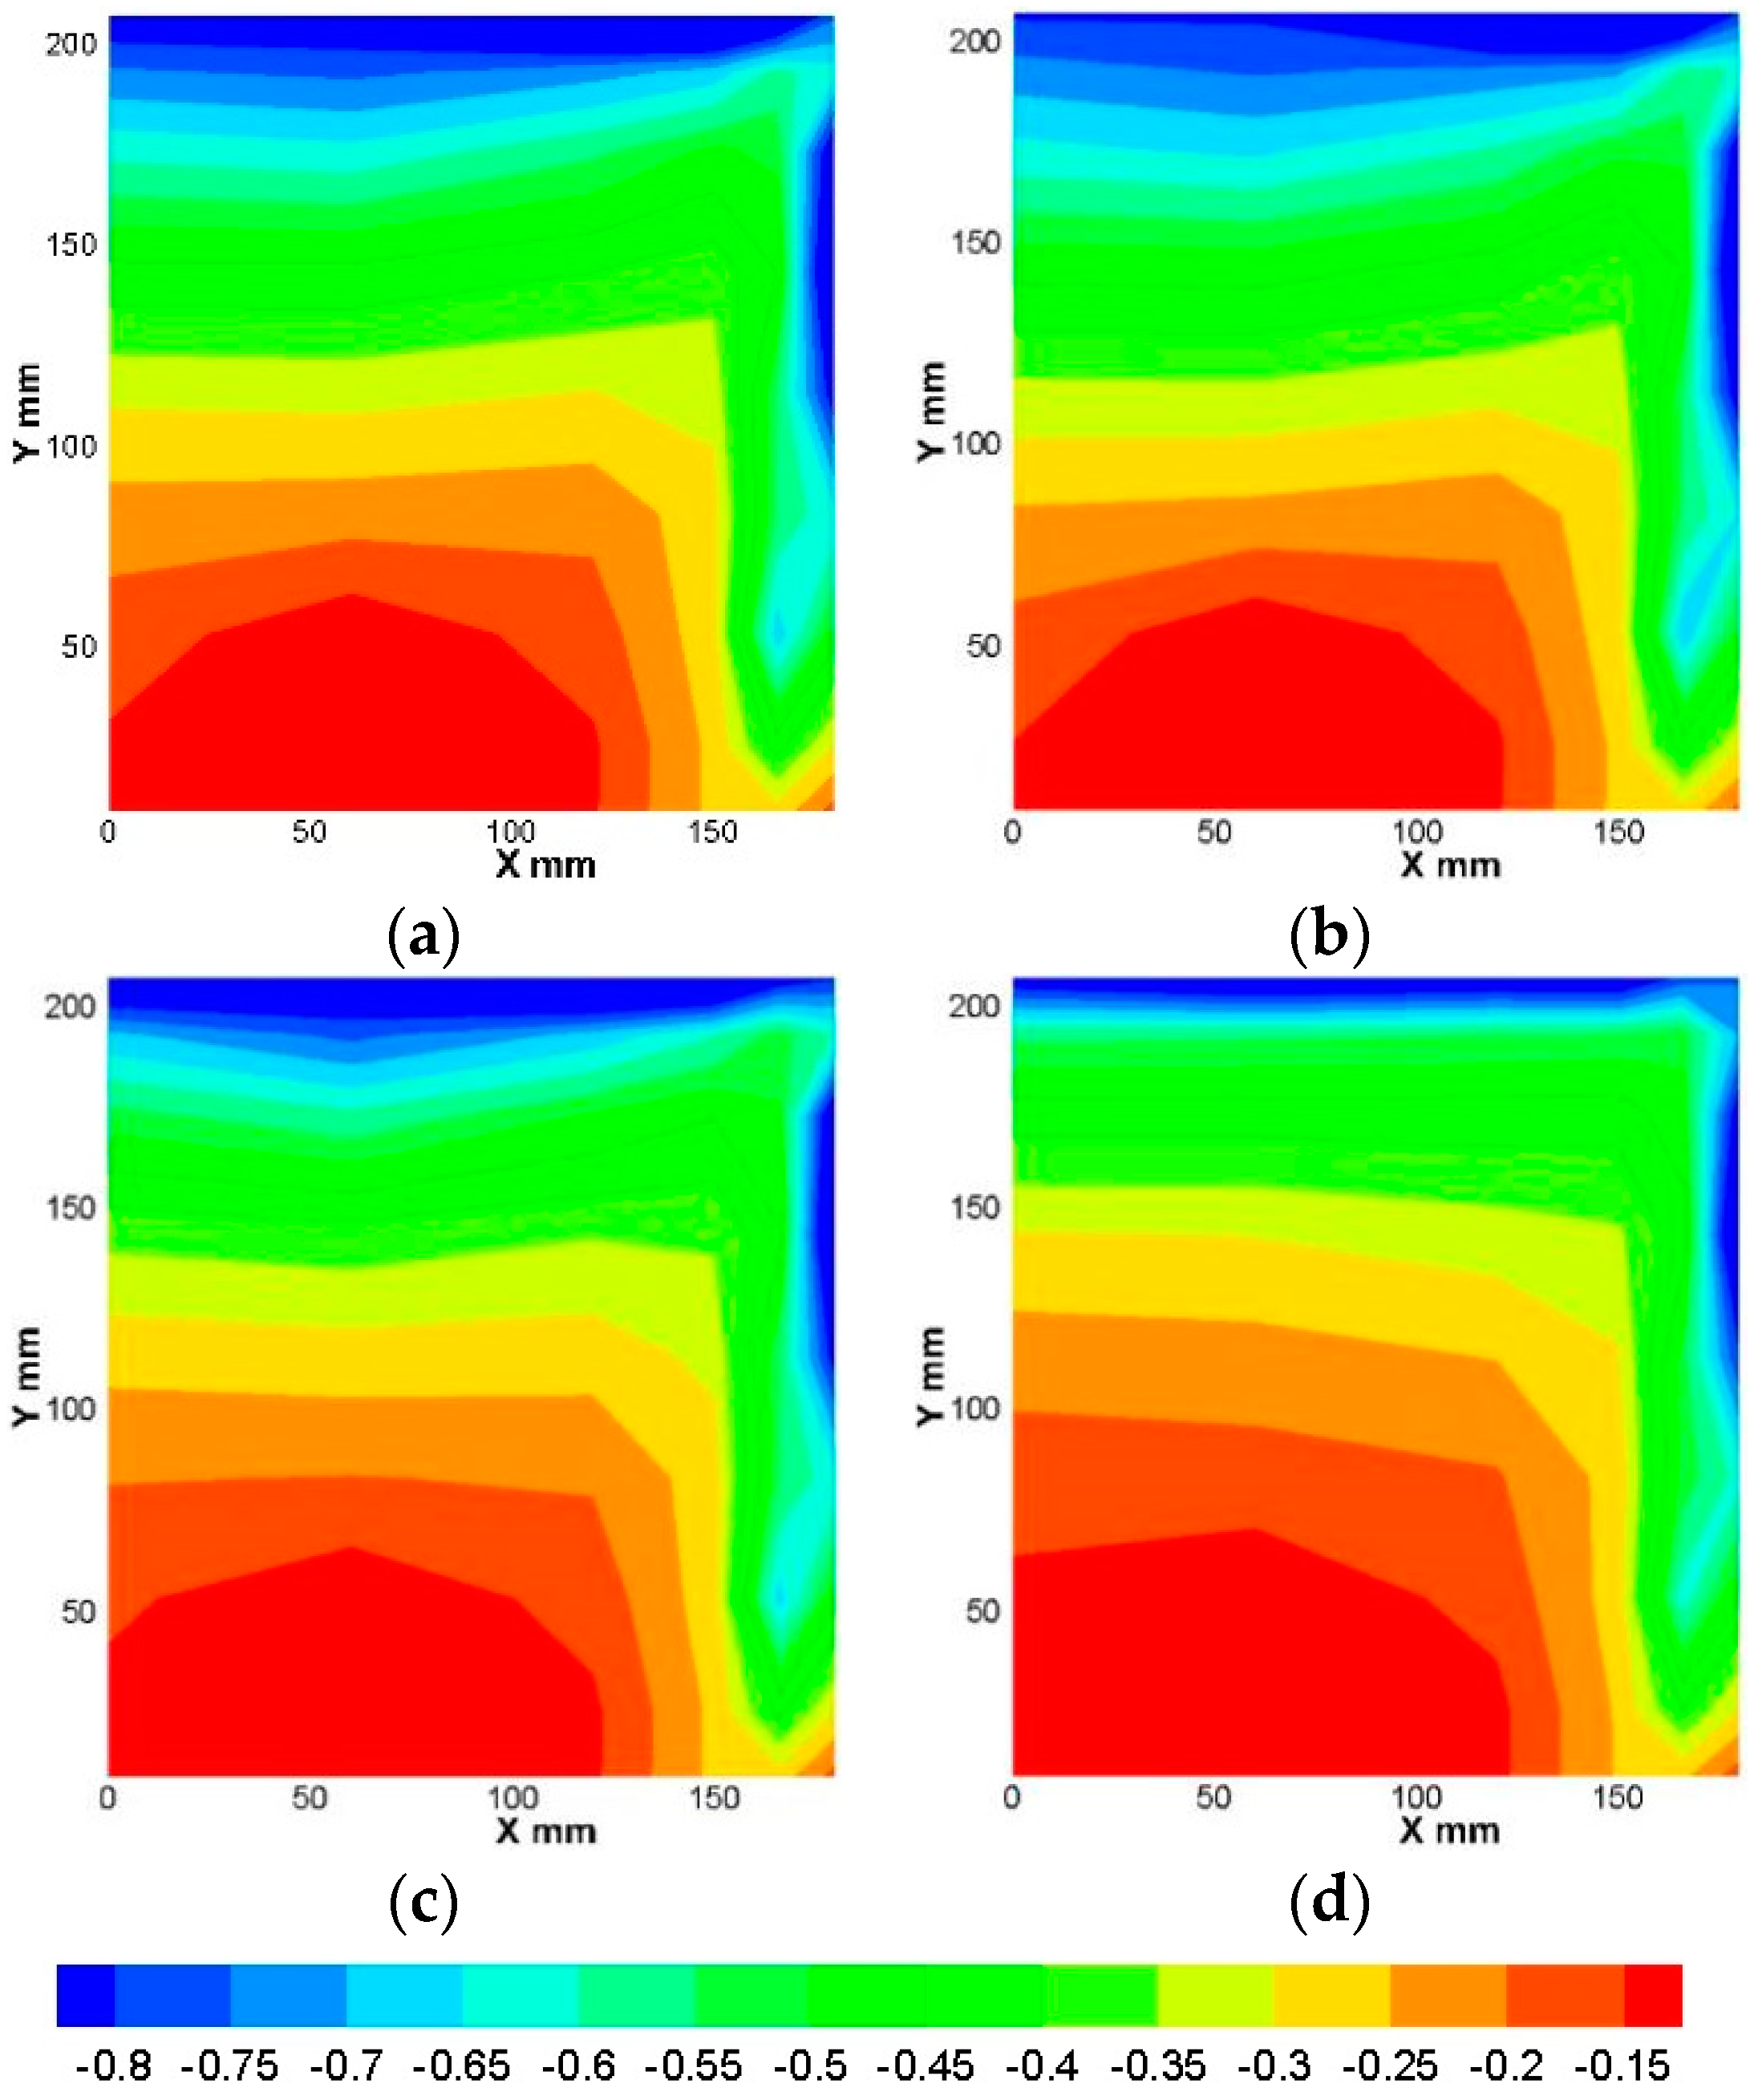
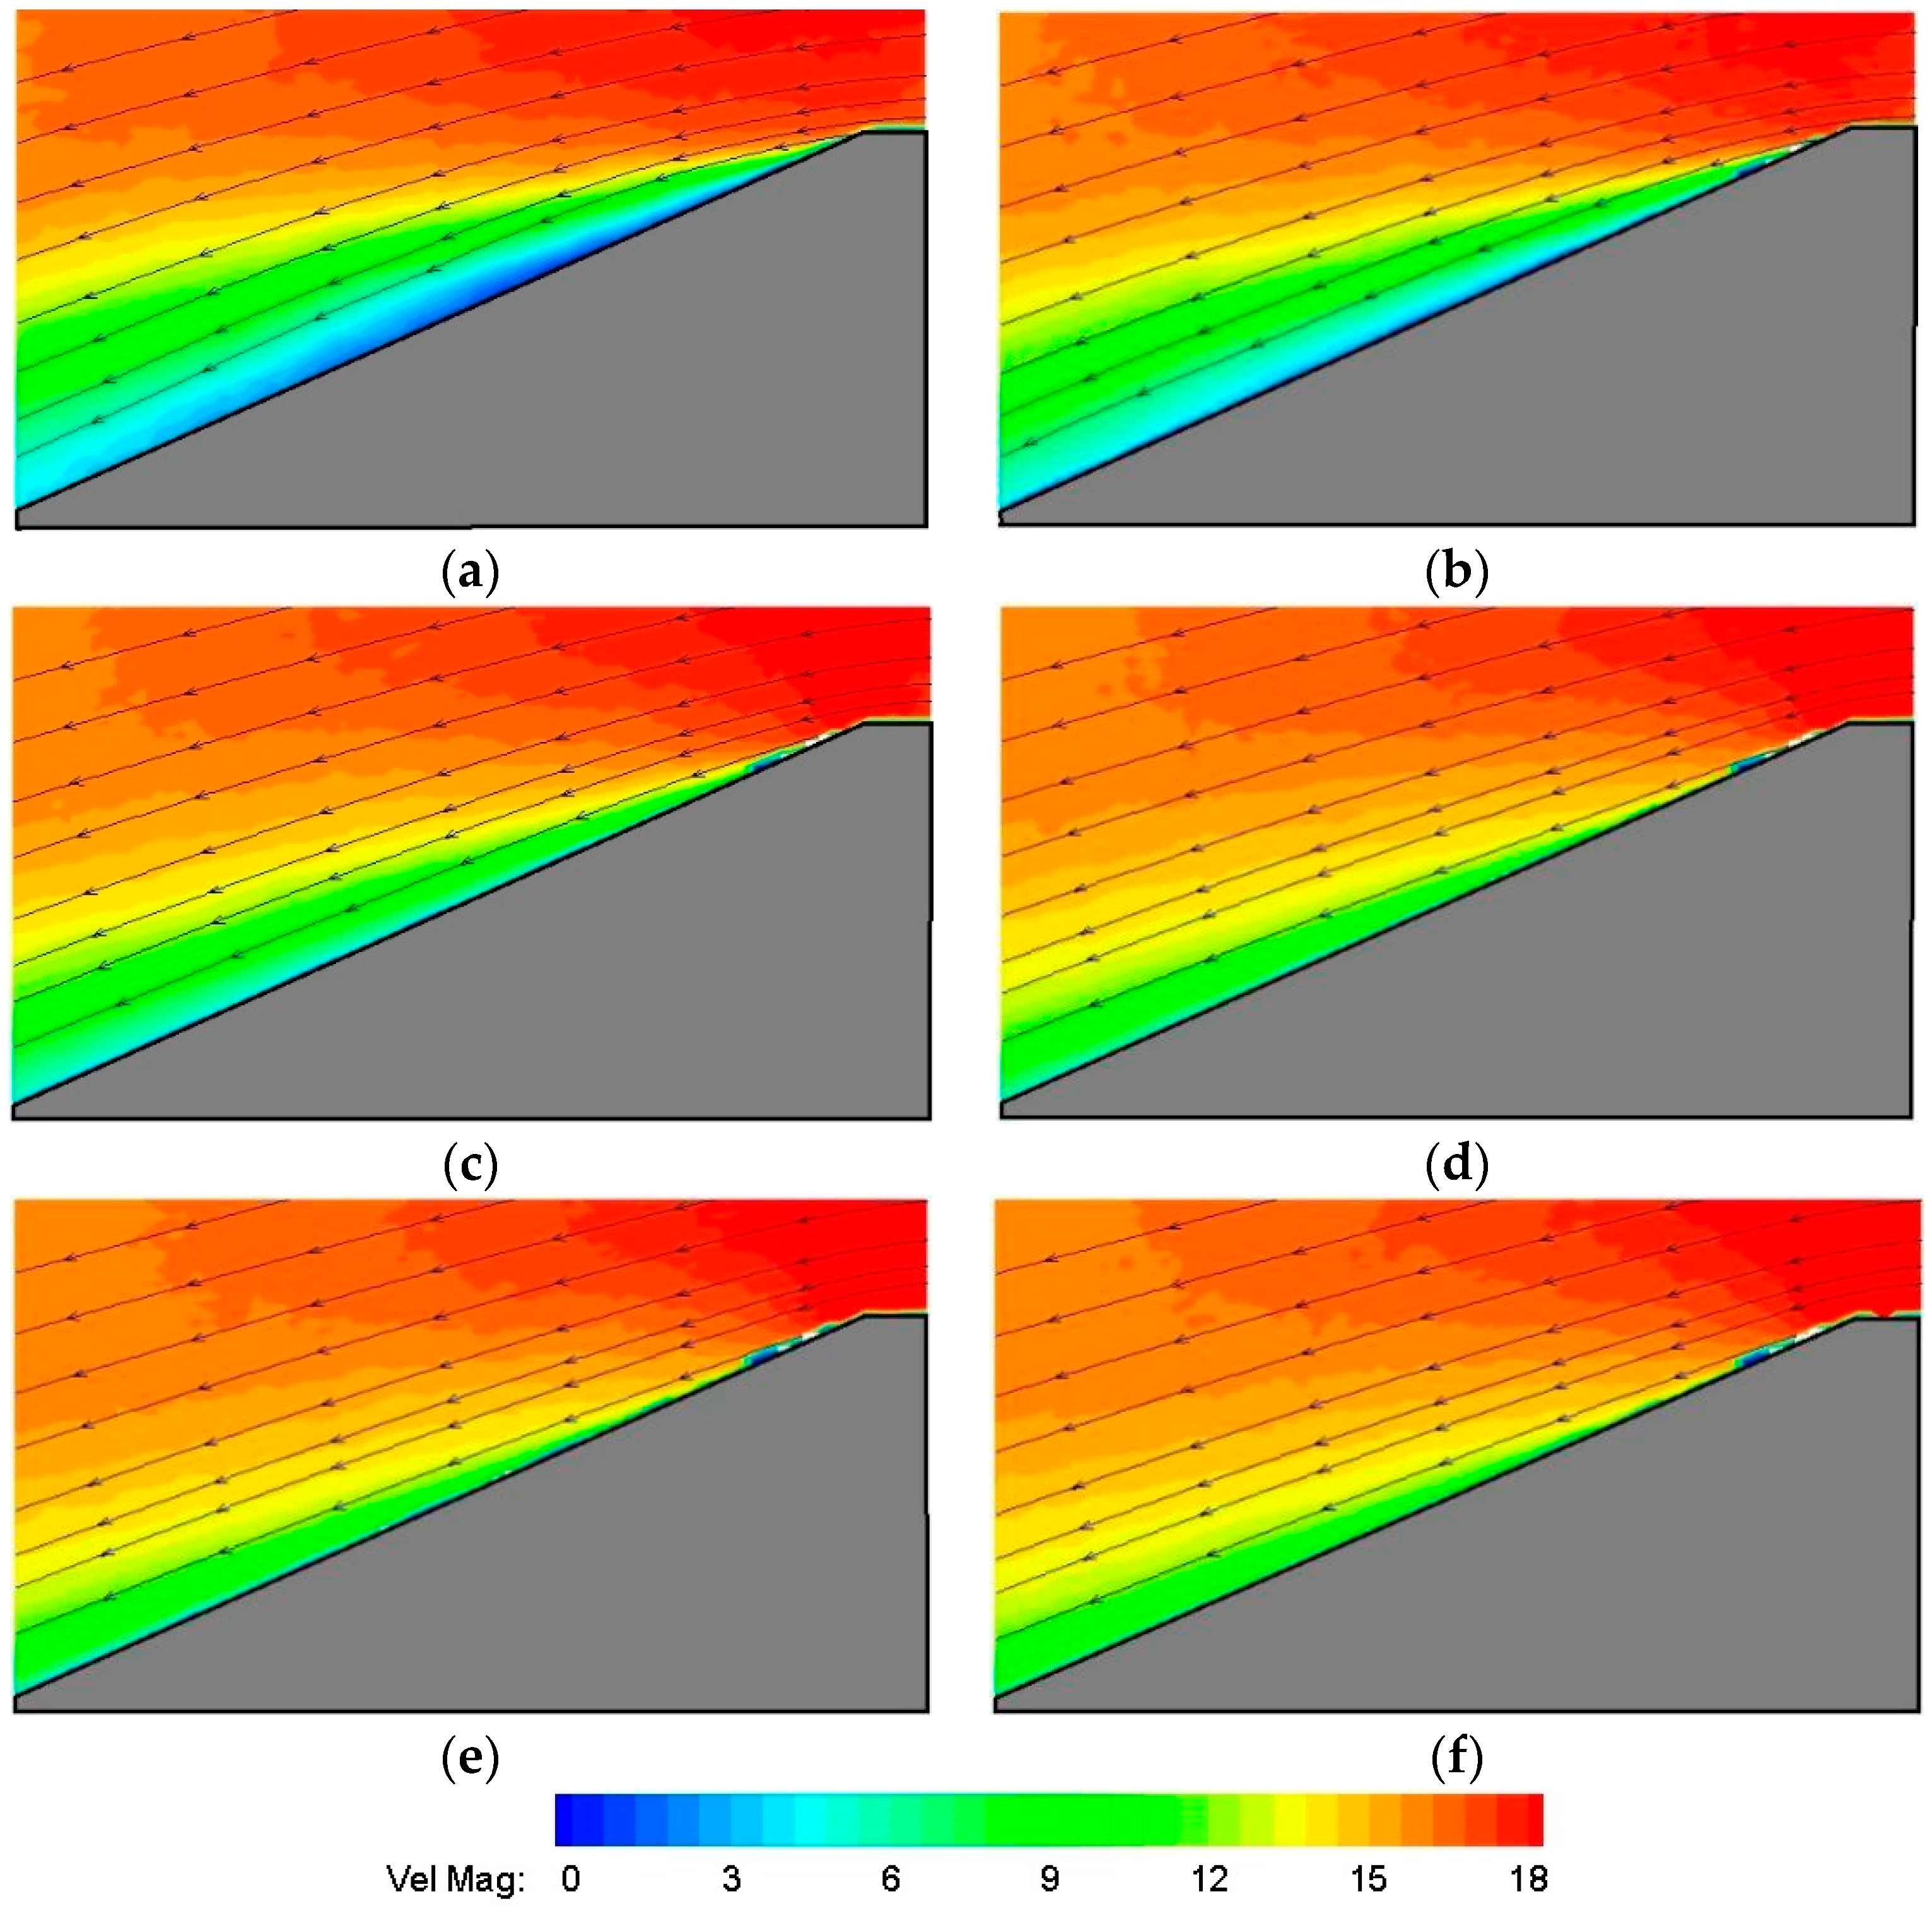
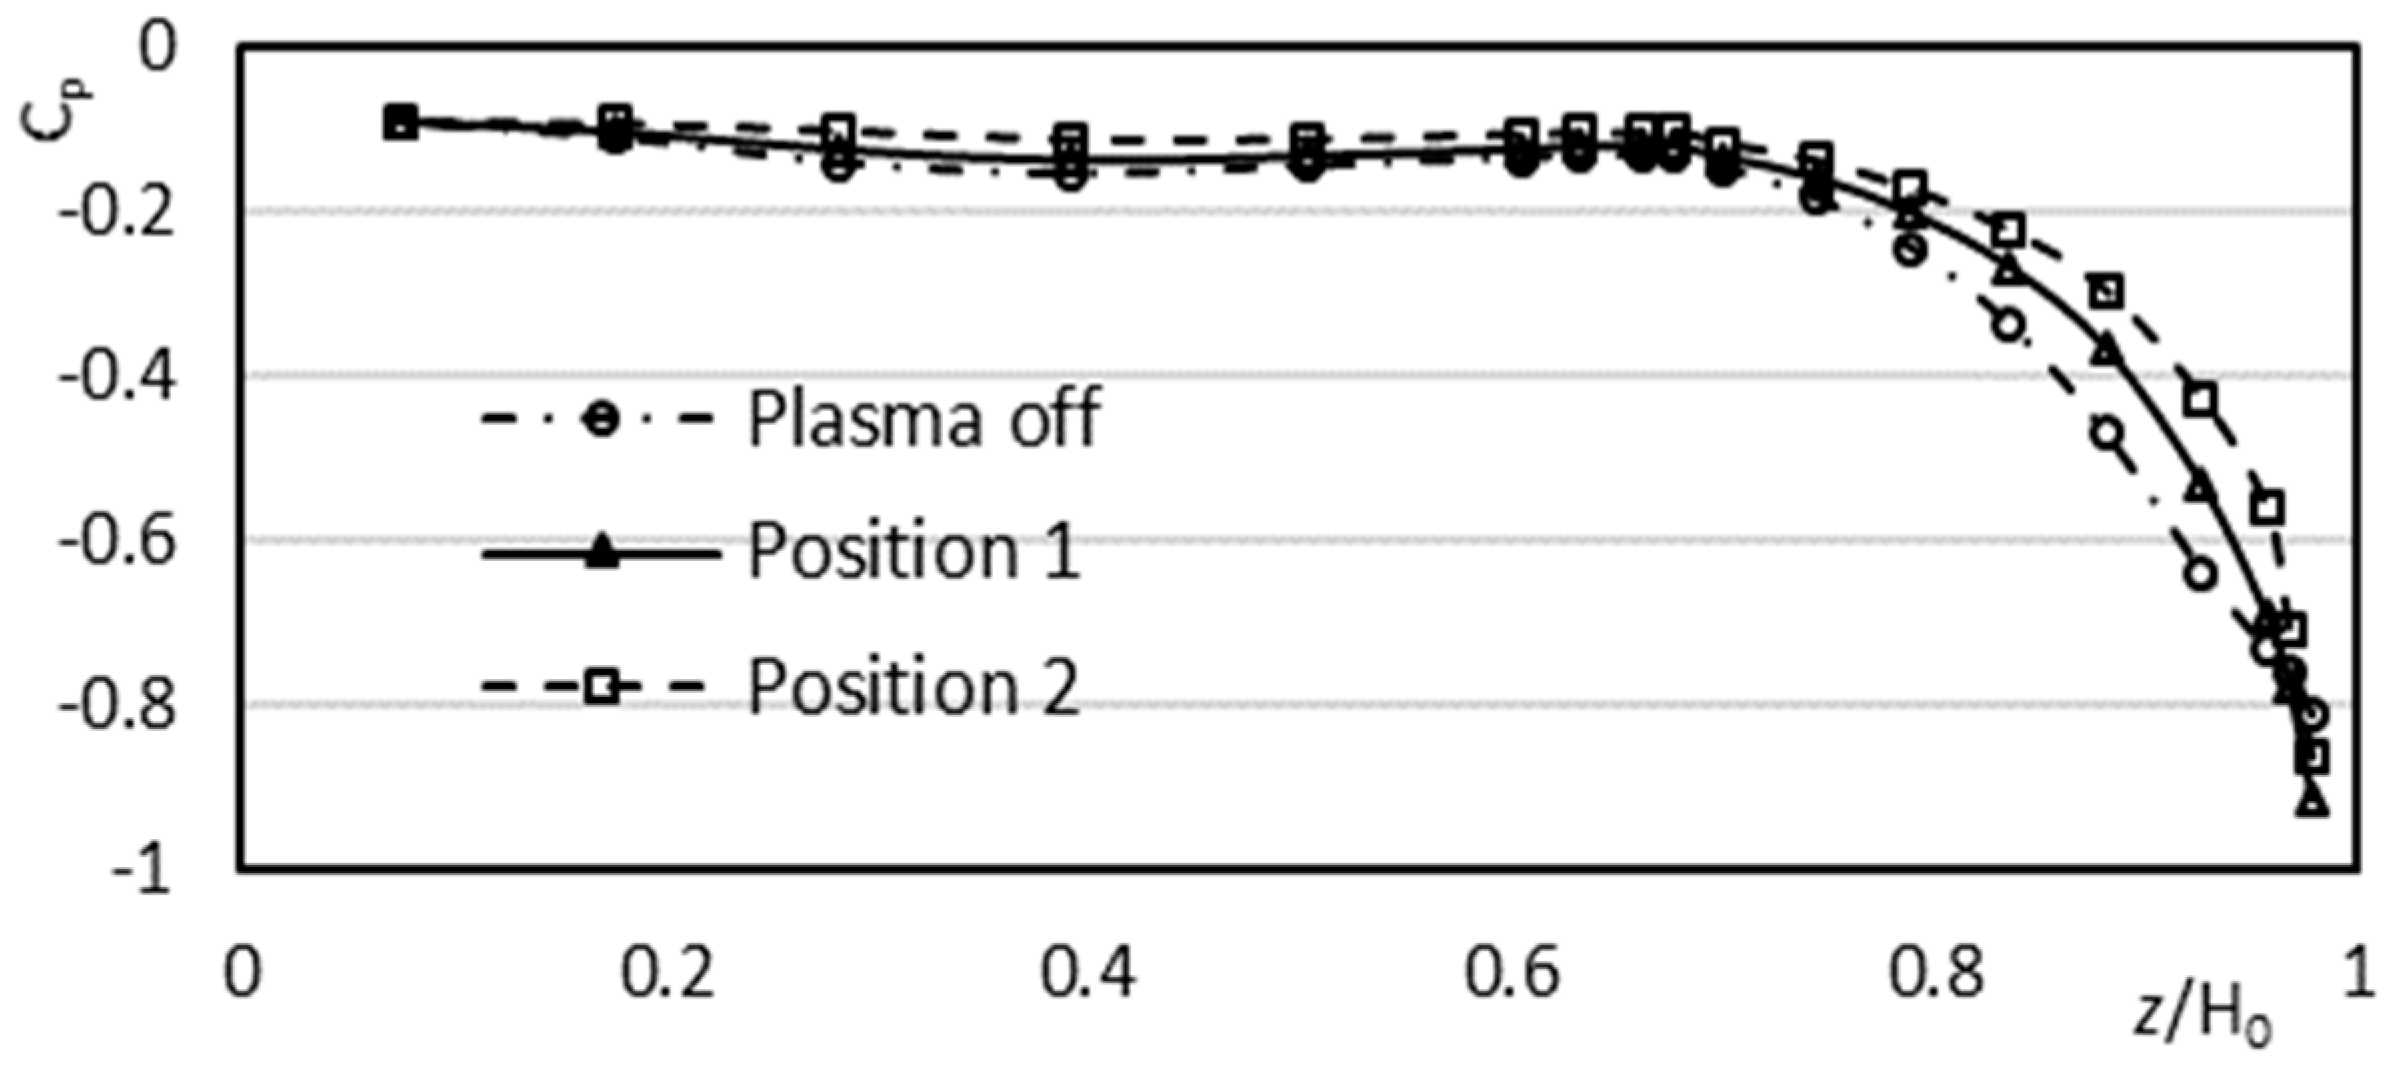
4.2. Control Effect under Different Positions of the Actuator

The installation positions of airfoils have been investigated in previous studies [18,36]. The most effective location of a plasma actuator for lift and drag improvement has been precisely confirmed to be upstream of the natural separation point. However, for the Ahmed body, the position of the natural separation points of airflow is fixed due to the oblique angle at the tail of the model and the 3D wake flow is more complex. Therefore, the installation position of the actuator should be studied and the control effects at different positions should be compared.
Boucinha [26] placed an actuator at different positions on a slanted surface and achieved the greatest drag reduction when the upper electrode was arranged on top of the slanted surface (Figure 6a). This position was labeled “Position 1” in this paper. Shadmani [27] realized a good control effect by placing the upper electrode of an actuator at the end of the top surface, i.e., “Position 2” in this paper. However, the conditions for the two groups of tests differed, and thus, no effective comparison could be made. Therefore, under a fixed wind speed (U = 15 m/s, Reynold’s number = 1.07 × 10⁶) and a fixed excitation voltage (Vpp = 13 kV), the control effect of the aforementioned position of the actuator is investigated in the present study to explore the best placement of the actuator and its control mechanism.
To measure the surface pressure distribution at the tail of the body, 62 pressure taps on the slanted surface and on the symmetry line of the vertical base were used, as shown in Figure 7. The pressure taps were only located on one side of the slanted surface due to the symmetry.
Pressure coefficients were calculated using Equation (1):
Cp = (PP)/(0.5 × ρ × U2)
where P is the static pressure at any point on the model, P is the static pressure of free flow, U is the velocity of free flow, and ρ is the air density.
Figure 8a shows the pressure coefficient distribution on the slanted surface of the original model without the plasma actuator, while Figure 8b shows the pressure coefficient distribution on the slanted surface when the plasma actuator is off. The difference between the two is relatively small, indicating that the arrangement of the actuator has little impact on the wake flow of the model. When no control is applied, the pressure at the top is the lowest and gradually increases down the slant, and this result is consistent with the surface distribution observed by Joseph [37]. A low-pressure region exists at the lateral edge of the slanted surface, and this region extends down the slant due to the development of the C-pillar vortex, as shown in Figure 1. After applying the control, the low-pressure region in most areas of the slanted surface is gradually replaced with a high-pressure region, while the low-pressure region at the lateral edge changes in an inevident manner. This result indicates that the actuator can effectively control flow separation above the slanted surface to increase its overall pressure with minimal influence on the C-pillar vortex. Since the arrangement of the actuator has little impact on the wake flow of the model, the actuator can be arranged inside the body with only the upper electrode exposed in practical application, which has no impact on the flow. Therefore, the control effect of the actuator was studied based on the state of “plasma off”, as presented below.
The pressure distribution on the symmetry line of the tail is shown in Figure 9 (z/H0 < 0.67 is for the rear base and z /H0 > 0.67 is for the slanted surface). The pressure on the slanted surface is considerably lower than that on the rear base; the closer to the top, the lower the pressure, and the greater the pressure gradient. When the control is applied, pressure change is largely reflected on the slanted surface, particularly at the center, and the pressure drag of the model mostly originates from the negative pressure around the slanted surface [28]. Therefore, only the pressure on the slanted surface was analyzed in this research. Notably, the pressure increases in most regions, but decreases at the top because of the acceleration of airflow around the actuator. The pressure changes are analyzed in detail in Figure 10.
A comparison of the pressure distribution at different actuator positions in Figure 8 and Figure 11 shows that the control effect of the actuator at Position 2 is better under the same excitation conditions. This result suggests that the upper electrode of the actuator should be arranged upstream of the separation location to allow the plasma generation region to move closer to the separation location. In this manner, a more effective control effect can be achieved. Therefore, the actuator was arranged at Position 2 for further research.

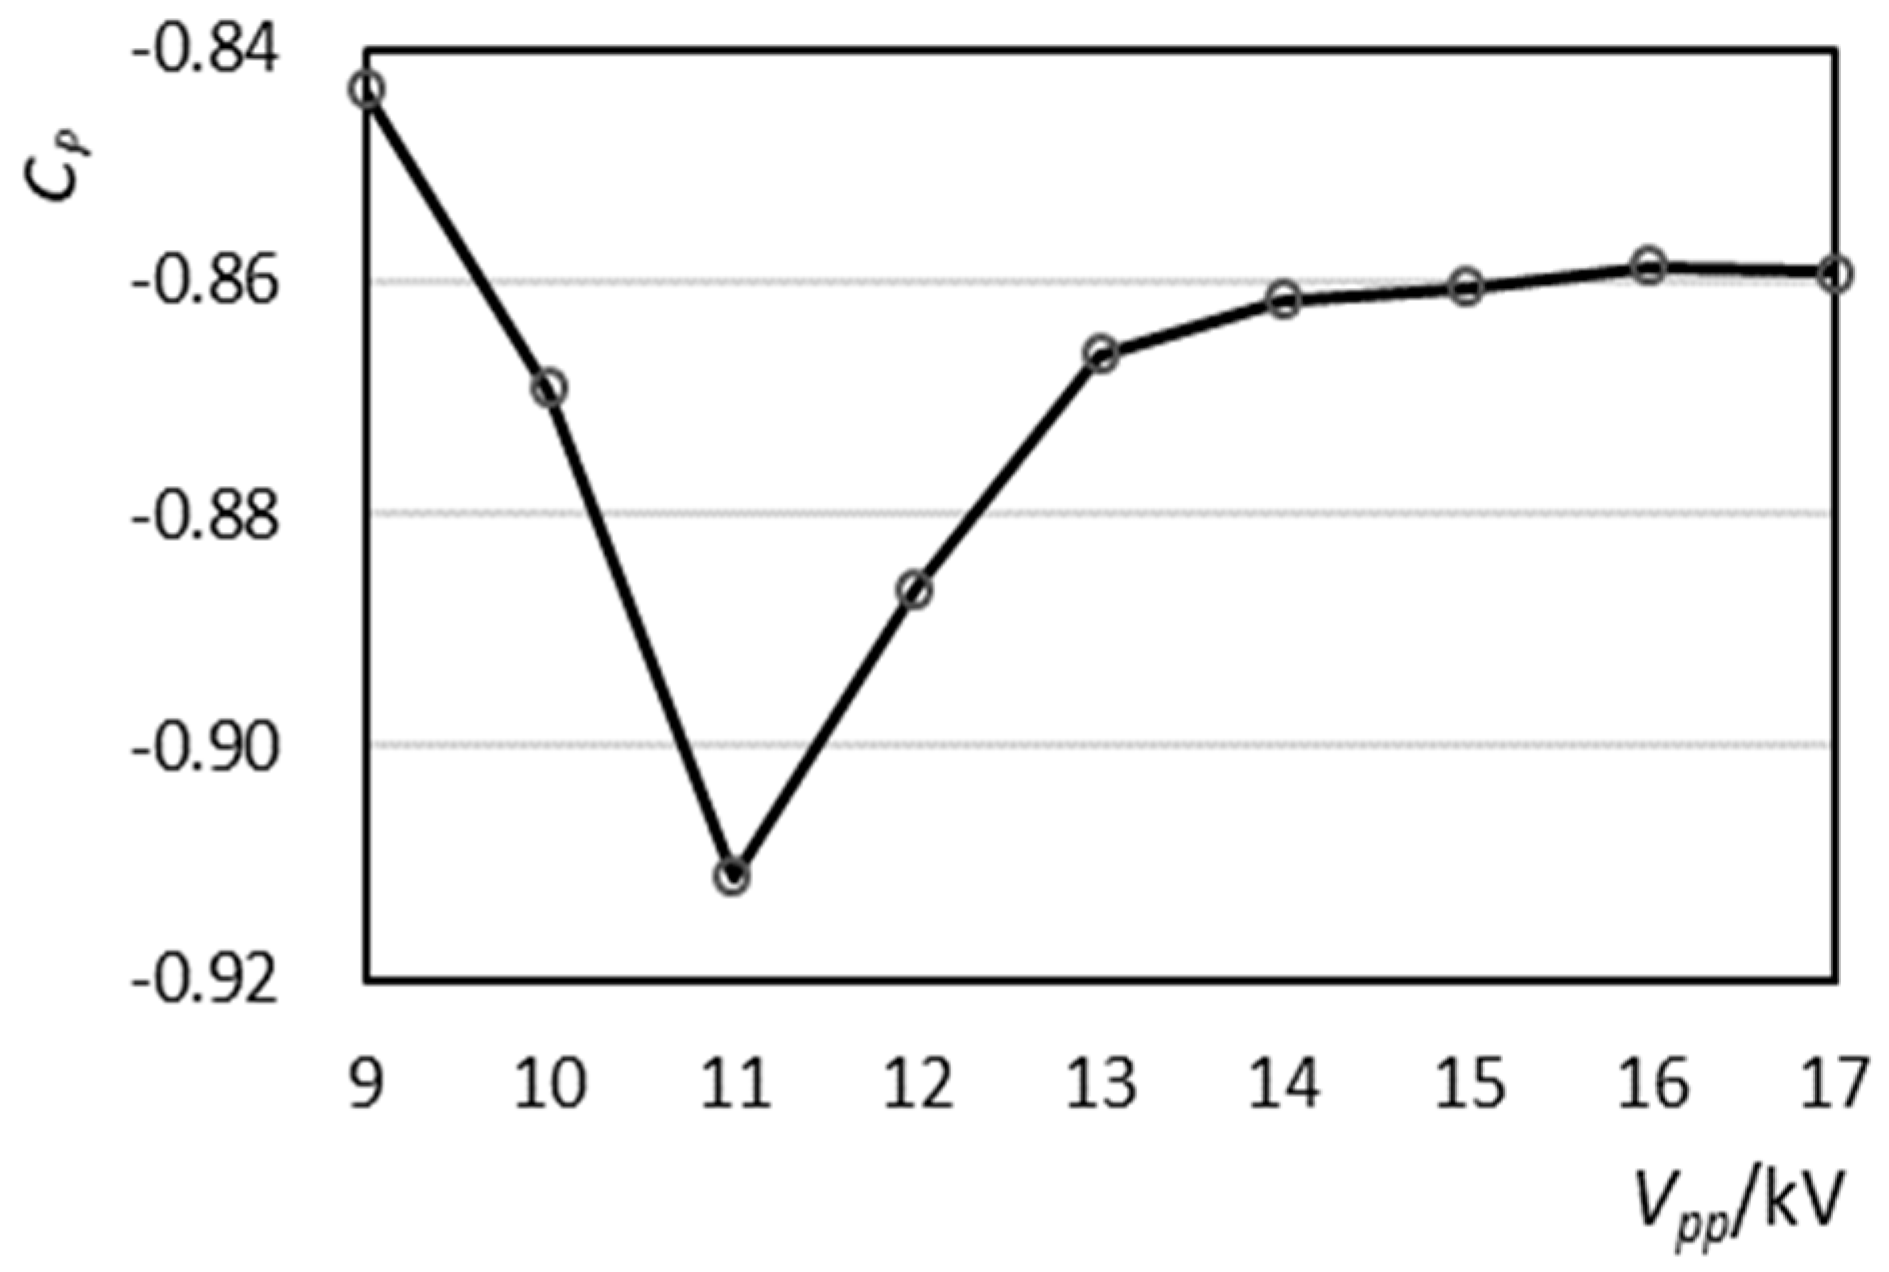
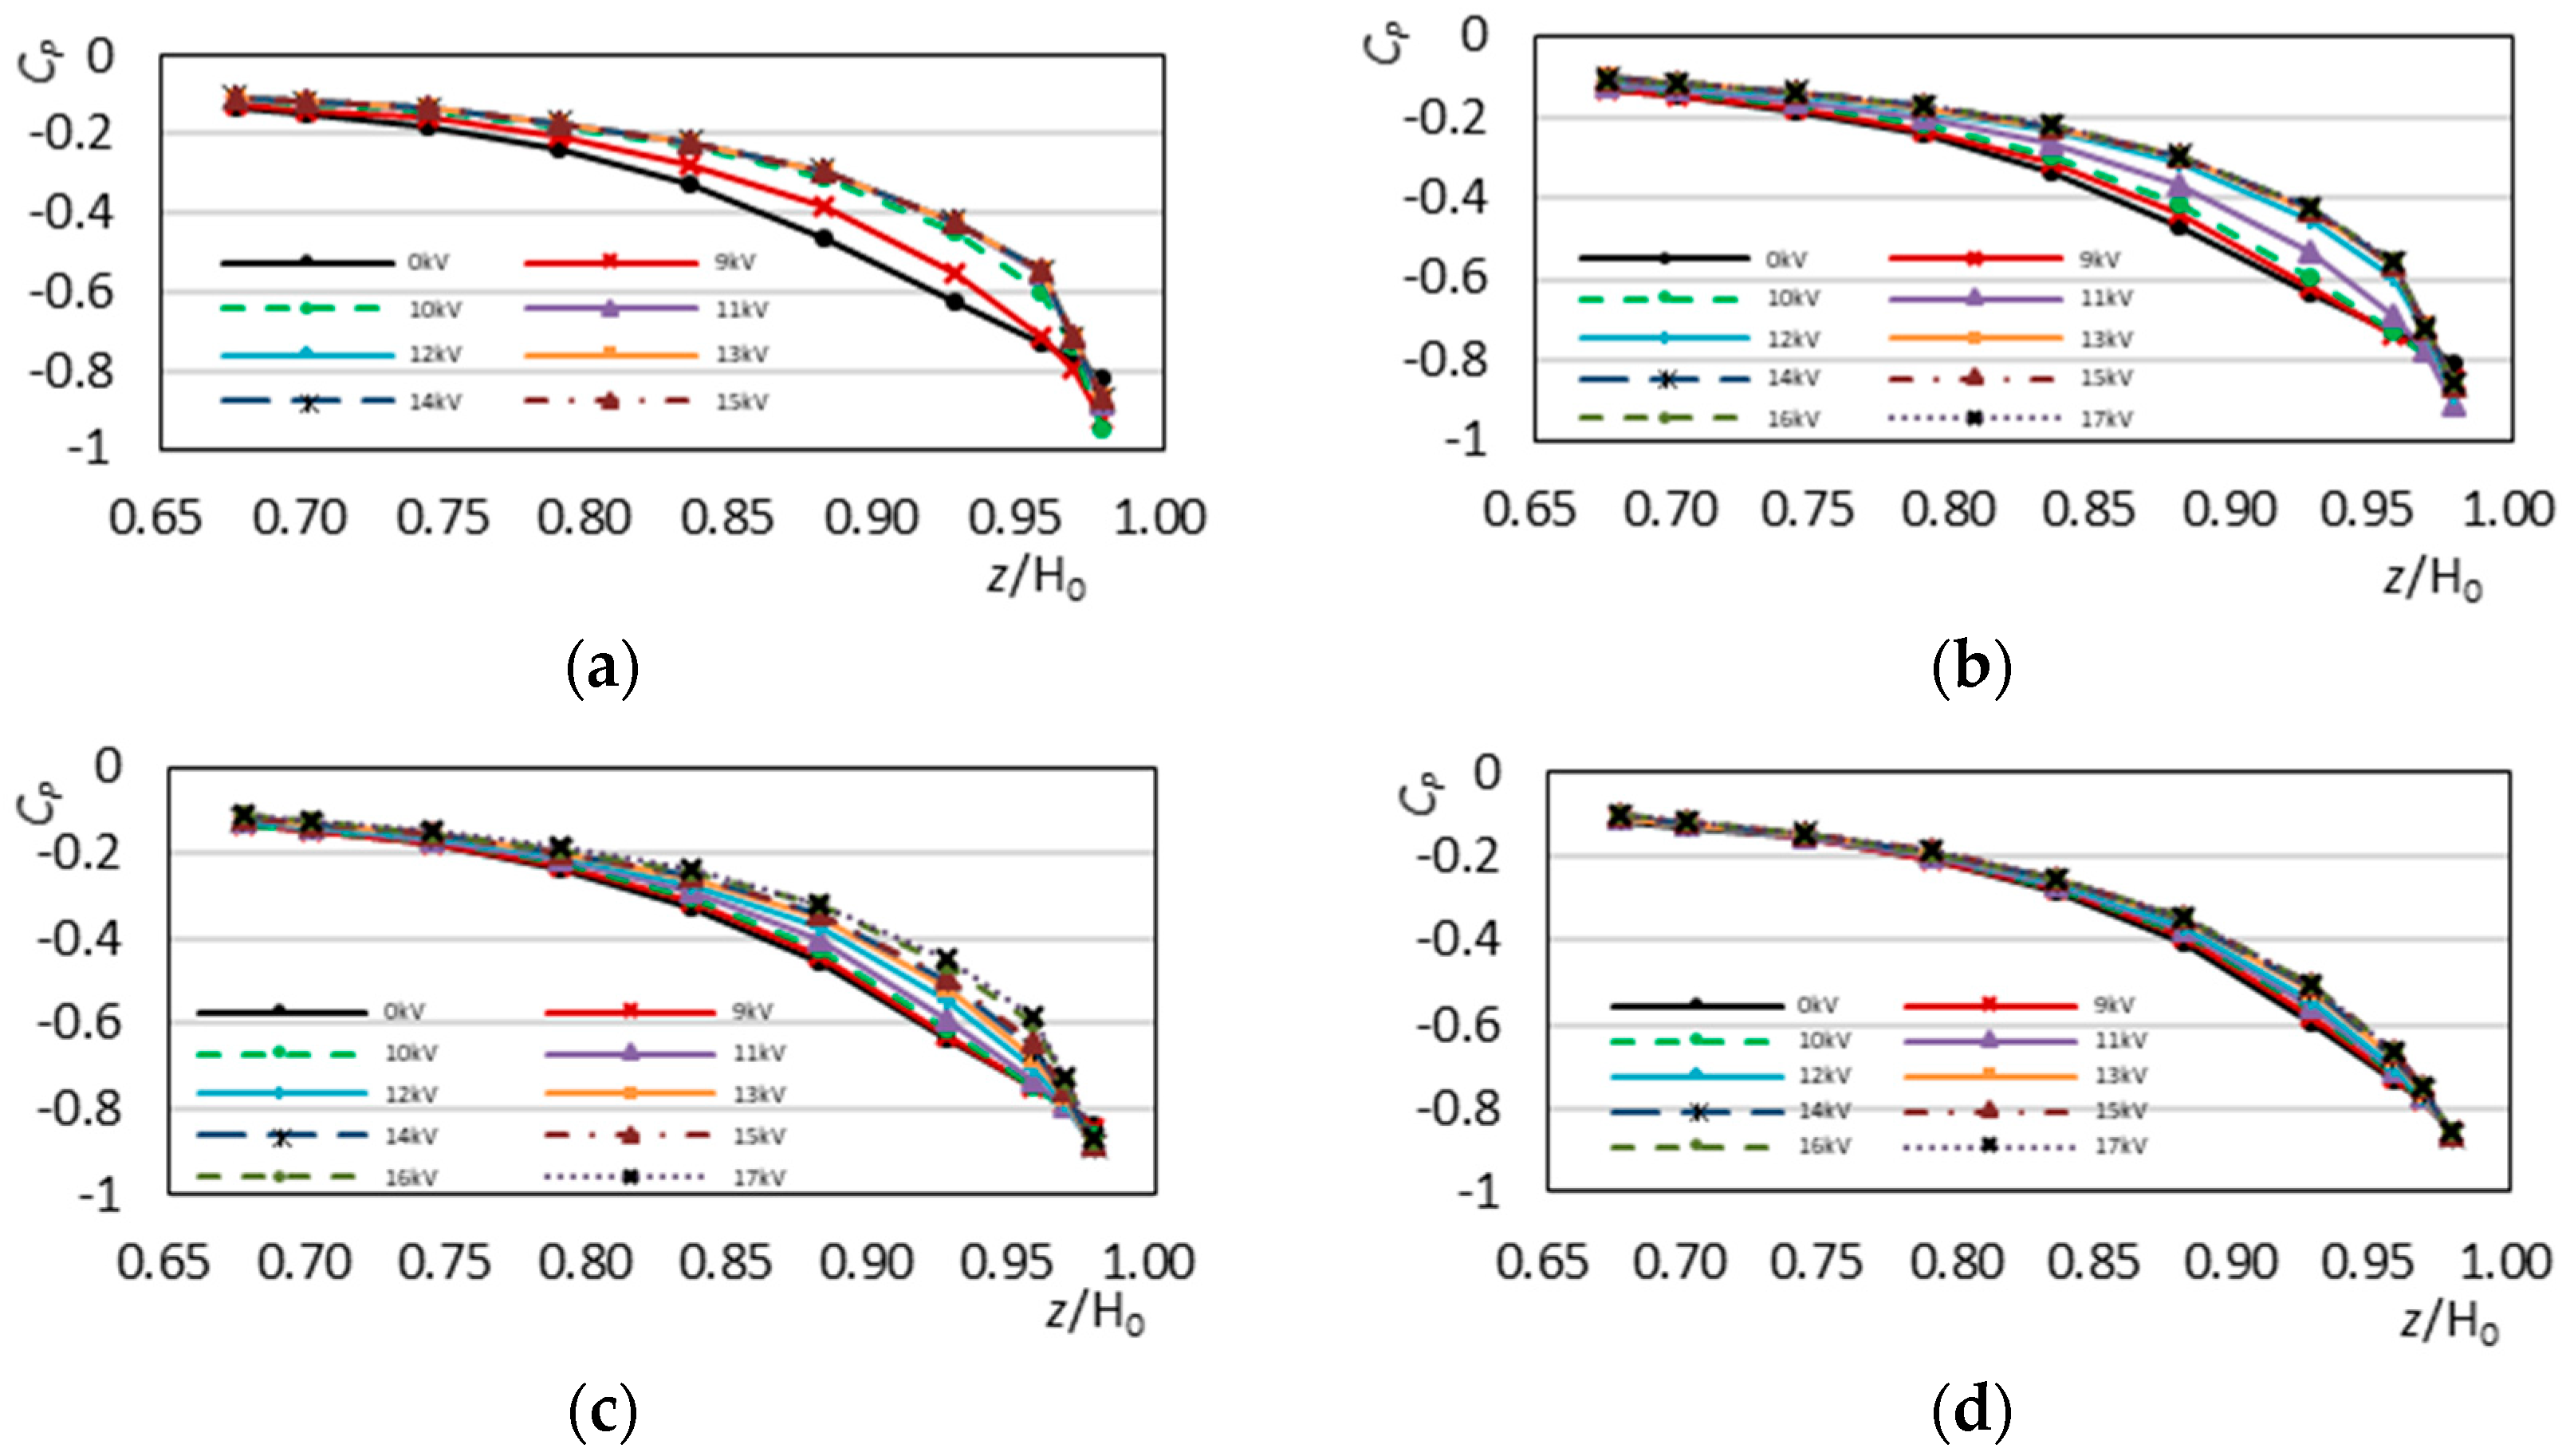
4.3. Control Effect under Different Excitation Voltages

The preceding experiment on the pressure distribution of the tail showed that the pressure at the top of the slanted surface is inconsistent with the change trend of the other regions. Therefore, the pressure coefficient at the top of the symmetry line of the slanted surface (z/H0 = 0.98) under different excitation voltages was analyzed, as shown in Figure 10.
The pressure coefficient initially decreases and then increases with an increase in the excitation voltage. This phenomenon occurs because when the excitation voltage of the actuator is low (Vpp < 11 kV), the airflow around the plasma actuator is accelerated as the voltage increases (Figure 9), causing the pressure to drop. As the voltage (Vpp > 11 kV) continues to increase, the velocity of the airflow around the actuator no longer increases significantly, while the control force of the actuator on the separation flow continues to strengthen (Figure 9). Hence, the suppression of flow separation leads to a gradual increase in pressure on the slanted surface and gradually affects the topmost end, resulting in a rebound of pressure in this region. As the voltage further increases (Vpp > 13 kV), the pressure gradually becomes stable, indicating that the influence of the voltage increase on the control of the separation flow is no longer evident at this time.
Figure 9 shows the variation of the velocity field in the vertical plane of the symmetry with the excitation voltage. The visualization results illustrate that the airflow separates at the top of the slanted surface without control and forms a large separation bubble above the surface. Such a bubble is a low-energy fluid-gathering area for a large total pressure loss; this result is consistent with the flow field obtained by Aubrun [38]. After the control is applied, the airflow around the actuator is accelerated, and high-speed flow is attached back to the surface. Hence, the separation flow is gradually suppressed and the low pressure of the tail is improved. When the excitation voltage exceeds 13 kV, the flow field does not change significantly. This result presents the same trend as that shown in Figure 12b. In conclusion, a plasma actuator can effectively suppress the separation flow above the slanted surface and cause high-speed flow to tend toward the surface.

4.4. Control Effect at Different Wind Speeds

To study the ability of the plasma actuator to control the wake flow of the model at different wind speeds, the pressure distribution on the symmetry line of the slanted surface and the maximum drag reduction were analyzed at wind speeds of 10, 15, 20, and 25 m/s.
As shown in Figure 12, the pressure gradually increases with an increase in the excitation voltage at a wind speed of 10 m/s, until it exceeds 11 kV (Umax = 1.71 m/s). At this point, the pressure control reaches its limit and will not change with an increase in the excitation voltage. Following the same trend, the pressure control also reaches its limit and no longer changes after the excitation voltage reaches 13 kV (Umax = 2.54 m/s) at a wind speed of 15 m/s. However, the pressure always rises with an increase in the excitation voltage at high wind speeds. Hence, the pressure control does not reach its limit. In particular, the pressure increase is extremely small at a high wind speed of 25 m/s.
Only the control of the drag is discussed in this paper. The drag coefficient Cd is defined as
C d = D / ( 1 2 × ρ U 2 × A )
where D is the force of drag, ρ is the density of air monitored in real time during the experiment, and A is the area of the frontal model section.
To quantify drag reduction, ΔCd is considered as follows:
Δ C d = C d o n C d o f f 1 × 100 %
where the superscripts correspond to the state of actuation (on or off). A negative ΔCd indicates the drag reduction rate.
Through research on the drag coefficient under different wind speeds and excitation voltages, the trend of the drag coefficient change was determined to be consistent with the trend of pressure change in Figure 12. Therefore, only the maximum drag reduction rates at different wind speeds are listed in Table 2. The maximum drag reduction rate under the control of the plasma actuator can reach approximately 7.9% at a low speed; this result is consistent with the maximum drag reduction of 8% using a single actuator reported by Boucinha [26]. However, this value is the limit of the drag reduction rate under these wind speeds. The maximum drag reduction rate decreases at higher wind speeds. In particular, drag reduction is only 2.91% at a wind speed of 25 m/s.
The actuator exhibits a strong control effect on the wake flow at a low wind speed. Reaching the control limit is easy, and continuously increasing the excitation voltage is ineffective. The control effect of the actuator gradually weakens with an increase in wind speed. The maximum thrust of the actuator is generated under an excitation voltage of 17 kV. However, such a value still cannot meet the effective requirement of drag reduction at a high wind speed. Optimizing the design of the actuator and generating considerable thrust to achieve effective control at a high wind speed should be continued.

5. Conclusions

In the present research, the aerodynamic characteristics of ionic wind under excitation voltages of 9–18 kV were measured, and the change rule of the maximum ionic wind velocity with the excitation voltage was determined. Then, the plasma actuator was used to control flow over an Ahmed body model with a rear slant angle of 25° and the influence of the actuator position, excitation voltage, and wind speed on the control effect was studied. This study provides detailed data support for subsequent studies on Ahmed model flow control at different wind speeds, and several conclusions can be drawn, as follows.
The effect of drag reduction is better when the upper electrode of the actuator is placed at the end of the top surface, increasing the likelihood of the plasma generation region approaching the natural separation location.
The pressure at the top of the symmetry line of the slanted surface was analyzed and determined to be influenced by the local airflow velocity and the low-pressure separation zone formed by the separation flow in the tail. When the excitation voltage is low, the pressure is primarily affected by airflow acceleration and gradually decreases. The airflow velocity changes minimally as the excitation voltage gradually increases. It is primarily affected by the decrease in the separation zone, and the pressure gradually increases. Although the acceleration of the airflow around the top of the slanted surface leads to a decrease in pressure in this region, the suppression of the separation zone causes the overall pressure in the tail region to rise, reducing drag. In this manner, the mechanism of flow control on the Ahmed model was further explored.
At low wind speeds, the maximum velocity of ionic wind for optimal control was found and a maximum drag reduction rate of approximately 7.9% was obtained. At a wind speed of 10 m/s, effective control can be achieved when the maximum velocity of ionic wind is 1.71 m/s. At a wind speed of 15 m/s, effective control can be achieved when the maximum velocity of ionic wind is 2.54 m/s. At high wind speeds, a maximum velocity of 3.3 m/s is insufficient for achieving the best control effect, and the maximum drag reduction rate dropped to 6.2% at a wind speed of 20 m/s and to 2.9% at a wind speed of 25 m/s. Therefore, only by continuing to optimize the actuator to generate considerable thrust can drag reduction be effectively achieved at a high wind speed.
For further investigation of plasma actuator effectiveness, it is suggested that multiple plasma actuators be used simultaneously to achieve effective control at higher speeds and the relationship between the plasma actuator energy consumption and the amount of fuel reduction be evaluated.

Author Contributions

Writing–review & editing, Z.H.; Conceptualization, X.H.; Writing–original draft, P.G; Resources, Z.W.; Data curation & supervision, J.W.

Funding

This work was supported by the National Science Foundation of China (No. 51875238).

Conflicts of Interest

The authors declare no conflict of interest.

References

  1. Hu, X.; Yang, B.; Lei, Y.; Wang, J.; Li, X.; Liao, L.; Xu, T. Automotive shape optimization using the radial basis function model based on a parametric surface grid. Proc. Inst. Mech. Eng. Part D J. Automob. Eng. 2016, 230, 1808–1821. [Google Scholar] [CrossRef]
  2. Fourrie, G.; Keirsbulck, L.; Labraga, L.; Gilliéron, P. Bluff-body drag reduction using a deflector. Exp. Fluids 2011, 50, 385–395. [Google Scholar] [CrossRef]
  3. Kourta, A.; Leclerc, C. Characterization of synthetic jet actuation with application to Ahmed body wake. Sens. Actuators A Phys. 2013, 192, 13–26. [Google Scholar] [CrossRef]
  4. Barros, D.; Borée, J.; Noack, B.R.; Spohn, A.; Ruiz, T. Bluff body drag manipulation using pulsed jets and coanda effect. J. Fluid Mech. 2016, 805, 422–459. [Google Scholar] [CrossRef]
  5. Lu, W.; Huang, G.; Wang, J.; Yang, Y. Interpretation of Four Unique Phenomena and the Mechanism in Unsteady Flow Separation Controls. Energies 2019, 12, 587. [Google Scholar] [CrossRef]
  6. Metka, M.; Gregory, J.W. Drag Reduction on the 25-deg Ahmed Model Using Fluidic Oscillators. J. Fluids Eng. 2015, 137, 051108. [Google Scholar] [CrossRef]
  7. Benard, N.; Moreau, E. Electrical and mechanical characteristics of surface AC dielectric barrier discharge plasma actuators applied to airflow control. Exp. Fluids 2014, 55, 1846. [Google Scholar] [CrossRef]
  8. Moreau, E.; Debien, A.; Breux, J.M.; Benard, N. Control of a turbulent flow separated at mid-chord along an airfoil with DBD plasma actuators. J. Electrost. 2016, 83, 78–87. [Google Scholar] [CrossRef]
  9. Moreau, E. Airflow control by non-thermal plasma actuators. J. Phys. D (Appl. Phys.) 2007, 40, 605–636. [Google Scholar] [CrossRef]
  10. Rodrigues, F.; Mushyam, A.; Pascoa, J.; Trancossi, M. A new plasma actuator configuration for improved efficiency: The stair-shaped dielectric barrier discharge actuator. J. Phys. D Appl. Phys. 2019, 52, 385201. [Google Scholar] [CrossRef]
  11. Suzen, Y.B.; Huang, P.G.; Jacob, J.D.; Ashpis, D.E. Numerical simulations of plasma based flow control applications. In Proceedings of the 35th Fluid Dynamics Conference and Exhibit, AIAA 2005–4633, Toronto, ON, Canada, 6–9 June 2005. [Google Scholar]
  12. Kriegseis, J.; Duchmann, A.; Tropea, C.; Grundmann, S. On the classification of dielectric barrier discharge plasma actuators: A comprehensive performance evaluation study. J. Appl. Phys. 2013, 114, 053301. [Google Scholar] [CrossRef]
  13. He, C.; Corke, T.C.; Patel, M.P. Numerical and Experimental Analysis of Plasma Flow Control over a Hump Model. In Proceedings of the 45th AIAA Aerospace Sciences Meeting and Exhibit, AIAA 2007–0935, Reno, NV, USA, 8–11 January 2007. [Google Scholar]
  14. Boeuf, J.P.; Lagmich, Y.; Pitchford, L.C. Contribution of positive and negative ions to the electrohydrodynamic force in a dielectric barrier discharge plasma actuator operating in air. J. Appl. Phys. 2009, 106, 023115. [Google Scholar] [CrossRef]
  15. Magnier, P.; Hong, D.; Leroy-Chesneau, A.; Bauchire, J.M.; Hureau, J. Control of separated flows with the ionic wind generated by a DC corona discharge. Exp. Fluids 2007, 42, 815–825. [Google Scholar] [CrossRef] [Green Version]
  16. Boucinha, V.; Magnier, P.; Régine, W.; Leroy-Chesneau, A.; Joussot, R. Characterization of the Ionic Wind Induced by a Sine DBD Actuator Used for Laminar-to-Turbulent Transition Delay. In Proceedings of the 4th Flow Control Conference, AIAA 2008–4210, Seattle, WA, USA, 23–26 June 2008. [Google Scholar]
  17. Komuro, A.; Takashima, K.; Suzuki, K.; Kanno, S.; Nonomura, T.; Kaneko, T.; Ando, A.; Asai, K. Influence of discharge energy on the lift and drag forces induced by a nanosecond-pulse-driven plasma actuator. Plasma Sources Sci. Technol. 2019, 28, 065006. [Google Scholar] [CrossRef]
  18. Fukumoto, H.; Aono, H.; Watanabe, T.; Tanaka, M.; Matsuda, H.; Osako, T.; Nonomura, T.; Oyama, A.; Fujii, K. Control of dynamic flowfield around a pitching NACA633−618 airfoil by a DBD plasma actuator. Int. J. Heat Fluid Flow 2016, 62, 10–23. [Google Scholar] [CrossRef]
  19. Abdollahzadeh, M.; Pascoa, J.C.; Oliveir, P.J. Comparison of DBD plasma actuators flow control authority in different modes of actuation. Aerosp. Sci. Technol. 2018, 78, 183–196. [Google Scholar] [CrossRef]
  20. Al-Sadawi, L.; Chong, T.P.; Kim, J.H. Aerodynamic noise reduction by plasma actuators for a flat plate with blunt trailing edge. J. Sound Vib. 2019, 439, 173–193. [Google Scholar] [CrossRef]
  21. Cai, J.; Tian, Y.; Meng, X.; Han, X.; Zhang, D.; Hu, H. An experimental study of icing control using DBD plasma actuator. Exp. Fluids 2017, 58, 102. [Google Scholar] [CrossRef]
  22. Kim, T.; Yun, S. Aerodynamic drag reduction of 3D train model using dielectric barrier discharge plasma actuators. In Proceedings of the 21th International Symposium on Plasma Chemistry (ISPC 21), Cairns Convention Centre, Queensland, Australia, 4–9 August 2013. [Google Scholar]
  23. Vernet, J.A.; Örlü, R.; Söderblom, D.; Elofsson, P.; Alfredsson, P.H. Plasma streamwise vortex generators for flow separation control on trucks. Flow Turbul. Combust 2018, 100, 1101–1109. [Google Scholar] [CrossRef]
  24. Roy, S.; Zhao, P.; Dasgupta, A.; Soni, J. Dielectric barrier discharge actuator for vehicle drag reduction at highway speeds. AIP Adv. 2016, 6, 025322. [Google Scholar] [CrossRef] [Green Version]
  25. Krajnovic, S.; Basara, B. LES of the flow around Ahmed body with active flow control. Turbul. Interact. 2010, 110, 247–254. [Google Scholar]
  26. Boucinha, V.; Weber, R.; Kourta, A. Drag reduction of a 3D bluff body using plasma actuators. Int. J. Aerodyn. 2011, 1, 262–281. [Google Scholar] [CrossRef]
  27. Shadmani, S.; Mojtaba, M.; Mojtaba Mousavi Nainiyan, S.; Mirzaei, M.; Ghasemiasl, R.; Pouryoussefi, S.G. Experimental Investigation of Flow Control Over an Ahmed Body Using DBD Plasma Actuator. J. Appl. Fluid Mech. 2018, 11, 1267–1276. [Google Scholar] [CrossRef]
  28. Ahmed, S.R.; Ramm, G.; Faltin, G. Some salient features of the time-averaged ground vehicle wake. In Proceedings of the SAE Technical Paper Series, International Congress and Exposition, Detroit, MI, USA, 27 February–2 March 1984. [Google Scholar]
  29. Hucho, W.H. Aerodynamics of Road Vehicles; Cambridge University Press: Cambridge, UK, 1998. [Google Scholar]
  30. Brunn, A.; Wassen, E.; Sperber, D.; Nitsche, W.; Thiele, F. Active drag control for a generic car model. Notes Numer. Fluid Mech. Multidiscip. Des. 2007, 95, 247–259. [Google Scholar]
  31. Qi, X.; Yang, L.; Yan, H.; Jin, Y.; Hua, Y.; Ren, C. Experimental study on surface dielectric barrier discharge plasma actuator with different encapsulated electrode widths for airflow control at atmospheric pressure. Plasma Sci. Technol. 2016, 18, 1005–1011. [Google Scholar] [CrossRef]
  32. Gao, G.; Dong, L.; Peng, K.; Wei, W.; Li, C.; Wu, G. Comparison of the surface dielectric barrier discharge characteristics under different electrode gaps. Phys. Plasmas 2017, 24, 013510. [Google Scholar] [CrossRef]
  33. Forte, M.; Jolibois, J.; Pons, J.; Moreau, E.; Touchard, G.; Cazalens, M. Optimization of a dielectric barrier discharge actuator by stationary and non-stationary measurements of the induced flow velocity: Application to airflow control. Exp. Fluids 2007, 43, 917–928. [Google Scholar] [CrossRef]
  34. Li, Z.; Hu, B.; Lan, S.; Zhang, J.; Huang, J. Control of turbulent channel flow using a plasma-based body force. Comput. Fluids 2015, 119, 26–36. [Google Scholar] [CrossRef]
  35. Dalvand, E.; Ebrahimi, S.M.; Pouryoussefi, S.G. Experimental investigation, modeling and prediction of transition from uniform discharge to filamentary discharge in DBD plasma actuators using artificial neural network. Appl. Therm. Eng. 2018, 129, 50–61. [Google Scholar] [CrossRef]
  36. Sato, M.; Aono, H.; Yakeno, A.; Nonomura, T.; Fujii, K. Multifactorial Effects of Operating Conditions of Dielectric-Barrier-Discharge Plasma Actuator on Laminar-Separated-Flow Control. AIAA J. 2015, 1–16. [Google Scholar] [CrossRef]
  37. Joseph, P.; Amandolese, X.; Aider, J. Drag reduction on the 25° slant angle Ahmed reference body using pulsed jets. Exp. Fluids 2012, 52, 1169–1185. [Google Scholar] [CrossRef]
  38. Aubrun, S.; Mcnally, J.; Alvi, F.; Kourta, A. Separation flow control on a generic ground vehicle using steady microjet arrays. Exp. Fluids 2011, 51, 1177–1187. [Google Scholar] [CrossRef]
Figure 1. Geometric dimensions and wake flow pattern of an Ahmed body with a rear slant angle of 25° [30].
Energies 12 03805 g001
Figure 2. Quiescent flow test: (a) arrangement of plasma actuator and (b) test environment.
Energies 12 03805 g002
Figure 3. Surface dielectric barrier discharge (SDBD) plasma actuator: (a) schematic structure and (b) plasma discharge.
Energies 12 03805 g003
Figure 4. Time-averaged velocity of ionic wind under different excitation voltages: (a) Vpp = 9 kV, (b) Vpp = 10 kV, (c) Vpp = 11 kV, (d) Vpp = 12 kV, (e) Vpp = 13 kV, (f) Vpp = 14 kV, (g) Vpp = 15 kV, (h) Vpp = 16 kV, (i) Vpp = 17 kV, and (j) Vpp = 18 kV.
Energies 12 03805 g004
Figure 5. Arrangement of the wind tunnel experiment.
Energies 12 03805 g005
Figure 6. Positions of the upper electrode: (a) Position 1 and (b) Position 2.
Energies 12 03805 g006
Figure 7. The position of pressure taps.
Energies 12 03805 g007
Figure 8. Contours of the pressure coefficient distribution on the slanted surface of the Ahmed body (U = 15 m/s): (a) no plasma, (b) plasma off, (c) Position 1 (Vpp = 13 kV), and (d) Position 2 (Vpp = 13 kV).
Energies 12 03805 g008
Figure 9. Flow field on the rear end of the Ahmed body (U= 15 m/s): (a) plasma off, (b) Vpp = 9 kV, (c) Vpp = 10 kV, (d) Vpp = 11 kV, (e) Vpp = 12 kV, and (f) Vpp = 13 kV.
Energies 12 03805 g009
Figure 10. Pressure coefficient at the top of the symmetry line of the slanted surface under different excitation voltages (U = 15 m/s).
Energies 12 03805 g010
Figure 11. Pressure coefficient distribution on the symmetry line of the model tail (U = 15 m/s).
Energies 12 03805 g011
Figure 12. Pressure coefficient distribution on the symmetry line of the slanted surface: (a) U= 10 m/s, (b) U= 15 m/s, (c) U= 20 m/s, and (d) U= 25 m/s.
Energies 12 03805 g012
Table 1. The maximum induced velocity and the power consumption under different excitation voltages.
Vpp (kV)9101112131415161718
Umax (m/s)1.321.561.712.402.543.013.103.163.303.22
Table 2. The maximum drag reduction rate at different wind speeds.
U (m/s)10152025
Cdmax (%)−7.92−7.87−6.20−2.91

