Article

Evaluation of Alternatives for Improving the Thermal Resistance of Window Glazing Edges

Department of Architectural & Urban Systems Engineering, Ewha Womans University, Seoul 03760, Korea
*
Author to whom correspondence should be addressed.
Energies 2019, 12(2), 244; https://doi.org/10.3390/en12020244
Submission received: 30 October 2018 / Revised: 8 January 2019 / Accepted: 11 January 2019 / Published: 14 January 2019

Abstract

:
To reduce condensation and ensure occupant comfort, the Korean Design Standard for Preventing Condensation in Apartment Buildings was enacted in 2014. However, glazing edges remain vulnerable to condensation. Because this design standard is recent, few window products satisfy the condensation resistance requirement for glazing edges, especially in the coldest region, and there have been limited investigations on improvement measures. This study evaluates and verifies various treatments for improving the glazing edge thermal resistance of double-glazed four-track horizontal sliding windows to reduce condensation risk and satisfy the design standard. Three-dimensional heat transfer simulations are performed for each alternative to obtain the surface temperature and temperature difference ratio (TDR) for the bottom edge of the glazing. The U-factors of the alternatives satisfying the required TDR for the coldest region are simulated, and the effects of increased local thermal resistance in the glazing edge on the U-factor of the window are analyzed. Mock-up tests are performed on the most economical and best-performing alternatives satisfying the coldest region TDR, and the TDRs and U-factors from the simulations and mock-up tests are compared to verify the performance of the most economical alternative. Insulating spacers, frame extensions, and low-emissivity coatings are effective in various cases.

1. Introduction

Windows in apartment buildings have relatively low thermal resistance compared to opaque, insulated building components; thus, condensation easily occurs on their indoor surfaces. For condensation on the indoor surfaces of large windows, there are many adverse effects that can induce secondary damage to floor covering materials (e.g., the generation of mildew) [1,2,3,4,5,6,7,8]. To resolve frequent condensation problems in winter, the Korean government enacted the Design Standard for Preventing Condensation in Apartment Buildings [9], which came into effect in May 2014. In this standard, the average of the lowest daily outdoor air temperatures in January is used to divide the country into regions with the following design outdoor air temperatures: I: −20 °C; II: −15 °C; and III: −10 °C. Furthermore, the allowed maximum temperature difference ratios (TDRs) are set for external windows by region and component (e.g., glazing center, glazing edge and frame).
Multistory apartment buildings account for more than 58% of all residential buildings in Korea [6], with most having additional windows on the outdoor side of the balcony to create an unheated indoor space. In many cases, the balcony, which can act as a thermal buffer zone between outdoor and heated indoor spaces, is eliminated to increase the effective floor area indoors (as allowed by law; Figure 1); thus, condensation often occurs on the indoor faces of windows during winter. When there is no balcony, double-glazed four-track horizontal sliding windows are mainly used (Figure 2). The trend of using slim frames to maximize the view has increased recently. Thus, the frame area is reduced at the window elevation, which further lowers the thermal resistance of the glazing edge vulnerable to condensation. Because the design standard was implemented relatively recently, few window products currently satisfy the required TDR for the glazing edge, especially in Region I, which has the lowest design outdoor air temperature (−20 °C). Furthermore, there have been insufficient analyses on improvement plans. Thus, the market is experiencing difficulties [10].
This study considers the double-glazed four-track horizontal sliding windows normally used in apartment buildings and evaluates and verifies various thermal resistance improvement methods for glazing edges to reduce the condensation risk and effectively satisfy the design standard. First, the double-glazed four-track window components vulnerable to condensation and each improvement measure are reviewed; then, alternative window configurations are selected. Using the Physibel TRISCO v.12 [11] program, three-dimensional steady-state heat transfer simulations are performed for each alternative to obtain the surface temperature and TDR of the bottom edge of the glazing. Using the Window/Therm v.6.3 [12,13] program, the U-factors of the alternatives satisfying the required TDR for Region I are simulated, and the effects of increased local thermal resistance in the glazing edge on the U-factor of the window are analyzed. Among the alternatives satisfying the required TDR for Region I, mock-up tests are performed on the most economical and best-performing alternatives. The TDRs and U-factors from the simulations and mock-up tests are compared to verify the performance of the most economical alternative.

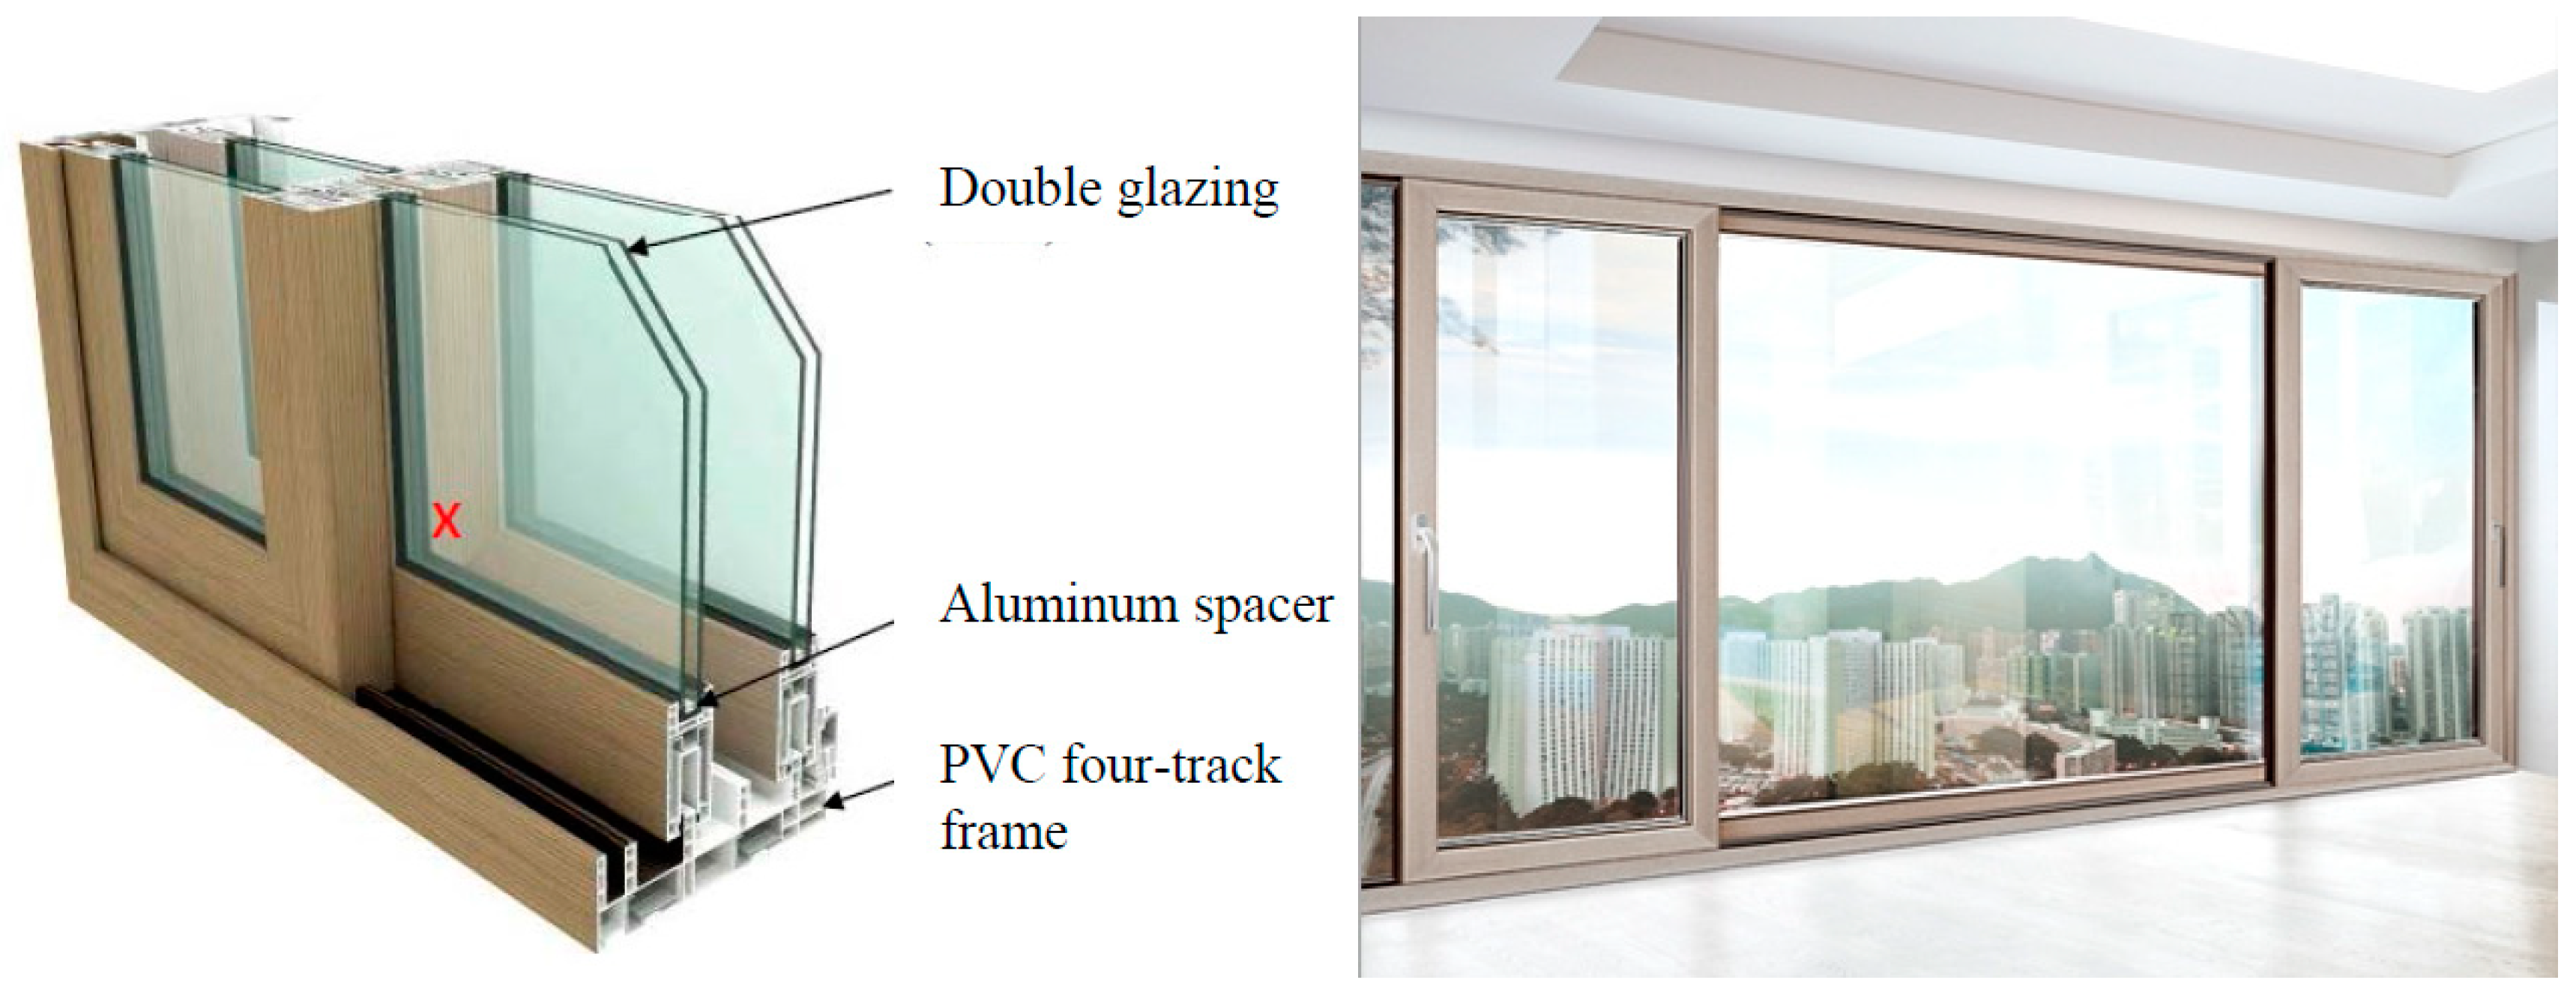
2. Previous Studies and Setup of Alternatives

Many studies have been performed to improve the overall thermal performance of windows and condensation in double-glazed two-track, triple-glazed, or curtain wall system windows. The numerical simulations and experimental methods were mostly used to evaluate the thermal performance of windows [14,15,16,17], and experimental methods of window’s airtightness and thermal insulation performance were performed to find the effect of ventilation on window condensation issues [18,19]. In order to improve the thermal performance of window, previous studies suggested that the use of secondary glazing on single-glazed and shading control system in double glazing unit to optimize the thermal performance of windows [20,21]. In Korea, the required insulation level for building envelopes has been significantly strengthened since 2001 [22]. In current Korean apartment buildings, double-glazed polyvinyl chloride (PVC)-framed four-track horizontal sliding windows (Figure 2) are mainly used, and triple-glazed PVC-framed windows are used in some cases [23]. According to previous studies [23,24] on the status of indoor surface condensation on double-glazed four-track windows, condensation mainly occurs at the bottom edge of the glazing of inner windows on tracks 3 and 4, making it difficult to satisfy the design standard. In particular, it was the most difficult to satisfy the design standard at the bottom edge of the glazing (point x in Figure 2) of the inner window on track 3, which was located closer to the outdoor side. This glazing edge tends to have a lower indoor surface temperature than other glazing edges due to natural convection in the glazing cavity, and indoor air and heat transfer through the meeting rail where the frames overlap. On the other hand, there were no difficulties in satisfying the design standard for the glazing center and frame.
In a previous study [23], various measures were suggested to reduce the condensation risk on glazing and the frame (Table 1), and effective measures (bold items in Table 1) were selected through two-dimensional steady-state heat transfer simulations. In the case of glazing, good improvements were obtained through insulating spacers, low-emissivity (low-e) coatings, and argon or krypton gas fillings. For frames, good improvements were achieved through structure and size adjustments. In this study, thermal resistance improvement measures for glazing edges were selected by referring to a previous study [24]. Thermoplastic spacer (TPS), low-e coatings, argon gas fillings, and frame structure and size adjustments were applied to set up alternatives that were combinations of all factors. For the frame structure and size adjustments, the height of the frame overlapping the glazing was extended by 5 mm (Figure 3) to compensate for the slim frame for view enhancement.

3. Alternative Configurations and Temperature Difference Ratio and U-factor Evaluation Methods

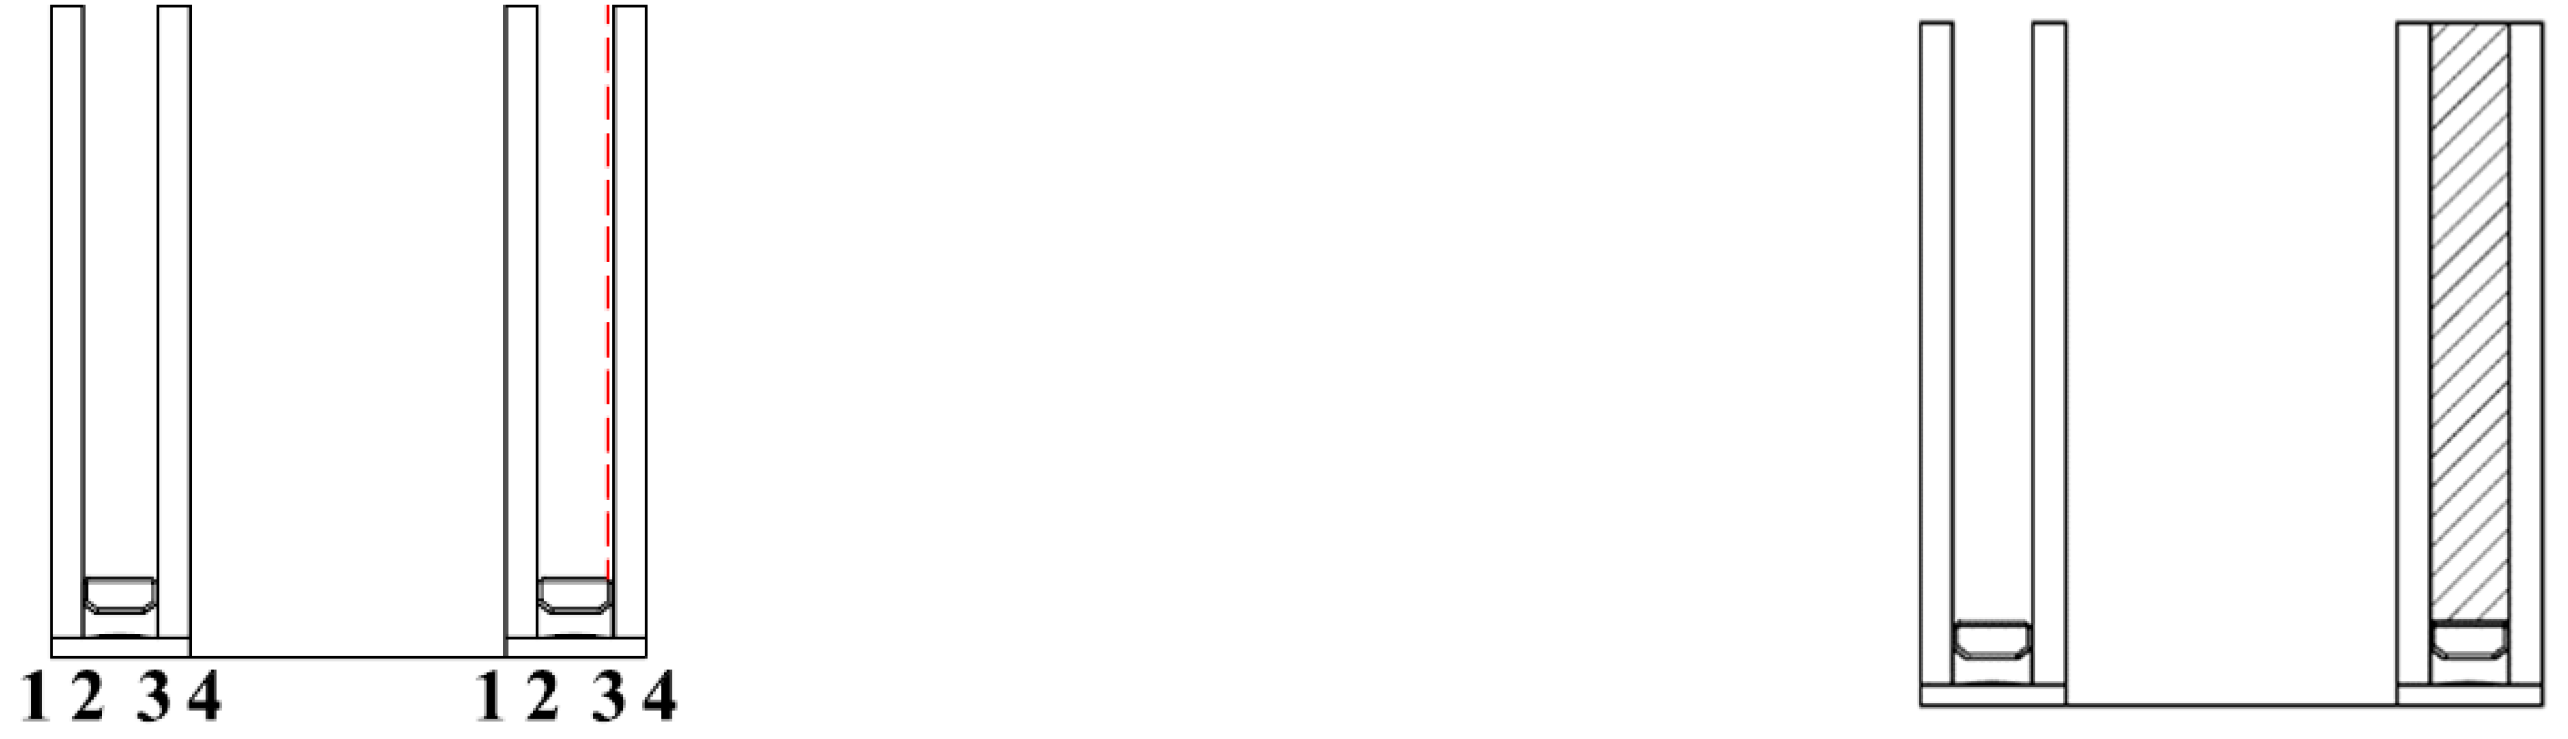
3.1. Alternative Configurations

In total, 48 configurations of double-glazed four-track horizontal sliding window (refer to Figure 7a) were considered in this study. Table 2 lists the specifications of the base model and alternatives for evaluating the TDR and U-factors, and Figure 4 lists the horizontal sections of the meeting rails for the inner windows (windows on tracks 3 and 4 in Figure 7a) of each case. The base model (Case 1-0 in Table 2) was established as an existing window with inner and outer windows that all have aluminum spacers, 22-mm-thick double glazing (5CL-12Air-5CL), and a 14-mm-high frame overlapping the glazing. Case 2-0 is an alternative in which the TPS insulating spacers replace the aluminum spacers of Case 1-0. Case 3-0 is an alternative in which the Case 2-0 frame height is extended to 19 mm. Cases 1-1 to 1-15, Cases 2-1 to 2-15, and Cases 3-1 to 3-15 were configured as alternatives with a low-e coating and argon gas filling for each case. As detailed in Table 2 and Figure 5, the alternatives with low-e coating include cases with a single coating on the inner window surface 3 (Cases 1-1, 2-1, and 3-1), a single coating on the outer window surface 3 (Cases 1-2, 2-2, and 3-2), and with a double coating on the inner and outer window surfaces 3 (Cases 1-3, 2-3, and 3-3). The alternatives with argon gas filling include cases with a single filling in the inner window (Cases 1-4, 2-4, and 3-4), cases with a single filling in the outer window (Cases 1-5, 2-5, and 3-5), and cases with a double filling in the inner and outer windows (Cases 1-6, 2-6, and 3-6). Cases employing both low-e coating and argon gas filling (Cases 1-7 to 1-15, Cases 2-7 to 2-15, and Cases 3-7 to 3-15) were also included. Thus, there were 16 configurations for each type of case and a total of 48 configurations.

3.2. TDR Evaluation Method

3.2.1. Evaluation Overview

In the design standard [9], the condensation resistance of the window is evaluated as a TDR, which is obtained through measurements using the Korean standard test method of the TDR (KS F 2295) [25] or simulations. The TDR is the relative ratio of the indoor air and surface temperature difference to the indoor and outdoor air temperature difference, with a value between 0 and 1. The TDR is calculated from Equation (1), and the TDR value is rounded down after the third decimal place. A smaller value indicates a lower condensation risk because the degree of decrease in indoor surface temperature is smaller. The TDR is equivalent to the temperature factor subtracted from 1, as specified in ISO 10211 [26]. In a steady-state condition, the TDR remains constant when the thermal resistance remains constant, even if the indoor and outdoor air temperatures change. Therefore, the TDR can be determined by obtaining the indoor surface temperature under certain indoor and outdoor air temperature conditions [27].
T D R = T i T s i T i T o
where TDR represents the temperature difference ratio, Ti represents the indoor air temperature (°C), Tsi represents the indoor surface temperature (°C), and To represents the outdoor air temperature (°C).
The TDR evaluation points specified in the design standard are shown in Figure 6, and the allowed maximum TDR at each point in each region is listed in Table 3. Regions I, II, and III in the design standard are based on the average of the lowest daily outdoor air temperatures in January (i.e., the coldest month), and the country is divided into –20 °C, –15 °C, and –10 °C regions. The TDR evaluation point for the base model and alternatives in this study was set as the bottom edge of the glazing of the inner window closest to the outdoors, as previous studies [23,24] have shown that this is the most difficult to satisfy the design standard (Section 2). This is point E1 on the window on track 3 in Figure 7a. The evaluation determines whether the required TDR (≤0.22) for Region I was satisfied by the TDR, which was found through Equation (1), using the surface temperature of point E1 obtained from the simulations.

3.2.2. Simulation Method

At the bottom edge of the glazing for the TDR evaluation, heat is transferred in three dimensions. Thus, the Physibel TRISCO v.12 [11] program, which can perform three-dimensional steady-state heat transfer simulations with highly accurate calculations for complex-shaped parts, was used. As shown in Figure 7b, the simulated area was the bottom middle part of a window, with a 2000 mm height and width. The simulated model dimensions were a width of 1200 mm and a height of 1100 mm, extending 100 mm from points located 1/4 and 3/4 along the length of the entire window and 1/2 along the height of the entire window according to Accreditation secretariat for window-set simulation guide [28]. By extending 100 mm from the glazing center, it secured a complete heat transfer analysis of the glazing center. The boundary conditions, simulation parameters, and material properties are listed in Table 4, Table 5 and Table 6, respectively. The temperatures for the indoor and outdoor boundary conditions were set to 25 °C and −20 °C (i.e., the design outdoor air temperature of Region I), respectively, according to the design standard. Point E1 (Figure 7a), which is the TDR evaluation point, represents the corner where the glazing and frame meet, and heat transfer between the surface and indoor environment is likely to be reduced. The values in ISO 10077-2, Annex E [29], were used as the surface heat transfer coefficients, as they have been reported to possibly yield more accurate results for window heat transfer simulations [30,31]. In ISO 10077-2 [29], the surface resistances were set according to the window cross section shapes and conditions, as in Figure 8a. Accordingly, the indoor surface heat transfer coefficients were set to 7.7 W/m2K (hi) for plane surfaces and 5.0 W/m2K (hi_reduced) for the edges or junctions between two surfaces, and the outdoor coefficient was set to 25.0 W/m2K (ho), as in Table 4 and Figure 8b.
Material properties were set with reference to ISO 10077-2, Annex D [29] and the Window/Therm v.6.3 program library [13]. For the thermal conductivity of the TPS, the experimental value from the accredited testing organization was used. The equivalent thermal conductivities of the air cavities in the frame and between the inner and outer windows were calculated according to the EQUIMAT conditions [11]. The internal heat transfer was separately calculated for the cavities in the double glazing, which were filled with air or argon according to the TRANSMAT conditions [11]. The conditions used in the calculations conformed to those in ISO 10077-2 [29] and EN 673 [32].

3.3. U-Factor Evaluation Method

3.3.1. Evaluation Overview

The required window U-factors for each region are specified in the Korean Construction Standard for Energy-efficient Sustainable Residential Buildings [33]. The regions are divided into the Central region, Southern region, and Jeju Island, and the allowed maximum U-factors for windows directly facing the outdoors are 1.0 W/m2K, 1.2 W/m2K, and 1.6 W/m2K, respectively. The cities in Region I all correspond to the Central region of the construction standard; thus, the evaluation focuses on determining whether the U-factor obtained from the simulations satisfies the required U-factor for the Central region (≤1.0 W/m2K).

3.3.2. Simulation Method

The U-factor simulations were performed using the Window/Therm v.6.3 [12,13] program developed at the Lawrence Berkeley National Laboratory in the United States according to ISO 15099 [34]. In Window/Therm v.6.3, the window U-factor is calculated as the area-weighted average U-factor of the glazing center, glazing edge, and frame, as shown in Equation (2) [12,34,35]:
U t = Σ U c g A c g + Σ U e g A e g + Σ U f r A f r A t
where U t , U c g , U e g , and U f r represent the U-factors (W/m2K) for the total window, glazing center, glazing edge, and frame, respectively, and A t , A c g , A e g , and A f r represent the areas (m2) of the total window, glazing center, glazing edge, and frame, respectively.
The window sizes were identical in the U-factor and TDR simulations, with a 2000 mm width and height and this is the standard window size in accordance with KS F 2295 and 2278. The indoor and outdoor boundary conditions are listed in Table 7. The indoor and outdoor temperatures were 20 °C and 0 °C, respectively, in accordance with KS F 2278 [36] specified in the construction standard. The surface heat transfer coefficients were set to be identical to those in the TDR simulations. The material properties were identical to those in the TDR simulations (Table 6). The window sill, head, and jamb cross sections were identical. The Therm program simulation was performed on the sill and meeting rail (Figure 9).

4. TDR and U-Factor Evaluation Results

4.1. TDR Evaluation Results

The TDR evaluation results for the base model and alternatives are listed in Table 8. The point E1 (Figure 7a) temperatures in the base model and alternatives were a minimum of 13.1 °C (Case 1-0) and a maximum of 16.8 °C (Case 3-15), with a difference of 3.7 °C, and the TDR distribution was from 0.20 to 0.29.
For cases with the same glazing configuration, the TDR for Case 2 was an average of 13% lower than that in Case 1, and Case 3 was an average of 18% lower than that in Case 1. Therefore, the use of an insulating spacer is very effective, and extending the frame height is also effective. In regards the TDR according to the glazing configuration in the same cases, low-e coating was often more effective than argon gas filling. Furthermore, in many cases, low-e coating was more effective as a double rather than single coating. For a single coating, the outer windows (on tracks 1 and 2 in Figure 7a) were more effective than the inner windows (on tracks 3 and 4 in Figure 7) because a higher temperature in the air cavity between the inner and outer windows was achieved when a low-e coating was applied to the outer windows than when it was applied to the inner windows. On the other hand, when argon gas filling was used, double filling was more effective than single filling in some cases; however, the difference was not large. For the single filling location, the outer windows were more effective than the inner windows in some cases but, again, the difference was not large because argon gas filling has a lower thermal resistance improvement effect than low-e coating.
In Case 1 (Cases 1-0 to 1-15), with aluminum spacers and the existing frame height, that overlaps the glazing by 14 mm, the TDR distribution was from 0.26 to 0.29. Only the required TDR for Region III (≤0.27) was satisfied by the eight alternatives (Cases 1-2, 1-3, 1-8, 1-9, 1-11, 1-12, 1-14, and 1-15); thus, the condensation resistance was inadequate. In Case 2 (Cases 2-0 to 2-15), where the TPS insulating spacer replaced the Case 1 aluminum spacer, the TDR distribution was from 0.22 to 0.26, with a large improvement compared with Case 1. Five (Cases 2-0, 2-1, and 2-4 through 2-6), eight (Cases 2-2, 2-3, 2-7, 2-8, 2-10, 2-11, 2-13, and 2-14), and three (Cases 2-9, 2-12, and 2-15) alternatives satisfied the required TDRs for Regions III (≤0.27), II (≤0.24), and I (≤0.22), respectively. In Case 3 (Cases 3-0 to 3-15), where the height of the frame that overlapped the glazing was extended by 5 mm compared to that in Case 2, the TDR distribution was from 0.20 to 0.25, which was a larger improvement than that in Case 2. Four (Cases 3-0, 3-4 through 3-6), five (Cases 3-1, 3-2, 3-7, 3-8, and 3-10), and seven (Cases 3-3, 3-9, 3-11 through 3-15) alternatives satisfied the required TDR for Regions III (≤0.27), II (≤0.24), and I (≤0.22), respectively, indicating considerable improvement in condensation resistance.
Hence, an insulating spacer is necessary to satisfy the design standard for Regions I and II, which have design outdoor air temperatures of −20°C and −15°C, respectively, and extending the height of the frame overlapping the glazing is also effective. The spacer, which is responsible for functions such as maintaining the air gap between glass panes and acting as a desiccant container, is installed throughout the entire glazing edge; thus, when an aluminum spacer with a very high thermal conductivity is used, it is a major factor in reducing the thermal resistance of the entire glazing edge. Therefore, the use of the insulating spacer can be considered a cost-effective method for satisfying the design standard in Regions I and II, even without double low-e coatings and argon gas fillings which cause large cost increases.
As shown in Figure 10, if the height of the frame overlapping the glazing is extended, the local thermal resistance is increased, and the heat flow paths are extended, which improves the thermal resistance of the glazing edge. These changes also have the effect of moving the TDR evaluation point closer to the glazing center by the amount that the frame height is extended. The above results show that the frames are excessively slim due to an emphasis on the view and extending the height of the frame overlapping the glazing is a cost-effective method for satisfying the design standard in Regions I and II.

4.2. U-Factor Evaluation Results

Table 9 lists the Ut evaluation results for the 10 alternatives (three in Case 2 and seven in Case 3) that satisfied the required TDR in Region I (≤0.22). The minimum and maximum Ut values were 0.912 (Case 3-15) and 1.081 W/m2K (Case 3-13), respectively, with a difference of 16%. When the glazing configuration was identical (Cases 2-9 and 3-9, Cases 2-12 and 3-12, and Cases 2-15 and 3-15), the Ut in Case 3 was always smaller than that in Case 2, which showed that when the height of the frame overlapping the glazing was extended by 5 mm, the Ut was reduced as well. Ut was obtained as an area-weighted average of Ucg, Ueg, and Ufr, as in Equation (2). If the frame height overlapping the glazing was extended, the cavity chamber in the frame was also extended and, thus, its thermal resistance was added, which had a positive effect of reducing Ueg and Ufr. On the other hand, the frame area increased, which had the negative effect of reducing the area of the glazing center with the lowest U-factor. The above results showed that the positive effect from reducing Ueg and Ufr was larger than the negative effect from reducing the area of the glazing center. Table 10 shows the changes in the areas and U-factors of the glazing center, glazing edge, frame, and total window between Cases 2 and 3. In Table 10, Ueg and Ufr represent the area-weighted average values for each Ueg and Ufr, respectively.
The three Case 2 alternatives (Cases 2-9, 2-12, and 2-15) all had Ut values satisfying the required U-factor for the Central region (≤1.0 W/m2K). Of the seven alternatives of Case 3, the three alternatives (Cases 3-9, 3-12, and 3-15) with the same glazing configuration as that in Case 2 had slightly lower Ut values than those in Case 2, which satisfied the required U-factor for the Central region by a slightly larger margin. The other four Case 3 alternatives (Cases 3-3, 3-11, 3-13, and 3-14) were at a level with a maximum of 0.081 W/m2K larger than 1.0 W/m2K, which was very close to the required U-factor. As simulations may involve errors, mock-up tests are required to accurately determine whether these four alternatives satisfy the required U-factor of the Central region.

5. Performance Verification through Mock-up Tests

5.1. Mock-up Test Methods

The TDR and U-factor mock-up tests were performed on the most economical alternative of the ten alternatives listed in Table 9 to verify the satisfaction of the required TDR for Region I (≤0.22) and the required U-factor for the Central region (≤1.0 W/m2K). Mock-up tests were also performed on the best-performing alternative, and the results were compared with the simulation results to understand the difference trends between the TDR and U-factor simulations and the corresponding mock-up test results. The cost increases due to the increases in low-e coatings and argon gas fillings; therefore, Case 3-11, with low-e coating and argon gas filling on the outer windows only, was the most economical. The best-performing alternative was Case 3-15. Figure 11 shows a photograph of the window mock-ups for the tests.
The TDR was evaluated according to KS F 2295 [25], which specifies the specimen size, boundary conditions during the experiment, specimen installation, and measurement methods. The TDR tests were performed in a government-certified testing laboratory (Korea Laboratory Accreditation Scheme) with about 95% expected accuracy of measurement [37], and the experimental window size was set by KS F 2295 at a width of 2000 mm and a height of 2000 mm, which are the same as the TDR simulation conditions. The TDR test boundary conditions are listed in Table 11, and the temperature conditions were the same as the TDR simulation conditions. The window surface temperature was measured with T-type thermocouples, with an accuracy of ±0.5 °C.
The U-factor was evaluated according to KS F 2278 [36], which is the Korean standard test method of the thermal resistance for windows and doors. Similar to KS F 2295, it sets the specimen size, boundary conditions during the experiment, specimen installation, and measurement methods. The U-factor tests were performed in the same testing laboratory, and the experimental window size specified in KS F 2278 is identical to that specified in KS F 2295, which are also identical to the U-factor simulation conditions. The U-factor test boundary conditions are listed in Table 12, and the temperature conditions were identical to the U-factor simulation conditions.

5.2. Mock-up Test Results Compared with Simulation Results

Figure 12a compares the TDR test results and simulation results for the glazing edge (E1 in Figure 7a) in the most economical alternative (Case 3-11) and best-performing alternative (Case 3-15). For Case 3-11, the mock-up test TDR was 0.01 lower than the simulated TDR; thus, the condensation resistance was slightly better. The mock-up test and simulation TDRs were identical for Case 3-15. Thus, the TDR simulation results were almost identical to the mock-up test results, and the most economical alternative was confirmed to satisfy the TDR required by the design standard for Region I. For reference, the two alternatives satisfied the required TDR for Region I not only at the glazing edge but also at all other points (Figure 6).
Figure 12b compares the U-factor test and simulation results for Case 3-11 and Case 3-15. The U-factors in the mock-up test were lower than those via the simulation for both cases, and the difference was somewhat large for Case 3-15, which was thought to be mainly caused by the difference in surface resistance and due to the use of thermal conductivity cautionary values in simulations and on the stratification phenomenon, which is not considered in the numerical simulation method [14]. Therefore, the U-factor simulation results slightly underestimated the thermal resistance of the window compared to those via the mock-up tests, and Case 3-11 satisfied the U-factor required by the construction standard for the Central region. Hence, using an insulating spacer and extending the height of the frame overlapping the glazing are economical methods that not only improve condensation resistance at the glazing edge, but also improve the total window U-factor.

6. Conclusions

This study aimed to reduce the condensation risk and effectively satisfy the Korean Design Standard for Preventing Condensation in Apartment Buildings for double-glazed four-track horizontal sliding windows by evaluating and verifying the performances of the alternatives for improving the thermal resistance at the glazing edge. The conclusions are summarized below.
(1) If an insulating spacer is used in an existing window, the temperature difference ratio (TDR) at the glazing edge is improved by 13% on average. If the height of the frame overlapping the glazing is also extended by 5 mm, the TDR is improved by 18% on average. In many cases, a low-e coating is more effective than argon gas filling, with double coating being more effective than single coating. When considering the position of the single coating, placement on the outer window is more effective than that on the inner window. In some cases, argon gas filling is more effective as a double than single filling, and the filling position is more effective on the outer window than that on the inner window; however, the difference is not large.
(2) For Case 1, with an aluminum spacer and no frame height extension, only eight alternatives satisfied the required TDR for Region III (≤0.27; design outdoor air temperature: −10 °C). For Case 2, with an insulating thermoplastic spacer (TPS) instead of an aluminum spacer, five, eight, and three alternatives satisfied the required TDRs for Region III, Region II (≤0.24; design outdoor air temperature: −15 °C), and Region I (≤0.22; design outdoor air temperature: −20 °C), respectively. For Case 3, with the height of the frame overlapping the glazing in Case 2 extended by 5 mm, four, five, and seven alternatives satisfied the required TDRs of Regions III, II, and I, respectively; thus, the condensation resistance was improved greatly. Hence, an insulating spacer is necessary to satisfy Regions I and II of the design standard, with cold design outdoor air temperatures of −20 °C and −15 °C, respectively, and extending the height of the frame overlapping the glazing is also effective. These methods were cost-effective for satisfying the design standard in Regions I and II, even without double low-e coatings and argon gas fillings, which cause large cost increases.
(3) The U-factor evaluation results for the ten alternatives (three in Case 2 and seven in Case 3) satisfying the Region I TDR showed that for identical glazing configurations, the total window U-factors (Ut) in Case 3 were all smaller than those in Case 2, which indicated that when the height of the frame overlapping the glazing was extended by 5 mm, Ut was also reduced. The three alternatives from Case 2 (Cases 2-9, 2-12, and 2-15) all satisfied the required Ut for the Central region (≤1.0 W/m2K) in the construction standard. Of the seven Case 3 alternatives, three alternatives (Cases 3-9, 3-12, and 3-15) with the same glazing configuration as that in Case 2 had slightly lower Ut values than those in Case 2, which satisfied the required Ut by a slightly larger margin. The Ut values in the other four Case 3 alternatives (Cases 3-3, 3-11, 3-13, and 3-14) exceeded the required Ut slightly but were very close. As simulations may involve errors, mock-up tests were necessary to accurately determine the results.
(4) Mock-up tests on the TDRs and U-factors of the most economical (Case 3-11) and best-performing (Case 3-15) alternatives showed that the TDR simulation results were almost identical to the mock-up test results. It was confirmed that the most economical alternative satisfied the Region I TDR of the design standard. In addition, the U-factor simulation results slightly underestimated the thermal resistance of the window compared to the mock-up test results, and the most economical alternative satisfied the Central region U-factor for the construction standard.
The results of this study were determined for a specific frame profile widely used in Korea, and additional examinations may be needed when using a different frame profile. Additionally, the window size was set to a standard test specimen in order to validate and compare the simulation and mock-up test results. Thus, these results may be changed when the window size is assorted from the tested model in practical applications to the built environment. Furthermore, the material properties and boundary conditions in the simulations were derived from primary data widely used internationally. Therefore, the simulation results can be affected if the material properties and boundary conditions are different.

Author Contributions

Project administration, methodology, software, validation, writing—original draft preparation, S.P.; funding acquisition, writing—review and editing, supervision, S.-Y.S.

Funding

This research was supported by the Residential Environment Research Program funded by the Ministry of Land, Infrastructure, and Transport of the Korean government [grant number 19RERP-B082204-06].

Conflicts of Interest

The authors declare no conflict of interest.

References

  1. Alawadhi, E.M. Effect of an incompletely closed window shutter on indoor illuminance level and heat gain. Energy Build. 2016, 110, 112–119. [Google Scholar] [CrossRef]
  2. Bellia, L.; Minichiello, F. A simple evaluator of building envelope moisture condensation according to a European Standard. Build. Environ. 2003, 38, 457–468. [Google Scholar] [CrossRef]
  3. Gao, T.; Ihara, T.; Grynning, S.; Jelle, B.P.; Lien, A.G. Perspective of aerogel glazings in energy efficient buildings. Build. Environ. 2016, 95, 405–413. [Google Scholar] [CrossRef]
  4. Gläser, H.J.; Ulrich, S. Condensation on the outdoor surface of window glazing—Calculation methods, key parameters and prevention with low-emissivity coatings. Thin Solid Film. 2013, 532, 127–131. [Google Scholar] [CrossRef]
  5. Hassouneh, K.; Alshboul, A.; Al-Salaymeh, A. Influence of windows on the energy balance of apartment buildings in Amman. Energy Convers. Manag. 2010, 51, 1583–1591. [Google Scholar] [CrossRef]
  6. Hong, G.; Kim, D.; Kim, B. Experimental investigation of thermal behaviours in window systems by monitoring of surface condensation using full-scale measurements and simulation tools. Energies 2016, 9, 979. [Google Scholar] [CrossRef]
  7. Moon, H.J.; Ryu, S.H.; Kim, J.T. The effect of moisture transportation on energy efficiency and IAQ in residential buildings. Energy Build. 2014, 75, 439–446. [Google Scholar] [CrossRef]
  8. Song, S.-Y.; Jo, J.-H.; Yeo, M.-S.; Kim, Y.-D.; Song, K.-D. Evaluation of inside surface condensation in double glazing window system with insulation spacer: A case study of residential complex. Build. Environ. 2007, 42, 940–950. [Google Scholar] [CrossRef]
  9. Ministry of Land, Infrastructure and Transportation; Korean Design Standard for Preventing Condensation in Apartment Buildings, No. 2016-835; Ministry of Land, Infrastructure and Transportation: Sejong, Korea, 2016. (In Korean)
  10. Song, S.-Y.; Park, S.; Lee, H.-H.; Oh, H.; Lim, J.-H. Development of Building Technology to Improve the Living Performance Closely Related with Lifestyle to Realize the Housing Welfare; Annual Research Rep. III, Annex 3; Ministry of Land, Infrastructure and Transport: Seoul, Korea, 2016.
  11. Physibel. TRISCO Manual of Version 12.0w, Maldegem, Belgium, 2010. Available online: http://www.physibel.be (accessed on 25 February 2018).
  12. Lawrence Berkeley National Laboratory. THERM 7/WINDOW 7 NFRC Simulation Manual. 2017. Available online: https://windows.lbl.gov/sites/default/files/Downloads/NFRCSim7-July2017.pdf (accessed on 25 February 2018).
  13. Lawrence Berkeley National Laboratory. THERM Material Library, THERM 6.3. 2012. Available online: https://windows.lbl.gov/software/window (accessed on 25 February 2018).
  14. Baldinelli, G.; Bianchi, F. Windows thermal resistance: Infrared thermography aided comparative analysis among finite volumes simulations and experimental methods. Appl. Energy 2014, 136, 250–258. [Google Scholar] [CrossRef]
  15. Carlos, J.S. Optimizing the ventilated double window for solar collection. Sol. Energy 2017, 150, 454–462. [Google Scholar] [CrossRef]
  16. Liu, M.; Wittchen, K.B.; Heiselberg, P.K.; Winther, F.V. Development of a simplified and dynamic method for double glazing façade with night insulation and validated by full-scale façade element. Energy Build. 2013, 58, 163–171. [Google Scholar] [CrossRef] [Green Version]
  17. Hien, W.N.; Liping, W.; Chandra, A.N.; Pandey, A.R.; Xiaolin, W. Effects of double glazed facade on energy consumption, thermal comfort and condensation for a typical office building in Singapore. Energy Build. 2005, 37, 563–572. [Google Scholar] [CrossRef]
  18. Cho, W.; Iwamoto, S.; Kato, S. Condensation risk due to variations in airtightness and thermal insulation of an office building in warm and wet climate. Energies 2016, 9, 875. [Google Scholar] [CrossRef]
  19. Park, S.; Kim, M.; Lim, J.-H.; Song, S.-Y. Influence of drainage holes on condensation risk and air-tightness of windows an experimental case study of triple glazing PVC windows. J. Asian Archit. Build. Eng. 2017, 16, 83–90. [Google Scholar] [CrossRef]
  20. Bakonyi, D.; Dobszay, G. Simulation aided optimization of a historic window’s refurbishment. Energy Build. 2016, 126, 51–69. [Google Scholar] [CrossRef]
  21. Smith, N.; Isaacs, N.; Burgess, J.; Cox-Smith, I. Thermal performance of secondary glazing as a retrofit alternative for single-glazed windows. Energy Build. 2012, 54, 47–51. [Google Scholar] [CrossRef]
  22. Koo, S.-Y. Comparative analysis of window thermal performance calculation method between window certification systems. J. Archit. Inst. Korea 2015, 31, 119–127. (In Korean) [Google Scholar]
  23. Park, S.; Koo, S.-Y.; Lim, J.-H.; Seong, Y.-B.; Song, S.-Y. Condensation resistance evaluation of a double-sliding window system for apartment buildings. Procedia Eng. 2016, 146, 60–68. [Google Scholar] [CrossRef]
  24. Ewha Womans University. The Development of Building Technology to Improve the Living Performance Closely Related with Life Style to Realize the Housing Welfare; Annual R&D Report, Annex 3 Condensation; Environmental-Friendly Architecture Laboratory: Seoul, Korea, 2016. (In Korean) [Google Scholar]
  25. Korean Standard Association. KS F 2295 Test Method of Dew Condensation for Windows and Doors; Korean Standard Association: Chungcheongbuk-do, Korea, 2014. (In Korean) [Google Scholar]
  26. ISO 10211:2017. Thermal Bridges in Building Construction—Heat Flows and Surface Temperatures—Detailed Calculations; International Standard Organization: Geneva, Switzerland, 2017. [Google Scholar]
  27. Park, S.; Song, S.-Y. Case study on the inspection and repair of window condensation problems in a new apartment complex. J. Perform. Constr. Facil. 2018, 32, 04018071. [Google Scholar] [CrossRef]
  28. Accreditation Secretariat for Window-Set Simulation. The Assessments. Available online: https://window-sim.or.kr:6001/contents/contents.php (accessed on 10 November 2018). (In Korean).
  29. ISO 10077-2:2017. Thermal Performance of Windows, Doors and Shutters—Calculation of Thermal Transmittance—Part 2: Numerical Method for Frames; International Standard Organization: Geneva, Switzerland, 2017. [Google Scholar]
  30. Kim, M.-H.; Park, S.-H.; Koo, S.-Y.; Lim, J.-H.; Song, S.-Y. Comparison of surface thermal resistance conditions for the condensation resistance assessment of windows using simulation. J. Archit. Inst. Korea 2016, 32, 113–120. (In Korean) [Google Scholar] [CrossRef]
  31. Koo, S.-Y.; Park, S.; Song, J.-H.; Song, S.-Y. Effect of surface thermal resistance on the simulation accuracy of the condensation risk assessment for a high-performance window. Energies 2018, 11, 382. [Google Scholar] [CrossRef]
  32. DIN EN 673. Glass in Building—Determination of Thermal Transmittance (U Value)—Calculation Method; German Institute for Standardization: Berlin, Germany, 2011. [Google Scholar]
  33. Ministry of Land, Infrastructure and Transportation; Korean Construction Standard for Energy-Efficient Sustainable Residential Buildings, Notification No. 2017-442; Korean Ministry of Land, Infrastructure and Transportation: Sejong, Korea, 2017. (In Korean)
  34. ISO 15099. Thermal Performance of Windows, Doors, and Shading Devices—Detailed Calculations; International Standard Organization: Geneva, Switzerland, 2003. [Google Scholar]
  35. National Fenestration Rating Council (NFRC). Procedure for Determining Fenestration Product U-Factors; NFRC 100-2017; National Fenestration Rating Council (NFRC): Greenbelt, MD, USA, 2017. [Google Scholar]
  36. Korean Standard Association. KS F 2278 Standard Test Method for Thermal Resistance for Windows and Doors; Korean Standard Association: Chungcheongbuk-do, Korea, 2017. (In Korean) [Google Scholar]
  37. Korea Laboratory Accreditation Scheme (KOLAS). 2018. Available online: https://www.kolas.go.kr/ (assessed on 10 November 2018). (In Korean).
Figure 1. Examples of typical apartment floor plans: (a) with a balcony; (b) without a balcony.
Energies 12 00244 g001
Figure 2. Double-glazed four-track horizontal sliding window and window installation in an apartment unit.
Energies 12 00244 g002
Figure 3. Concept of frame structure and size adjustment: (a) existing case; (b) alternative (the frame height overlapping the glazing is extended by 5 mm).
Energies 12 00244 g003
Figure 4. Horizontal cross section of the inner meeting rail for each case: (a) Case 1; (b) Case 2; (c) Case 3.
Energies 12 00244 g004
Figure 5. Locations of low-e coating and argon gas filling in the double glazing: (a) low-e coating; (b) argon gas filling.
Energies 12 00244 g005aEnergies 12 00244 g005b
Figure 6. Temperature Difference Ratio evaluation locations specified in the Korean Design Standard for Preventing Condensation in Apartment Buildings [9].
Energies 12 00244 g006
Figure 7. Section, area and model for TDR simulation: (a) simulated section; (b) simulated area; (c) simulation model (Case 1-0).
Energies 12 00244 g007
Figure 8. Surface heat transfer coefficients: (a) schematic example of the boundary treatment in ISO 10077-2 (A: area of reduced surface heat transfer); (b) boundary conditions for simulation.
Energies 12 00244 g008
Figure 9. Therm simulation models and results (Case 1-0): (a) sill; (b) meeting rail.
Energies 12 00244 g009
Figure 10. Temperature distributions at the glazing edge and frame: (a) Case 2-1; (b) Case 3-1.
Energies 12 00244 g010
Figure 11. Window mock-up: (a) cold box side; (b) hot box side; (c) frame with extended height.
Energies 12 00244 g011
Figure 12. Mock-up test results compared with the simulation results: (a) TDR; (b) U-factor.
Energies 12 00244 g012
Table 1. Applicable measures for thermally improved window designs [23,24].
MeasuresExpected Effects
GlazingInsulating spacer 1
- Thermoplastic spacer (TPS)
- Thick-walled plastic spacer (Swisspacer)
- Thermally broken aluminum spacer (Warm light)
- Thin-walled stainless steel spacer (TGI)
Increased indoor surface temperature at the glazing edge
Spacer size adjustment
Insulating cap on the glazing end
Low-e coating 1Increased indoor surface temperature for glazing
Argon or krypton gas filling 1
FrameInsulating coverIncreased indoor surface temperature at the glazing edge and frame
Frame structure and size adjustment 1
Smaller cells within the frame between the reinforcing steel and frame
Insulating cap on the frame extrusions
Increased indoor surface temperature of the frame
1 Effective measures.
Table 2. Base model and alternatives.
DivisionSpacerHeight of Frame Overlapping Glazing (mm)Alternative CaseGlazing Configuration
Outer 1Inner 2
Case 1Aluminum14.0Case 1-0Base model5CL-12Air-5CL5CL-12Air-5CL
Case 1-1Low-e coating (LE)5CL-12Air-5CL5CL-12Air-5LE
Case 1-25CL-12Air-5LE5CL-12Air-5CL
Case 1-35CL-12Air-5LE5CL-12Air-5LE
Case 1-4Argon gas filling (Ar)5CL-12Air-5CL5CL-12Ar-5CL
Case 1-55CL-12Ar-5CL5CL-12Air-5CL
Case 1-65CL-12Ar-5CL5CL-12Ar-5CL
Case 1-7Low-e coating and argon gas filling5CL-12Air-5CL5CL-12Ar-5LE
Case 1-85CL-12Air-5LE5CL-12Ar-5CL
Case 1-95CL-12Air-5LE5CL-12Ar-5LE
Case 1-105CL-12Ar-5CL5CL-12Air-5LE
Case 1-115CL-12Ar-5LE5CL-12Air-5CL
Case 1-125CL-12Ar-5LE5CL-12Air-5LE
Case 1-135CL-12Ar-5CL5CL-12Ar-5LE
Case 1-145CL-12Ar-5LE5CL-12Ar-5CL
Case 1-155CL-12Ar-5LE5CL-12Ar-5LE
Case 2TPS
(Thermoplastic)
14.0Cases 2-0 to 2-15 Same glazing configurations as Cases 1-0 to 1-15 above
Case 3TPS
(Thermoplastic)
19.0 (+5.0)Cases 3-0 to 3-15Same glazing configurations as Cases 1-0 to 1-15 above
1 Windows on tracks 1 and 2 in Figure 7a. 2 Windows on tracks 3 and 4 in Figure 7a.
Table 3. Allowed maximum TDR for each region in the Korean Design Standard for Preventing Condensation in Apartment Buildings [9].
Region IRegion IIRegion III
Window directly facing the outdoorsGlazing center0.160.180.20
Glazing edge0.220.240.27
Frame0.250.280.32
Table 4. Boundary conditions for TDR simulations.
Temperature (°C)Surface Heat Transfer Coefficient (h, W/m2K)
Indoor Plane surface 25.07.7 (hi)
Edges or junctions between two surfaces5.0 (hi_reduced)
Outdoor−20.025.0 (ho)
Table 5. Simulation parameters.
ParameterValue
Maximum number of iteration cycles5
Maximum number of iterations within each iteration cycle10,000
Maximum temperature difference within each iteration cycle0.0001 °C
Maximum temperature difference between iteration cycles0.001 °C
Maximum heat flow divergence for a total object0.001%
Maximum heat flow divergence for any node1%
Table 6. Material properties [13].
MaterialThermal Conductivity (W/mK)Emissivity
GlazingGlass1.000.84
Low-e coating-0.04
Air0.025-
Argon (10% air and 90% argon)0.017-
SpacerAluminum160.00.1
Sealant0.350.9
Desiccant0.130.9
Insulating spacerThermoplastic spacer (TPS)0.25 10.9
FrameSteel50.00.8
Polyvinyl chloride (PVC)0.170.9
Glazing bead0.170.9
Silicon0.350.9
Ethylene propylene diene monomer (EPDM)0.250.9
Mohair0.140.9
Setting block0.200.9
1 Tested value of applied TPS, Accreditation report.
Table 7. Boundary conditions for U-factor simulations.
Temperature (°C)Surface Heat Transfer Coefficient (h, W/m2K)
IndoorPlane surface20.07.7 (hi)
Edges or junctions between two surfaces 5.0 (hi_reduced)
Outdoor0.025.0 (ho)
Table 8. TDRs and indoor surface temperatures at the glazing edge (E1 in Figure 7a).
BaseLow-e CoatingArgon Gas FillingLow-e Coating and Argon Gas Filling
0123456789101112131415
Case 1TDR0.290.290.270.270.290.290.290.290.270.270.290.260.260.280.260.26
Tsi (°C)13.113.314.014.113.213.213.313.314.114.113.414.314.413.414.414.4
TDR rank4422444422411311
Case 2TDR0.260.260.240.230.260.260.250.240.240.220.240.230.220.240.230.22
Tsi (°C)14.414.415.315.814.514.514.715.215.415.915.115.616.115.315.716.2
TDR rank5532554331321321
Case 3TDR0.250.230.230.210.250.250.250.230.230.210.230.220.210.220.220.20
Tsi (°C)14.715.515.616.314.814.815.015.815.816.515.616.016.615.916.116.8
TDR rank5442555442432331
Energies 12 00244 i001: Region I is satisfied (≤0.22); Energies 12 00244 i002: Region II is satisfied (≤0.24); Energies 12 00244 i003: Region III is satisfied (≤0.27).
Table 9. TDRs and U-factors for cases satisfying the required TDR for Region I.
SpacerHeight of Frame Overlapping Glazing (mm)Alternative CaseGlazing ConfigurationTDRUt (W/m2K)
InnerOuter
Case 1Aluminum14.0-----
Case 2TPS14.0Case 2-95CL-12Ar-5LE5CL-12Air-5LE0.220.975
Case 2-125CL-12Air-5LE5CL-12Ar-5LE0.220.962
Case 2-155CL-12Ar-5LE5CL-12Ar-5LE0.220.921
Case 3TPS19.0 (+5.0)Case 3-35CL-12Air-5LE5CL-12Air-5LE0.211.017
Case 3-95CL-12Ar-5LE5CL-12Air-5LE0.210.966
Case 3-115CL-12Air-5CL5CL-12Ar-5LE0.221.056
Case 3-125CL-12Air-5LE5CL-12Ar-5LE0.210.954
Case 3-135CL-12Ar-5LE5CL-12Ar-5CL0.221.081
Case 3-145CL-12Ar-5CL5CL-12Ar-5LE0.221.047
Case 3-155CL-12Ar-5LE5CL-12Ar-5LE0.200.912
Energies 12 00244 i001: Central region is satisfied (≤1.0 W/m2K); Energies 12 00244 i002: Southern region is satisfied (≤1.2 W/m2K).
Table 10. Variation in areas and U-factors between Cases 2 and 3.
Acg (m2)Aeg (m2)Afr (m2)At(m2)
Case 22.160.601.244.00
Case 32.110.601.294.00
Ucg (W/m2K)Ueg (W/m2K)Ufr (W/m2K)Ut (W/m2K)
Case 2-90.6800.9071.4890.975
Case 3-90.6800.8881.4470.966
Case 2-120.6810.9461.4320.962
Case 3-120.6810.9221.3910.954
Case 2-150.6100.8711.4560.921
Case 3-150.6100.8451.4130.912
Table 11. Boundary conditions for the TDR test in accordance with KS F 2295.
Temperature (°C)Relative Humidity (%)Surface Resistance (m2K/W)
Hot box25.0 ± 1.050.0 ± 1.00.11 ± 0.02
Cold box−20.0 ± 1.0-0.05 ± 0.02
Table 12. Boundary conditions for the U-factor test in accordance with KS F 2278.
Temperature (°C)Surface Resistance (m2K/W)
Hot box20.0 ± 1.00.12 ± 0.01
Cold box0.0 ± 1.00.05 ± 0.01

