Figure 1.
Experimental setup: (a) schematic diagram and (b) pictorial view.
Figure 1.
Experimental setup: (a) schematic diagram and (b) pictorial view.
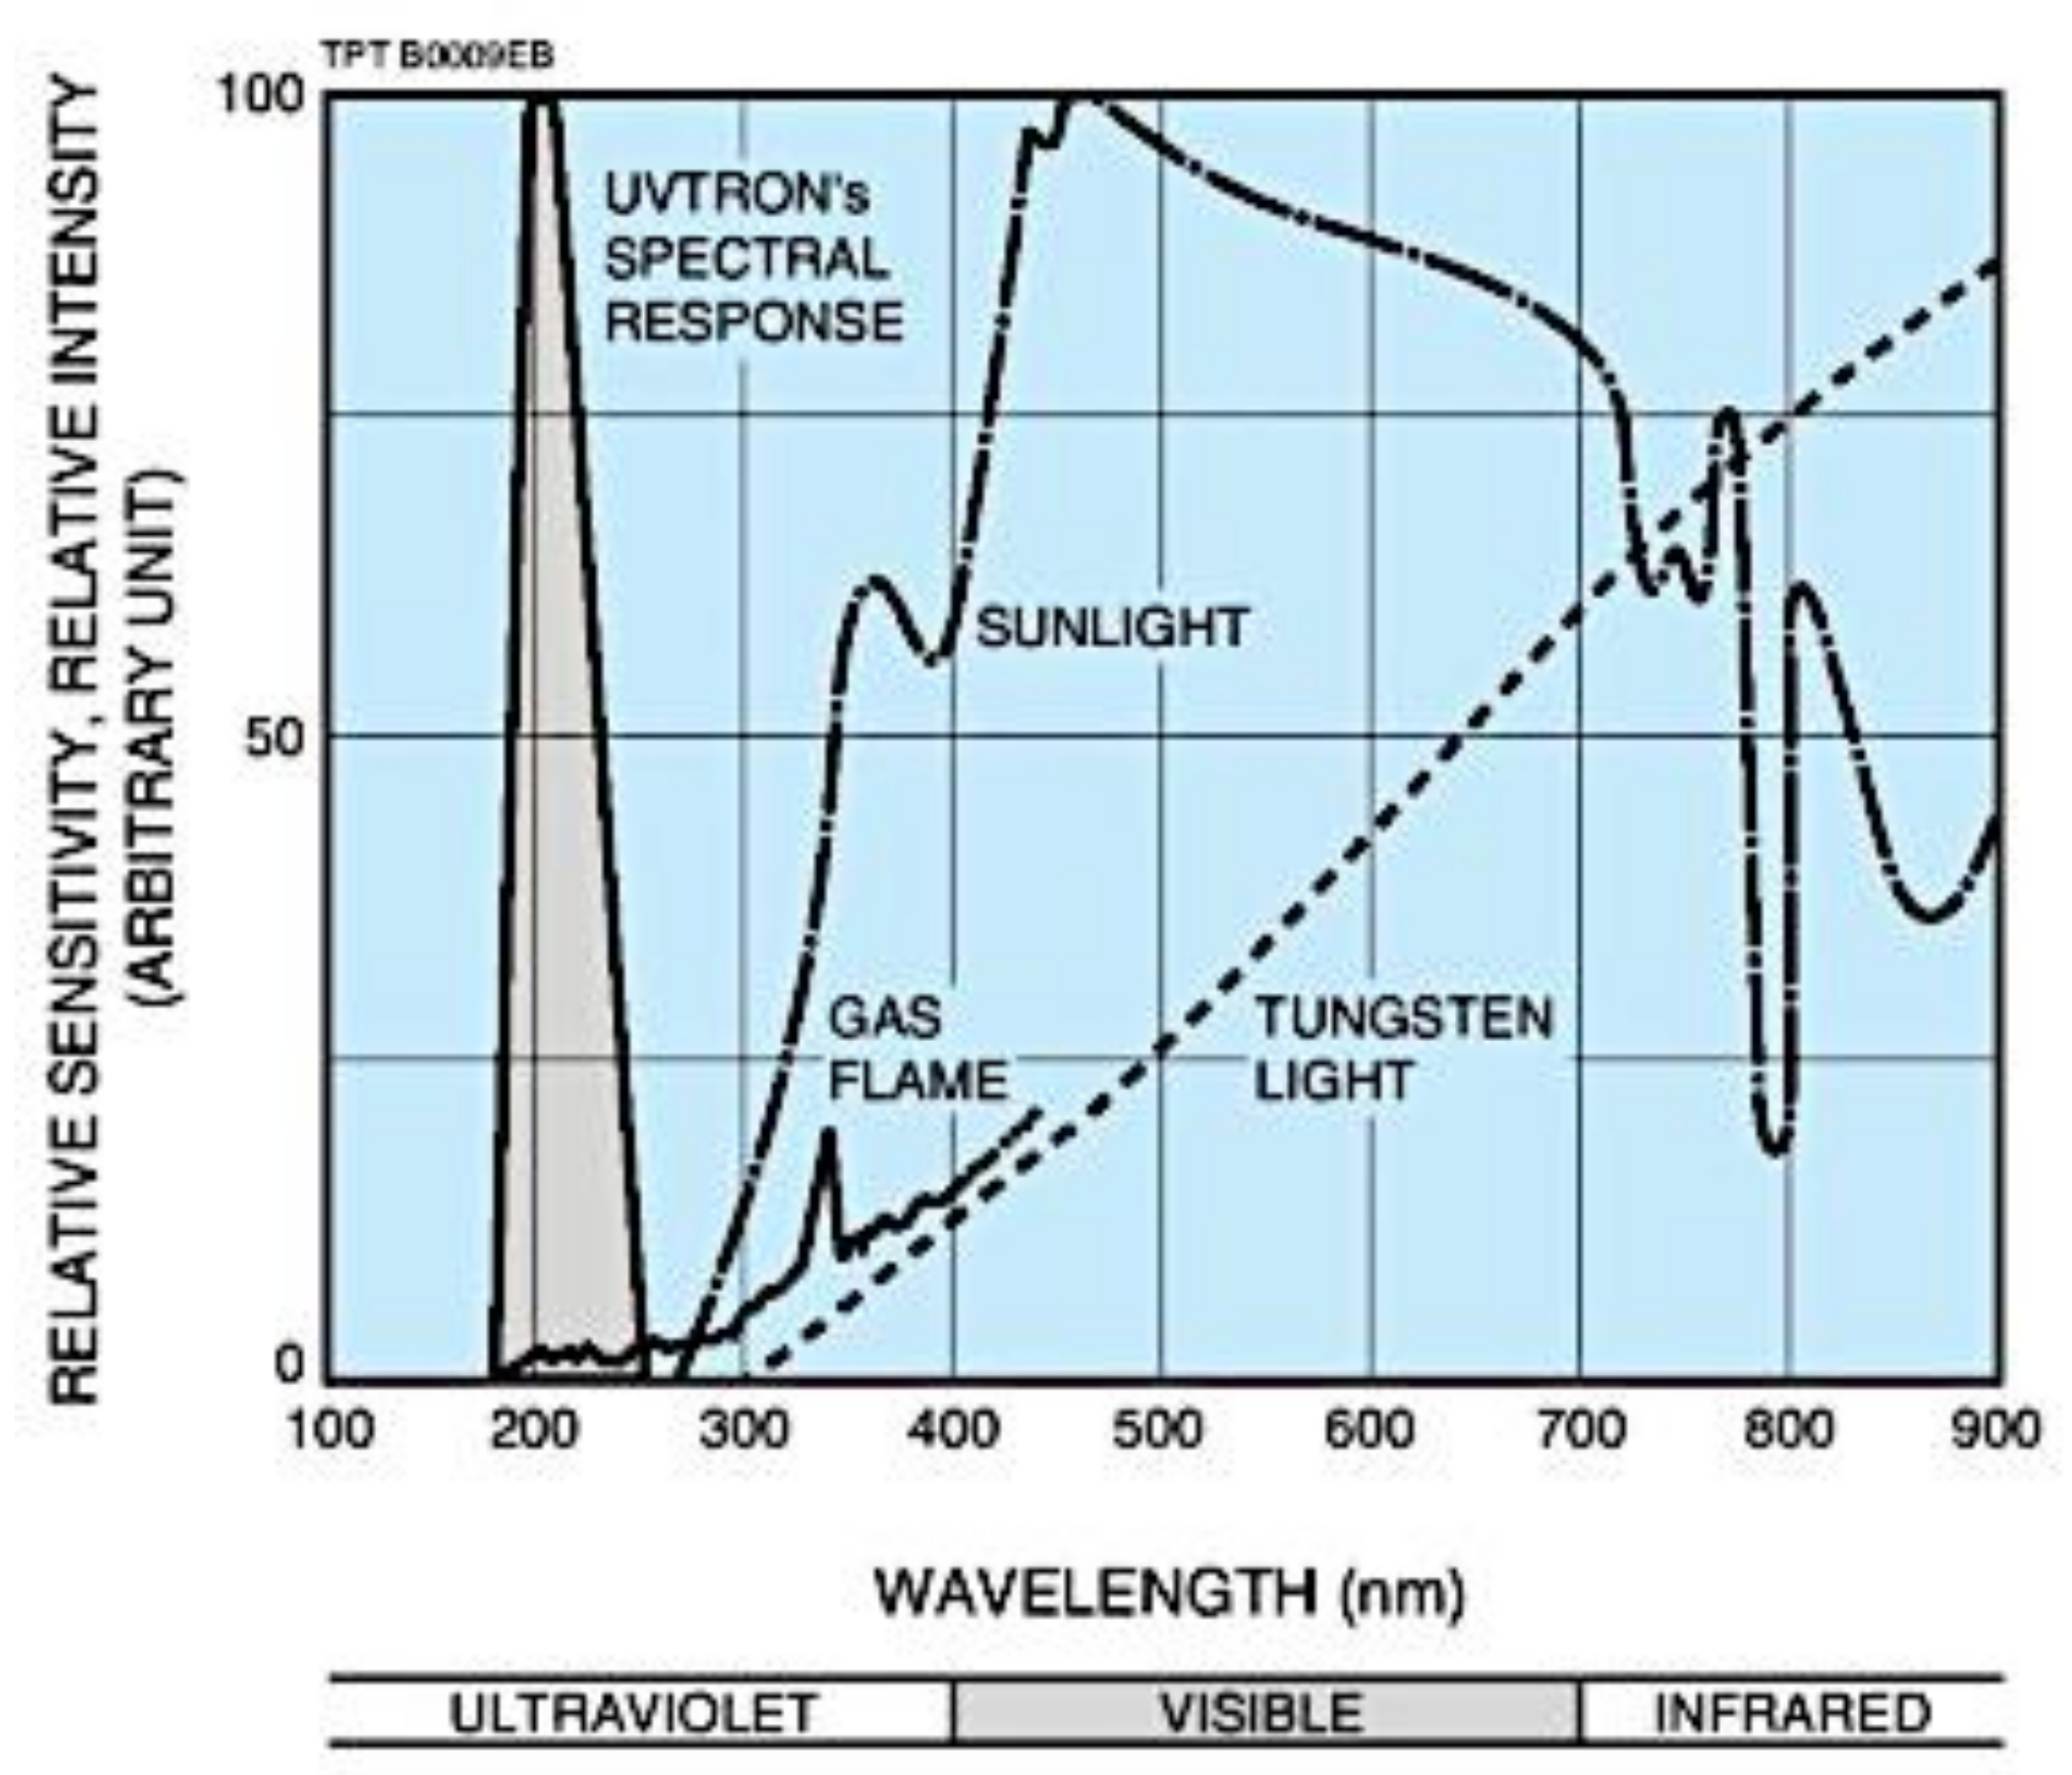
Figure 2.
Response range of the UV sensor [
14].
Figure 2.
Response range of the UV sensor [
14].
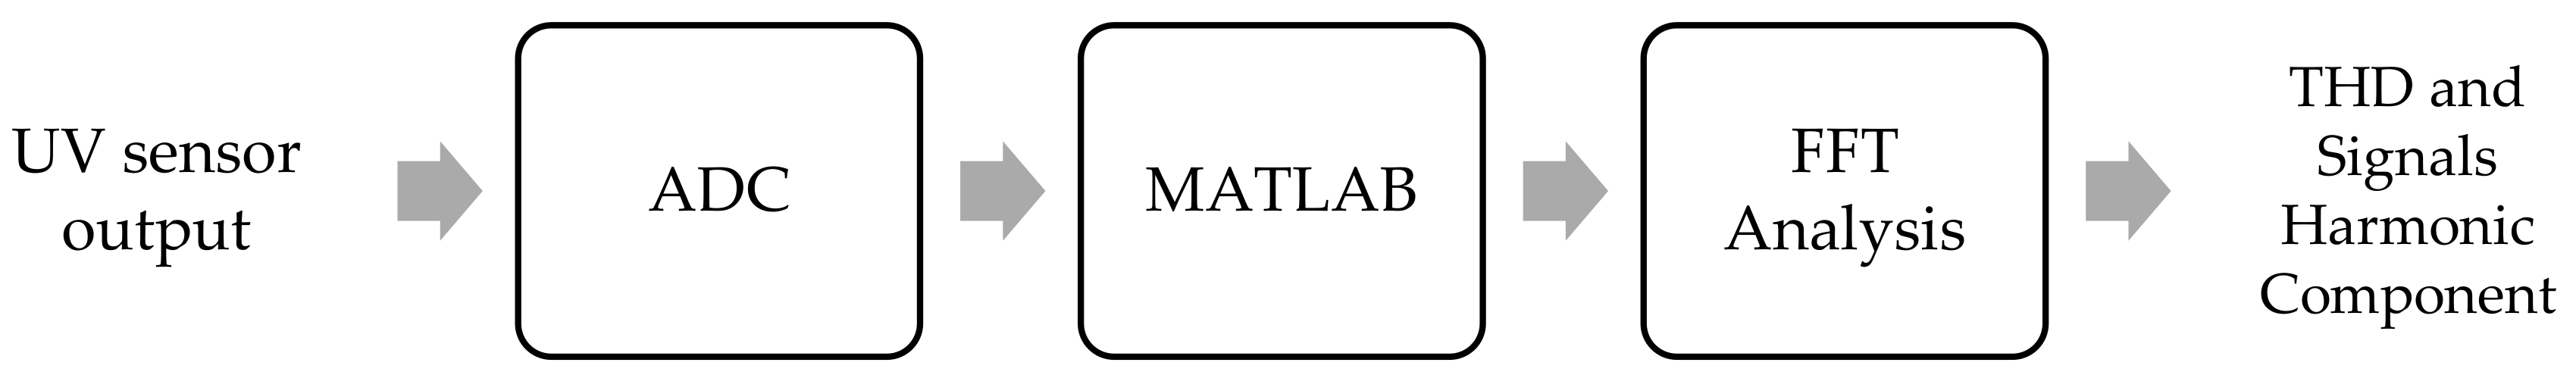
Figure 3.
Schematic diagrams for Fast Fourier Transform (FFT) analysis involving ultra violet (UV) sensor, AC to DC converter (ADC), MATLAB Software, Fast Fourier Transformer (FFT) analysis and lastly the total harmonic distortion (THD) analysis.
Figure 3.
Schematic diagrams for Fast Fourier Transform (FFT) analysis involving ultra violet (UV) sensor, AC to DC converter (ADC), MATLAB Software, Fast Fourier Transformer (FFT) analysis and lastly the total harmonic distortion (THD) analysis.
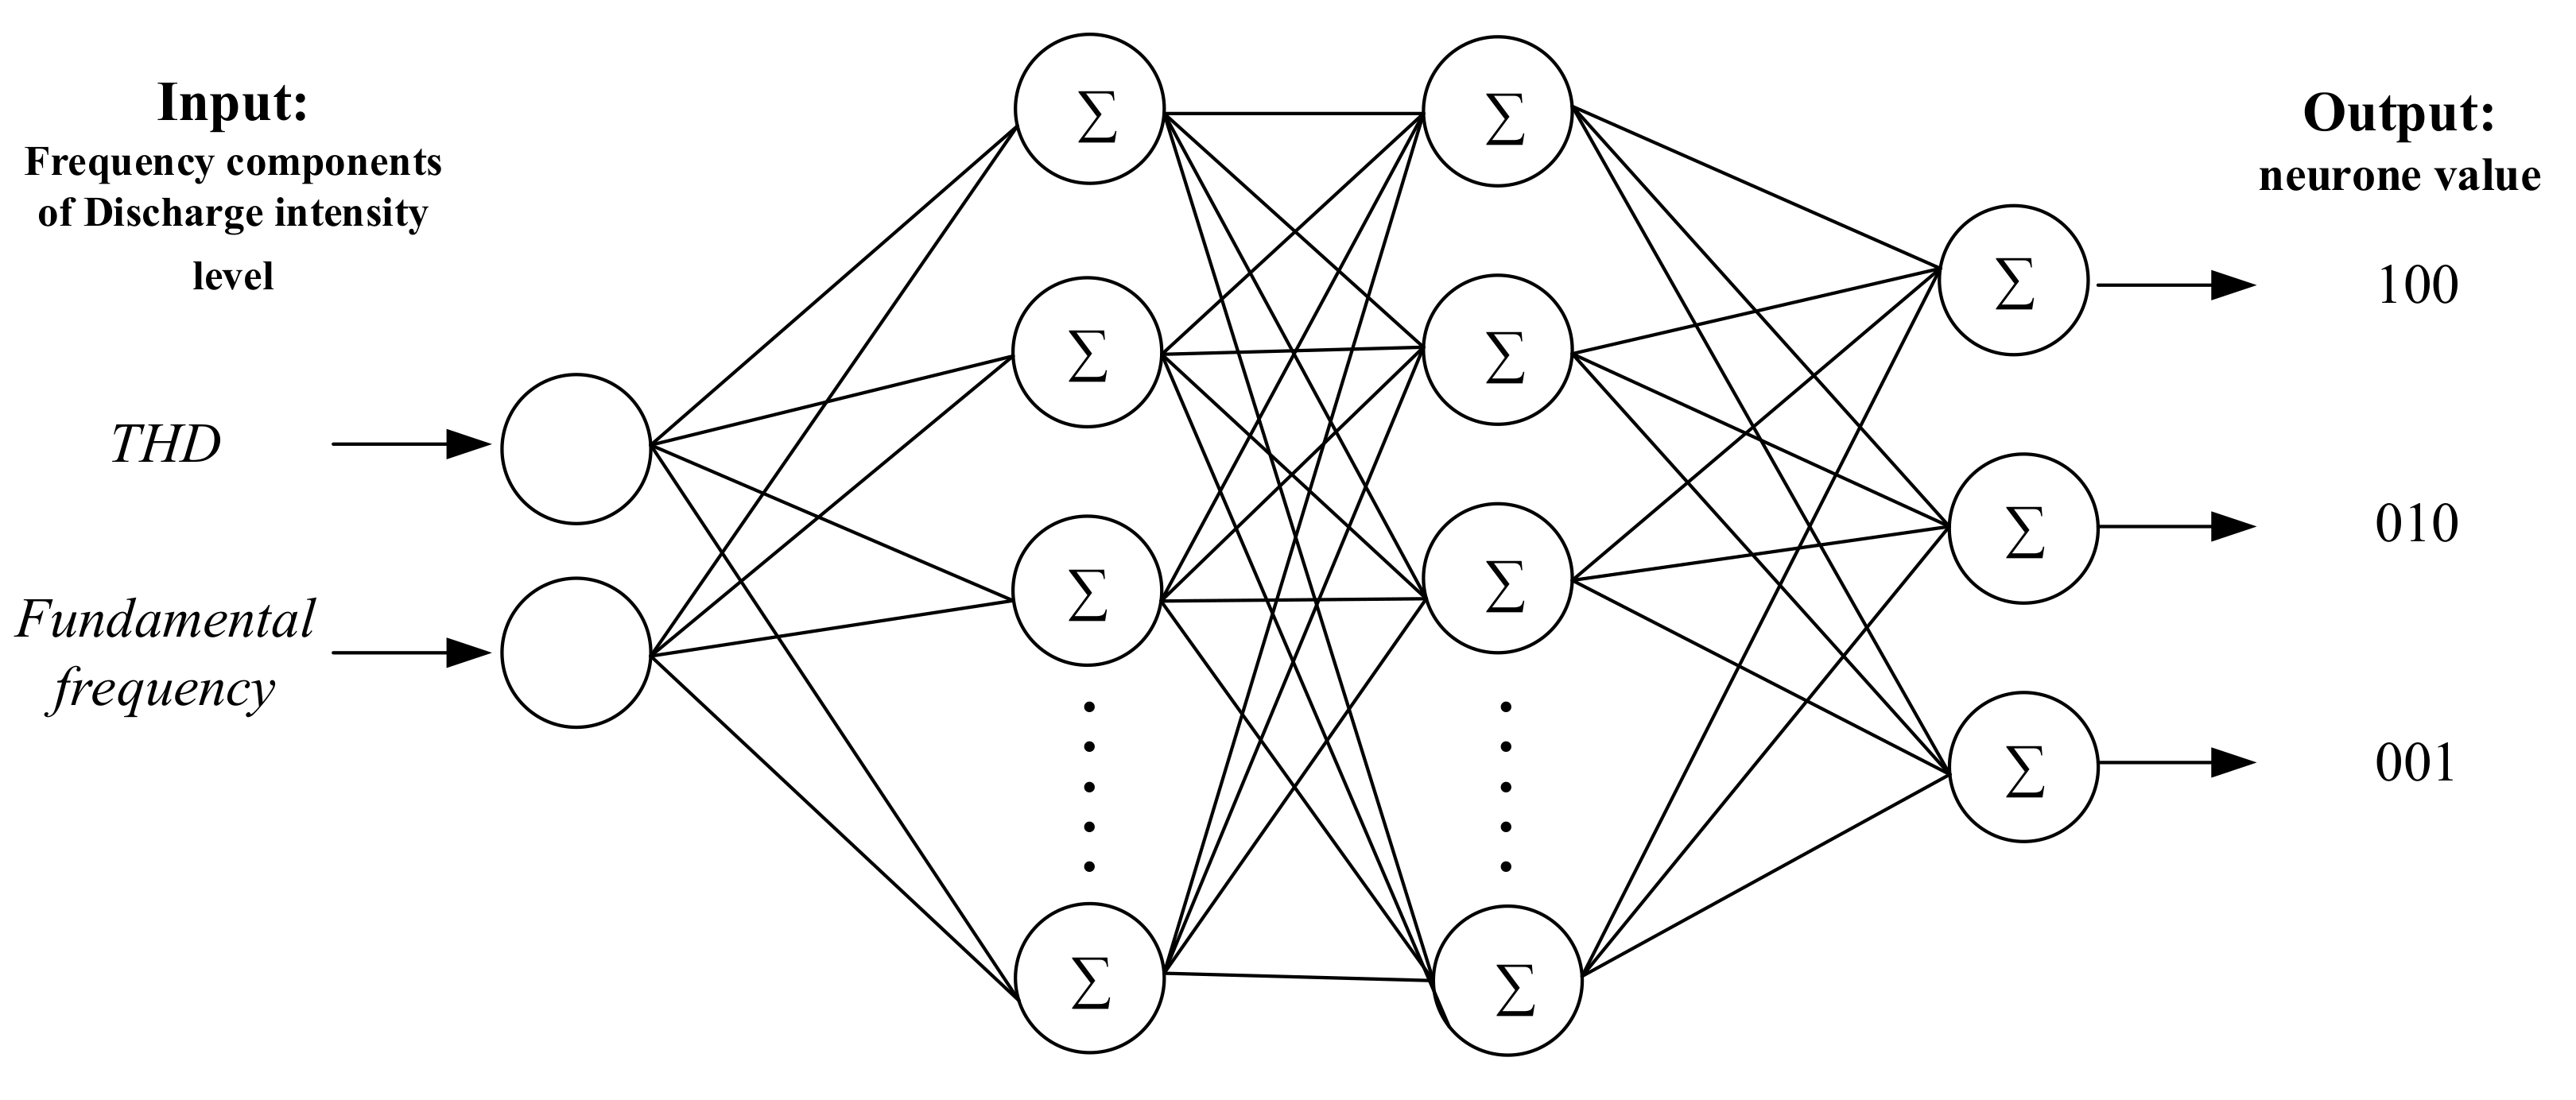
Figure 4.
Process of patern recognition using ANN.
Figure 4.
Process of patern recognition using ANN.
Figure 5.
ANN architecture.
Figure 5.
ANN architecture.
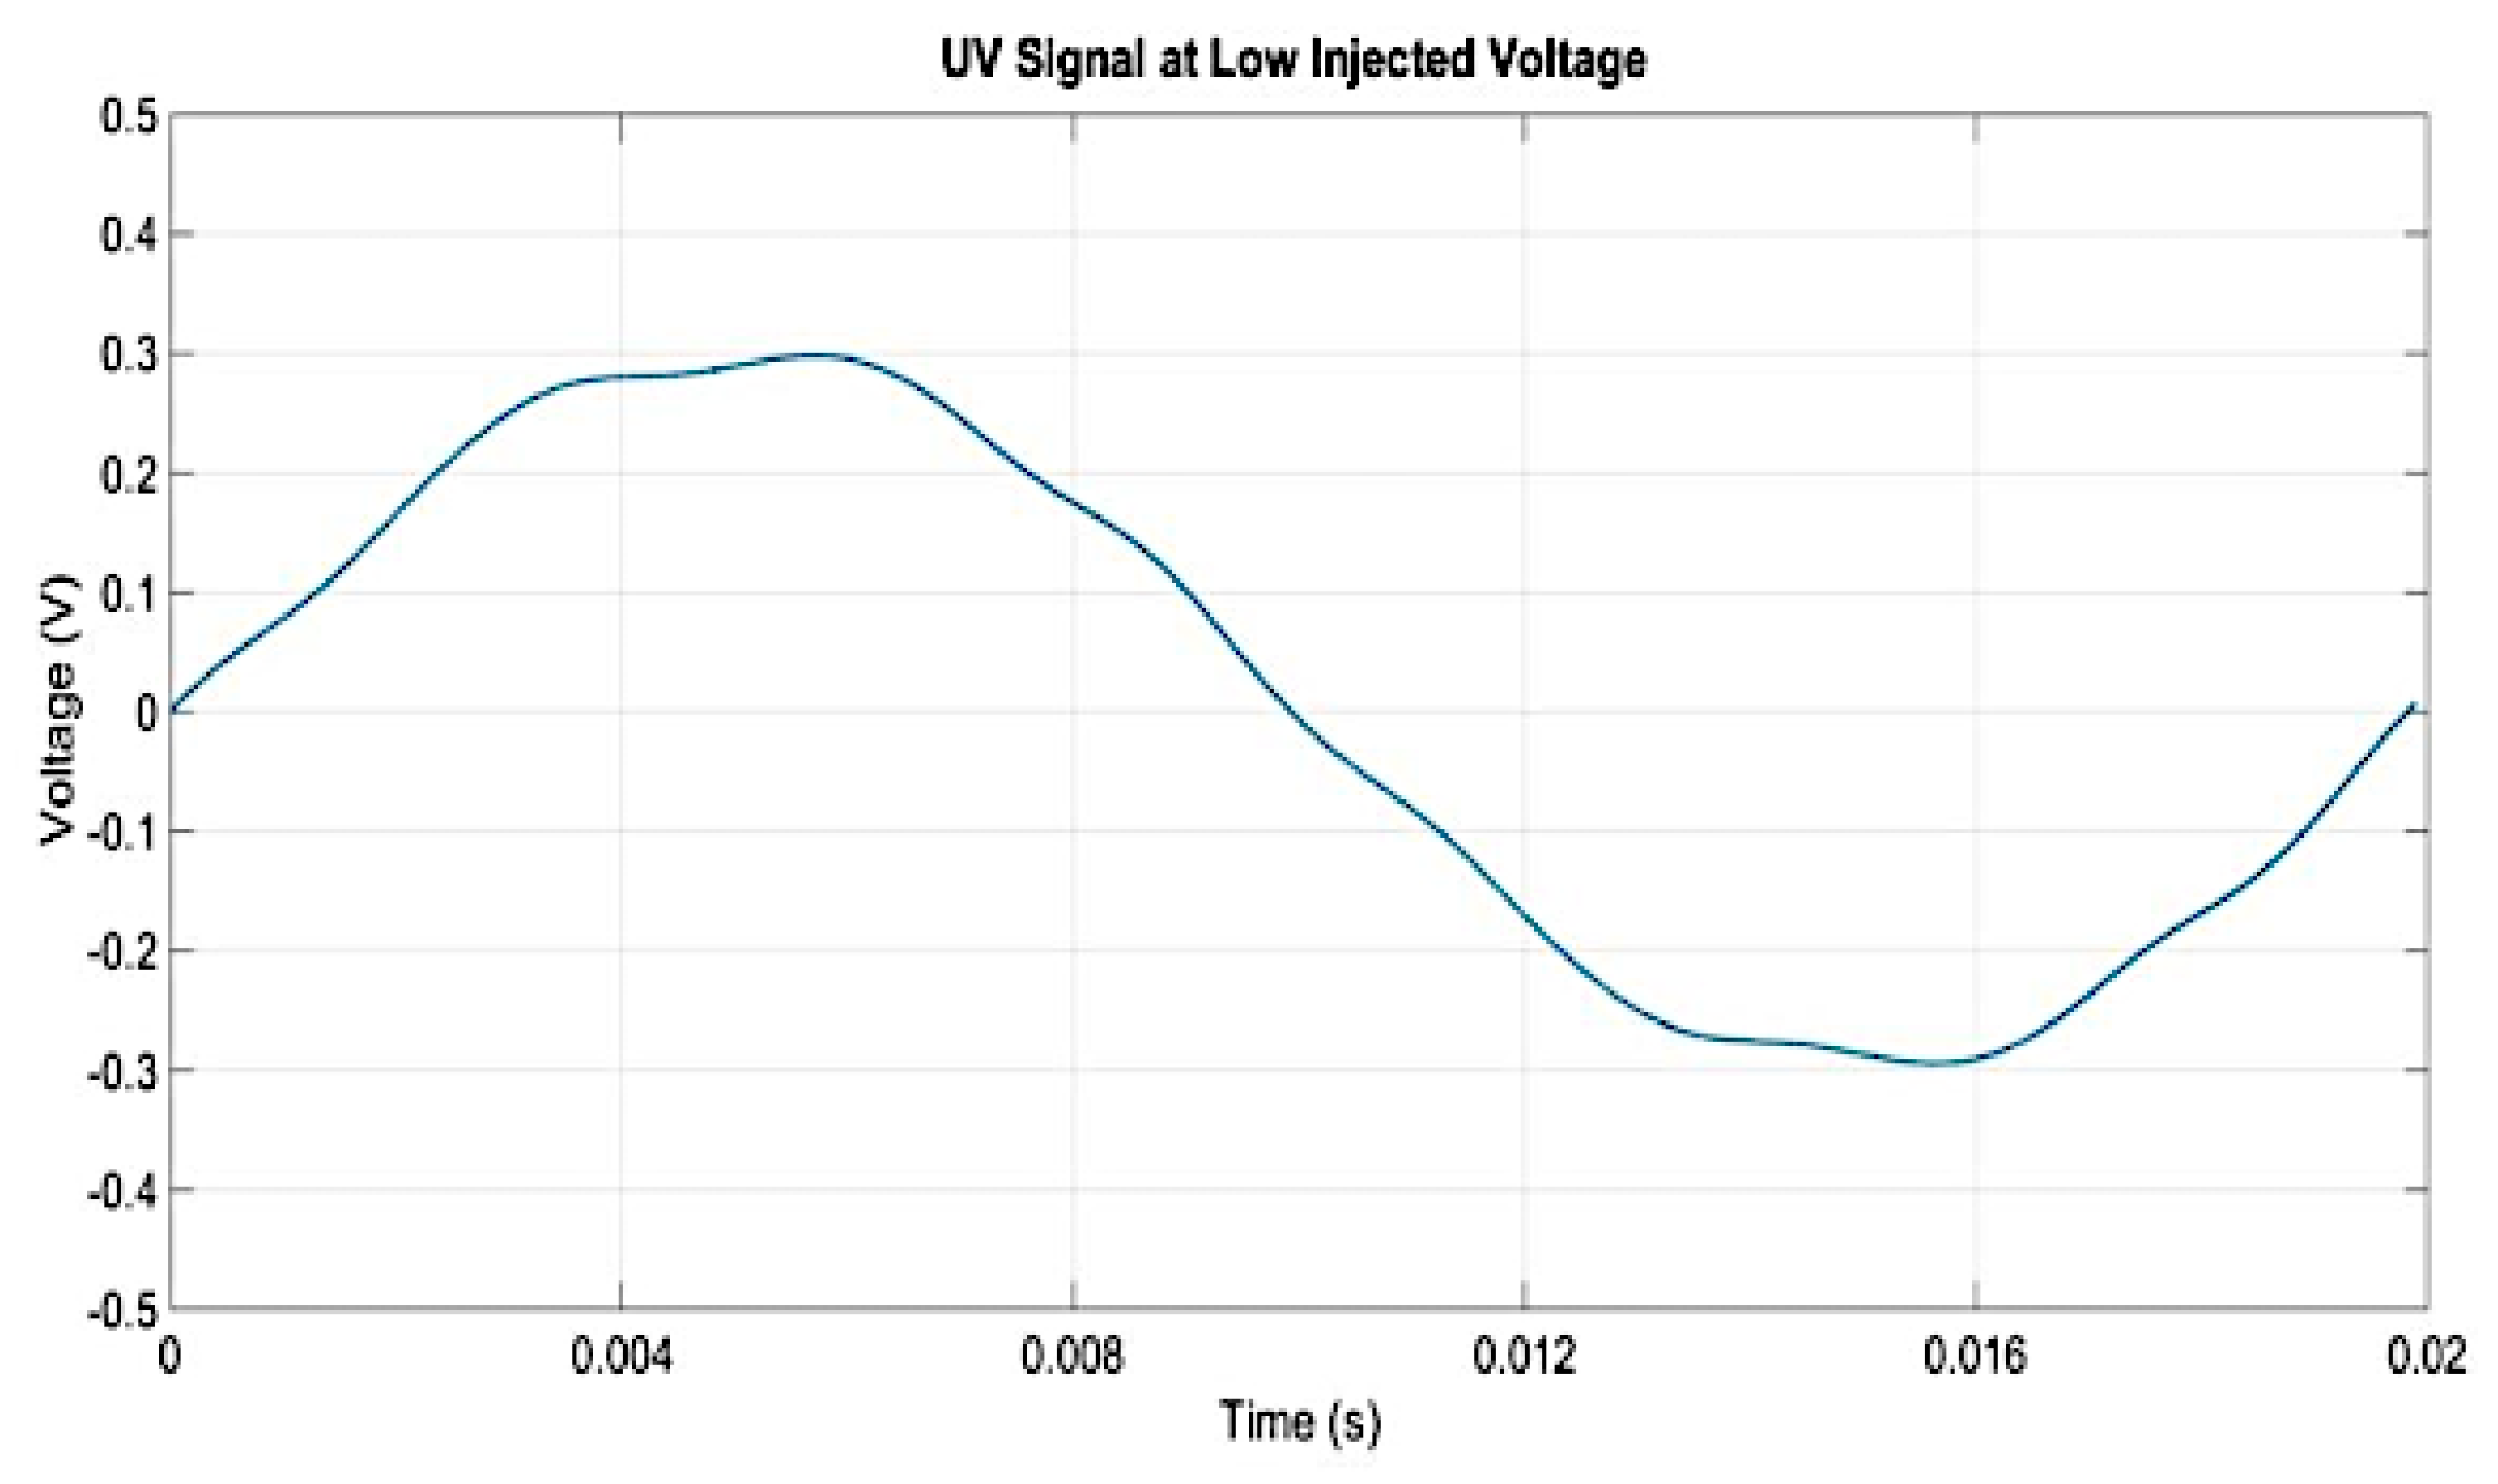
Figure 6.
Signals detected at low injected voltage.
Figure 6.
Signals detected at low injected voltage.
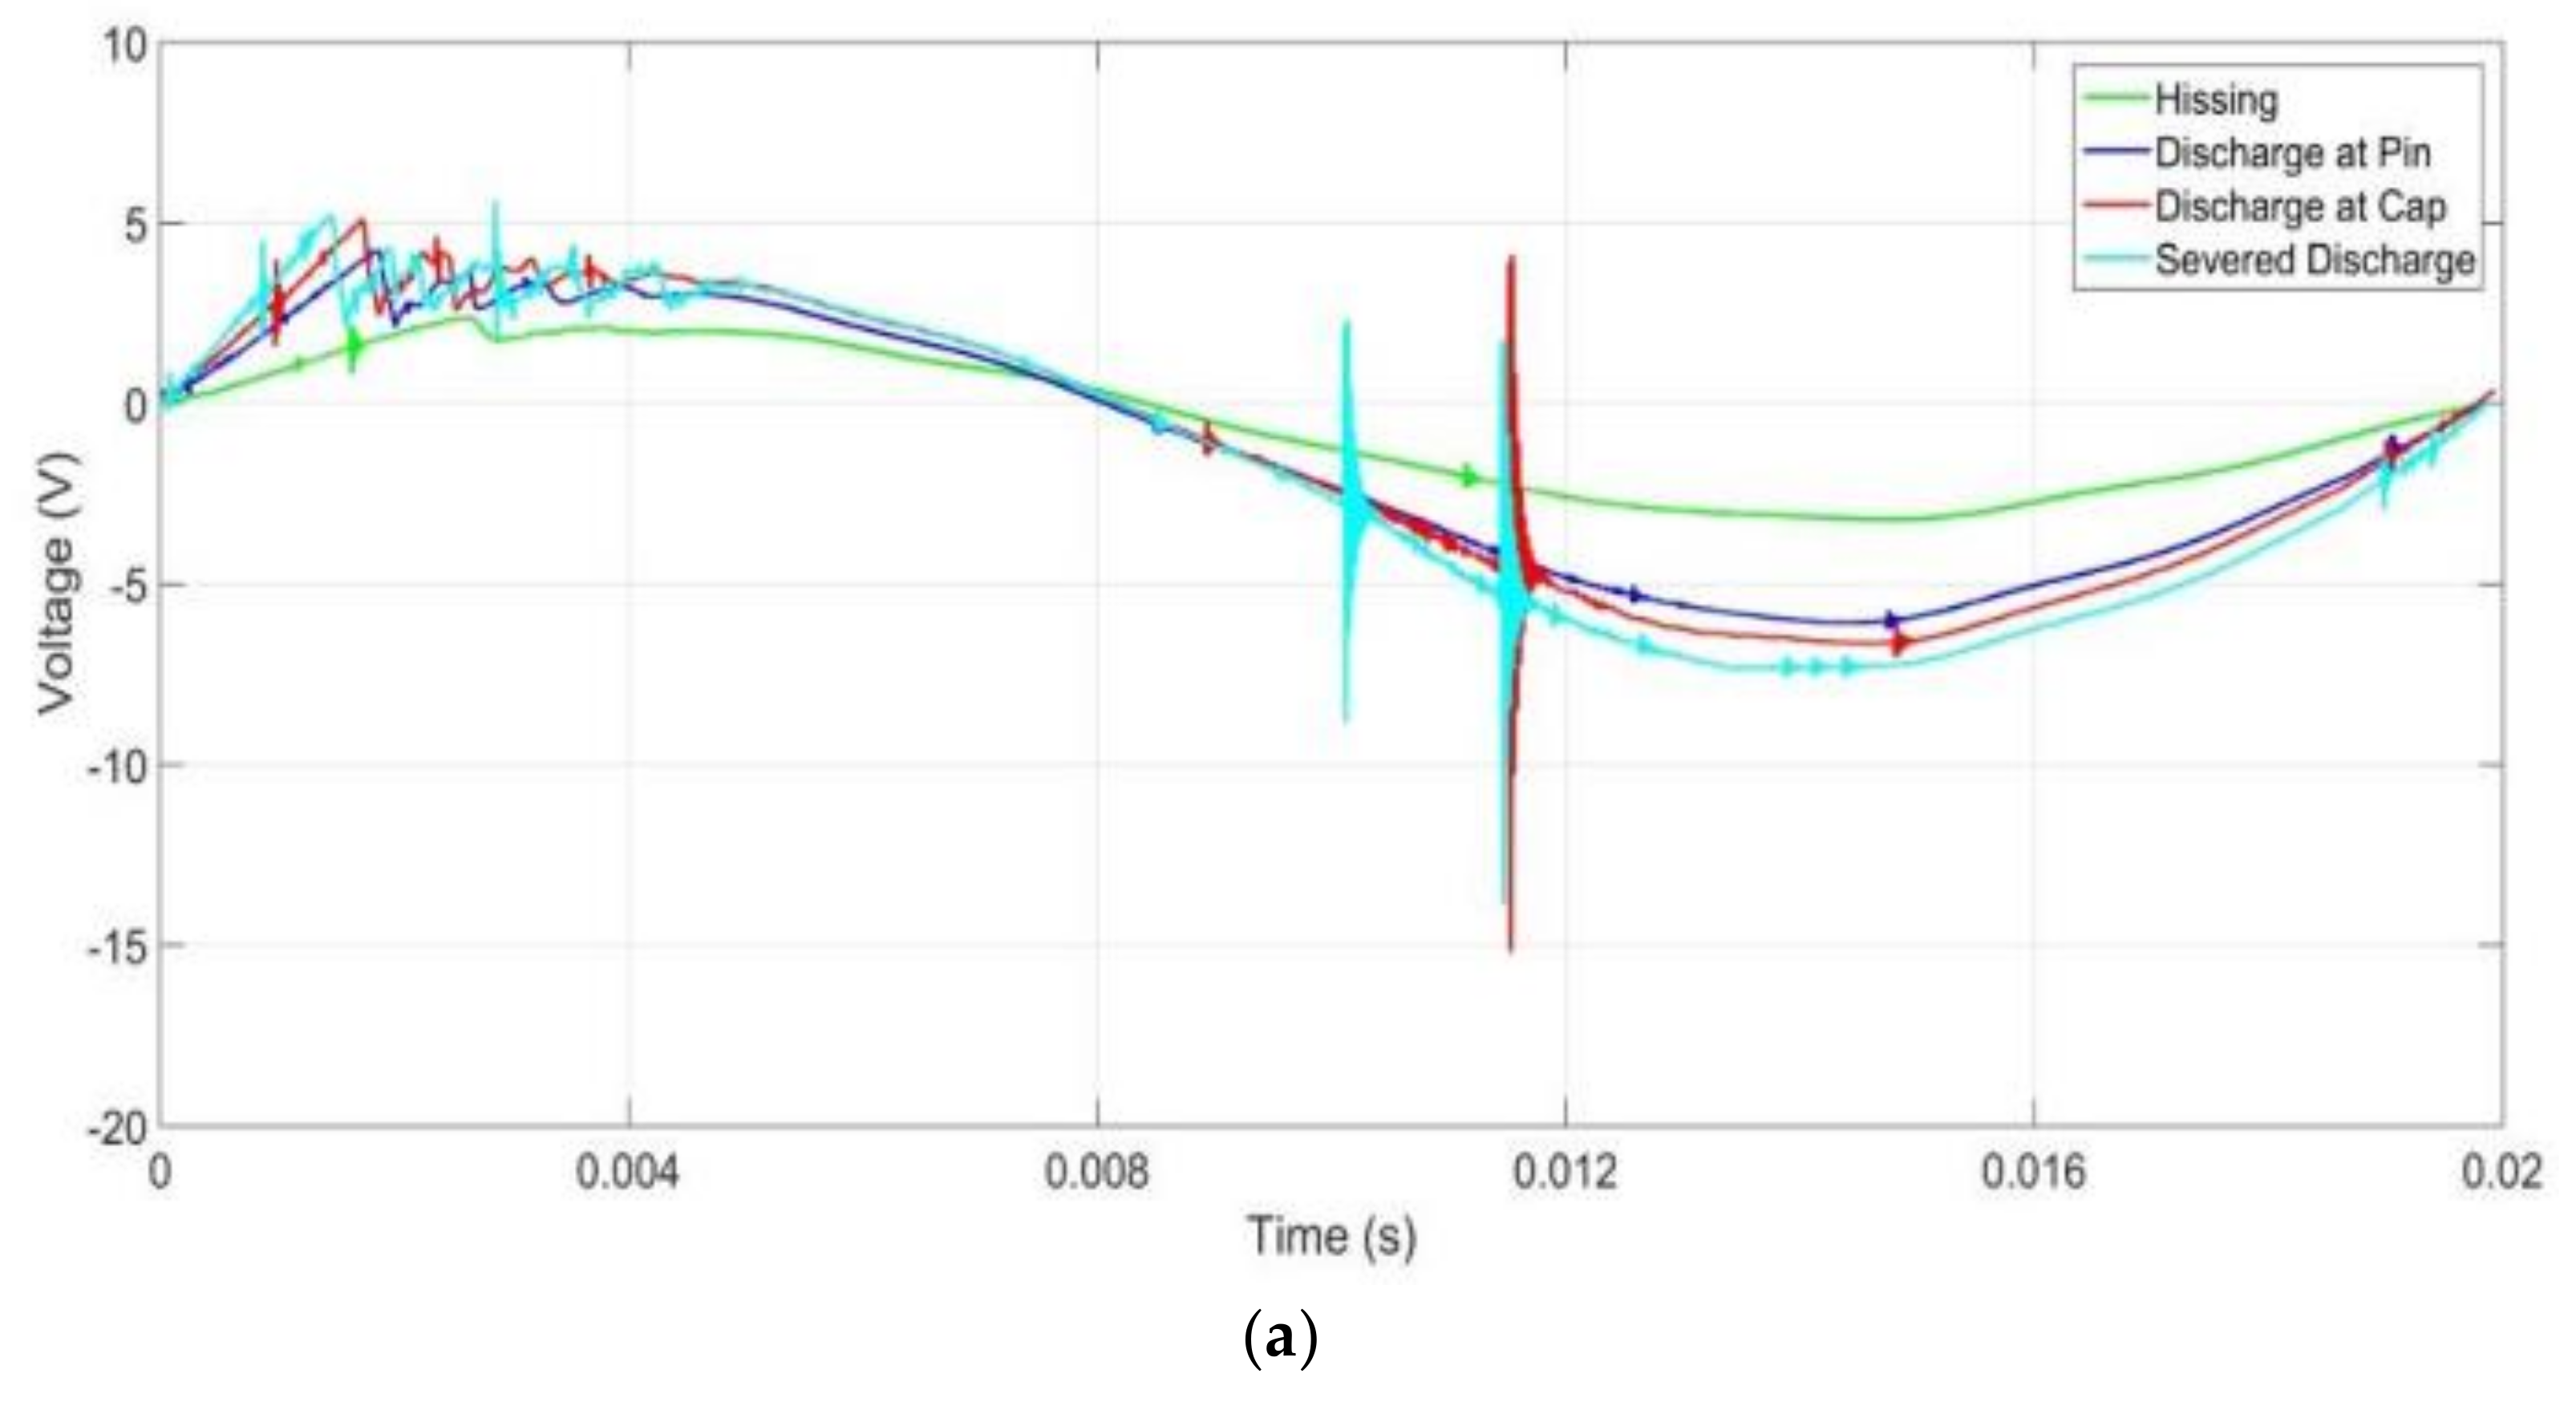
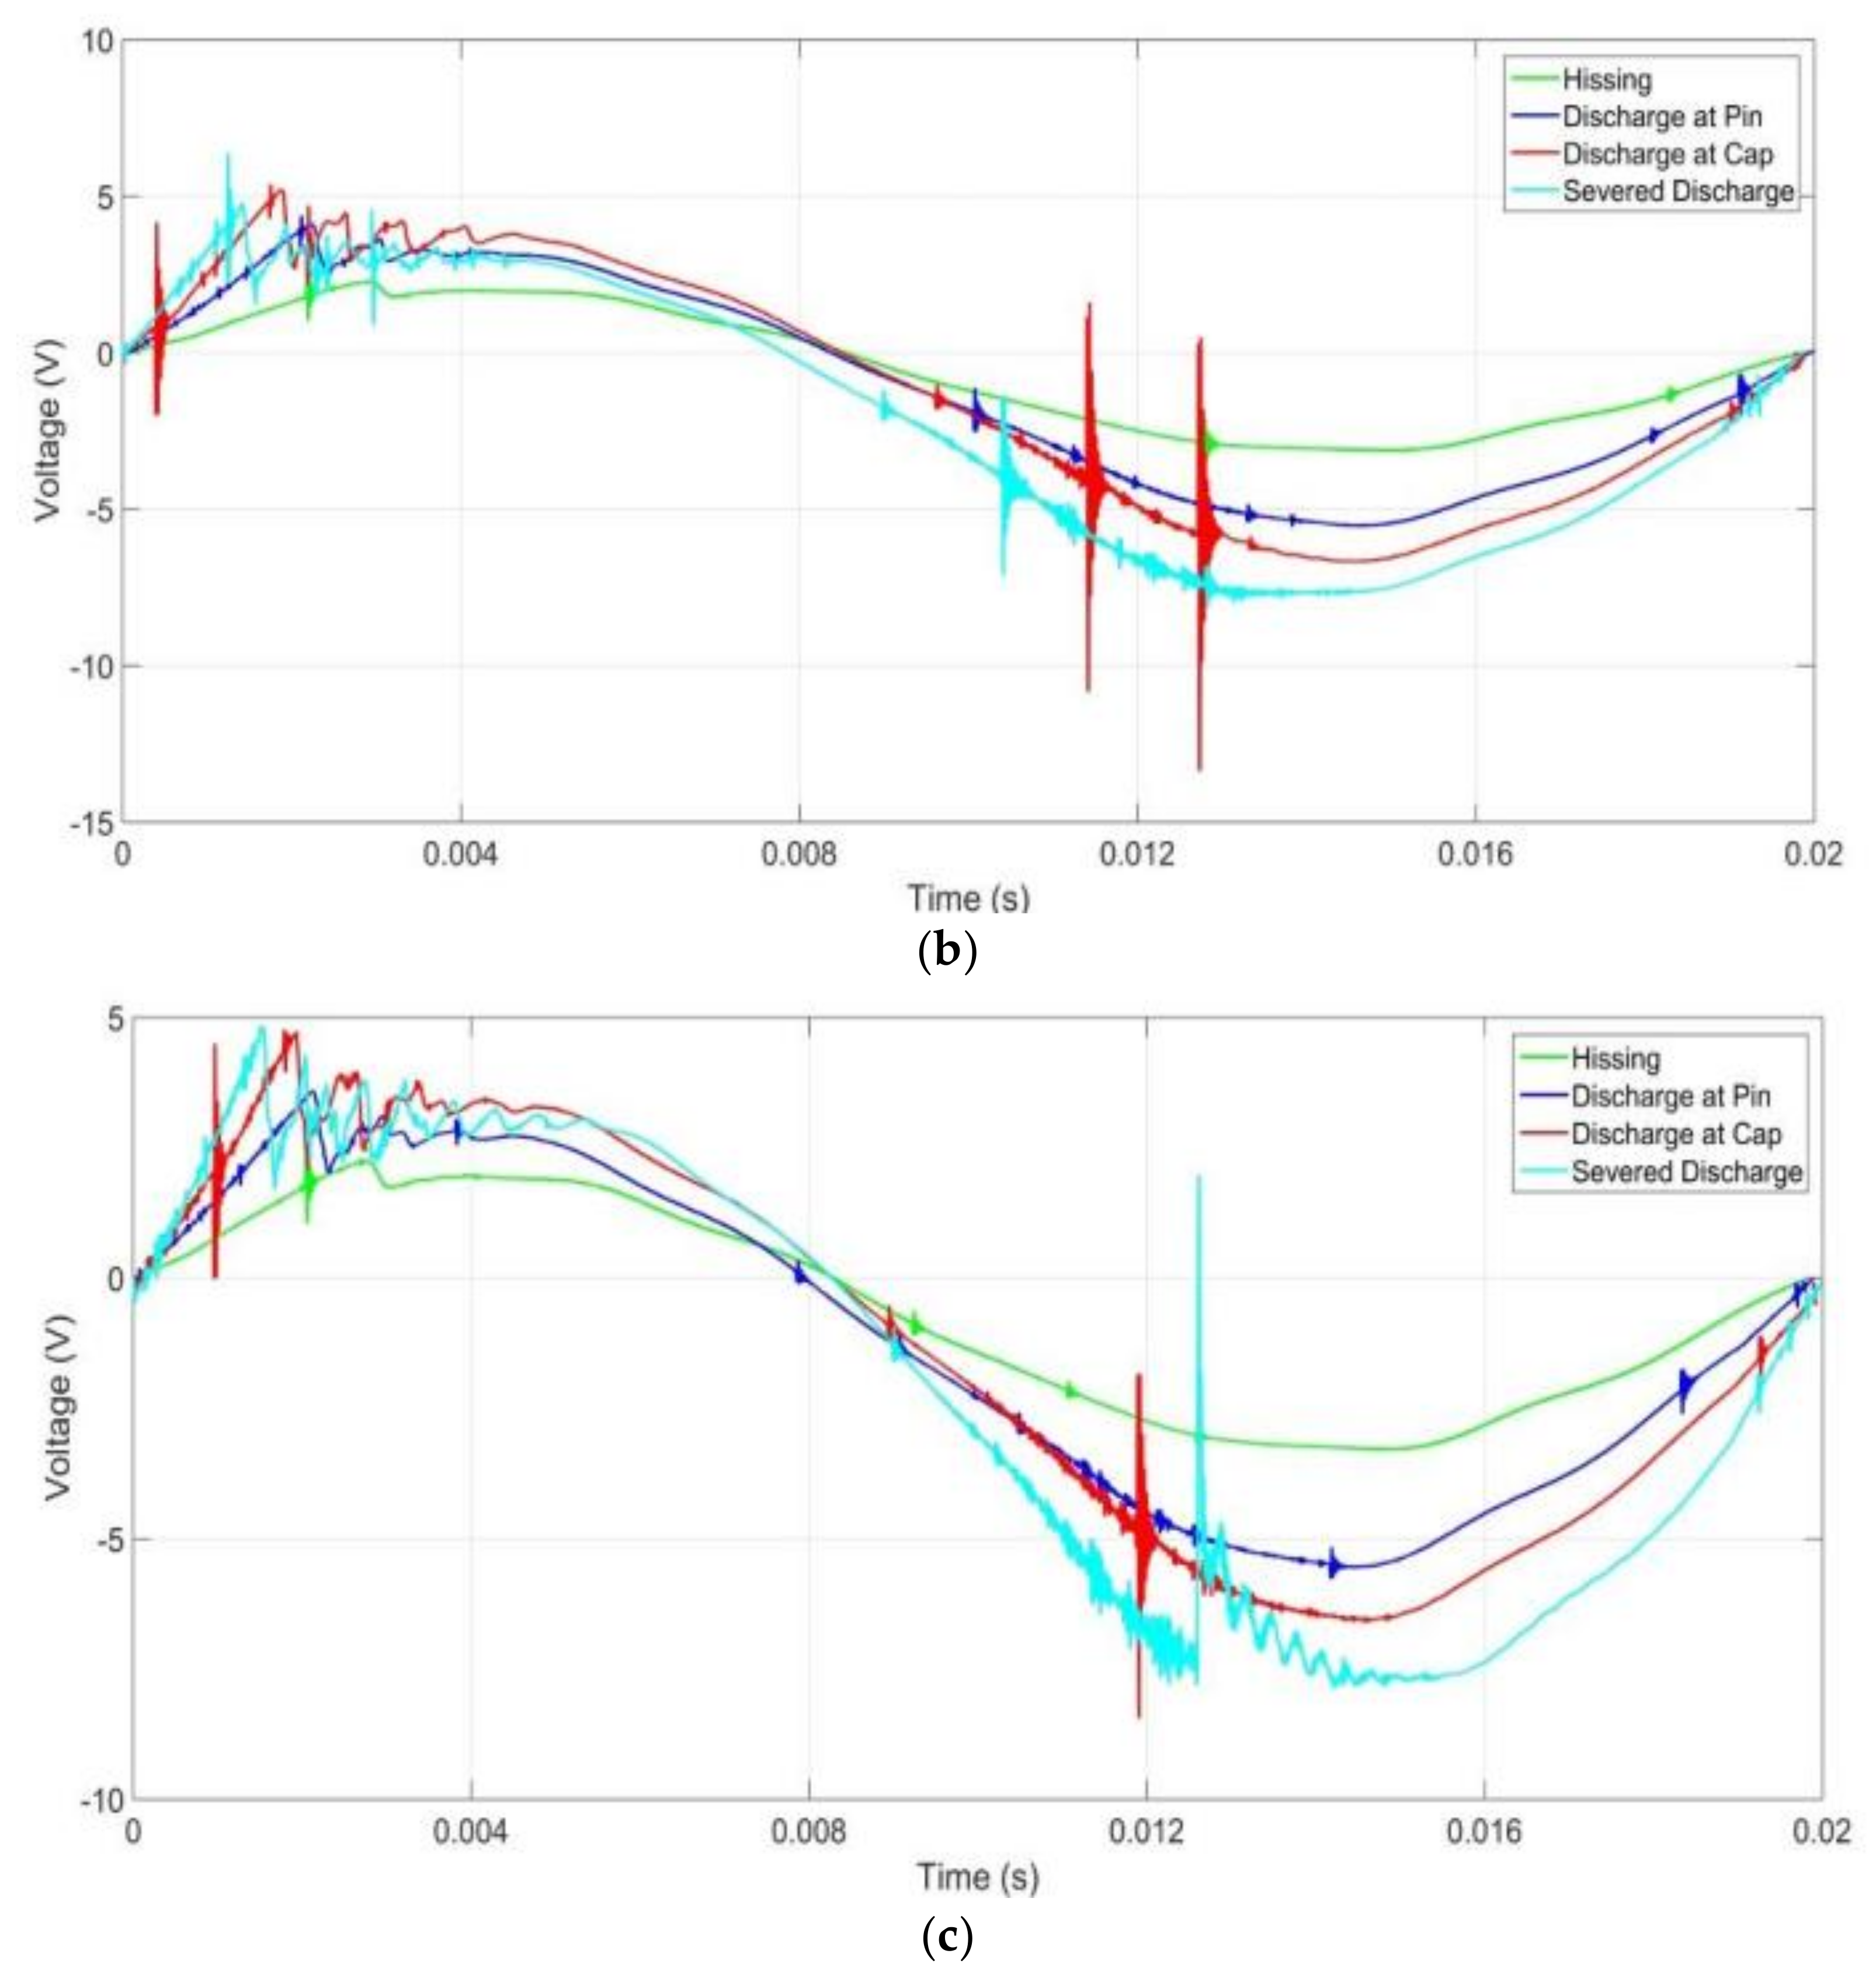
Figure 7.
UV signals for insulator samples with dry surface conditions and without contaminations: (a) Group A; (b) Group B; (c) Group C.
Figure 7.
UV signals for insulator samples with dry surface conditions and without contaminations: (a) Group A; (b) Group B; (c) Group C.
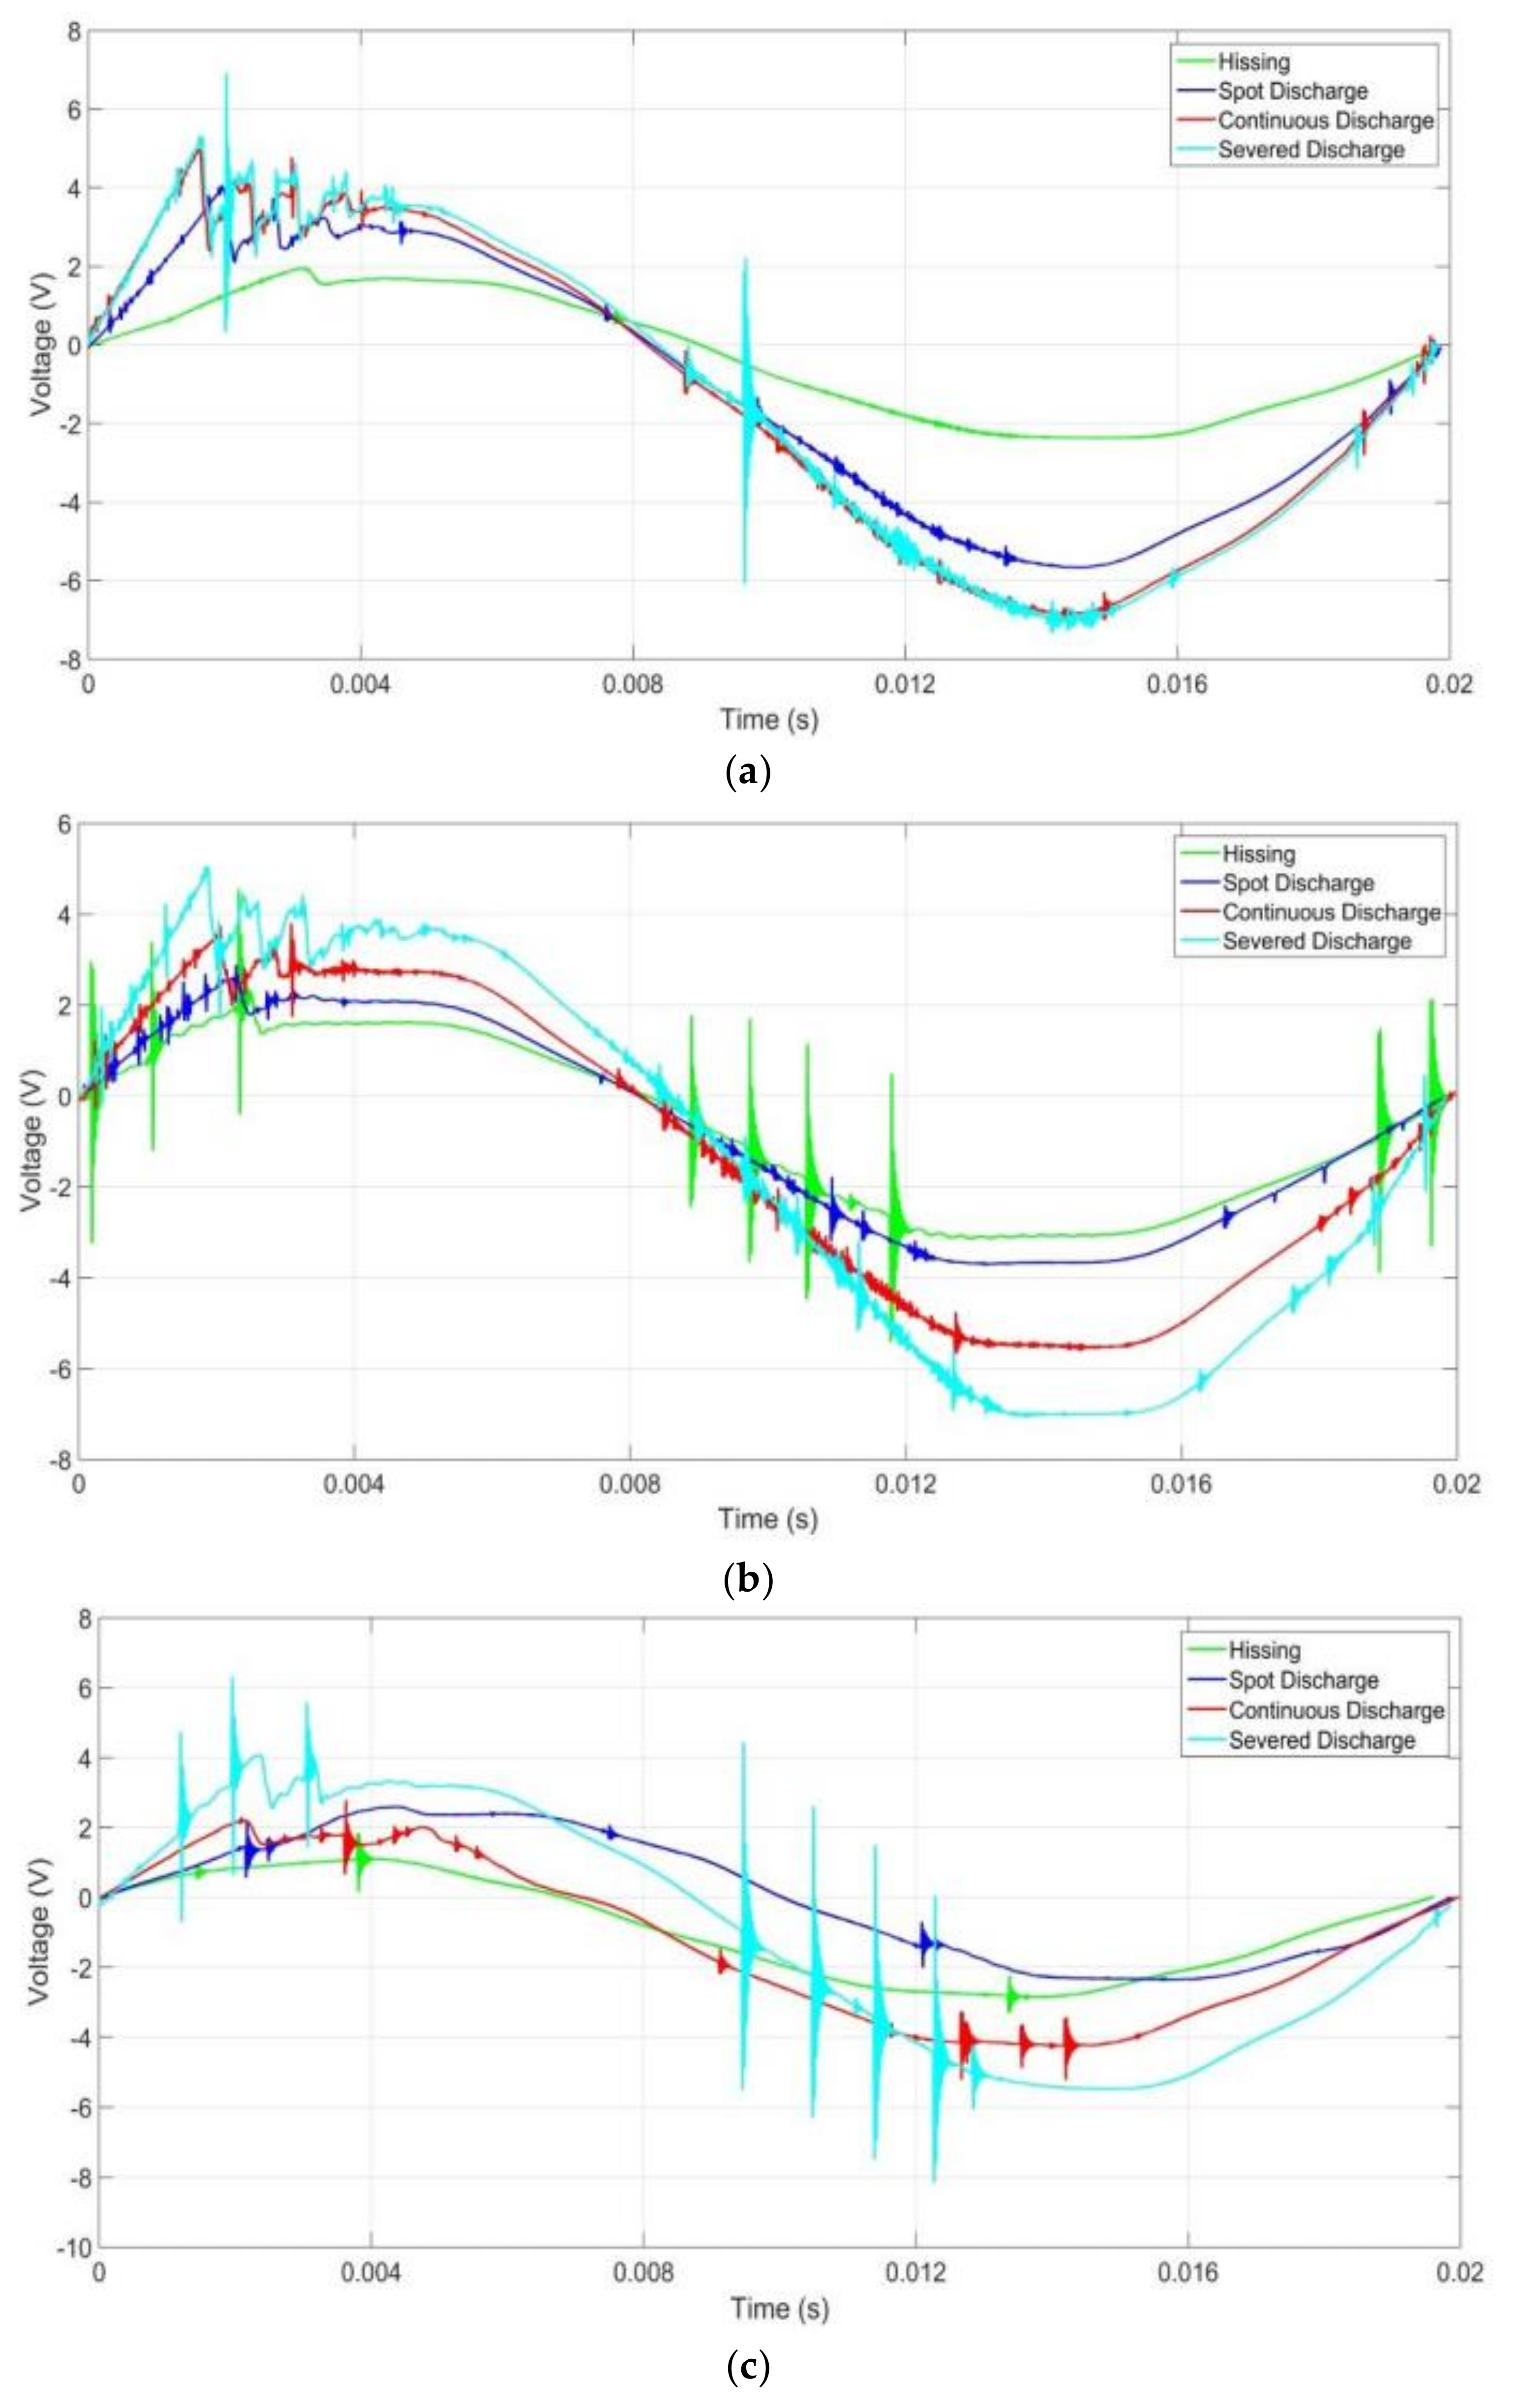
Figure 8.
UV signals for insulator samples with wet insulator conditions without contamination: (a) Group A; (b) Group B; (c) Group C.
Figure 8.
UV signals for insulator samples with wet insulator conditions without contamination: (a) Group A; (b) Group B; (c) Group C.
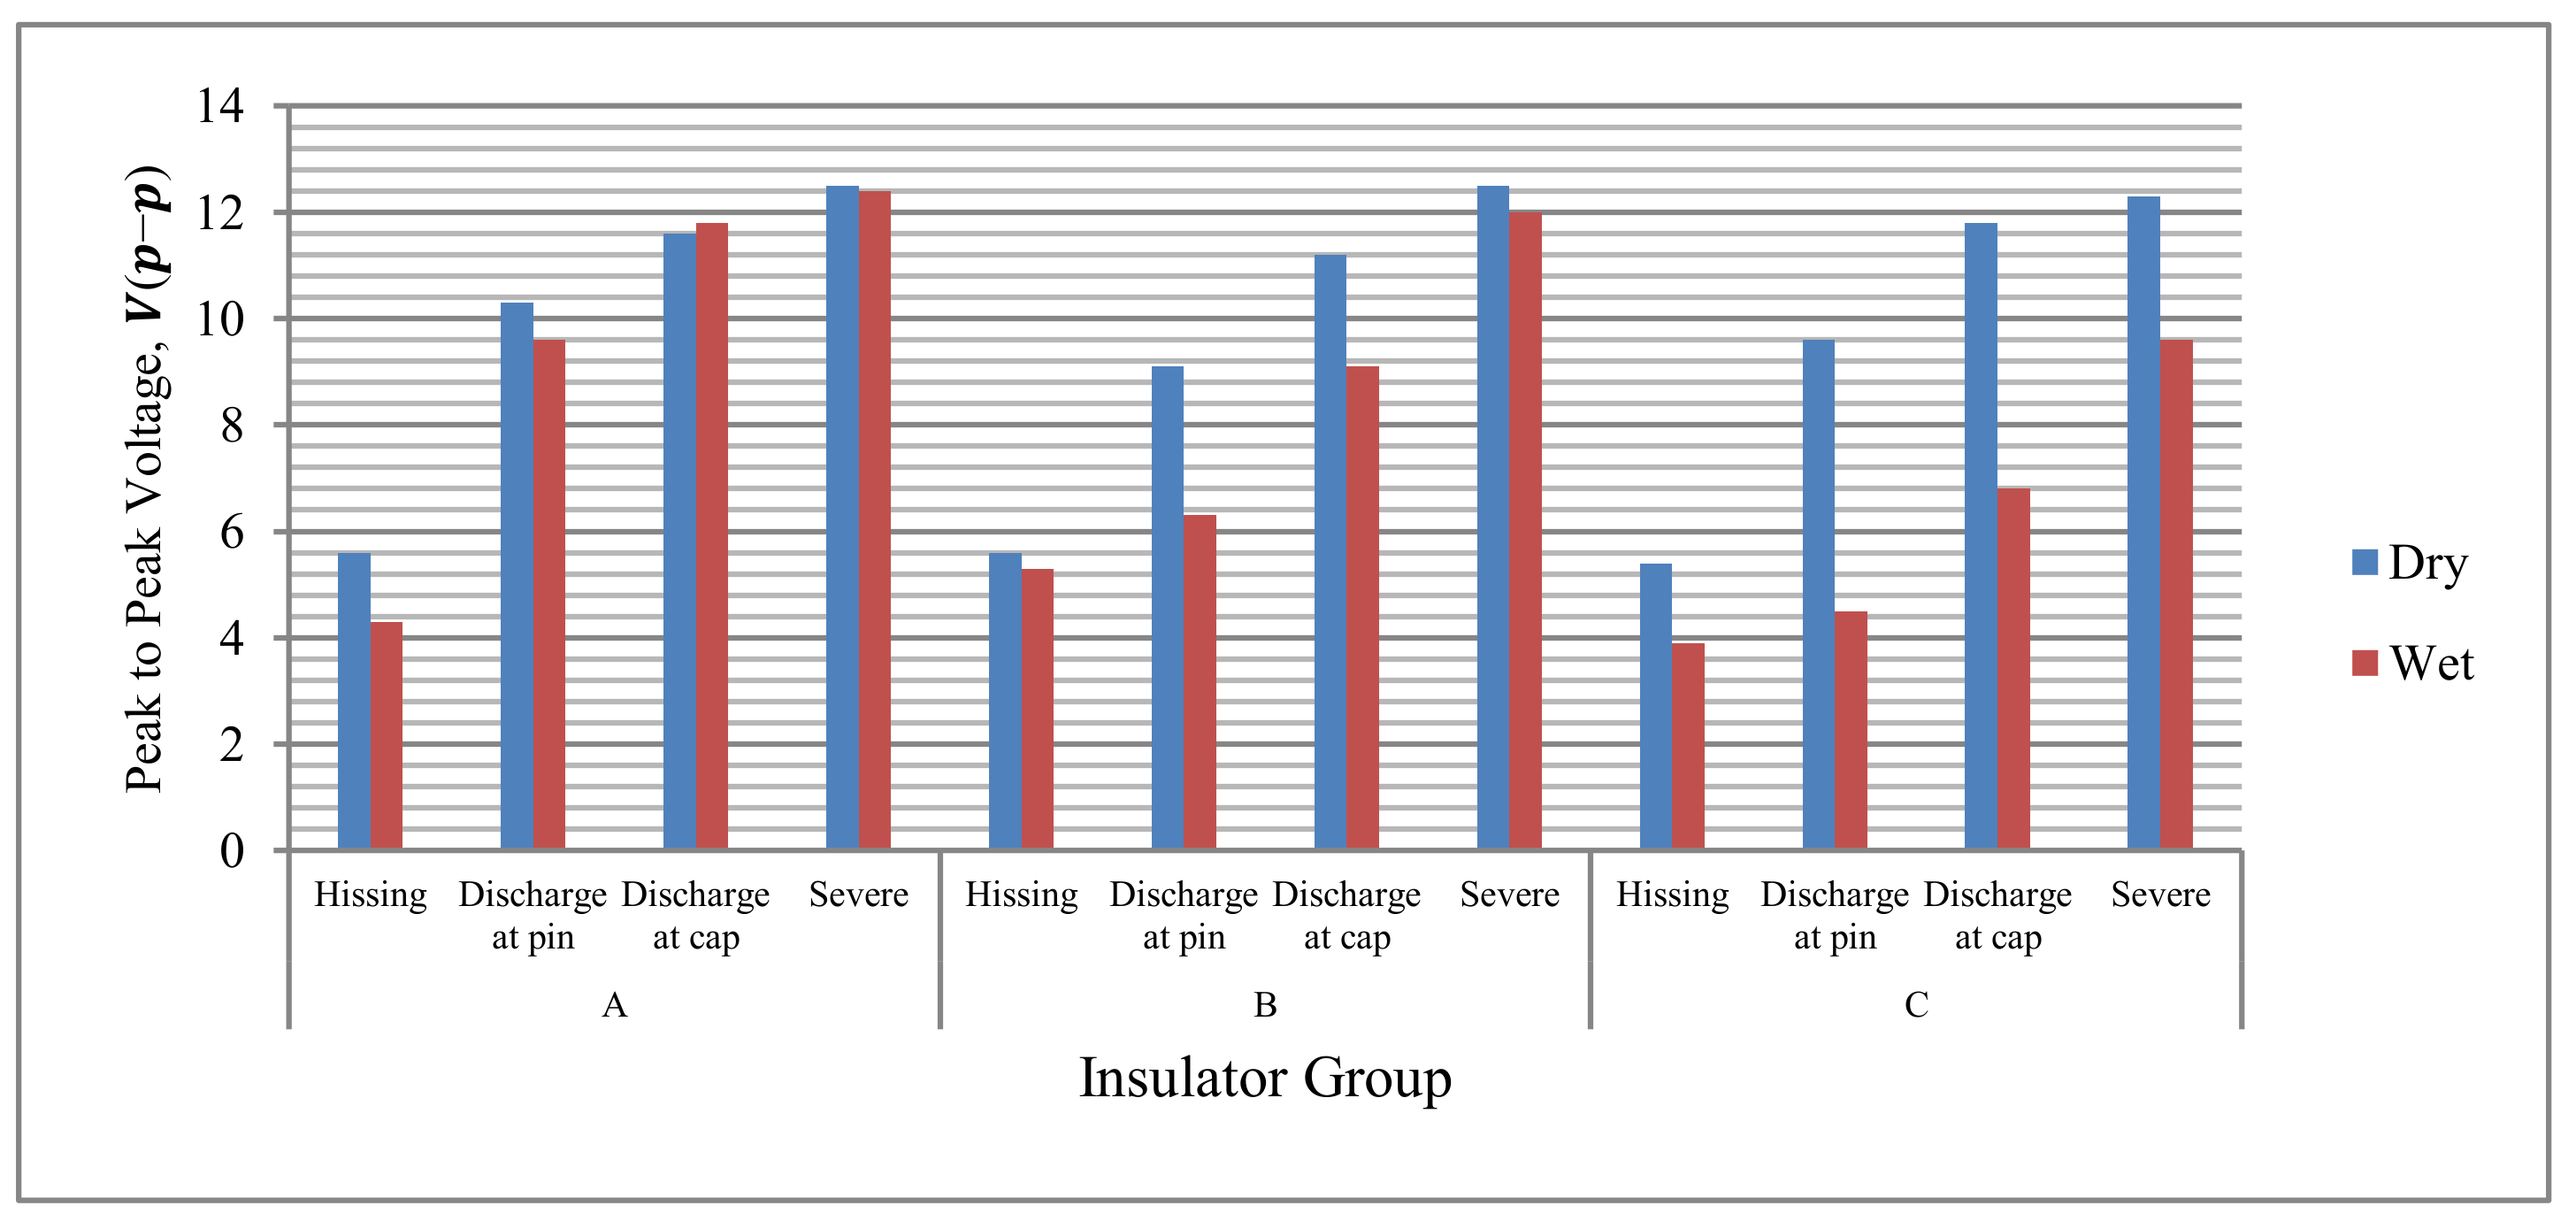
Figure 9.
Peak-to-peak voltage for dry and wet conditions without contamination.
Figure 9.
Peak-to-peak voltage for dry and wet conditions without contamination.
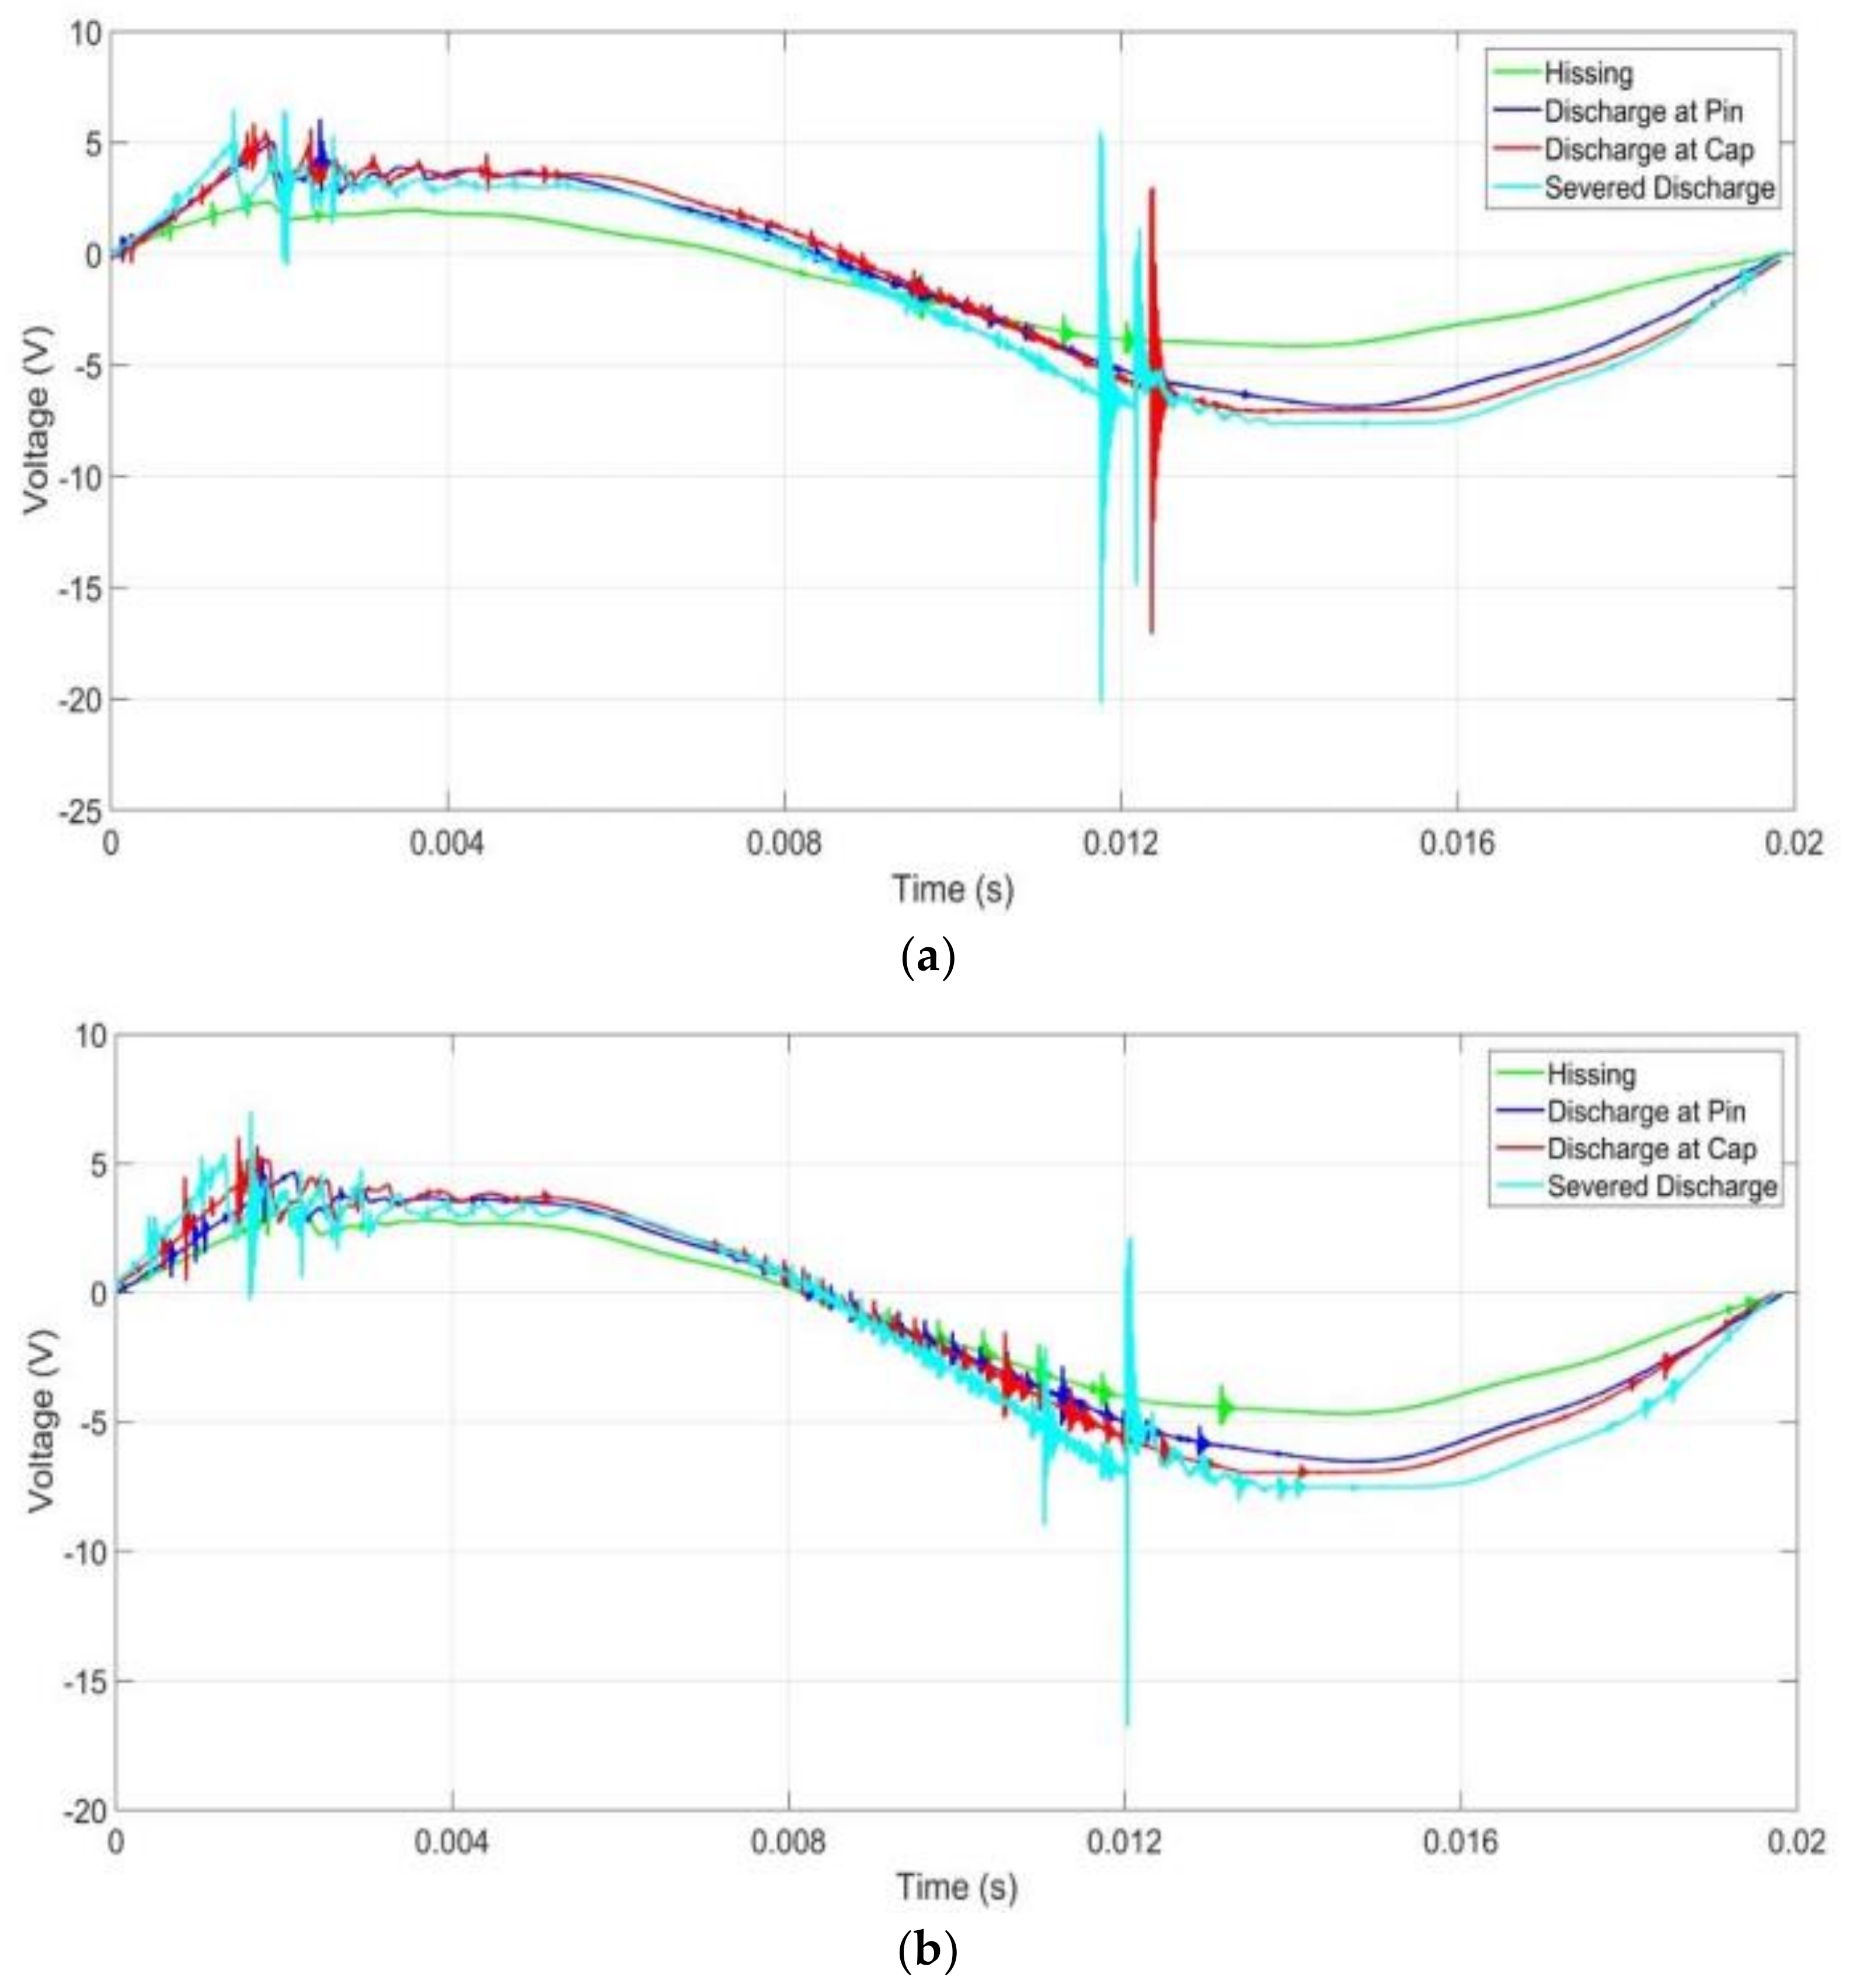
Figure 10.
UV signals for insulator samples under dry conditions with light contamination level: (a) Group A; (b) Group B; (c) Group C.
Figure 10.
UV signals for insulator samples under dry conditions with light contamination level: (a) Group A; (b) Group B; (c) Group C.
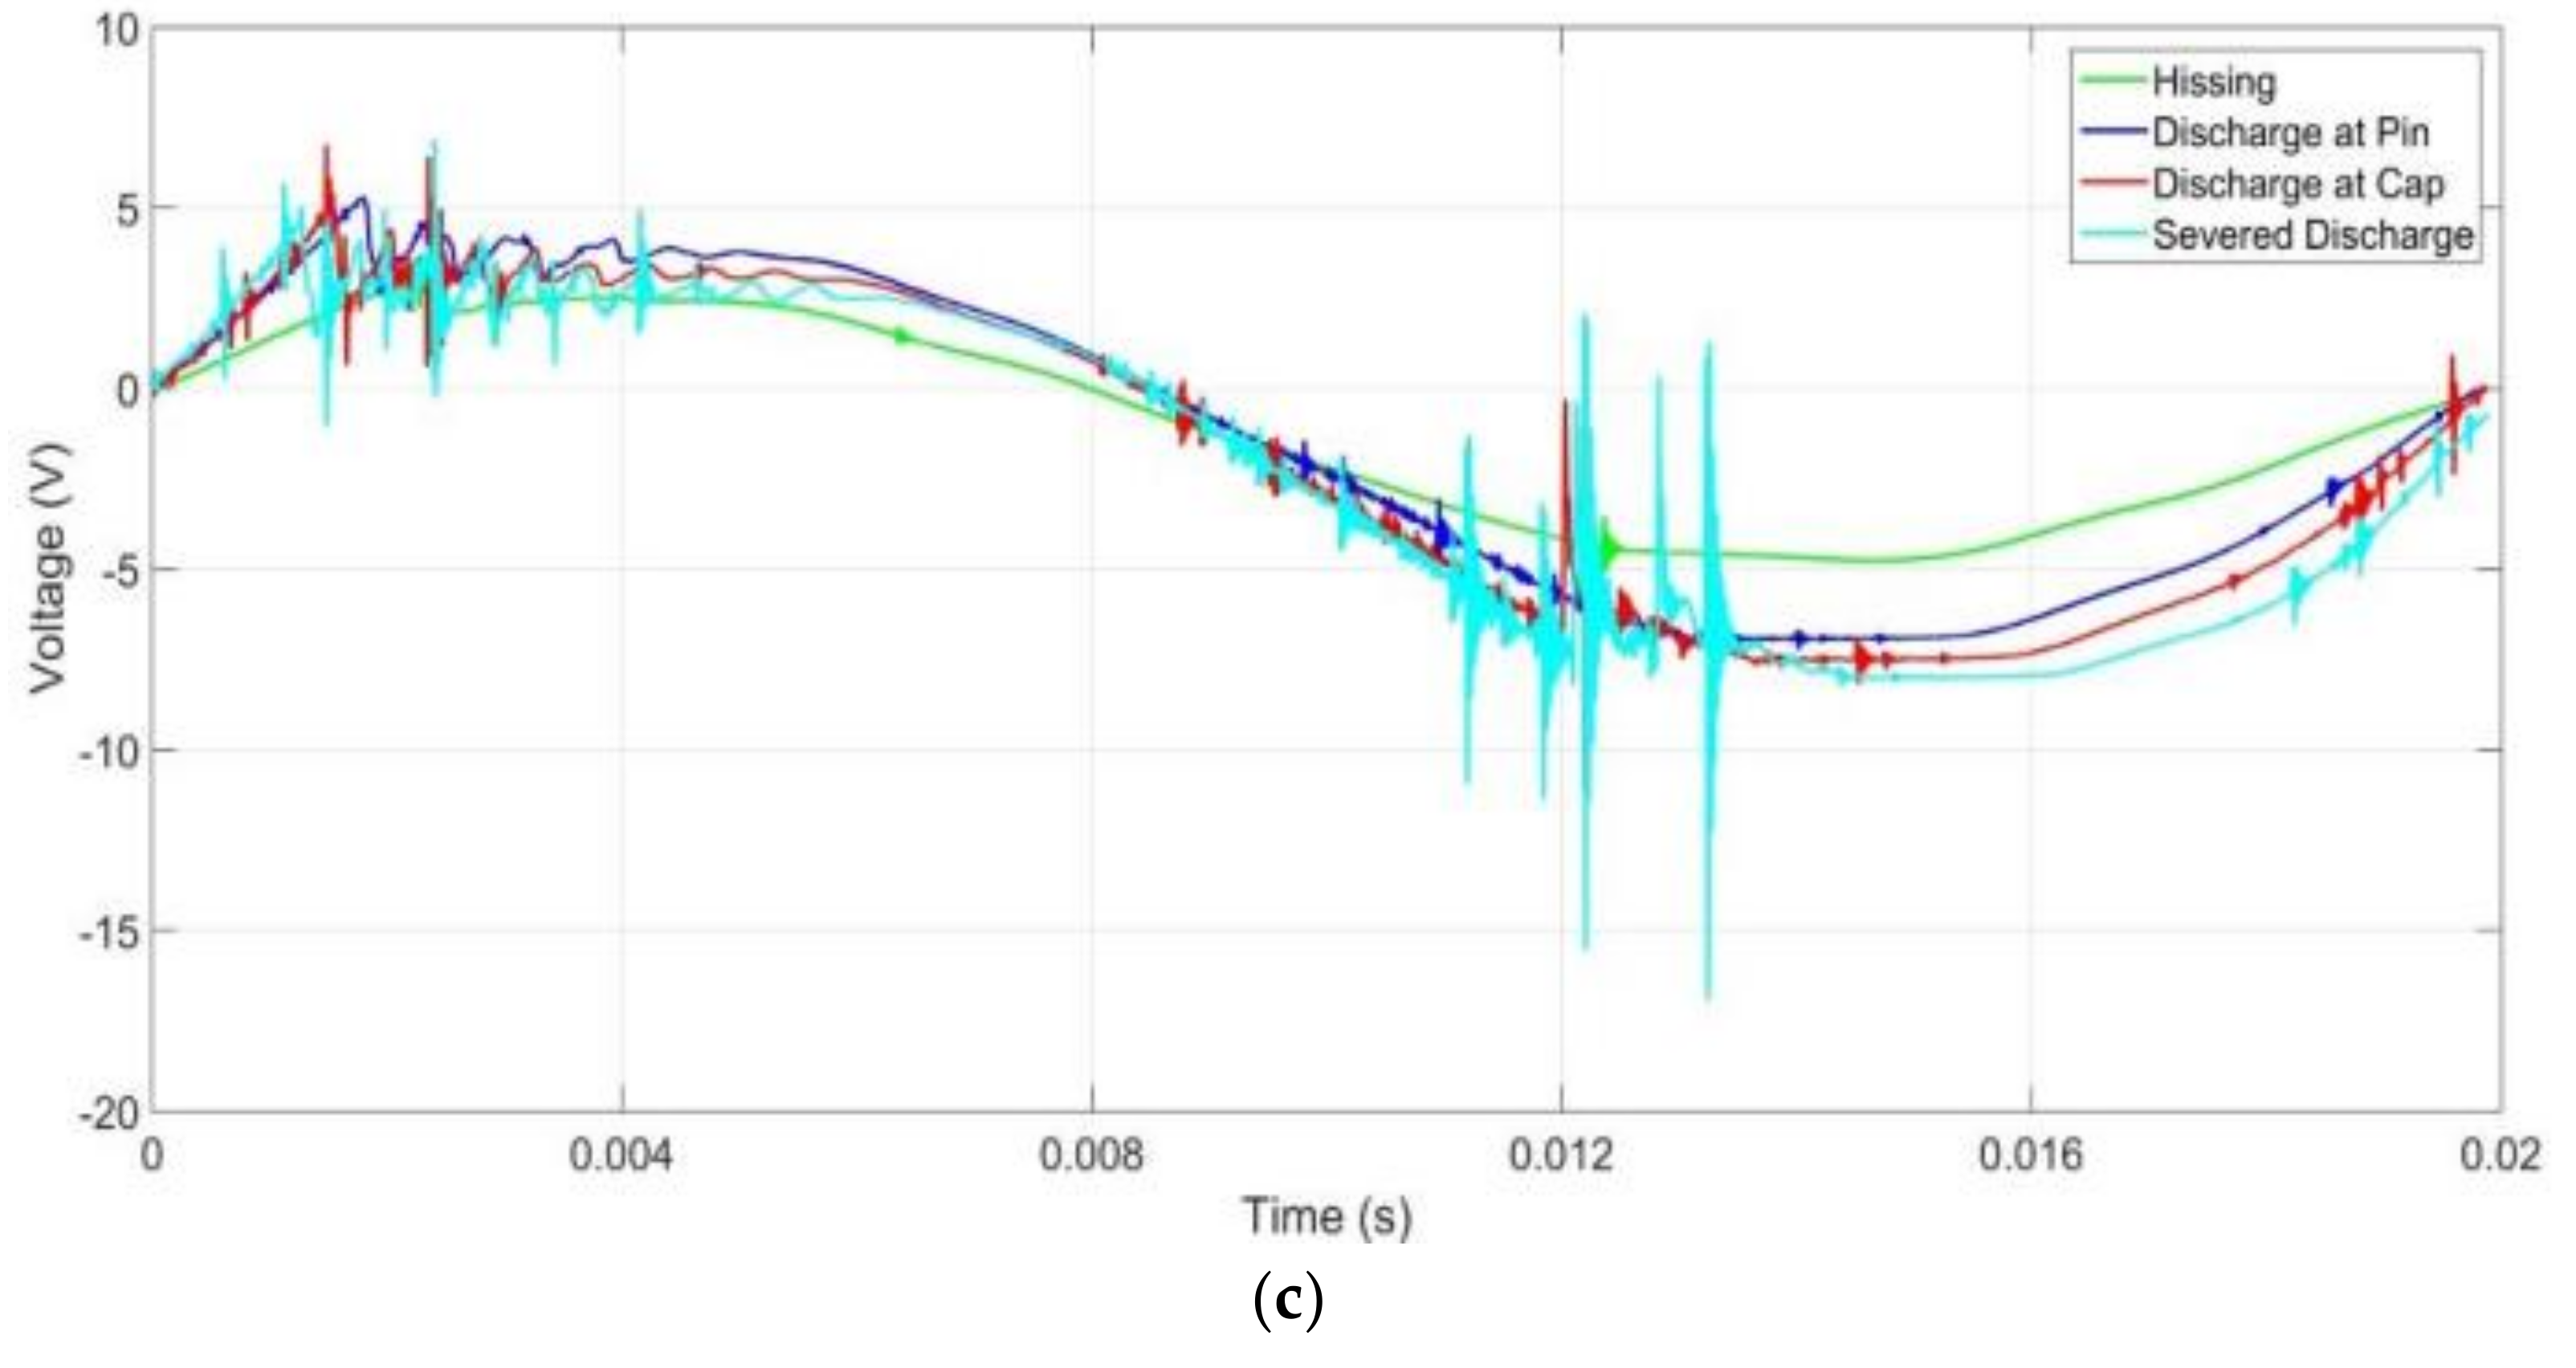
Figure 11.
Average peak-to-peak voltage for all insulator sample groups for all contamination levels under dry condition.
Figure 11.
Average peak-to-peak voltage for all insulator sample groups for all contamination levels under dry condition.
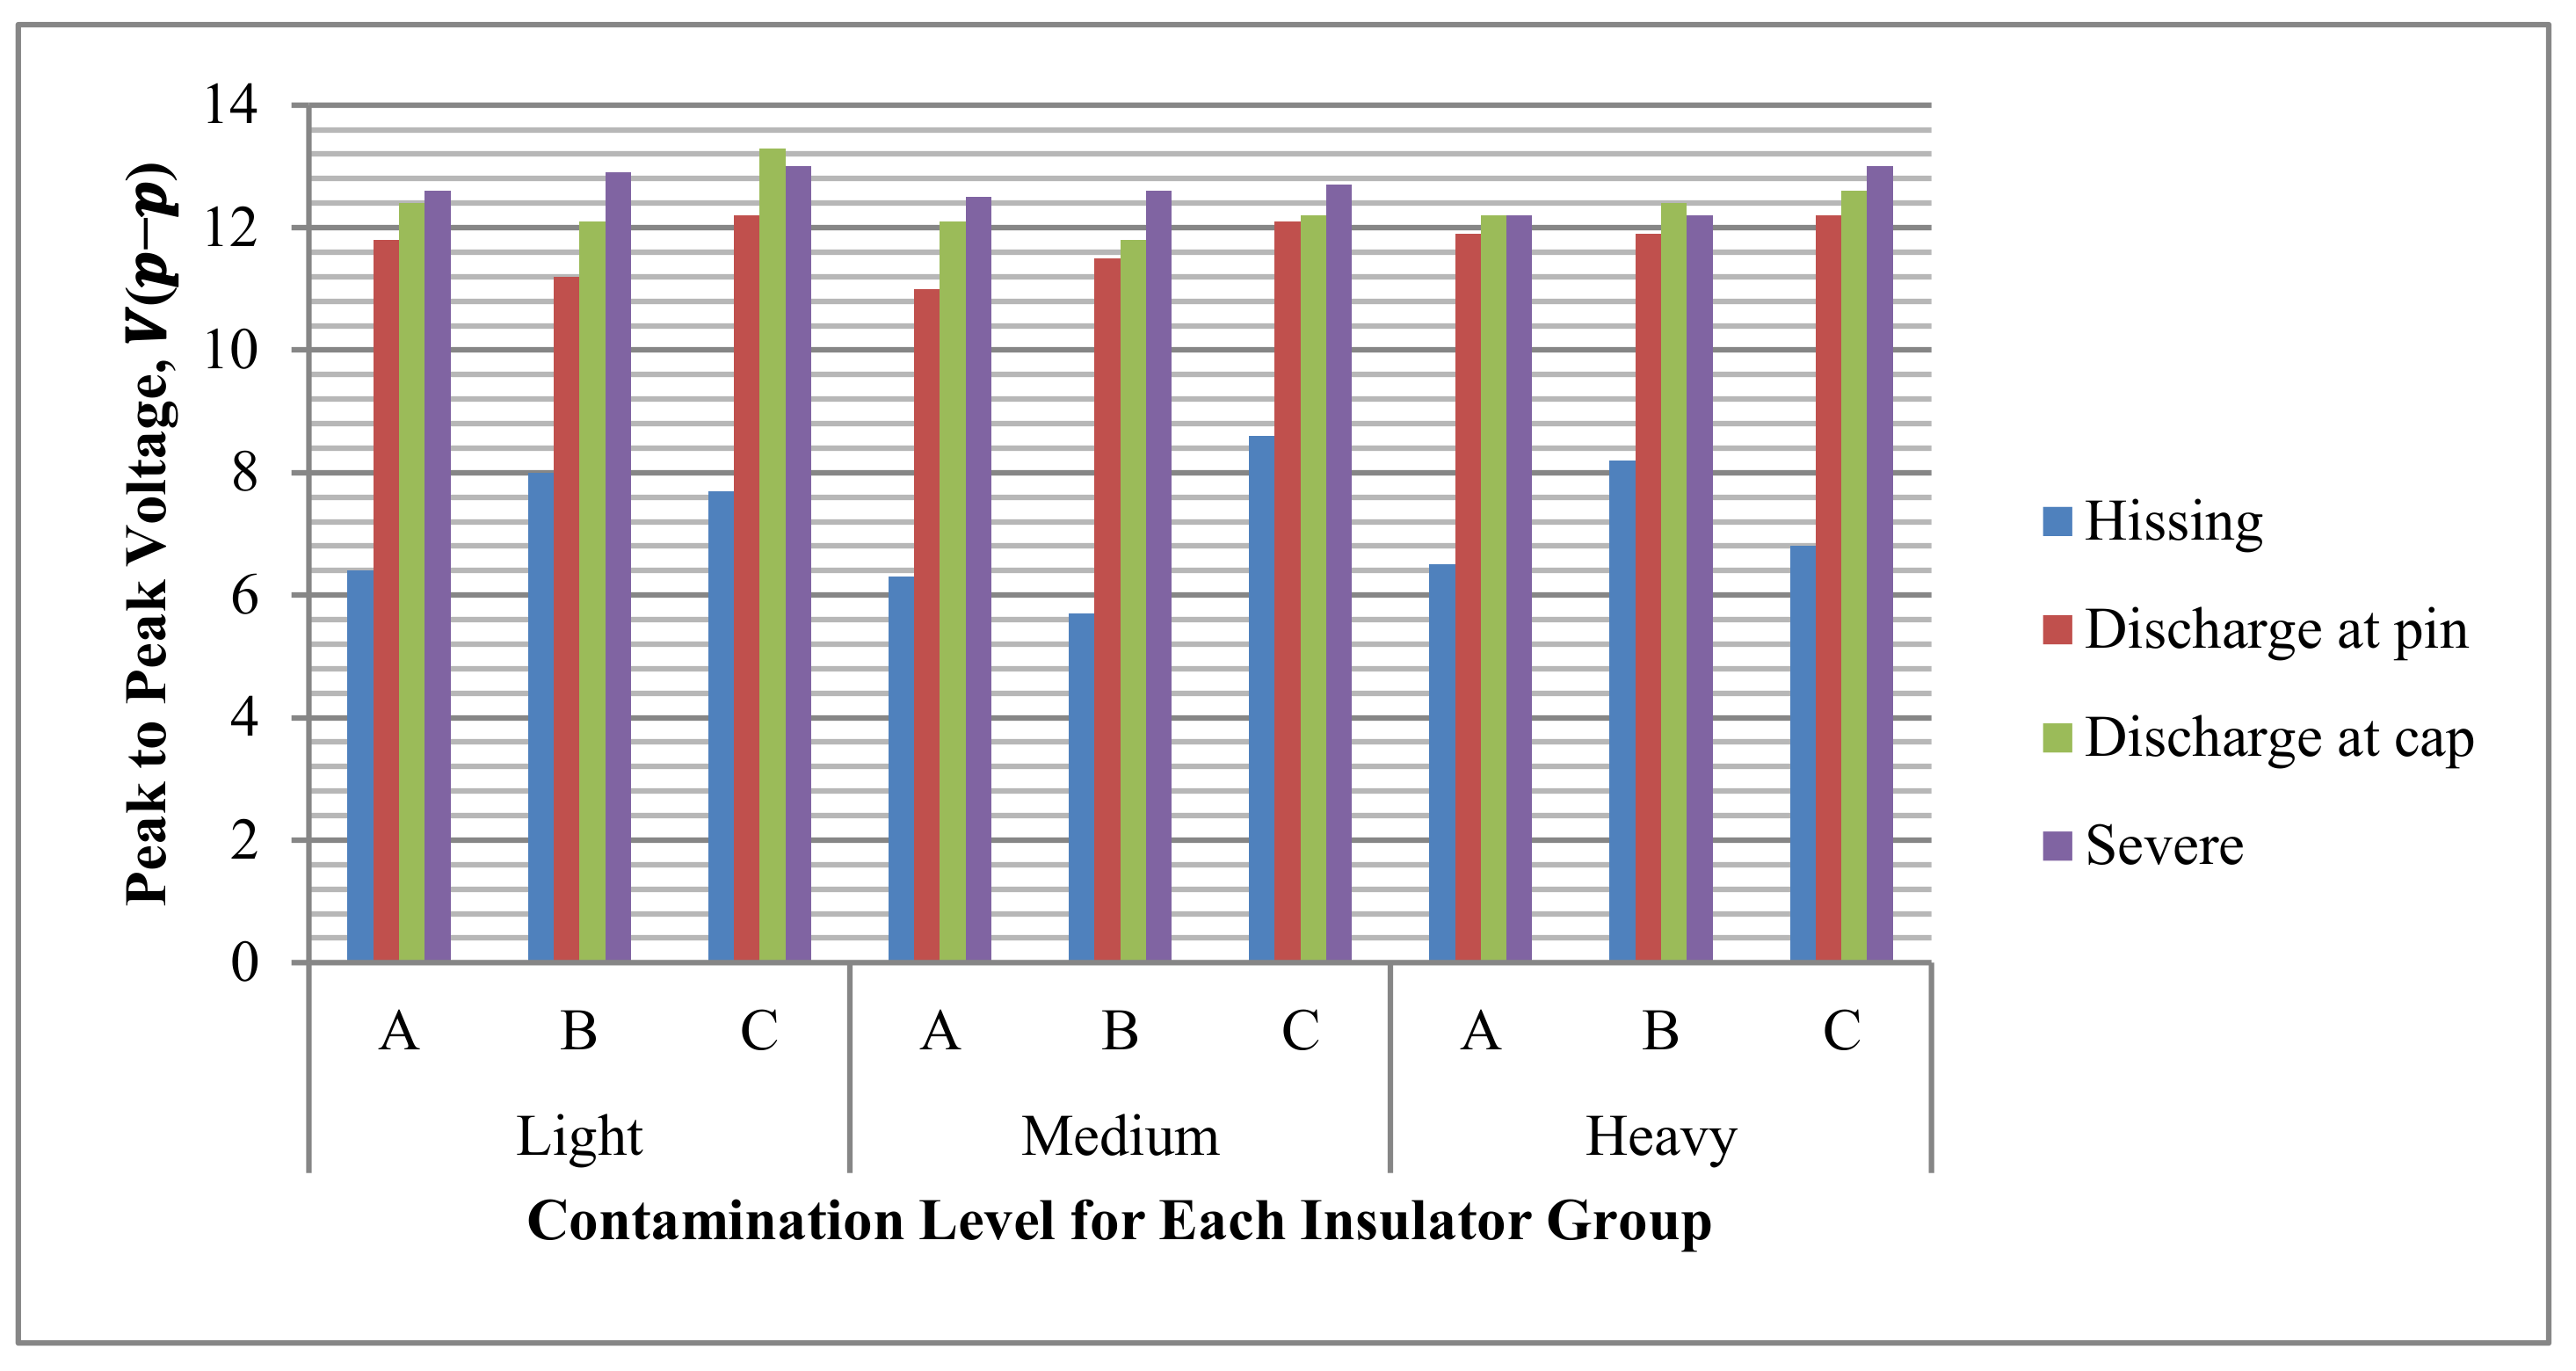
Figure 12.
UV signals for insulator samples under wet conditions with light contamination level: (a) Group A; (b) Group B; (c) Group C.
Figure 12.
UV signals for insulator samples under wet conditions with light contamination level: (a) Group A; (b) Group B; (c) Group C.
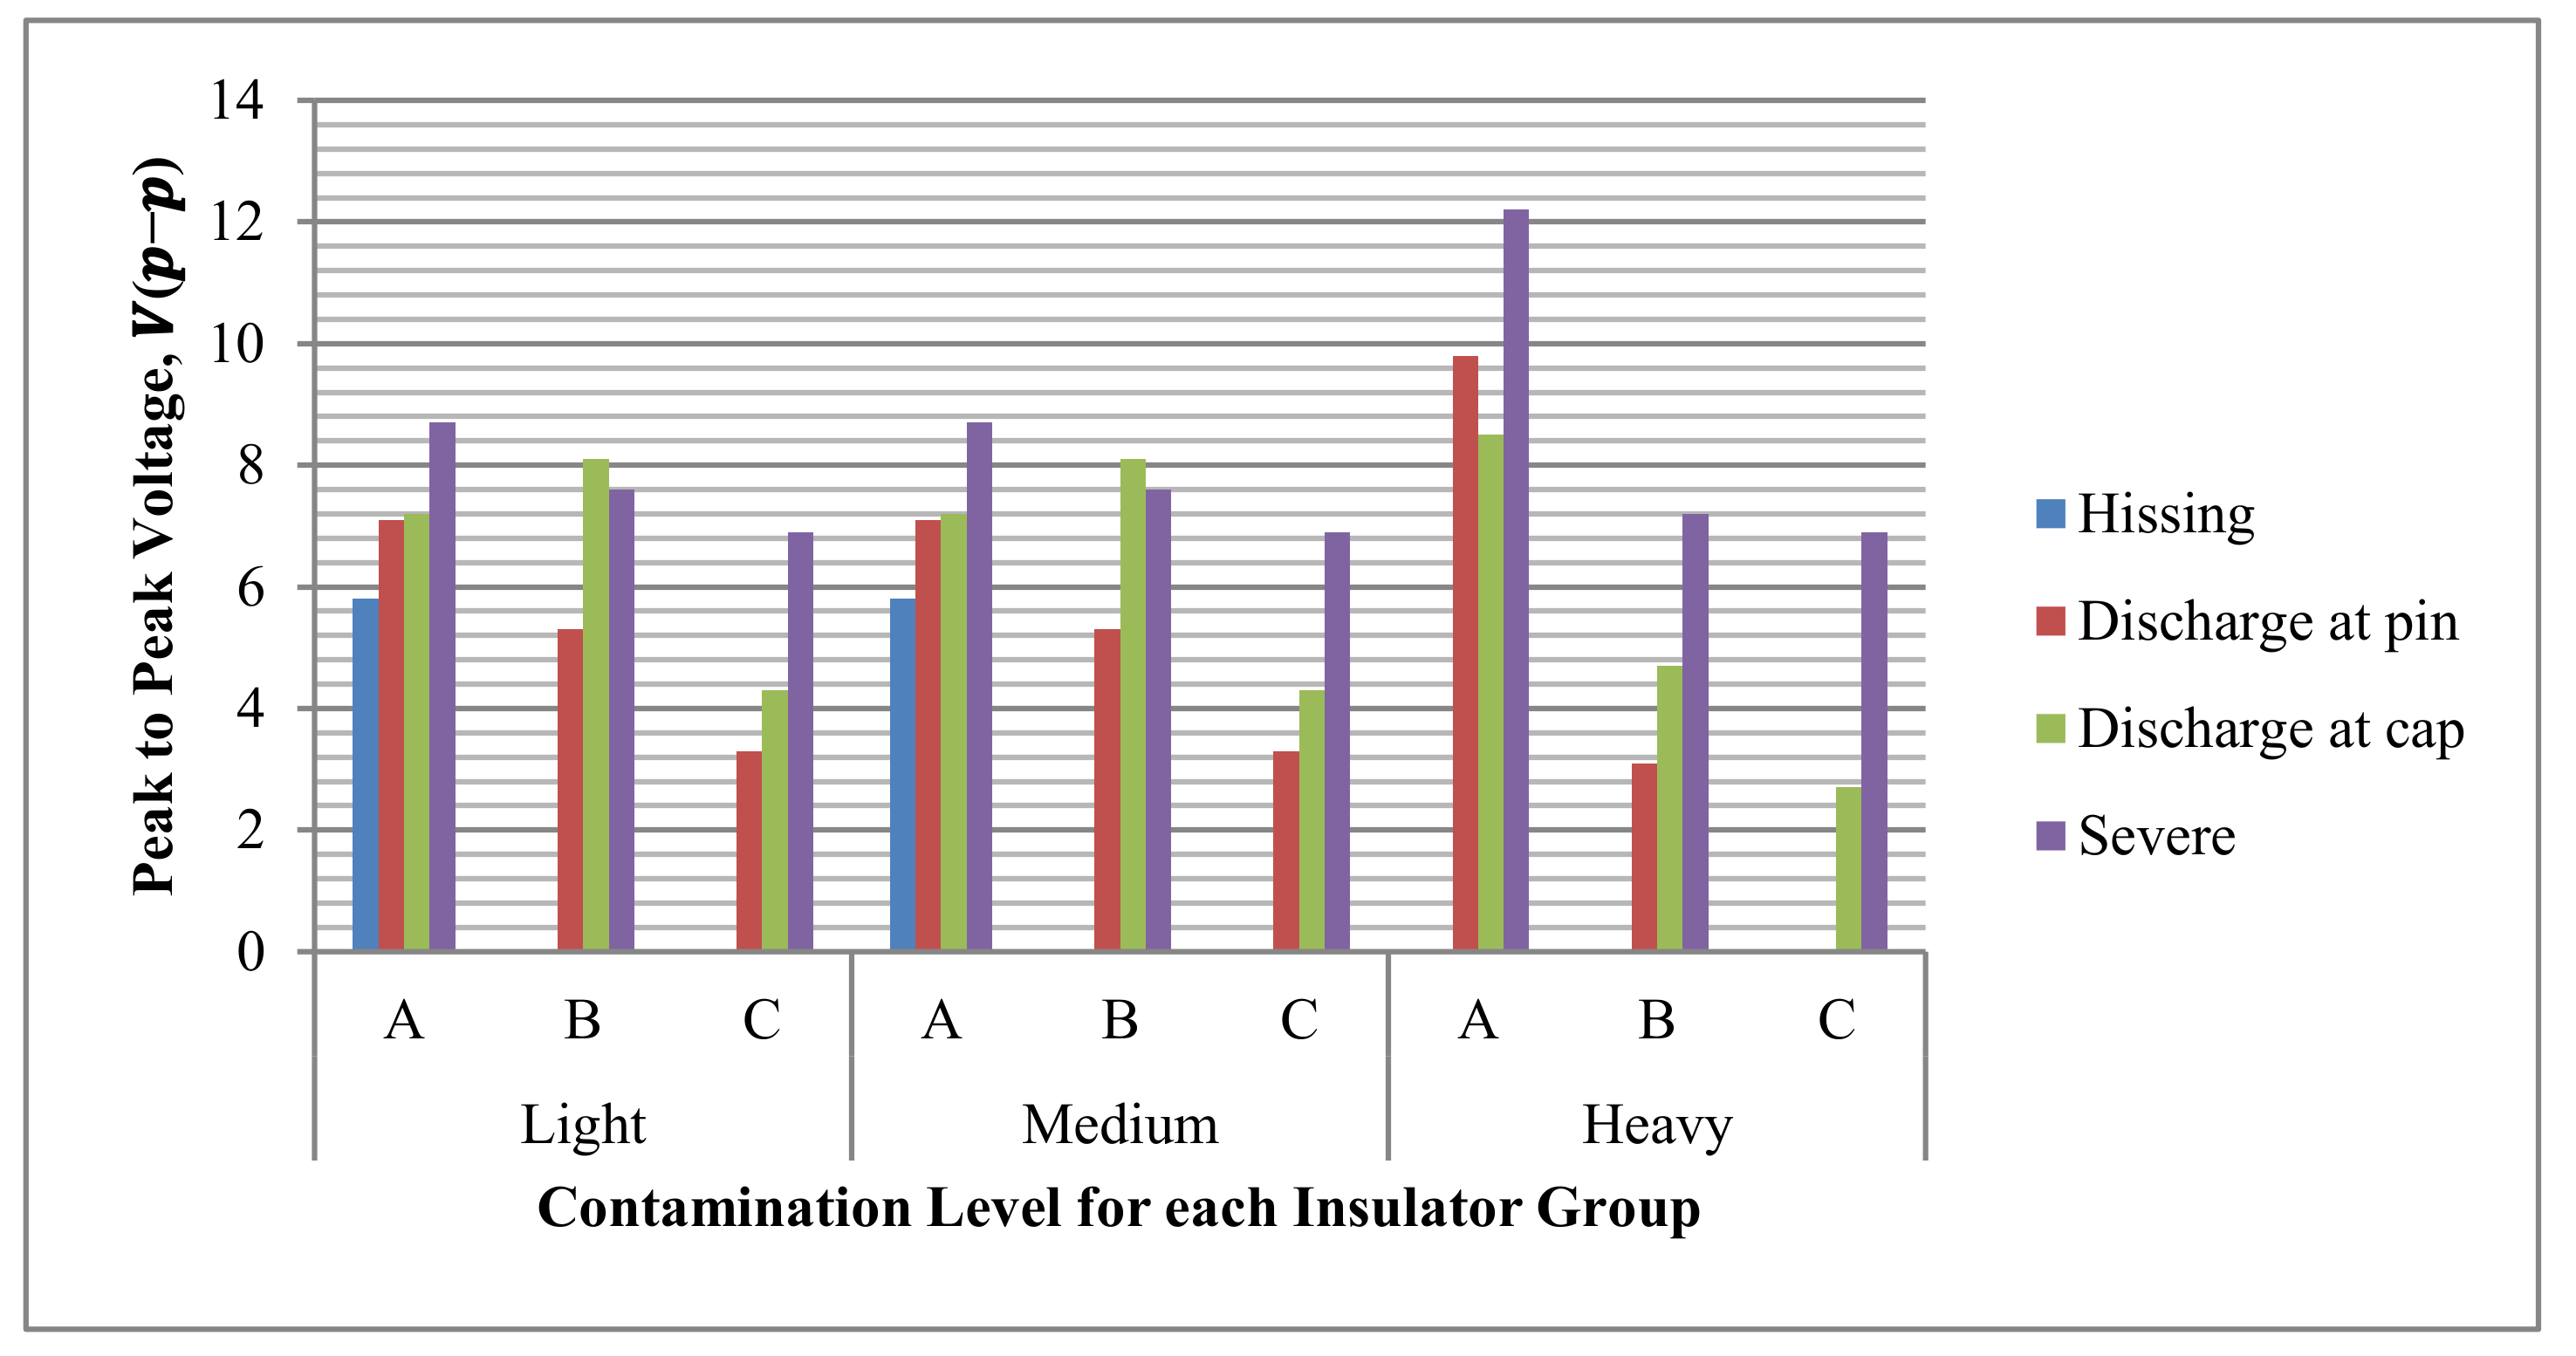
Figure 13.
Average peak-to-peak voltage for each contamination level and insulator group for wet condition.
Figure 13.
Average peak-to-peak voltage for each contamination level and insulator group for wet condition.
Figure 14.
THD for dry insulator condition for samples of: (a) Group A; (b) Group B; (c) Group C.
Figure 14.
THD for dry insulator condition for samples of: (a) Group A; (b) Group B; (c) Group C.
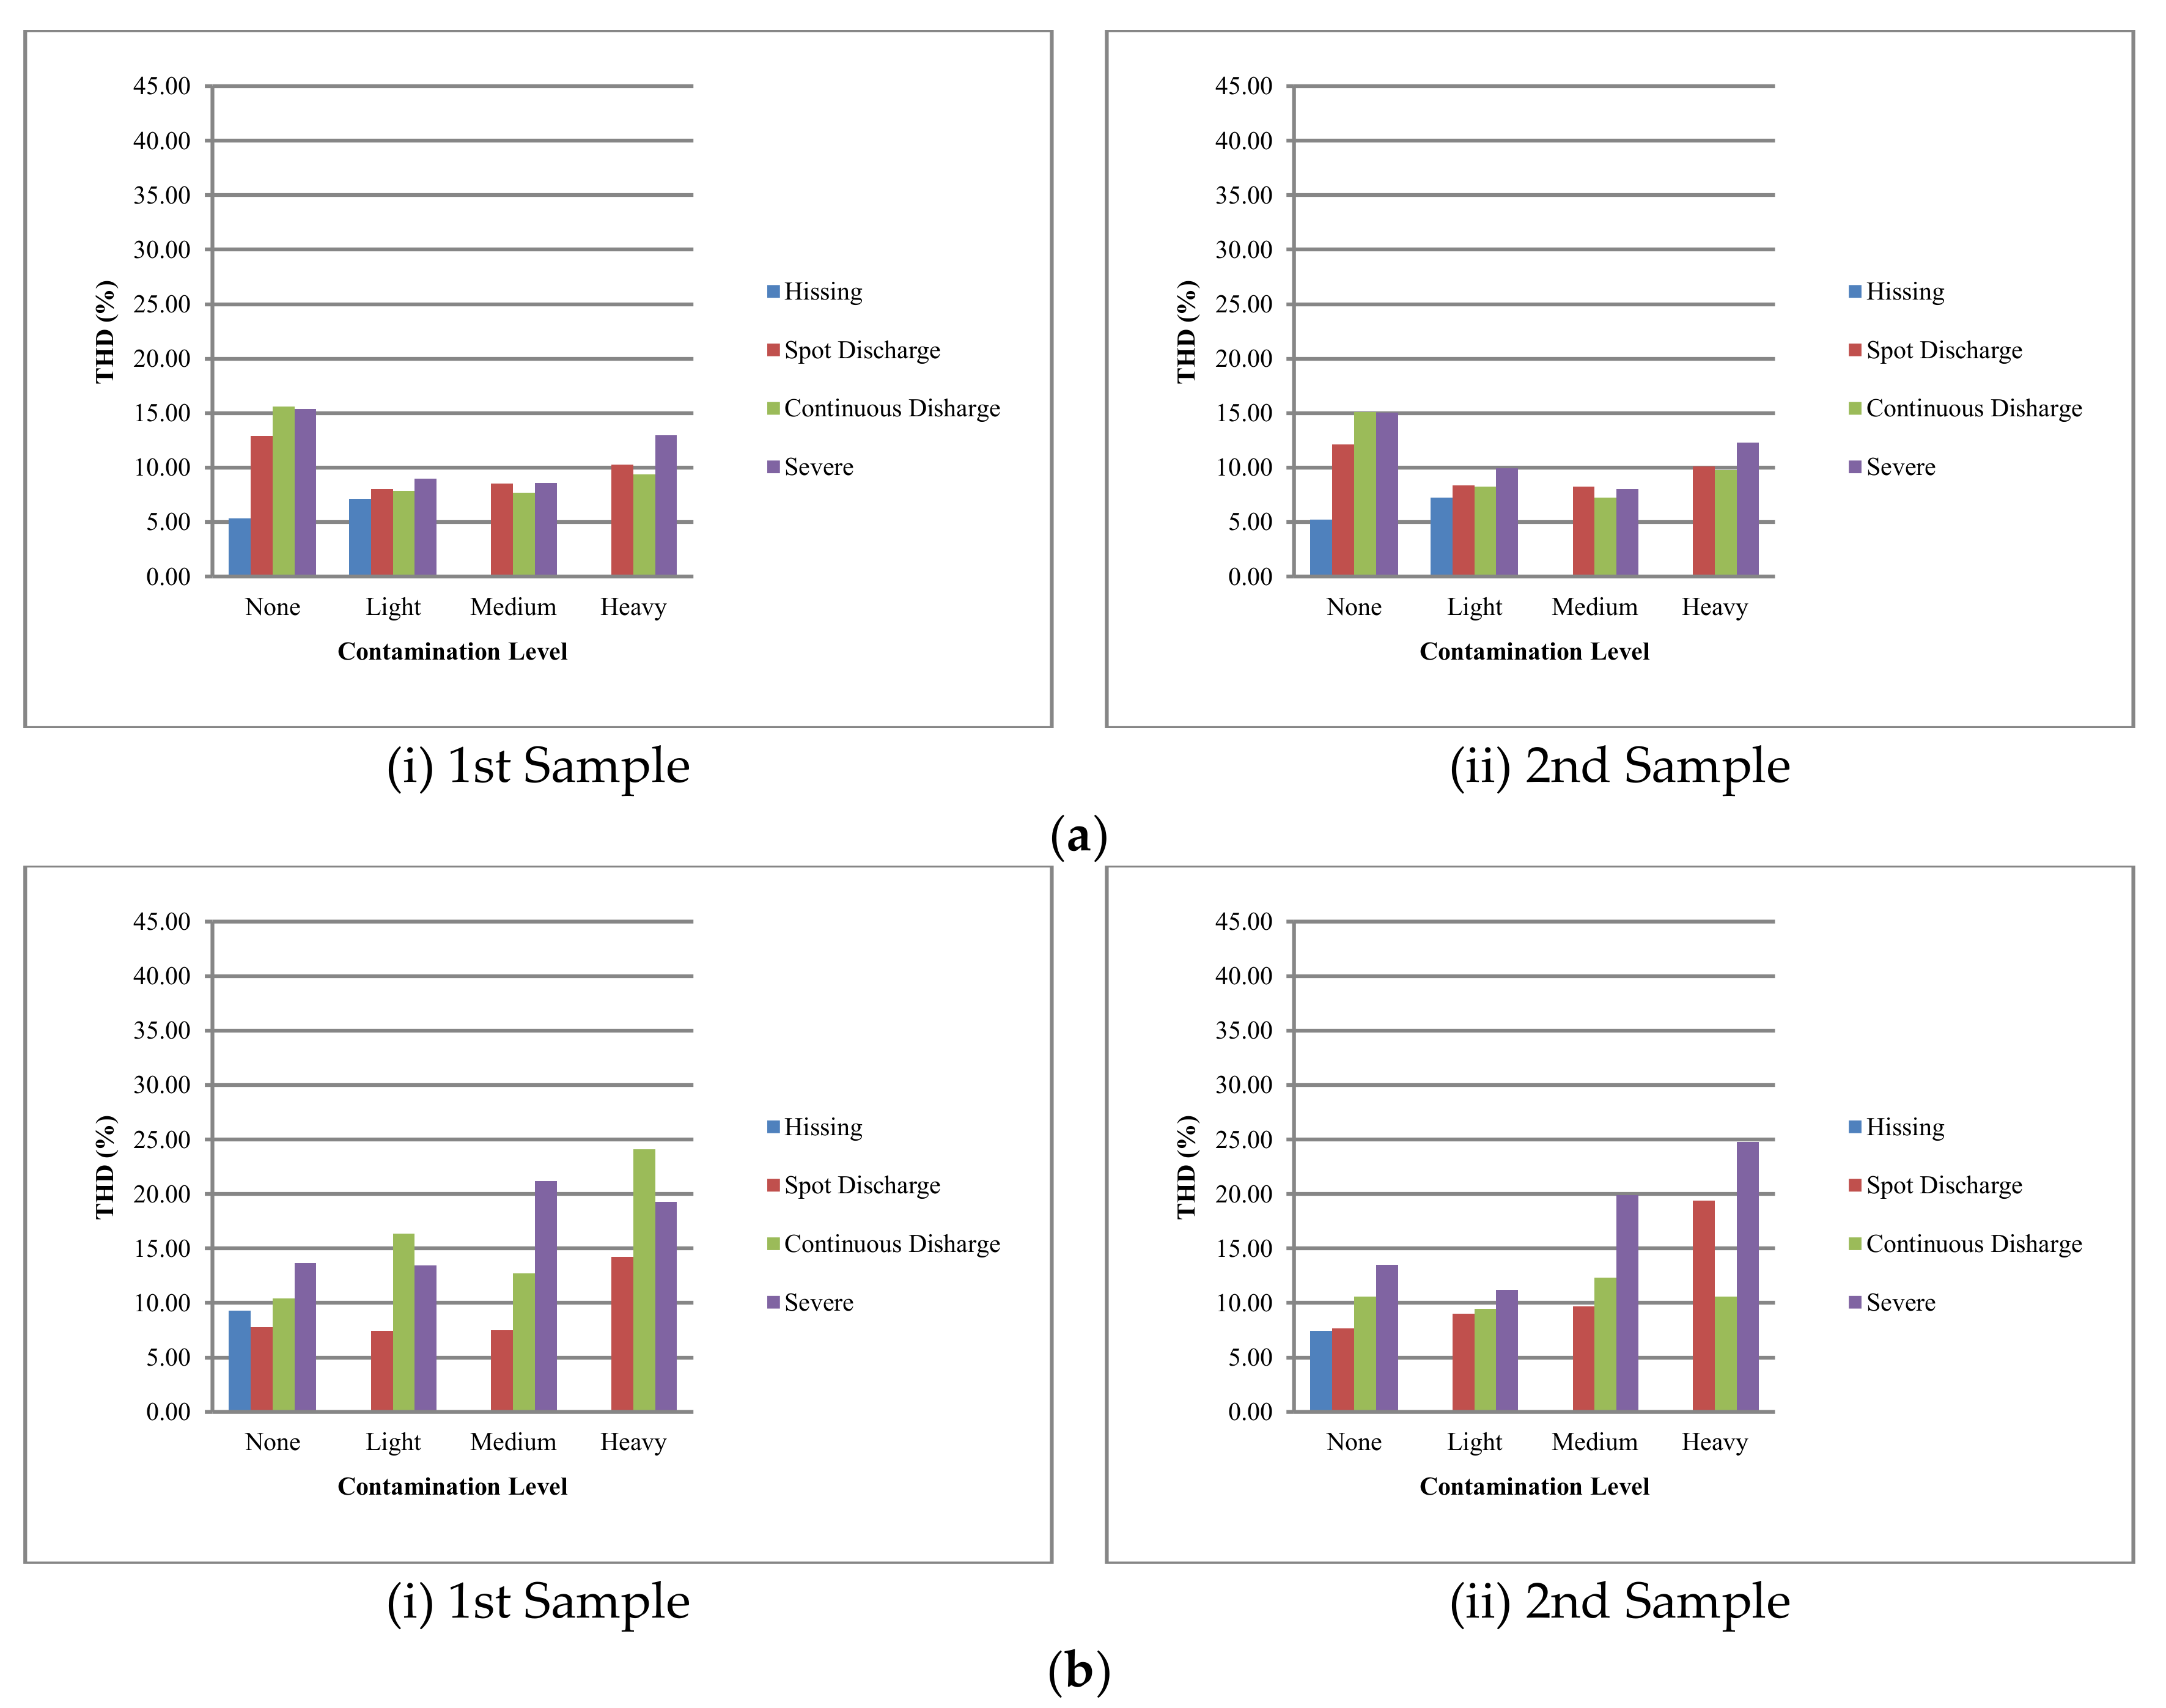
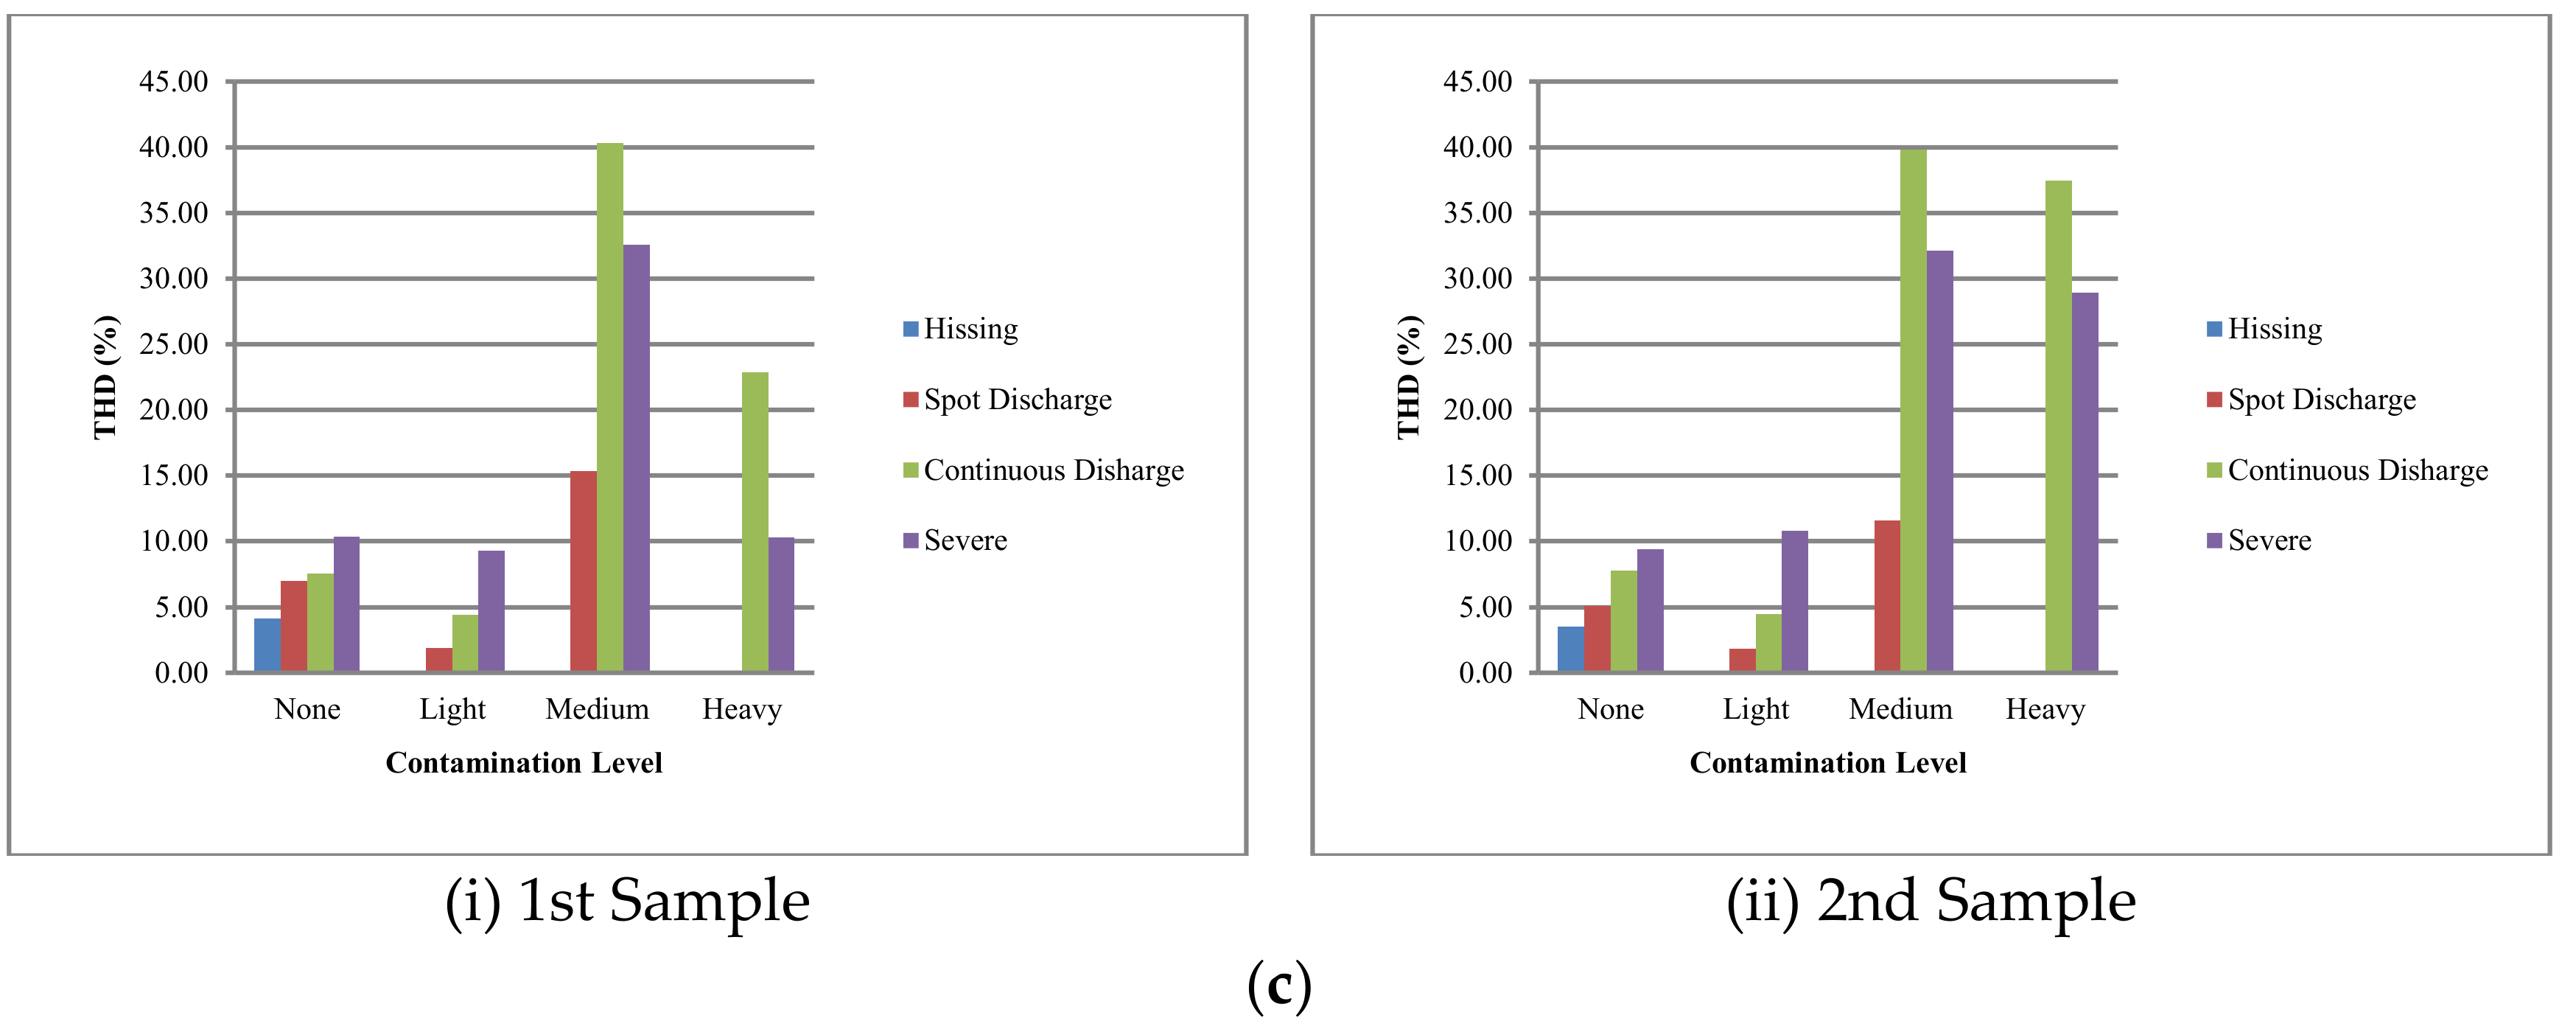
Figure 15.
THD (%) for wet insulator condition for samples of: (a) Group A; (b) Group B; (c) Group C insulators.
Figure 15.
THD (%) for wet insulator condition for samples of: (a) Group A; (b) Group B; (c) Group C insulators.
Figure 16.
Fundamental frequency components for dry condition for samples: (a) Group A; (b) Group B; (c) Group C insulators.
Figure 16.
Fundamental frequency components for dry condition for samples: (a) Group A; (b) Group B; (c) Group C insulators.
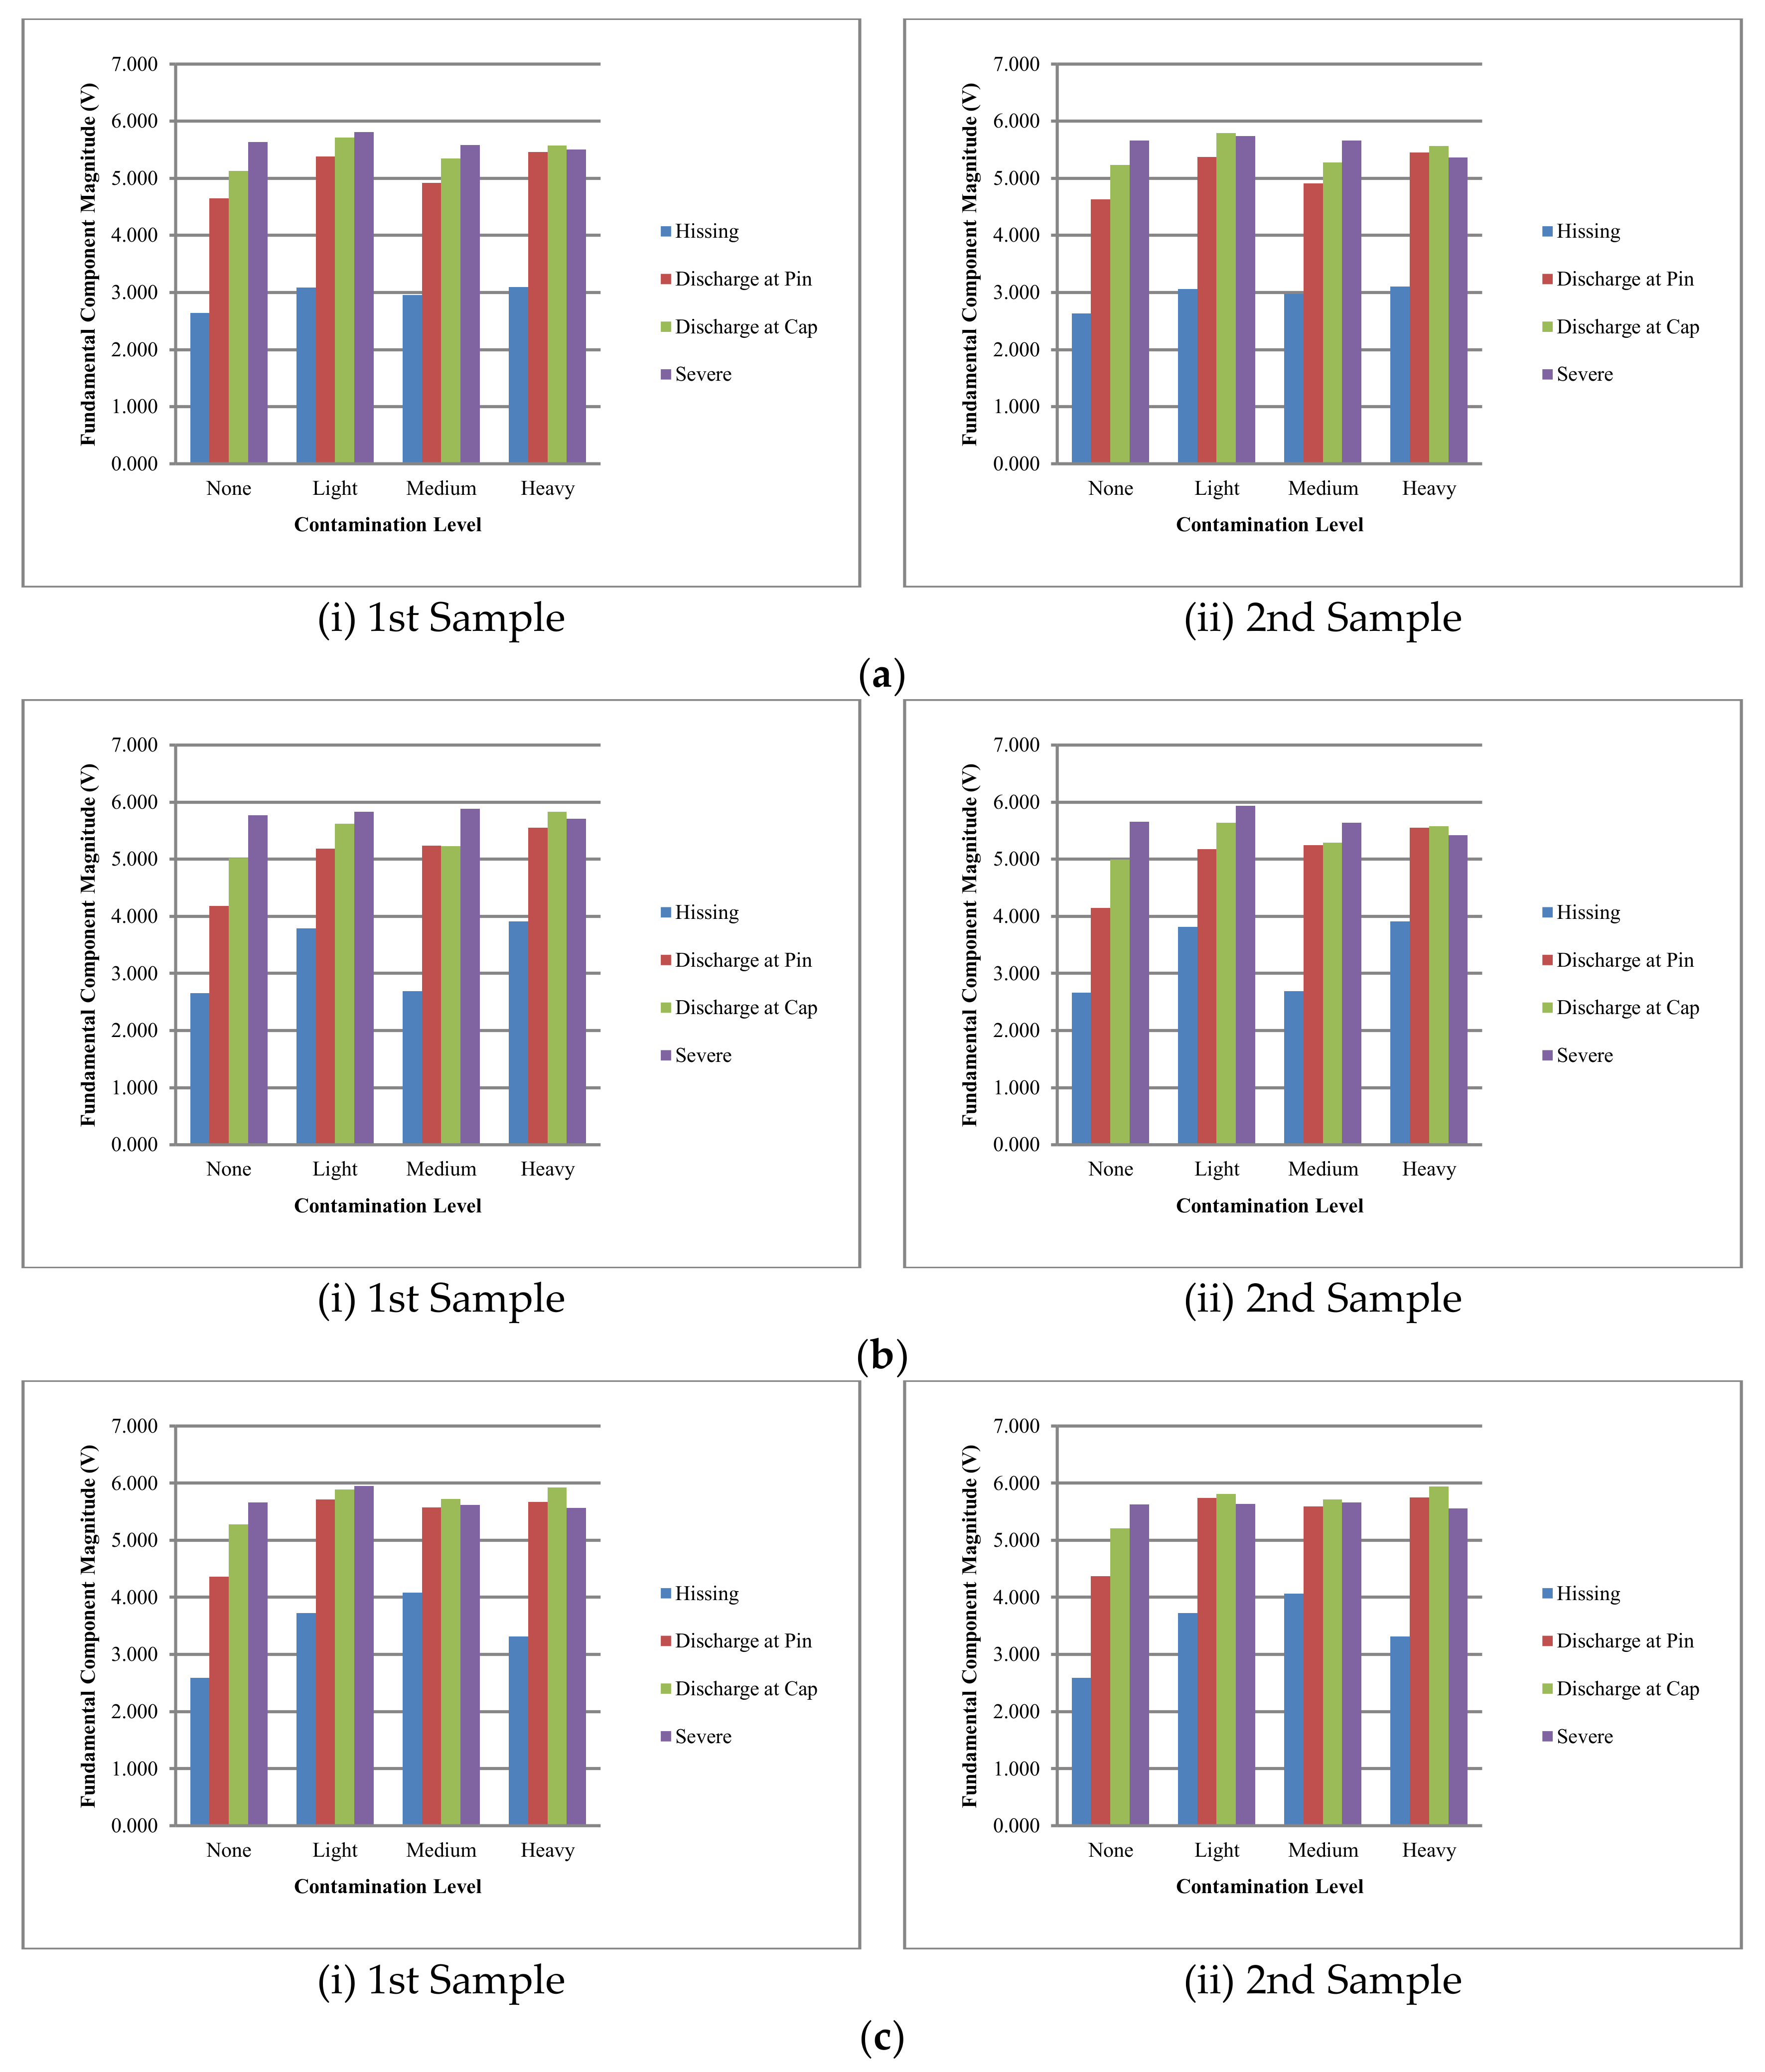
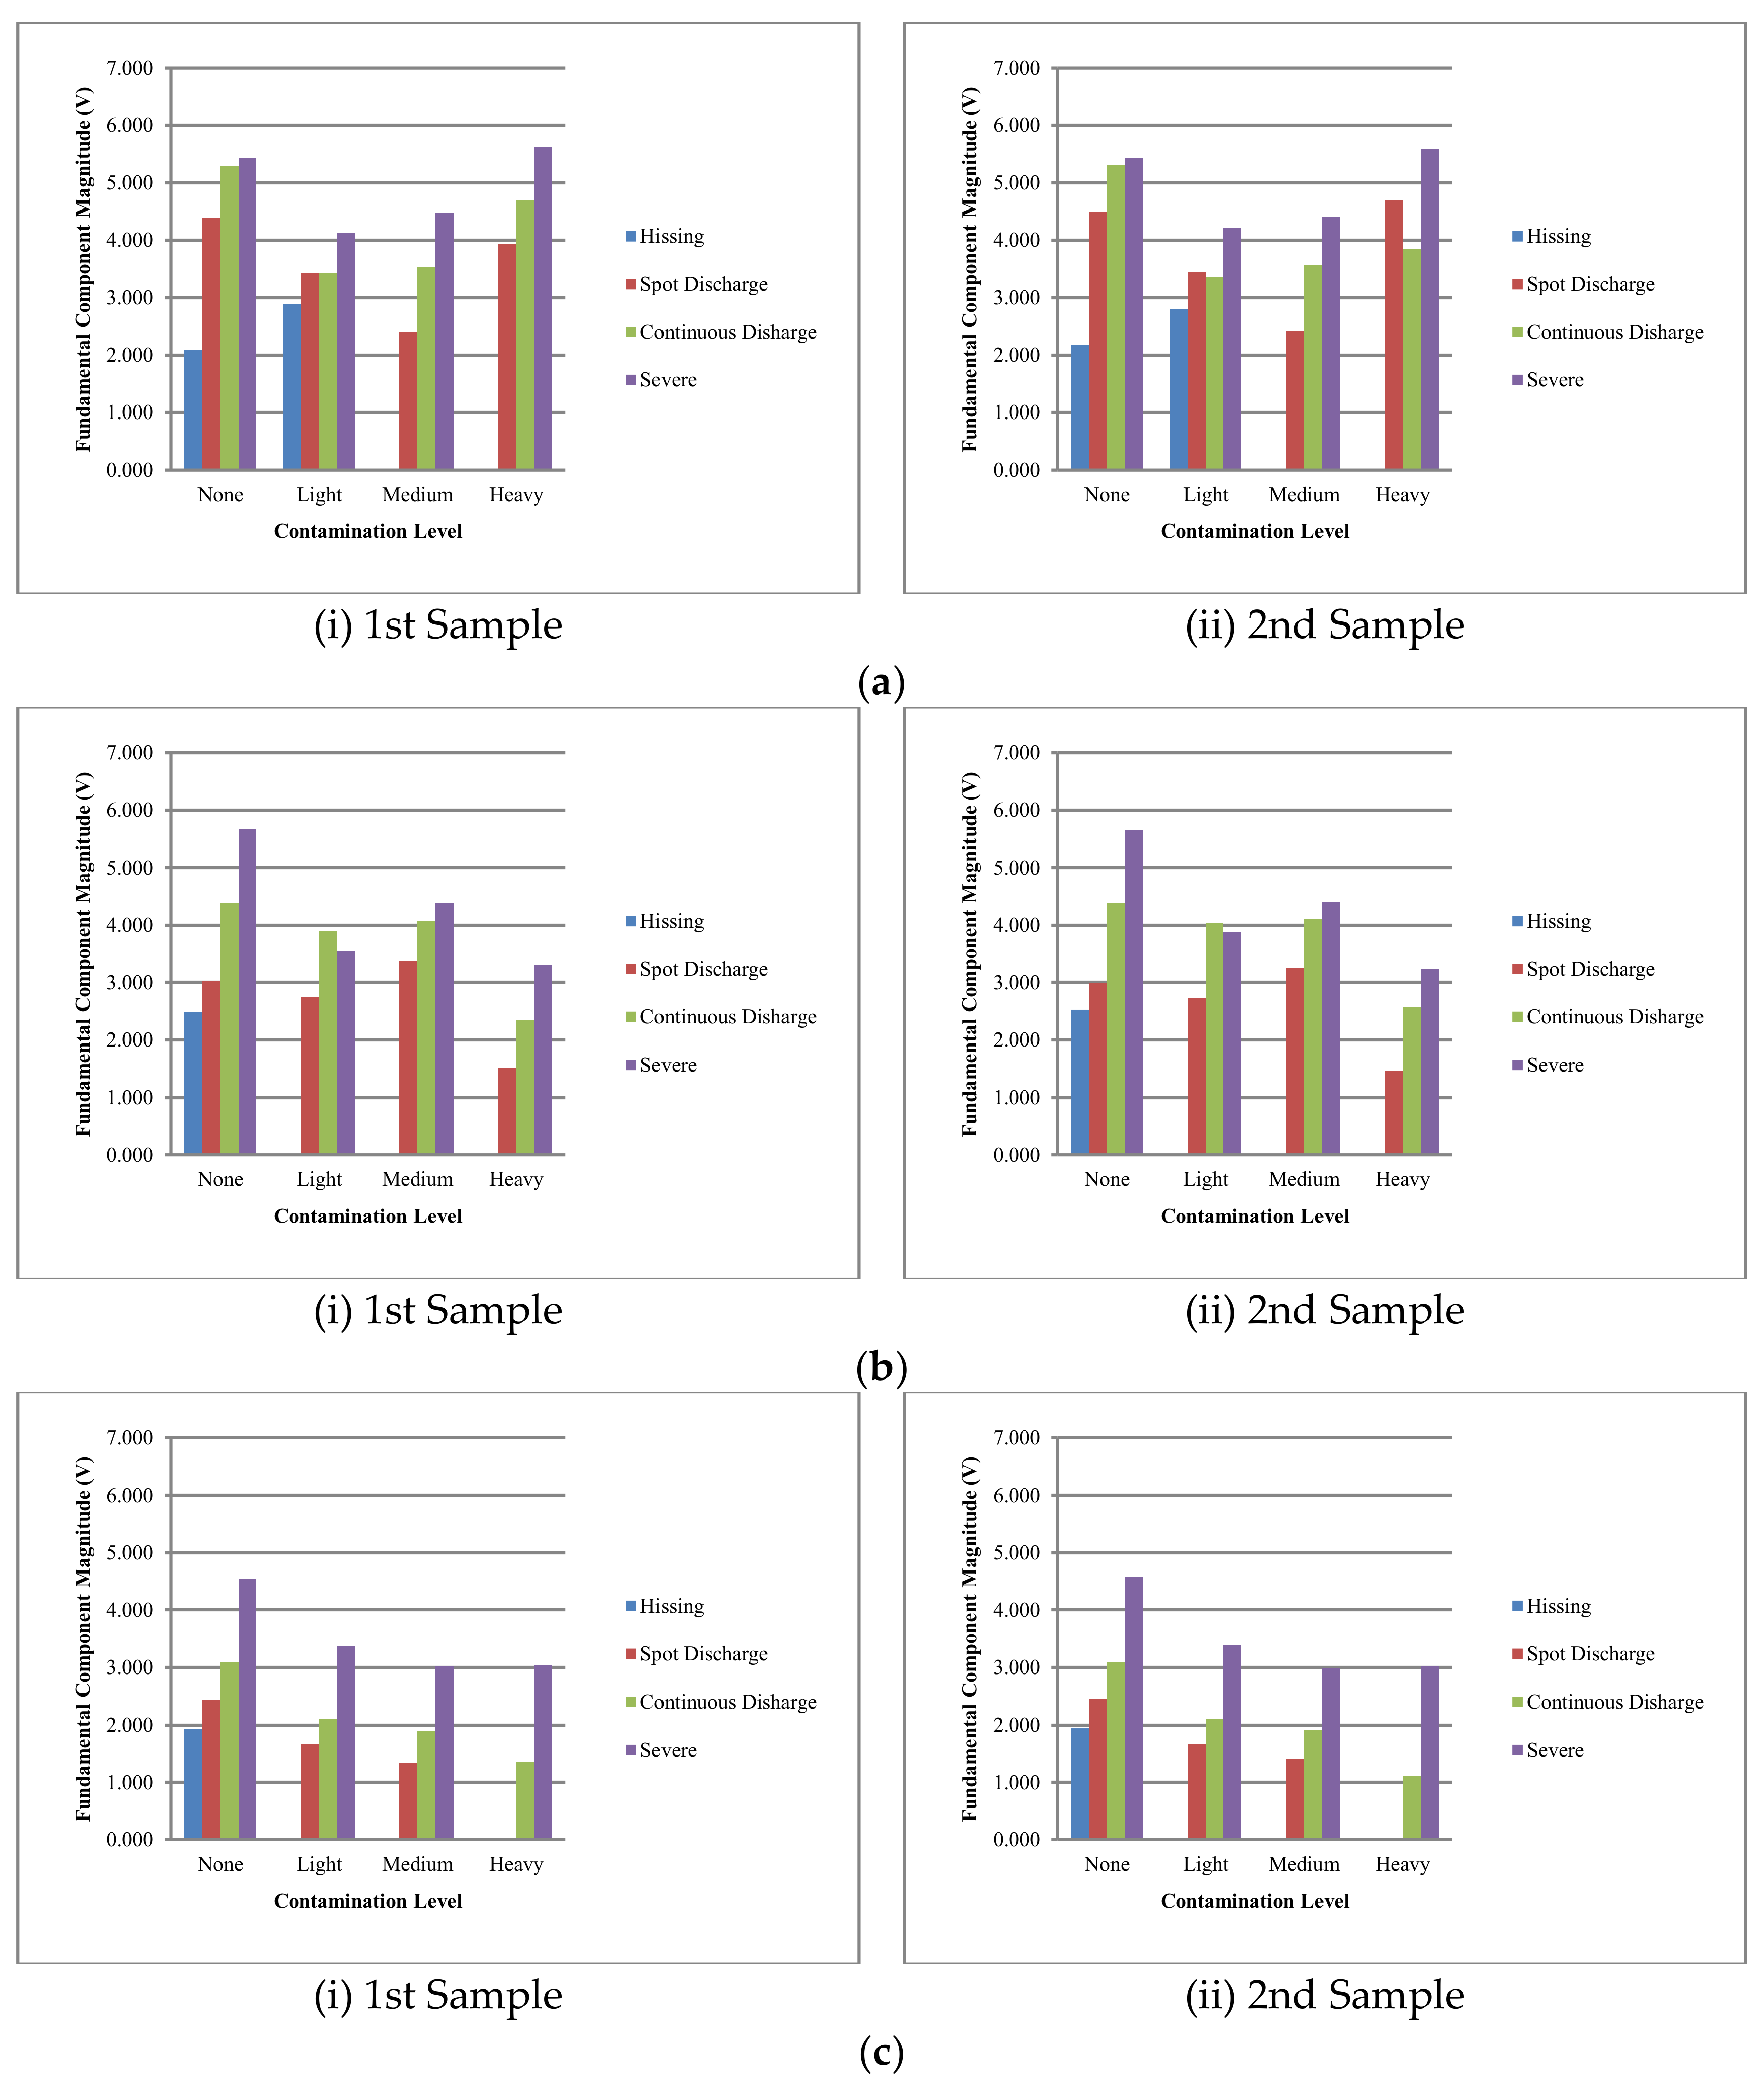
Figure 17.
Fundamental frequency components for wet condition for samples: (a) Group A; (b) Group B; (c) Group C insulators.
Figure 17.
Fundamental frequency components for wet condition for samples: (a) Group A; (b) Group B; (c) Group C insulators.
Table 1.
Pros and cons of various detection methods.
Table 1.
Pros and cons of various detection methods.
| Detection Method | Pros | Cons |
|---|
| Leakage current | | |
| Acoustic | | |
| Ultrasonic | Easily locates discharge Non-contact measurement
| Poor sensitivity Sound attenuation
|
| Infrared | Temperature detection Non-contact measurement
| |
| Ultraviolet imaging | High accuracy Non-contact measurement
| |
Table 2.
Insulators sampled (description).
Table 3.
Insulator samples’ artificial contamination.
Table 3.
Insulator samples’ artificial contamination.
| Salt (g/L) | ESDD (mg/cm2) | Contamination Level |
|---|
| 0 | N/A | N/A |
| 5 | 0.06 | Light |
| 30 | 0.21 | Medium |
| 120 | 0.47 | High |
Table 4.
Classification of insulator surface discharge intensity levels.
Table 4.
Classification of insulator surface discharge intensity levels.
| Insulator Condition | Discharge Intensity Level | Description |
|---|
| Dry | Hissing | Hissing without any visible discharge |
| Discharge at pin | Hissing sound plus spot discharge at both the pin and cap of insulator samples |
| Discharge at cap of the insulator | Louder hissing noise, discharges at both pin and cap of the insulator samples |
| Severe discharge | Very loud hissing noise, intense sparing discharge on the pin and cap of the insulator (just prior to flashover) |
| Wet | Hissing | Hissing sound without visible discharge |
| Spot discharge | Spot discharge appear on insulator surfaces (depending on contamination level, this condition takes place sometimes when hissing sound is heard) |
| Continuous discharge | Continuous discharges on insulator surfaces |
| Severe discharge | Severe continuous discharge on entire insulator surfaces |
Table 5.
Flashover indication level.
Table 5.
Flashover indication level.
| Surface Condition | Discharge Intensity Levels | Flashover Indication |
|---|
| Dry | Hissing | Warning |
| Discharge at Pin | Danger (Dry) |
| Discharge at Cap |
| Severe |
| Wet | Hissing | Warning |
| Spot Discharge | Danger (Wet) |
| Continuous Discharge |
| Severe |
Table 6.
Relationship between the output values of artificial neural network (ANN) and flashover indication.
Table 6.
Relationship between the output values of artificial neural network (ANN) and flashover indication.
Output Neuron Value
1 2 3 | Flashover Indication |
|---|
| 1 0 0 | Warning |
| 0 1 0 | Danger (dry condition) |
| 0 0 1 | Danger (wet condition) |
Table 7.
Injected voltage and average peak-to-peak voltages of the UV signals for dry insulators conditions without contamination.
Table 7.
Injected voltage and average peak-to-peak voltages of the UV signals for dry insulators conditions without contamination.
| Insulator Samples (Group) | | Voltages | Range Injected Voltage, Vi (kV) | Average Peak to Peak Voltage, Vp-p (V) |
|---|
| Discharge Intensity Level | |
|---|
| A | Hissing | 27–35 | 5.6 |
| Discharge at Pin | 40–50 | 10.3 |
| Discharge at Cap | 54–56 | 11.6 |
| Severe | 60–63 | 12.5 |
| B | Hissing | 27–33 | 5.6 |
| Discharge at Pin | 40–47 | 9.1 |
| Discharge at Cap | 52–55 | 11.2 |
| Severe | 59–63 | 12.5 |
| C | Hissing | 27–34 | 5.4 |
| Discharge at Pin | 42–48 | 9.6 |
| Discharge at Cap | 51–54 | 11.8 |
| Severe | 59–63 | 12.3 |
Table 8.
Injected voltage and average peak-to-peak voltages of the UV signals for wet insulators conditions without contamination.
Table 8.
Injected voltage and average peak-to-peak voltages of the UV signals for wet insulators conditions without contamination.
| Samples Group | | Voltages | Range Injected Voltage, Vi (kV) | Average Peak to Peak Voltage, Vp-p (V) |
|---|
| Discharge Intensity Level | |
|---|
| A | Hissing | 15–18 | 4.3 |
| Spot Discharge | 23–30 | 9.6 |
| Continuous Discharge | 30–46 | 11.8 |
| Severe | 50–53 | 12.4 |
| B | Hissing | 15–20 | 5.3 |
| Spot Discharge | 22–30 | 6.3 |
| Continuous Discharge | 31–44 | 9.1 |
| Severe | 50–54 | 12.0 |
| C | Hissing | 14–20 | 3.9 |
| Spot Discharge | 20–21 | 4.5 |
| Continuous Discharge | 25–29 | 6.8 |
| Severe | 38–51 | 9.6 |
Table 9.
Injected voltage and average peak-to-peak voltages of the UV signals for dry insulators conditions with light contamination level.
Table 9.
Injected voltage and average peak-to-peak voltages of the UV signals for dry insulators conditions with light contamination level.
| Sample | Group A | Group B | Group C |
|---|
| Voltage | Range Injected Voltage, Vi (kV) | Average Peak-to-Peak Voltage, Vp-p (V) | Range Injected Voltage, Vi (kV) | Average Peak-to-Peak Voltage, Vp-p (V) | Range Injected Voltage, Vi (kV) | Average Peak-to-Peak Voltage, Vp-p (V) |
|---|
| Discharge Intensity Level | |
|---|
| Hissing | 20–32 | 6.4 | 19–32 | 8.0 | 18–28 | 7.7 |
| Discharge at pin | 42–50 | 11.8 | 41–49 | 11.2 | 40–47 | 12.2 |
| Discharge at cap | 50–54 | 12.4 | 49–54 | 12.1 | 50–54 | 13.3 |
| Severe | 60–63 | 12.6 | 60–63 | 12.9 | 59–62 | 13.0 |
Table 10.
Injected voltage and average peak-to-peak voltages of the UV signals for dry insulators conditions with medium contamination level.
Table 10.
Injected voltage and average peak-to-peak voltages of the UV signals for dry insulators conditions with medium contamination level.
| Sample | Group A | Group B | Group C |
|---|
| | Voltage | Range Injected Voltage, Vi (kV) | Average Peak-to-Peak Voltage, Vp-p (V) | Range Injected Voltage, Vi (kV) | Average Peak-to-Peak Voltage, Vp-p (V) | Range Injected Voltage, Vi (kV) | Average Peak-to-Peak Voltage, Vp-p (V) |
|---|
| Discharge Intensity Level | |
|---|
| Hissing | 20–32 | 6.3 | 19–32 | 5.7 | 19–31 | 8.6 |
| Discharge at pin | 40–50 | 11.0 | 40–46 | 11.5 | 40–47 | 12.1 |
| Discharge at cap | 50–54 | 12.1 | 48–51 | 11.8 | 51–55 | 12.2 |
| Severe | 60–63 | 12.5 | 58–62 | 12.6 | 58–62 | 12.7 |
Table 11.
Injected voltage and average peak-to-peak voltages of the UV signals for dry insulators conditions with heavy contamination level.
Table 11.
Injected voltage and average peak-to-peak voltages of the UV signals for dry insulators conditions with heavy contamination level.
| Sample | Group A | Group B | Group C |
|---|
| Voltage | Range Injected Voltage, Vi (kV) | Average Peak-to-Peak Voltage, Vp-p (V) | Range Injected Voltage, Vi (kV) | Average Peak-to-Peak Voltage, Vp-p (V) | Range Injected Voltage, Vi (kV) | Average Peak-to-Peak Voltage, Vp-p (V) |
|---|
| Discharge Intensity Level | |
|---|
| Hissing | 20–31 | 6.5 | 19–32 | 8.2 | 19–34 | 6.8 |
| Discharge at pin | 35–48 | 11.9 | 37–43 | 11.9 | 32–44 | 12.2 |
| Discharge at cap | 44–49 | 12.2 | 47–51 | 12.4 | 46–52 | 12.6 |
| Severe | 56–59 | 12.2 | 56–60 | 12.2 | 56–60 | 13.0 |
Table 12.
Injected voltage and average peak-to-peak voltages of the UV signals for wet insulators conditions with light contamination level.
Table 12.
Injected voltage and average peak-to-peak voltages of the UV signals for wet insulators conditions with light contamination level.
| Sample | Group A | Group B | Group C |
|---|
| Voltage | Range Injected Voltage, Vi (kV) | Average Peak-to-Peak Voltage, Vp-p (V) | Range Injected Voltage, Vi (kV) | Average Peak-to-Peak Voltage, Vp-p (V) | Range Injected Voltage, Vi (kV) | Average Peak-to-Peak Voltage, Vp-p (V) |
|---|
| Discharge Intensity Level | |
|---|
| Hissing | 4–19 | 5.8 | - | - | - | - |
| Spot Discharge | 10–26 | 7.1 | 6–21 | 5.3 | 3–8 | 3.3 |
| Continuous Discharge | 26–31 | 7.2 | 11–28 | 8.1 | 10–18 | 4.3 |
| Severe | 24–41 | 8.7 | 20–31 | 7.6 | 19–34 | 6.9 |
Table 13.
Injected voltage and average peak-to-peak voltages of the UV signals for wet insulators conditions with medium contamination level.
Table 13.
Injected voltage and average peak-to-peak voltages of the UV signals for wet insulators conditions with medium contamination level.
| Sample | Group A | Group B | Group C |
|---|
| | Voltage | Range Injected Voltage, Vi (kV) | Average Peak-to-Peak Voltage, Vp-p (V) | Range Injected Voltage, Vi (kV) | Average Peak-to-Peak Voltage, Vp-p (V) | Range Injected Voltage, Vi (kV) | Average Peak-to-Peak Voltage, Vp-p (V) |
|---|
| Discharge Intensity Level | |
|---|
| Hissing | 4–19 | 5.8 | - | - | - | - |
| Discharge at pin | 10–26 | 7.1 | 6–21 | 5.3 | 3–8 | 3.3 |
| Discharge at cap | 26–31 | 7.2 | 11–28 | 8.1 | 10–18 | 4.3 |
| Severe | 24–41 | 8.7 | 20–31 | 7.6 | 19–34 | 6.9 |
Table 14.
Injected voltage and average peak-to-peak voltages of the UV signals for wet insulators conditions with heavy contamination level.
Table 14.
Injected voltage and average peak-to-peak voltages of the UV signals for wet insulators conditions with heavy contamination level.
| Sample | Group A | Group B | Group C |
|---|
| Voltage | Range Injected Voltage, Vi (kV) | Average Peak-to-Peak Voltage, Vp-p (V) | Range Injected Voltage, Vi (kV) | Average Peak-to-Peak Voltage, Vp-p (V) | Range Injected Voltage, Vi (kV) | Average Peak-to-Peak Voltage, Vp-p (V) |
|---|
| Discharge Intensity Level | |
|---|
| Hissing | - | - | - | - | - | - |
| Discharge at pin | 3–18 | 9.8 | 4–17 | 3.1 | - | - |
| Discharge at cap | 9–20 | 8.5 | 9–24 | 4.7 | 9–14 | 2.7 |
| Severe | 20–31 | 12.2 | 17–29 | 7.2 | 17–27 | 6.9 |
Table 15.
Average THD (%) for dry condition.
Table 15.
Average THD (%) for dry condition.
| Groups | A | B | C |
|---|
| Discharge Intensity Level | | Sample 1 | Sample 2 | Sample 1 | Sample 2 | Sample 1 | Sample 2 |
|---|
| Hissing | 7.90 | 7.29 | 7.65 | 7.65 | 6.79 | 7.02 |
| Discharge at Pin | 13.13 | 12.98 | 11.30 | 11.17 | 12.56 | 11.90 |
| Discharge at Cap | 15.39 | 13.73 | 13.98 | 14.57 | 14.90 | 14.46 |
| Severe | 18.96 | 18.48 | 21.77 | 19.16 | 18.03 | 17.56 |
Table 16.
Average THD (%) for wet condition.
Table 16.
Average THD (%) for wet condition.
| Groups | A | B | C |
|---|
| Discharge Intensity Level | | Sample 1 | Sample 2 | Sample 1 | Sample 2 | Sample 1 | Sample 2 |
|---|
| Hissing | 3.11 | 3.11 | 2.32 | 1.86 | 1.03 | 0.87 |
| Discharge at Pin | 9.94 | 9.72 | 9.23 | 11.45 | 6.06 | 4.2 |
| Discharge at Cap | 10.12 | 10.08 | 15.91 | 10.72 | 18.78 | 22.38 |
| Severe | 11.48 | 11.32 | 16.89 | 17.33 | 15.62 | 20.32 |
Table 17.
Artificial neural network simulation results.
Table 17.
Artificial neural network simulation results.
| Samples | Flashover Indication | Neural Network Output |
|---|
| 1 | 2 | 3 |
|---|
| Sample 1 | Warning | 0.84 | 0.00 | 0.05 |
| Sample 2 | Warning | 0.98 | 0.00 | 0.05 |
| Sample 3 | Warning | 0.93 | 0.00 | 0.10 |
| Sample 4 | Warning | 0.94 | 0.00 | 0.01 |
| Sample 5 | Warning | 0.68 | 0.00 | 0.11 |
| Sample 6 | Warning | 1.00 | 0.00 | 0.00 |
| Sample 7 | Warning | 0.94 | 0.00 | 0.06 |
| Sample 8 | Warning | 0.96 | 0.00 | 0.06 |
| Sample 9 | Warning | 0.80 | 0.00 | 0.06 |
| Sample 10 | Warning | 1.00 | 0.00 | 0.00 |
| Sample 11 | Danger (dry) | 0.00 | 0.22 | 0.77 |
| Sample 12 | Danger (dry) | 0.00 | 1.00 | 0.00 |
| Sample 13 | Danger (dry) | 0.00 | 1.00 | 0.00 |
| Sample 14 | Danger (dry) | 0.00 | 1.00 | 0.00 |
| Sample 15 | Danger (dry) | 0.00 | 0.99 | 0.02 |
| Sample 16 | Danger (dry) | 0.00 | 0.89 | 0.34 |
| Sample 17 | Danger (dry) | 0.00 | 1.00 | 0.00 |
| Sample 18 | Danger (dry) | 0.00 | 1.00 | 0.03 |
| Sample 19 | Danger (dry) | 0.00 | 1.00 | 0.00 |
| Sample 20 | Danger (dry) | 0.00 | 1.00 | 0.00 |
| Sample 21 | Danger (wet) | 0.062 | 0.01 | 0.87 |
| Sample 22 | Danger (wet) | 0.08 | 0.00 | 0.95 |
| Sample 23 | Danger (wet) | 0.00 | 0.00 | 1.00 |
| Sample 24 | Danger (wet) | 0.00 | 0.00 | 1.00 |
| Sample 25 | Danger (wet) | 0.00 | 0.00 | 1.00 |
| Sample 26 | Danger (wet) | 0.85 | 0.00 | 0.14 |
| Sample 27 | Danger (wet) | 0.88 | 0.00 | 0.19 |
| Sample 28 | Danger (wet) | 0.00 | 0.00 | 1.00 |
| Sample 29 | Danger (wet) | 0.00 | 0.00 | 1.00 |
| Sample 30 | Danger (wet) | 0.01 | 0.00 | 1.00 |

 ,
, 


