Article

Numerical Investigation on the Effects of Airfoil Leading Edge Radius on the Aerodynamic Performance of H-Rotor Darrieus Vertical Axis Wind Turbine

1
School of Electrical Engineering, Nantong University, Nantong 226019, China
2
School of Information Science and Technology, Nantong University, Nantong 226019, China
*
Author to whom correspondence should be addressed.
Energies 2019, 12(19), 3794; https://doi.org/10.3390/en12193794
Submission received: 21 August 2019 / Revised: 29 September 2019 / Accepted: 1 October 2019 / Published: 8 October 2019
(This article belongs to the Section A: Sustainable Energy)

Abstract

:
This paper numerically investigates the effects of airfoil leading edge radius on the aerodynamic characteristics of H-rotor Darrieus vertical axis wind turbine (VAWT). 10 modified airfoils are generated by changing the leading edge radius of the base NACA 0015 airfoil from 1%c to 9%c, respectively. A 2D unsteady Computational Fluid Dynamics (CFD) model is established and validated with the previously published experimental data. The power, torque, and flow field characteristics of the rotors are analyzed. The results indicate that the maximum and minimum power coefficient at the optimum tip speed ratio (TSR) are obtained for the LE-5%c and LE-1%c model, respectively. The best aerodynamic characteristics are determined by the LE-5%c model below the optimum TSR and the LE-3%c model beyond the optimum TSR. The torque characteristics and pressure distribution for the single blades with different airfoil leading edge radius show an obvious difference in the upwind region and a very small difference in the downwind region. Moreover, the airfoil leading edge radius influences the strength, region, and diffusion rate of the vortices, being the main reason for the observed differences in instantaneous torque coefficient and power coefficient. The vortices of the LE-1%c model are stronger, larger, and diffuse slower than those of the LE-2%c and LE-5%c model at the optimum TSR.

Graphical Abstract

1. Introduction

Wind turbines commonly contain two categories according to their axis orientation, namely horizontal axis wind turbine (HAWT) and vertical axis wind turbine (VAWT) [1]. Currently, HAWT is the dominant type in both onshore and offshore wind farms and is suitable for the large-scale wind power generation due to its high efficiency and mature technology [2,3]. In recent years, VAWT is receiving increased attention due to its advantages of design simplicity, easy maintenance, low manufacturing and installation cost, wind direction independency, easy scalability as well as low environmental impact and aerodynamic noise [4,5,6,7]. VAWT is more appropriate for urban applications and small to medium scale wind power generation.
There are two types of VAWT including Savonius and Darrieus wind turbine. They are drag-based and lift-based turbine, respectively. The Darrieus VAWT has higher efficiency and lower starting torque over the Savonius one [8]. As a typical type of Darrieus VAWT, H-rotor Darrieus VAWT shows a rising development recently. It has been installed not only in off-shore areas [9], but also on the ground or on the rooftop of buildings in remote and urban areas [10,11]. However, the aerodynamic characteristics of H-rotor Darrieus VAWT need to be further improved.
Employing additional devices is an effective means to enhance the aerodynamic performance of H-rotor Darrieus VAWT. The augmentation devices usually include Gurney flap [12], vortex generator [13], leading edge microcylinder [14], deflector [15], guide vane [16], duct [17], cowling [18], and wind gathering device [8]. These all contribute to improved aerodynamic characteristics of H-rotor Darrieus VAWT. However, they strongly depend on the structure of VAWTs, which may limit their applications owing to the complex construction as well as increased space and cost.
Modifying airfoil profiles is another effective means to enhance the aerodynamic performance of H-rotor Darrieus VAWT. Several research activities have been performed to investigate the effect of airfoil profile modifications on the characteristics of H-rotor Darrieus VAWTs by numerical simulations. Ismail et al. [19] studied the effects of an inward semi-circular dimple and a Gurney flap at the lower surface of the NACA 0015 aerofoil near the trailing edge on the aerodynamic performance of a VAWT blade. Bai et al. [20] and Wang et al. [21] investigated the impact of amplitude and wavelength of tubercle blades with sinusoidal leading edge on the performance of H-rotor Darrieus VAWTs. Lin et al. [22] conducted 2D CFD simulations to predict the performance of H-type Darrieus VAWT rotors using blades with tubercle trailing edge. Zamani et al. [23,24,25] employed 2D and 3D numerical simulations to evaluate the J-shaped blade in the straight-bladed Darrieus VAWTs in terms of starting torque, output torque, and power. Mohamed [26] evaluated the effects of J-shape cut ratio, speed ratio, and turbine solidity on the turbine performance and the aero-acoustics of Darrieus VAWTs. Sobhani et al. [27] created cavities with different parameters including diameter, profile, and location into blade’s profile of a Darrieus VAWT and investigated the effects of them on the turbine performance. Lositaño and Danao [28] performed 3D CFD simulations to investigate the performance of a 5 kW three-bladed H-rotor Darrieus VAWT with cambered tubercle leading edge NACA 0025 blades. Previous researches have shown several effective airfoil profile modifications to improve the aerodynamic characteristics of H-rotor Darrieus VAWT. They are relatively simple, cheap, and need no extra device.
However, to the authors’ best knowledge, very limited studies have been made previously in the modifications of airfoil leading edge radius, which can significantly affect the aerodynamic characteristics of the turbine blade. The present study attempts to investigate the effects of airfoil leading edge radius on the aerodynamic characteristics of H-rotor Darrieus VAWT. The modified airfoils are generated by changing the leading edge radius of the base NACA 0015 airfoil from 1%c to 9%c, respectively. A number of 2D CFD simulations are conducted to gain a better understanding of a detailed flow behavior. The power, torque, and flow field characteristics of the rotors equipped with the modified airfoils are analyzed accordingly. The present research provides a new understanding of the influence of airfoil leading edge radius on the aerodynamic characteristics of H-rotor Darrieus VAWT and its potential to offer a new guidance for the design of Darrieus VAWT.

2. Airfoil Modification Scheme

In the present study, NACA 0015 airfoil is served as the base airfoil. 10 modified airfoils are generated by changing the leading edge radius of the base airfoil from 1%c to 9%c, respectively. The characteristics of modified airfoils are listed in Table 1. Figure 1 shows the geometric profiles of the airfoils with modified leading edge.

3. CFD Simulations

3.1. Geometric Modeling

Geometric modeling is conducted in Gambit. Table 2 gives the design parameters of the calculated VAWT. The wind velocity is 8 m/s. The blade number is 3. The rotor diameter and blade chord length are 1650 mm and 375 mm. The installation angle is 0°. The blades are connected to rotor arms at 30% of the chord length. 2D numerical simulations are performed. The main shaft and rotor arms are not included in the modeling. The schematic of computational region is shown in Figure 2. As can be seen, two regions are included in the computational region, namely an inner circular rotating region and an outer rectangular stationary region. The diameter of the rotating region is specified to be 1.5D. Three blades revolve counterclockwise around the center. The dimension of the stationary region is 15D × 10D (length × width).

3.2. Numerical Settings

Numerical simulations are conducted in Fluent software from ANSYS 15.0 package. The main settings are listed in Table 3. The boundary types of inlet, outlet, lateral sides, blades, and the contact region for rotating and stationary region are set as velocity inlet, pressure outlet, symmetry, non-slip wall, and interface, respectively. The rotating region revolves at an angular velocity depending on the rotor’s operation TSR with the help of sliding mesh technique. The Realizable k-ε model [29] is employed to simulate the turbulent flow in the present study. The Semi-Implicit Method for Pressure-Linked Equations (SIMPLE) scheme is used to solve the incompressible Unsteady Reynolds-Averaged Navier-Stokes (URANS) equations. Detailed descriptions of the turbulence model and governing equations are available in [30]. The second-order spatial and temporal discretization schemes are employed. The physical time step is set as T/360, where T is the rotation period of rotor. The maximum iteration number in each time step is set as 40, so that the residuals are lower than 10−4.
A number of simulations are performed under different operating conditions with TSR varying from 0.5 to 3.0. For each case, the instantaneous torque coefficient of each blade in each time step is monitored and recorded via the Fluent solver. The simulation is considered to be stable in the tenth rotor revolution as the difference of calculating parameters between two subsequent revolutions is smaller than 1%. After 10 rotor revolutions, the average torque coefficient during a rotation period for a particular operating condition, Cm,avg, is obtained. After that, the power coefficient, CP, is derived according to Equation (1).
CP = TSR · Cm,avg,
All simulations are performed on an Intel Core i7 processor with quad cores, 3.70 GHz of clock frequency and 16.0 GB of RAM memory. The CPU time required for each simulation is about one day.

3.3. Mesh Independence Study

Mesh is also implemented in Gambit. In order to investigate the influence of computational grid on the calculation results, simulations are conducted on four different grids. Details of the computational grids are listed in Table 4. The maximum y+ values on the surfaces of airfoils for four different grids are less than 10, which indicate acceptable resolution of boundary layer cells. The instantaneous torque coefficients and average torque coefficients of the rotor in the tenth revolution for different grids at TSR = 2.0 are compared as shown in Figure 3. The azimuth angle, θ, is defined in Figure 4.
It can be seen from Figure 3 that the instantaneous torque coefficient curve moves up with the increase of total number of cells. When the total number of cells is 45202, the curve deviates further with the other three curves. While the curve of mesh G3 is almost coincided with that of G4. The relative errors of the instantaneous torque coefficients and average torque coefficients between mesh G3 and G4 are smaller than 4% and 1%, respectively. Consequently, mesh G3 is selected for the following simulations. Figure 5 shows the detailed grids of the rotor designed by LE-5%c airfoil using mesh G3. The computational region is meshed by both structured and unstructured grid. For the areas around blades, unstructured grid is adopted. While for the rest of the computational region, structured grid is used. In order to capture accurate aerodynamic characteristics, mesh is refined around the blades, especially in the vicinity of leading and trailing edge.

3.4. Computational Model Validation

In order to verify the accuracy of the computational model, the calculation results of the CFD model are compared with the experimental data of Castelli et al. [31]. Figure 6 shows a comparison of the calculation results and experimental data. As can be seen, they are in good agreement with a maximum difference of 15.252% at TSR = 3.214. The computational model can well predict the optimum TSR. The main reason for the overprediction of the power coefficient obtained by the 2D CFD model is the neglect of the losses of blade tips and main shaft as well as rotor arms.

4. Results and Discussion

The power, torque, and flow field characteristics of the rotors with different airfoil leading edge radius are analyzed in the following part.

4.1. Power Characteristics

Figure 7 shows the variation of CP with respect to TSR for the rotors with different airfoil leading edge radius. It can be seen that for all the rotors, CP first increases to a maximum value and then decreases with an increase of TSR. The optimum TSR is found to be invariant to the airfoil leading edge radius and appears to be near 2.0 for all the rotors. For TSR lower than 2.0, the airfoil leading edge radius is optimized to be 5%. NACA 0015 airfoil shows worse performance than the airfoils with leading edge radius larger than 2%c. For TSR higher than 2.0, the airfoil leading edge radius of 3%c is the most appropriate option. NACA 0015 airfoil performs better than all the airfoils except the LE-3%c airfoil. Moreover, there is a large change between the results of the LE-1%c and LE-2%c model. Figure 8 shows the variation of CP max with respect to 100RLE/c for the rotors with different airfoil leading edge radius. As can be seen, CP max first increases rapidly to a maximum value, and then decreases slowly, with an increase of the airfoil leading edge radius. The maximum and minimum value of CP max are observed to be 0.360 and 0.190 for the LE-5%c and LE-1%c model, respectively.

4.2. Torque Characteristics

To better understand investigate the behavior observed in Figure 7, the variation of instantaneous torque coefficient, Cm, with respect to azimuth angle, θ, is analyzed. The models of LE-1%c, LE-2%c, LE-3%c, and LE-5%c are chosen as examples in the following part. Since the optimum TSR is near 2.0, the torque characteristics for TSR = 2.0 are studied. Figure 9 shows the polar charts of Cm with respect to θ for the rotors and blade 1 with different airfoil leading edge radius during one rotational period at TSR = 2.0. Moreover, the torque characteristics for TSR = 1.5 and TSR = 2.5 are discussed as examples below and beyond optimum TSR. Figure 10 and Figure 11 show the polar charts of Cm with respect to θ for the rotors and blade 1 with different airfoil leading edge radius during one rotational period at TSR = 1.5 and TSR = 2.5, respectively.
Figure 9a shows that each curve repeats after every 120°. This is because the present wind turbine contains three blades. For the rotor with airfoil leading edge radius of 5%c, the value of Cm is larger and remains positive during the most rotational period. The difference of Cm between the LE-2%c and LE-5%c model is small. While for the rotor with airfoil leading edge radius of 1%c, nearly 135° of rotor revolution shows negative value for Cm. The maximum instantaneous torque coefficients are located near the points of θ = 95°, 215°, and 335° with values of 0.317, 0.356, and 0.353 for the LE-1%c, LE-2%c, and LE-5%c model, respectively. The minimum instantaneous torque coefficients are located near the points of θ = 40°, 160°, and 280° with values of −0.094, −0.041, and −0.017 for the LE-1%c, LE-2%c, and LE-5%c model, respectively. In general, the best torque characteristics are provided by the LE-5%c model.
Figure 9b shows that the torque characteristics for blade 1 in the upwind region are far superior to that in the downwind side. In the most upwind region, the instantaneous torque coefficient is positive, while in the downwind region, it is negative. This is mainly due to a weakened wind speed of the latter. From the azimuth angle of 30°, with the increase of azimuth angle, the instantaneous torque coefficient grows constantly and peaks at θ = 103°. The maximum instantaneous torque coefficients for blade 1 are 0.451, 0.483, and 0.497 for the LE-1%c, LE-2%c, and LE-5%c model, respectively. It decreases until the azimuth angle reaches 180°. After that, the instantaneous torque coefficient increases slightly from the azimuth angle of 180° to 210° and decreases further until the rotational period finishes. It can be seen from Figure 9b that the differences of three curves are particularly obvious in the upwind region. The largest discrepancy of them is located at θ = 103°. While in the downwind region, the instantaneous torque coefficients for blade 1 of three profiles are almost identical. Overall, the LE-5%c model predicts the best torque characteristics for blade 1 during one rotational period at TSR = 2.0, whereas the LE-1%c model gets the worst.
In Figure 10 and Figure 11, a similar trend with Figure 9 is noticed. Obviously, at TSR = 1.5, the best and worst torque characteristics occur for the LE-5%c and LE-1%c model, respectively. At TSR = 2.5, the LE-3%c model performs the best, while the LE-1%c model performs the worst. This is in agreement with the results of Figure 7, confirming that the most suitable airfoil leading edge radius is 5%c for TSR lower than 2.0 and 3%c for TSR higher than 2.0.

4.3. Flow Field Characteristics

To understand the variations and discrepancies of instantaneous torque coefficient for blade 1 with different airfoil leading edge radius, the vorticity field and pressure distribution are calculated and compared. The operating condition of TSR = 2.0 is selected. The models of LE-1%c, LE-2%c, and LE-5%c are taken, for example.

4.3.1. Vorticity Field

Figure 12 presents the instantaneous contours of vorticity magnitude around the blades with different airfoil leading edge radius at TSR = 2.0 at azimuth angles of 0°, 30°, 60°, 90°, and 103°. During the whole rotational period, a periodic vortex shedding phenomenon is observed on the surface of blade 1. From the azimuth angle of 0° to 103°, the flow always attaches on the surface of blade 1, indicating that a maximum instantaneous torque coefficient is generated at θ = 103°. This has been confirmed from Figure 9b. Meanwhile, the vortices of the LE-1%c, LE-2%c, and LE-5%c model around blade 1 show a very small difference, suggesting that the discrepancies of instantaneous torque coefficient for blade 1 among the three models are negligible. Afterwards, a large area of vortices appears on the inner surface of blade 1. The vortices further develop with the rotation of blade 1 and extend over a large region, leading to a vortex shedding. These contribute to a decrease in the instantaneous torque coefficient of blade 1 from the azimuth angle of 103° to 180°. The vortices continue to shed until the azimuth angle reaches 270°. The shed vortices dissipate and fade away gradually in the downstream regions due to the occurrence of the interactions with free stream. From the azimuth angle of 270° to 360°, the flow gradually reattaches to the surface of blade 1. In general, the vortices of the LE-1%c model are stronger, larger, and diffuse slower than those of the LE-2%c and LE-5%c model, which is the main reason for the observed differences in instantaneous torque coefficient of Figure 9b. All these results indicate that the best aerodynamic performance is achieved by the LE-5%c model at TSR = 2.0.

4.3.2. Pressure Distribution

Figure 13 shows the contours of pressure distribution of blade 1 with different airfoil leading edge radius during one rotational period at TSR = 2.0. As can be seen, an obvious difference between the LE-1%c and LE-5%c model exists in the upwind region. With the increase of azimuth angle, the scope and value of the pressure on the suction side first decrease to the minimum and then increase, while those on the pressure side show an opposite trend. The minimum and maximum value of the pressure appear at the azimuth angle of 103°. In the downwind region, a very small difference between two models is found. The pressure differences between the pressure side and suction side are small, indicating poor torque characteristics for blade 1 of both two models. This is in accordance with the trend of instantaneous torque coefficient of blade 1 in Figure 9b.

5. Conclusions

In this paper, the airfoil leading edge radius is studied by calculating the aerodynamic characteristics of H-rotor Darrieus VAWTs equipped with 10 airfoils with varying leading edge radius by 2D unsteady CFD simulations. The modified airfoils are generated by changing the leading edge radius of the base NACA 0015 airfoil from 1%c to 9%c. The CFD model is established and validated with the previously published experimental data. The power coefficient under different TSRs and the torque coefficient for the rotors and single blade under different azimuth angles are compared. The vorticity field and pressure distribution around the blades with different airfoil leading edge radius are analyzed to uncover the variations and discrepancies of instantaneous torque coefficient among them. The main findings of this study are summarized as follows:
  • The computational model validation study shows that the present 2D CFD model is applicable to the performance prediction of H-rotor Darrieus VAWT. The overprediction of the power coefficient is due to the neglect of the losses of blade tips and main shaft as well as rotor arms.
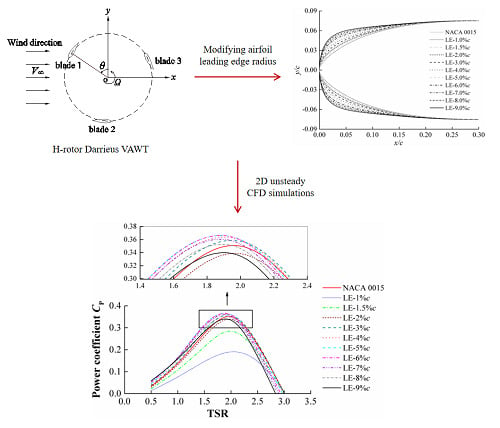
  • The optimum TSR is invariant to the airfoil leading edge radius of H-rotor Darrieus VAWT. The best aerodynamic characteristics are achieved by the LE-5%c model below the optimum TSR and the LE-3%c model beyond the optimum TSR.
  • CPmax first increases rapidly to a maximum value, and then decreases slowly, with an increase of the airfoil leading edge radius. The maximum and minimum value of CP max are obtained for the LE-5%c and LE-1%c model, respectively.
  • The torque characteristics and pressure distribution for the single blades with different airfoil leading edge radius show an obvious difference in the upwind region, and a very small difference in the downwind region.
  • The airfoil leading edge radius influences the strength, region, and diffusion rate of the vortices, being the main reason for the observed differences in instantaneous torque coefficient and power coefficient. The vortices of the LE-1%c model are stronger, larger, and diffuse slower than those of the LE-2%c and LE-5%c model at the optimum TSR.
Further studies are in progress on the effect of trailing edge thickness and angle on the characteristics of H-rotor Darrieus VAWTs by CFD simulations, which may provide a better guidance for the airfoil design of Darrieus VAWTs.

Author Contributions

Data curation, G.W.; Validation, W.Z.; Visualization, X.Z.; Writing—original draft, C.S.; Writing—review & editing, J.Z.

Funding

This research was funded by the Natural Science Foundation of the Jiangsu Higher Education Institutions of China, grant number 18KJB470021.

Conflicts of Interest

The authors declare no conflict of interest.

References

  1. Saeidi, D.; Sedaghat, A.; Alamdari, P.; Alemrajabi, A.A. Aerodynamic design and economical evaluation of site specific small vertical axis wind turbines. Appl. Energy 2013, 101, 765–775. [Google Scholar] [CrossRef]
  2. Guo, J.; Zeng, P.; Lei, L. Performance of a straight-bladed vertical axis wind turbine with inclined pitch axes by wind tunnel experiments. Energy 2019, 174, 553–561. [Google Scholar] [CrossRef]
  3. Hui, I.; Cain, B.E.; Dabiri, J.O. Public receptiveness of vertical axis wind turbines. Energy Policy 2018, 112, 258–271. [Google Scholar] [CrossRef]
  4. Bangga, G.; Lutz, T.; Dessoky, A.; Krämer, E. Unsteady Navier-Stokes studies on loads, wake, and dynamic stall characteristics of a two-bladed vertical axis wind turbine. J. Renew. Sustain. Energy 2017, 9, 053303. [Google Scholar] [CrossRef] [Green Version]
  5. Li, Q.; Maeda, T.; Kamada, Y.; Hiromori, Y.; Nakai, A.; Kasuya, T. Study on stall behavior of a straight-bladed vertical axis wind turbine with numerical and experimental investigations. J. Wind Eng. Ind. Aerodyn. 2017, 164, 1–12. [Google Scholar] [CrossRef]
  6. Douak, M.; Aouachria, Z.; Rabehi, R.; Allam, N. Wind energy systems: Analysis of the self-starting physics of vertical axis wind turbine. Renew. Sustain. Energy Rev. 2018, 81, 1602–1610. [Google Scholar] [CrossRef]
  7. Wang, Y.; Shen, S.; Li, G.; Huang, D.; Zheng, Z. Investigation on aerodynamic performance of vertical axis wind turbine with different series airfoil shapes. Renew. Energy 2018, 126, 801–818. [Google Scholar] [CrossRef]
  8. Dessoky, A.; Bangga, G.; Lutz, T.; Krämer, E. Aerodynamic and aeroacoustic performance assessment of H-rotor darrieus VAWT equipped with wind-lens technology. Energy 2019, 175, 76–97. [Google Scholar] [CrossRef]
  9. Tjiu, W.; Marnoto, T.; Mat, S.; Ruslan, M.H.; Sopian, K. Darrieus vertical axis wind turbine for power generation II: Challenges in HAWT and the opportunity of multi-megawatt Darrieus VAWT development. Renew. Energy 2015, 75, 560–571. [Google Scholar] [CrossRef]
  10. Chong, W.T.; Wang, X.H.; Wong, K.H.; Mojumder, J.C.; Poh, S.C.; Saw, L.H.; Lai, S.H. Performance assessment of a hybrid solar-wind-rain eco-roof system for buildings. Energy Build. 2016, 127, 1028–1042. [Google Scholar] [CrossRef]
  11. Kumar, R.; Raahemifar, K.; Fung, A.S. A critical review of vertical axis wind turbines for urban applications. Renew. Sustain. Energy Rev. 2018, 89, 281–291. [Google Scholar] [CrossRef]
  12. Shukla, V.; Kaviti, A.K. Performance evaluation of profile modifications on straight-bladed vertical axis wind turbine by energy and Spalart Allmaras models. Energy 2017, 126, 766–795. [Google Scholar] [CrossRef]
  13. Bak, C.; Skrzypiński, W.; Fischer, A.; Gaunaa, M.; Brønnum, N.F.; Kruse, E.K. Wind tunnel tests of an airfoil with 18% relative thickness equipped with vortex generators. J. Phys. Conf. Ser. 2018, 1037, 022044. [Google Scholar] [CrossRef]
  14. Luo, D.; Huang, D.; Sun, X. Passive flow control of a stalled airfoil using a microcylinder. J. Wind Eng. Ind. Aerodyn. 2017, 170, 256–273. [Google Scholar] [CrossRef]
  15. Wong, K.H.; Chong, W.T.; Poh, S.C.; Shiah, Y.C.; Sukiman, N.L.; Wang, C.T. 3D CFD simulation and parametric study of a flat plate deflector for vertical axis wind turbine. Renew. Energy 2018, 129, 32–55. [Google Scholar] [CrossRef]
  16. Shahizare, B.; Nik-Ghazali, N.; Chong, W.T.; Tabatabaeikia, S.; Izadyar, N.; Esmaeilzadeh, A. Novel investigation of the different Omni-direction-guide-vane angles effects on the urban vertical axis wind turbine output power via three-dimensional numerical simulation. Energy Convers. Manag. 2016, 117, 206–217. [Google Scholar] [CrossRef]
  17. Santoli, L.D.; Albo, A.; Garcia, D.A.; Bruschi, D.; Cumo, F. A preliminary energy and environmental assessment of a micro wind turbine prototype in natural protected areas. Sustain. Energy Technol. Assess. 2014, 8, 42–56. [Google Scholar] [CrossRef]
  18. Loganathan, B.; Chowdhury, H.; Mustary, I.; Alam, F. An experimental study of a cyclonic vertical axis wind turbine for domestic scale power generation. Procedia Eng. 2015, 105, 686–691. [Google Scholar] [CrossRef]
  19. Ismail, M.F.; Vijayaraghavan, K. The effects of aerofoil profile modification on a vertical axis wind turbine performance. Energy 2015, 80, 20–31. [Google Scholar] [CrossRef]
  20. Bai, C.J.; Lin, Y.Y.; Lin, S.Y.; Wang, W.C. Computational fluid dynamics analysis of the vertical axis wind turbine blade with tubercle leading edge. J. Renew. Sustain. Energy 2015, 7, 033124. [Google Scholar] [CrossRef]
  21. Wang, Z.; Zhuang, M. Leading-edge serrations for performance improvement on a vertical-axis wind turbine at low tip-speed-ratios. Appl. Energy 2017, 208, 1184–1197. [Google Scholar] [CrossRef]
  22. Lin, S.Y.; Lin, Y.Y.; Bai, C.J.; Wang, W.C. Performance analysis of vertical-axis-wind-turbine blade with modified trailing edge through computational fluid dynamics. Renew. Energy 2016, 99, 654–662. [Google Scholar] [CrossRef]
  23. Zamani, M.; Nazari, S.; Moshizi, S.A.; Maghrebi, M.J. Three dimensional simulation of J-shaped Darrieus vertical axis wind turbine. Energy 2016, 116, 1243–1255. [Google Scholar] [CrossRef]
  24. Zamani, M.; Maghrebi, M.J.; Varedi, S.R. Starting torque improvement using J-shaped straight-bladed Darrieus vertical axis wind turbine by means of numerical simulation. Renew. Energy 2016, 95, 109–126. [Google Scholar] [CrossRef]
  25. Zamani, M.; Maghrebi, M.J.; Moshizi, S.A. Numerical study of airfoil thickness effects on the performance of J-shaped straight blade vertical axis wind turbine. Wind Struct. 2016, 22, 595–616. [Google Scholar] [CrossRef]
  26. Mohamed, M.H. Criticism study of J-Shaped darrieus wind turbine: Performance evaluation and noise generation assessment. Energy 2019, 177, 367–385. [Google Scholar] [CrossRef]
  27. Sobhani, E.; Ghaffari, M.; Maghrebi, M.J. Numerical investigation of dimple effects on darrieus vertical axis wind turbine. Energy 2017, 133, 231–241. [Google Scholar] [CrossRef]
  28. Lositaño, I.C.M.; Danao, L.A.M. Steady wind performance of a 5 kW three-bladed H-rotor Darrieus Vertical Axis Wind Turbine (VAWT) with cambered tubercle leading edge (TLE) blades. Energy 2019, 175, 278–291. [Google Scholar] [CrossRef]
  29. Shih, T.H.; Liou, W.W.; Shabbir, A.; Yang, Z.; Zhu, J. A new k-e eddy viscosity model for high Reynolds number turbulent flows. Comput. Fluids 1995, 24, 227–238. [Google Scholar] [CrossRef]
  30. Song, C.; Zheng, Y.; Zhao, Z.; Zhang, Y.; Li, C.; Jiang, H. Investigation of meshing strategies and turbulence models of CFD simulations of vertical axis wind turbine. J. Renew. Sustain. Energy 2015, 7, 033111. [Google Scholar] [CrossRef]
  31. Castelli, M.R.; Englaro, A.; Benini, E. The Darrieus wind turbine: Proposal for a new performance prediction model based on CFD. Energy 2011, 36, 4919–4934. [Google Scholar] [CrossRef]
Figure 1. Geometric profiles of the airfoils with modified leading edge.
Energies 12 03794 g001
Figure 2. Schematic of computational region.
Energies 12 03794 g002
Figure 3. Simulation results of (a) Cm and (b) Cm,avg for four grids.
Energies 12 03794 g003
Figure 4. Definition of azimuth angle.
Energies 12 03794 g004
Figure 5. Detailed grids of the LE-5%c model (a) entire grids of computational region; (b) grids of rotating region; (c) grids around airfoil.
Energies 12 03794 g005
Figure 6. Comparison of calculation results and experimental data.
Energies 12 03794 g006
Figure 7. Variation of CP with respect to TSR for the rotors with different airfoil leading edge radius.
Energies 12 03794 g007
Figure 8. Variation of CP max with respect to 100RLE/c for the rotors with different airfoil leading edge radius.
Energies 12 03794 g008
Figure 9. Variation of Cm with respect to θ during one rotational period at TSR = 2.0 for (a) the rotor; (b) blade 1.
Energies 12 03794 g009
Figure 10. Variation of Cm with respect to θ during one rotational period at TSR = 1.5 for (a) the rotor; (b) blade 1.
Energies 12 03794 g010
Figure 11. Variation of Cm with respect to θ during one rotational period at TSR = 2.5 for (a) the rotor; (b) blade 1.
Energies 12 03794 g011
Figure 12. Instantaneous contours of vorticity magnitude around the blades with different airfoil leading edge radius at TSR = 2.0 at azimuth angles of 0°, 30°, 60°, 90°, and 103°.
Energies 12 03794 g012
Figure 13. Contours of pressure distribution of blade 1 with different airfoil leading edge radius during one rotational period at TSR = 2.0.
Energies 12 03794 g013
Table 1. Characteristics of modified airfoils.
ParameterSymbolValueName
Leading edge radius (m)RLE1%cLE-1%c
1.5%cLE-1.5%c
2%cLE-2%c
3%cLE-3%c
4%cLE-4%c
5%cLE-5%c
6%cLE-6%c
7%cLE-7%c
8%cLE-8%c
9%cLE-9%c
Table 2. Design parameters of VAWT.
ParametersSymbolValue
Wind velocity (m/s)V8
Blade number (-)N3
Rotor diameter (mm)D1650
Rotor height (mm)H1 (2D simulation)
Blade chord length (mm)c375
Installation angle (°)γ0
Blade attachment (mm)-30%c
Table 3. Numerical settings of VAWT.
ParametersValue
Air density (kg/m3)1.225
Air viscosity (kg/m·s)1.7894 × 10−5
Boundary type of inletVelocity inlet, 8 m/s
Boundary type of outletPressure outlet
Boundary type of lateral sidesSymmetry
Boundary type of bladesNo-slip wall
Boundary type of contact region for rotating and stationary regionSliding grid interface
Solver typePressure Based
Viscous modelRealizable k-ε
Pressure—velocity coupling schemeSIMPLE
Gradient discretization schemeGreen-Gauss Node Based
Pressure discretization schemeStandard
Convective term discretization schemeSecond order upwind
Residual error1 × 10−4
Physical time stepT/360
Table 4. Details of four computational grids.
Grid No.Node Number on the Airfoil
(Suction Surface × Pressure Surface)
Total Number of CellsMaximum y+ on Airfoils
G150 × 50452029.5
G2100 × 100912248.1
G3200 × 2001890146.2
G4300 × 3003229615.0

