Article

A Comprehensive Evaluation Model for Curtain Grouting Efficiency Assessment Based on Prospect Theory and Interval-Valued Intuitionistic Fuzzy Sets Extended by Improved D Numbers

State Key Laboratory of Hydraulic Engineering Simulation and Safety, Tianjin University, Tianjin 300072, China
*
Author to whom correspondence should be addressed.
Energies 2019, 12(19), 3674; https://doi.org/10.3390/en12193674
Submission received: 29 August 2019 / Revised: 12 September 2019 / Accepted: 23 September 2019 / Published: 25 September 2019

Abstract

:
Grouting-efficiency evaluation is a key element in grouting-construction control. However, most existing grouting-efficiency evaluation models do not consider the hesitation and bounded rationality of experts and have difficulty in handling the problem of incomplete decision-making information generated by experts. Furthermore, the diversity of the evaluation indicators used can be further improved. This study conducts a comprehensive evaluation model to address these problems. An objective and reasonable fuzzy evaluation method is demonstrated through the integration of interval-valued intuitionistic fuzzy sets, prospect theory, and improved D numbers. The secondary permeability index is introduced to establish a more scientific evaluation indicator system. The proposed model is implemented in evaluating the curtain-grouting efficiency of a hydropower station, and its consistency, representativeness, and superiority are validated and analyzed.

1. Introduction

The construction efficiency of curtain grouting is a key point of construction quality control in hydraulic engineering [1]. The efficiency of the grouting depends on whether the voids and fractures in the dam foundation are completely filled by the cement [2]. However, it is impossible to observe the success of permeability reduction and seepage prevention because the grouting construction is an underground concealed project, and thus, grouting construction is often considered to be an art, rather than a technique [3]. Therefore, it is of great theoretical and practical significance to effectively evaluate the efficiency of grouting construction.
Conventional methods for grouting-efficiency evaluation include theoretical analysis [4], numerical simulation [5], laboratory tests [6], and field tests [7]. Kvartsberg et al. [4] established the concept of flow properties of a hydraulically conductive fracture system and used it to evaluate the suitability of grouting designs. Lisa et al. [8] suggested that grouting design should be adapted to the distribution of the fracture system in the rock. Alberti et al. [5] studied the influences of grouting material on borehole heat-exchanger performance by numerical simulation. Kim et al. [9] investigated the interaction of pressure grouting and rocks by laboratory tests. Le et al. [10] concluded that the type of grouting material plays an important role in improving the uniaxial compressive strength through a series of laboratory tests. All the above studies can be used to achieve the evaluation of grouting efficiency, which provides a useful reference for this research. However, as these theoretical analyses, numerical simulations, and laboratory tests are based on certain assumptions, which are different from the construction site, they are difficult to apply to real grouting construction sites.
In recent years, the permeability (Lugeon, LU) obtained by a water-pressure test (WPT) has been widely used to evaluate grouting efficiency [11,12]. Saeidi et al. [13] evaluated the permeability and hydraulic conductivity conditions of a dam site based on WPT. Lisa et al. [14] presented a method to decide whether to grout at the tunnel grouting construction stage based on water-pressure tests of front boreholes. Sadeghiyeh et al. [15] used the hydromechanical behavior of the rock to determine both the water flow and grout pressurized flow. Based on the results of water-pressure tests, Butrón et al. [16] provided reasonable parameters for grouting design. However, the water-pressure test can only reflect the permeability of the rock mass and cannot reflect the filling condition of the rock fracture and potential seepage channel. Therefore, geophysical methods such as core drilling [17], borehole television imaging [18], and acoustic-wave tests [9] have been applied to detect grouting efficiency. Core drilling can intuitively reflect the filling of fractures, whereas borehole television imaging can reflect the rock mass state of the hole wall in an all-round manner and truly reproduce the construction efficiency. Funehag et al. [19] described how the design of grouting was coupled with the actual grouting procedure and evaluated the fracture aperture distribution by evaluation of the rock core. Hernqvist et al. [20] evaluated the efficiency of tunnel curtain grouting using the borehole core. Chen et al. [21] examined the correlation between acoustic velocity (V) and deformation modulus and established the relationship between the V of rock masses before and after consolidation grouting. Wang et al. [22] studied the long-term deformation tendency and damage zone using the acoustic-wave test technique. Zolfaghari et al. [23] calculated the rock mass deformation modulus by using a Q-system. Lynch et al. applied 3-D seismic tomography to estimate the grouting quality. Bryson et al. [24] developed a lab-scale model to assess seepage behavior by using electrical conductivity measurements. These studies on the curtain-grouting efficiency evaluation mostly evaluated the grouting efficiency through a separate analysis of the results obtained by different detection methods. There are also multi-indicator evaluation studies: Wang et al. [25] employed physical exploration, hole verification, the permeability coefficient, and P-Q-t to evaluate the grouting effects on floor undulation while water inflows were monitored. From the perspective of permeability and tightness, Fan et al. [26] comprehensively considered the indicators of permeability (Lugeon, LU), fracture-filled rate (FFR), and rock-quality designation (RQD). Then, based on the analytic hierarchy process (AHP) extended by D numbers (D-AHP) to determine the weights of the indicators, they proposed a hybrid fuzzy evaluation method for grouting efficiency. Zhu et al. [27] considered the randomness in problems caused by subjective consciousness and the fuzziness in problems caused by complex relationships among indicators and proposed the curtain-grouting efficiency evaluation method based on a cloud model.
The development of grouting-construction efficiency evaluation can be divided into three stages: (1) evaluation of the grouting-construction efficiency based on the Lugeon value of the rock mass by water-pressure tests [12,13,14,15,16]; (2) evaluation of the grouting efficiency through a separate analysis of the results obtained by different detection methods, such as core drilling, borehole television, and acoustic velocity tests [17,18,19,20,21,22,23,24]; and (3) evaluation of the grouting efficiency by expert decision-making methods, based on comprehensive consideration of multiple indicators [25,26,27]. Although scientists have conducted extensive research in the field of grouting-efficiency evaluation, the existing research still has the following shortcomings:
  • The existing evaluation methods for grouting efficiency do not consider the hesitation and bounded rationality of experts, and it is difficult to handle the problem of incomplete decision-making information when using them. Due to the redundancy of information, incompleteness of expert knowledge, and effect of the decision-making environment, the experts will hesitate [28], have bounded rationality [29] in the decision-making process, and may even forfeit the evaluation. Existing grouting-efficiency evaluation methods have difficulty in considering such hesitation and bounded rationality and have difficulty in handling the incomplete information generated by the experts after they have forfeited the evaluation, which causes a lack of rationality and objectivity in the evaluation results. Therefore, it is very important to use scientific methods to evaluate the grouting efficiency and to obtain reasonable and objective evaluation results.
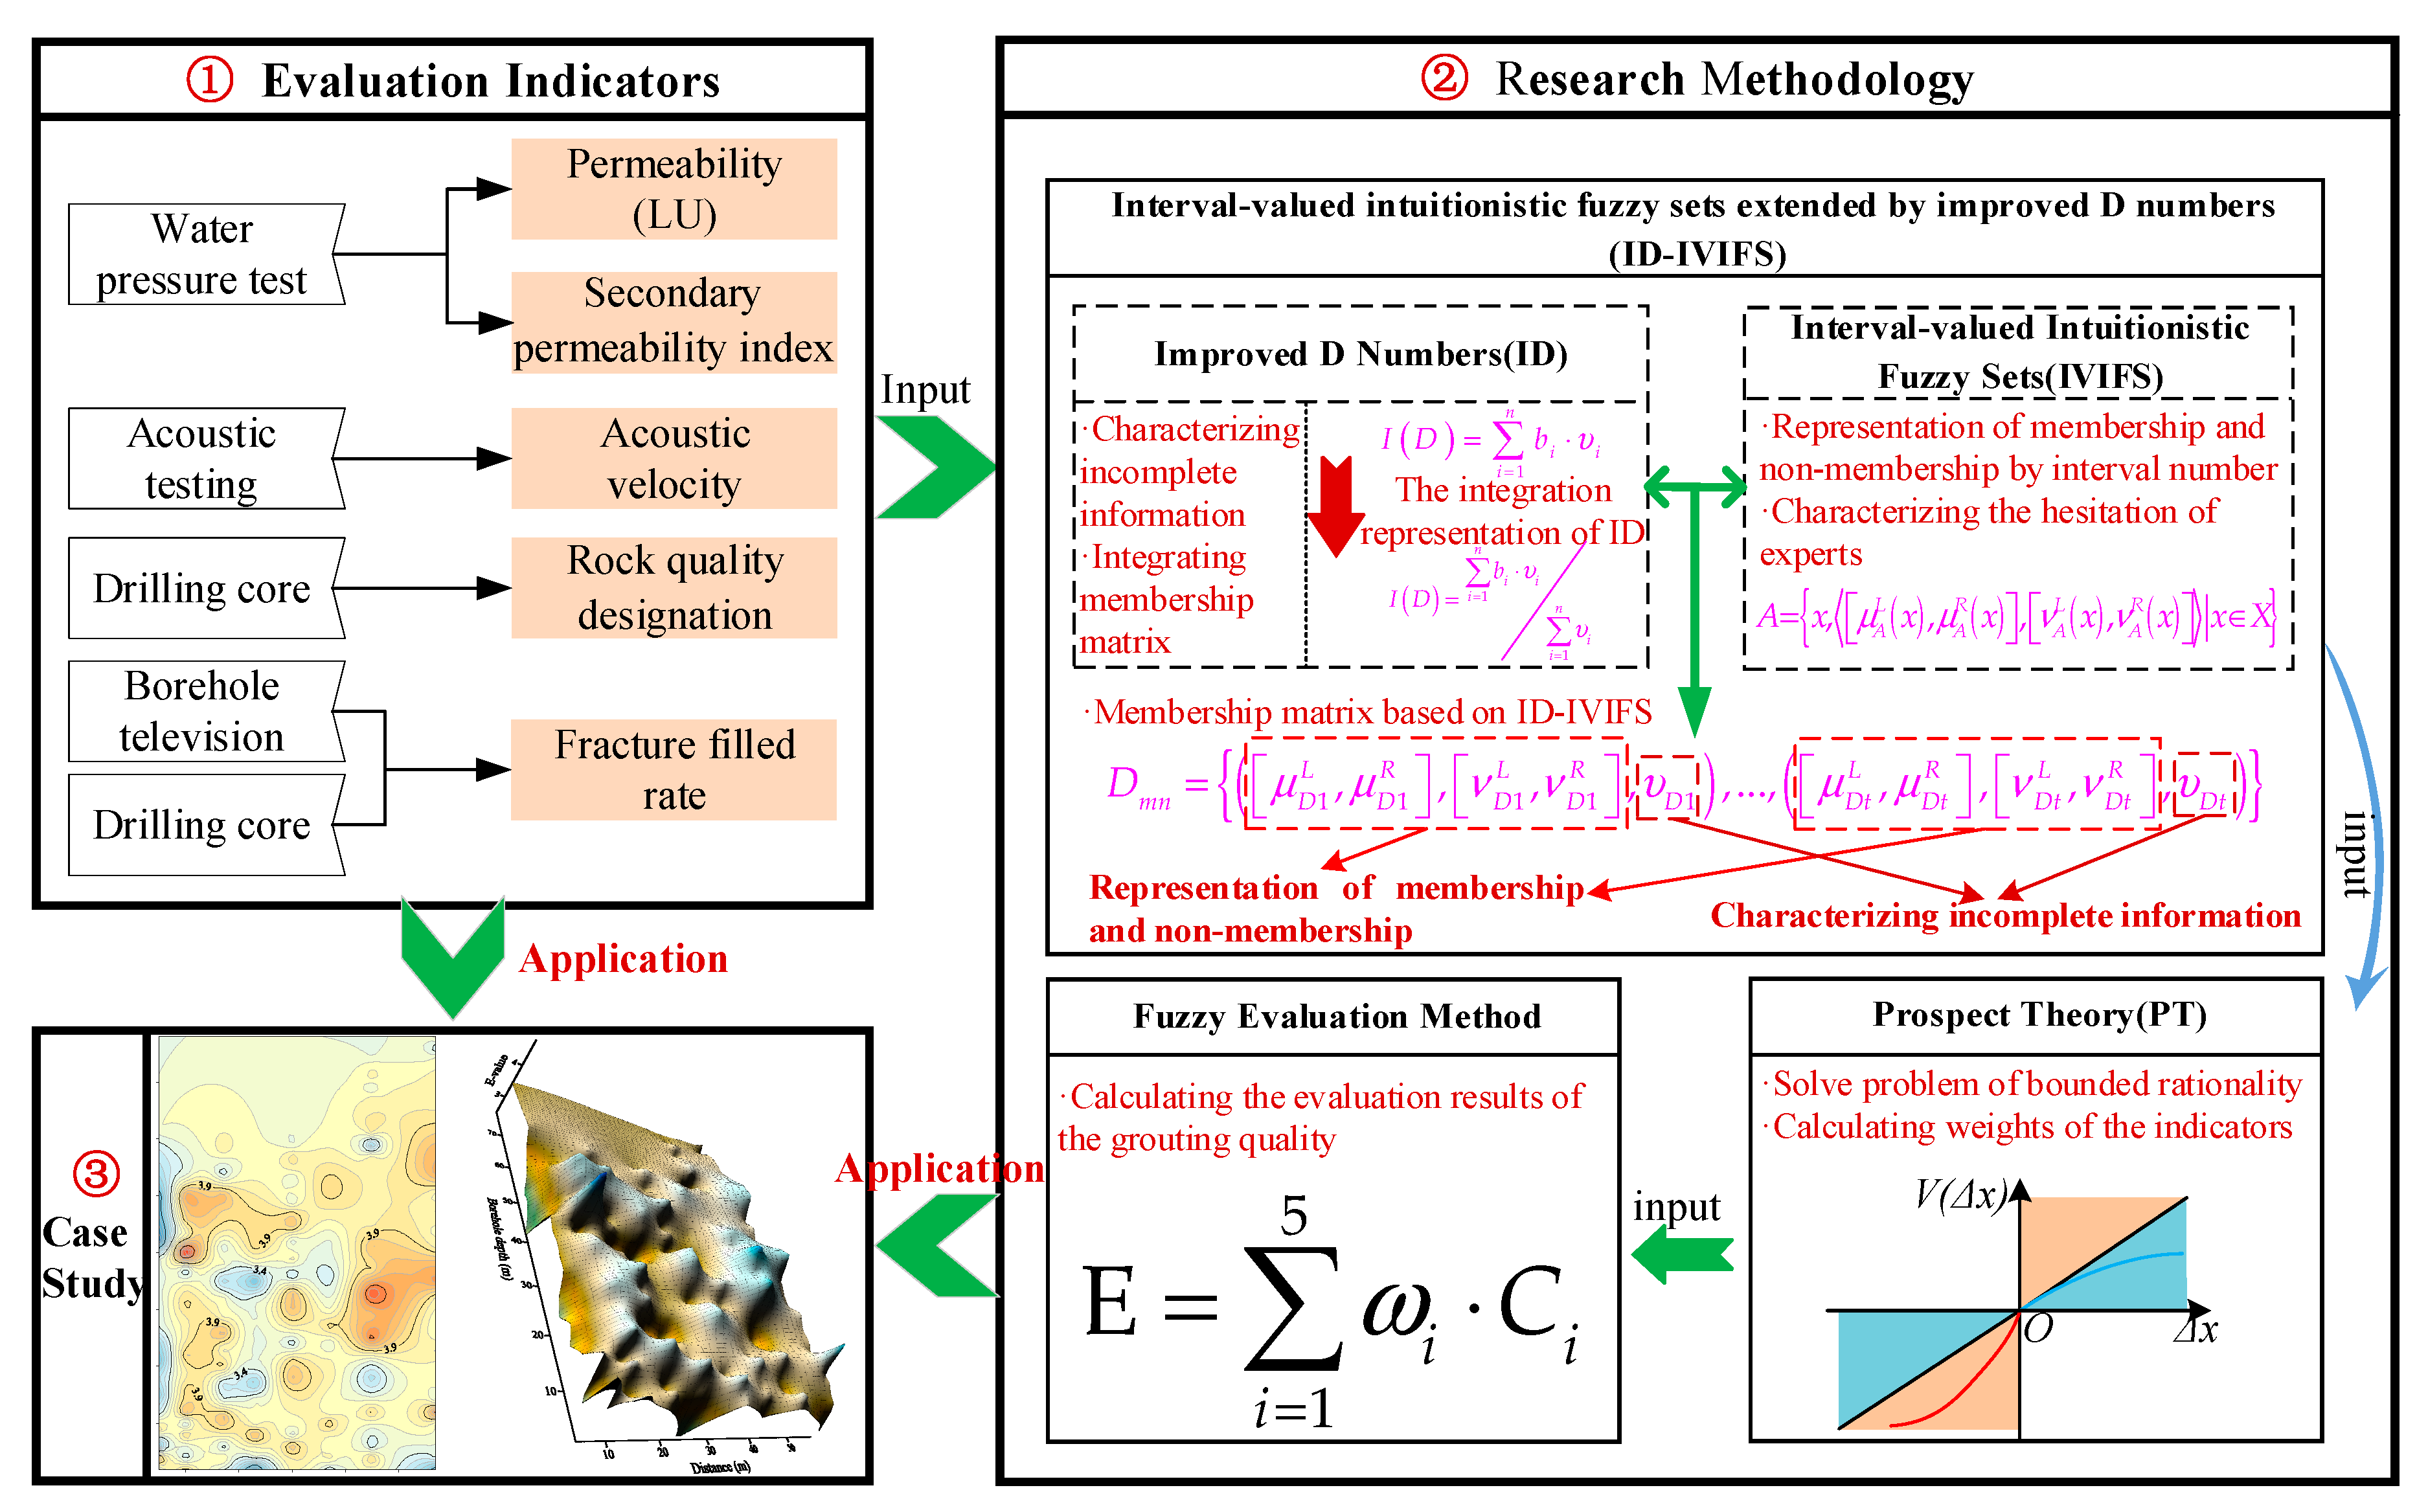
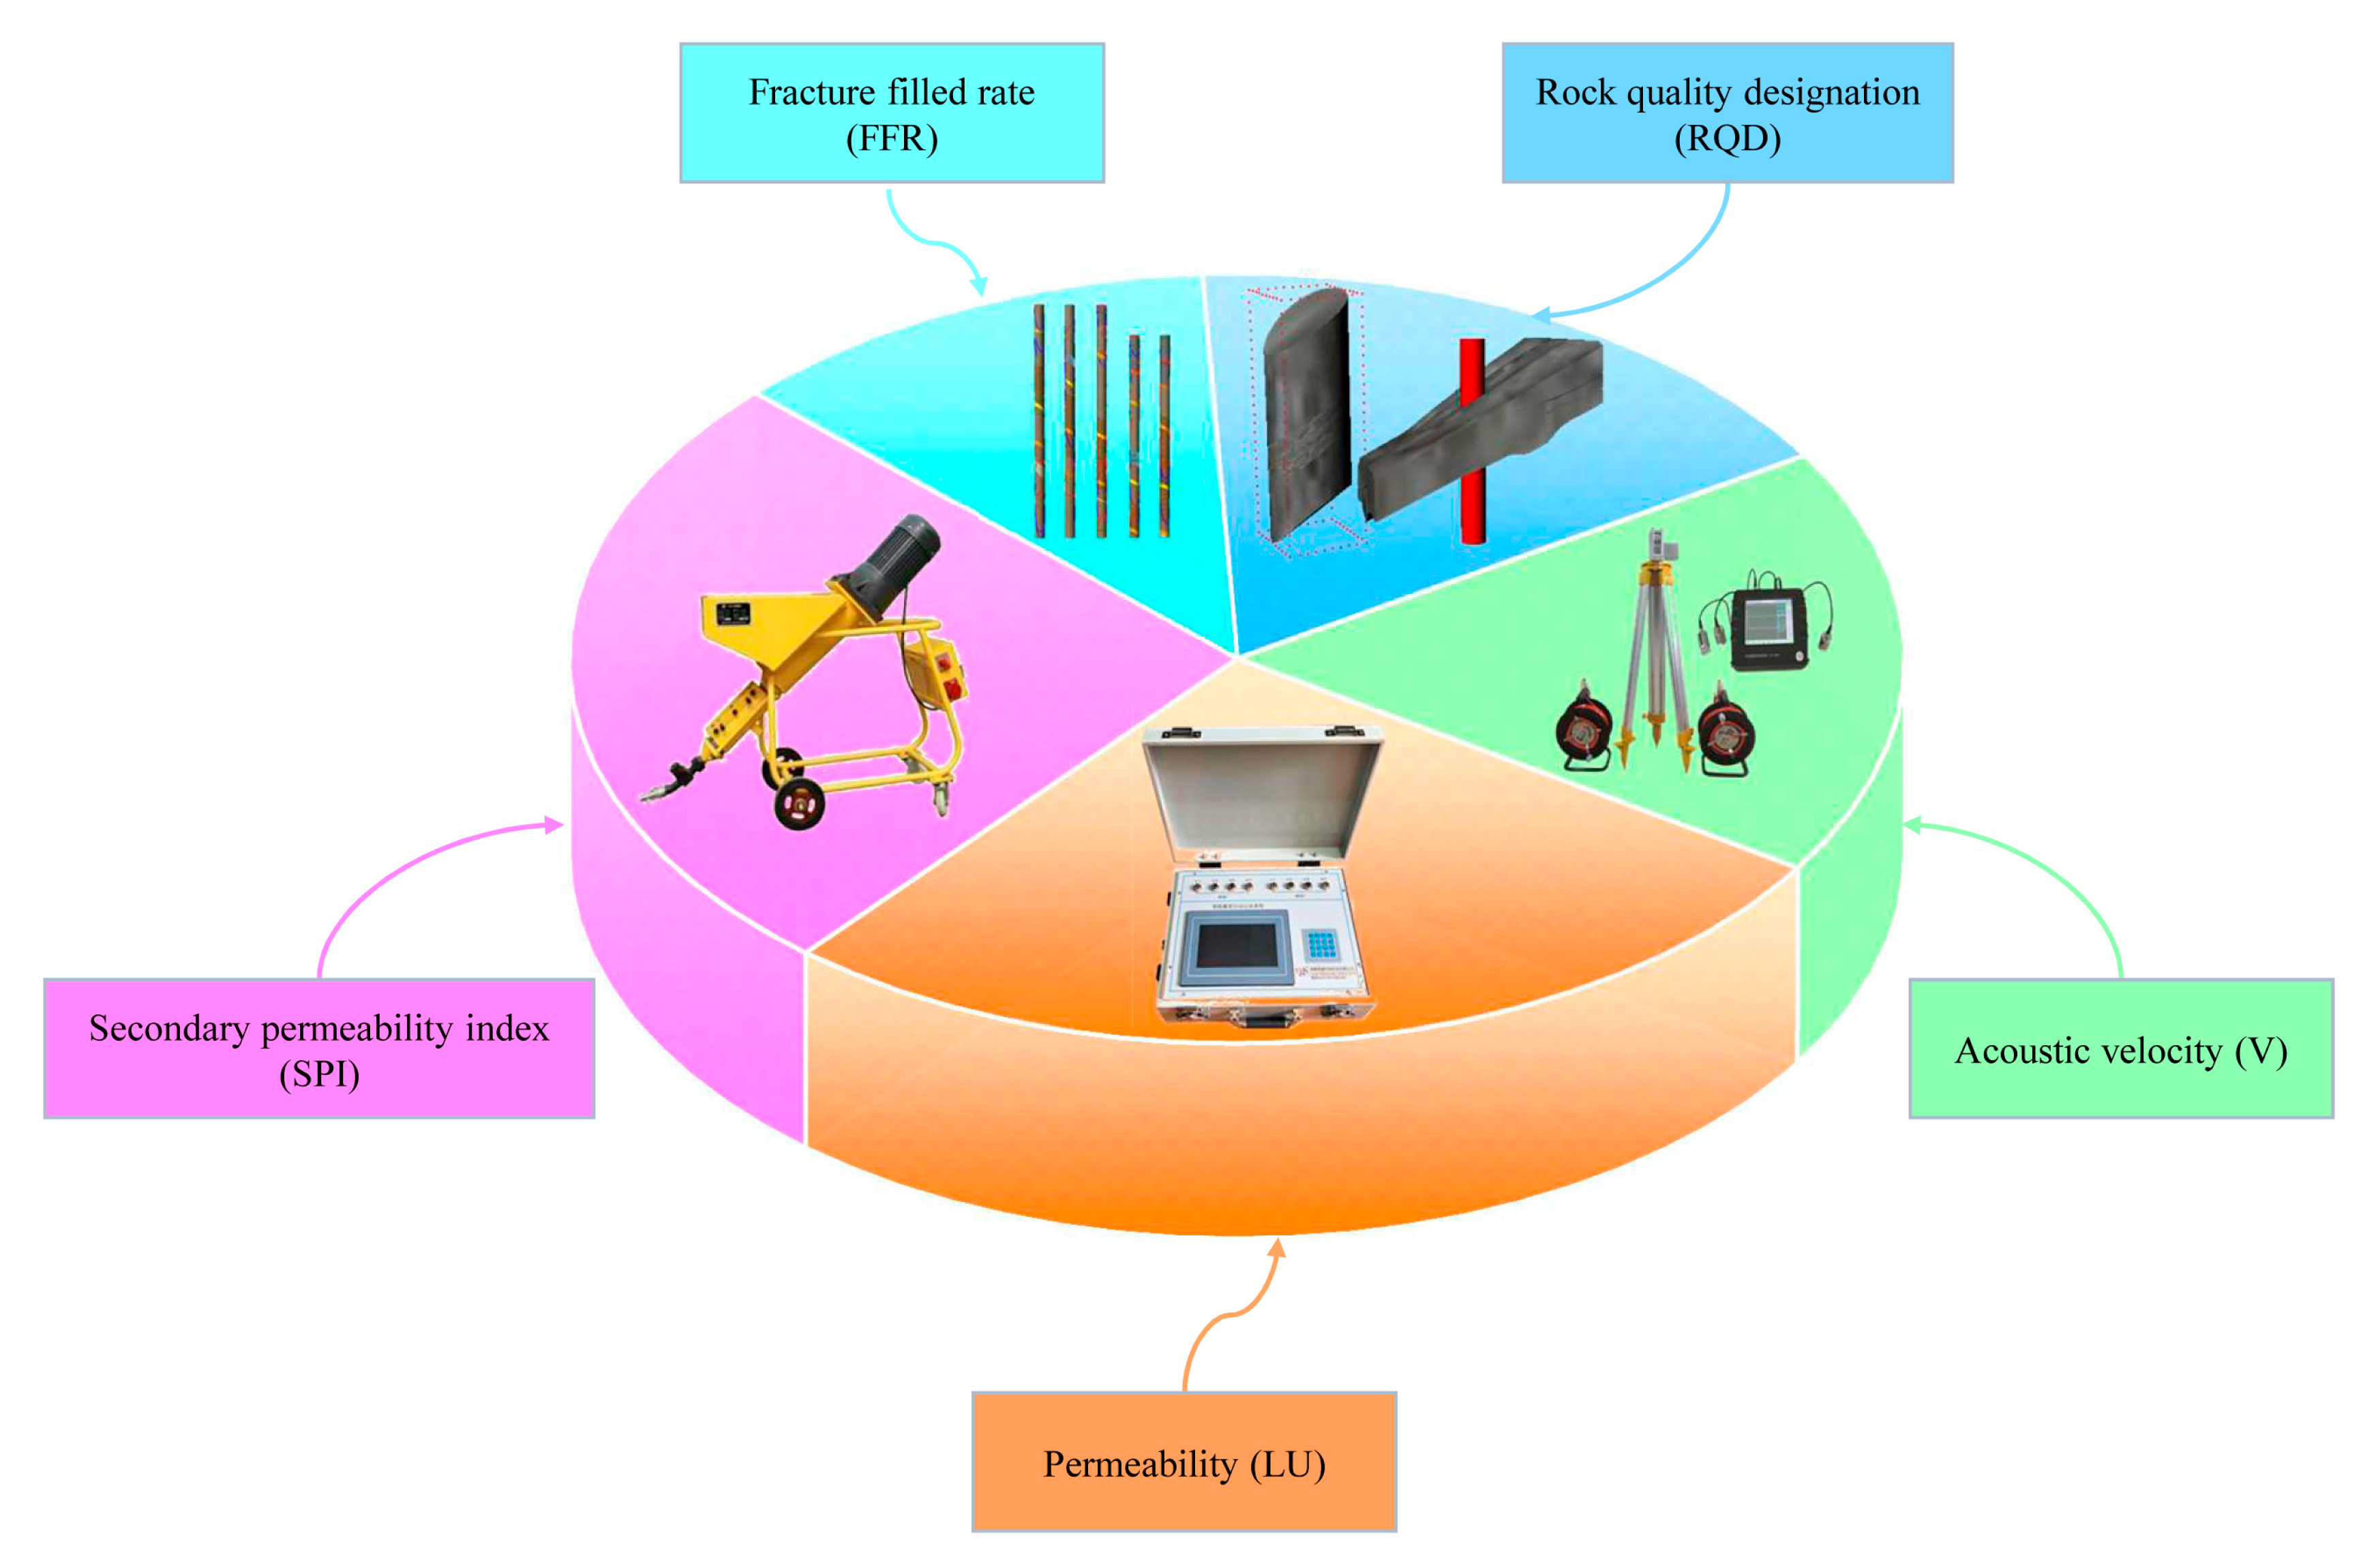
  • The diversity of the evaluation indicators can be further improved. The main aim of curtain grouting is to prevent leakage and to improve the strength of the ground under the dam foundation [30]. The construction efficiency of curtain grouting is closely related to the groutability (whether the grouting material can continue to be injected) [27]. The existing research mostly describes the groutability of a rock mass using permeability. However, they cannot be completely equivalent. The main reason for this is that there are usually many microfractures in the rock of the dam foundation, so there will be a situation where “the water permeability is very large and the cement intake is very small”. In addition, although a few studies have considered indicators such as the FFR and RQD, the diversity of the evaluation indicators can be further improved. Therefore, it is necessary to establish an evaluation indicator system that can comprehensively reflect the groutability of the rock considered.
To overcome the shortcomings of the existing evaluation methods, this paper proposes a comprehensive evaluation model for curtain-grouting efficiency assessment under an intuitionistic fuzzy environment; the complete research framework is shown in Figure 1.
Firstly, we develop a comprehensive evaluation method using prospect theory, interval-valued intuitionistic fuzzy sets, and improved D numbers for curtain-grouting efficiency assessment. The method combines the strength of interval-valued intuitionistic fuzzy sets defining membership, nonmembership, and hesitancy [31]; the superiority of D numbers in dealing with the incomplete information generated by experts during decision-making [32], and the advantages of prospect theory in considering the bounded rationality of experts [33]. Interval-valued intuitionistic fuzzy sets can express the hesitation of experts; therefore, it is practical to regard grouting-efficiency assessment as an evaluation problem under an intuitionistic fuzzy environment. However, the method must provide a certain membership and nonmembership degree, which makes it difficult to solve the problem of incomplete decision-making information. Fortunately, D numbers can be used to solve the problem of incomplete decision-making information, but there are certain drawbacks when integrating information [34]. Therefore, this study improves the D numbers (ID) and proposes the method of interval-valued intuitionistic fuzzy sets extended by the improved D numbers (ID-IVIFS). Prospect theory (PT) is used to solve the problem of the bounded rationality of experts, where the weight of each indicator is calculated based on the principle of the maximum prospect value. The fuzzy evaluation method is used to comprehensively evaluate the efficiency of the verification hole. The proposed method can consider the hesitation and bounded rationality of the experts and can handle the problem of incomplete decision-making information. Therefore, the evaluation results are more objective and reasonable.
Secondly, to improve the diversity of the evaluation indicators, based on the real-time monitoring system of grouting engineering [35] and the existing conventional evaluation indicator system of the research group, the secondary permeability index (SPI) is introduced as an evaluation indicator and a five-indicator evaluation system is established: LU, SPI, V, RQD, and FFR. Foyo et al. [36] believed that conventional experimental methods such as core drilling do not reflect the connectivity of the fractures and introduced the concept of SPI. The SPI can reflect the strength and groutability of rock and has been widely used in the field of grouting analysis and quality evaluation of rock [15]. Studies have shown that there is a strong correlation between grouting efficiency and rock quality and that the SPI has a strong correlation with the quality of the rock mass [37]. Therefore, the SPI can be used to characterize grouting efficiency. The five-indicator evaluation system further improves the diversity of the evaluation indicators.
Finally, based on ordinary Kriging [38], the evaluation results of a limited number of verification holes are mapped to the entire grouting construction area and the construction quality of the entire construction area is obtained to comprehensively evaluate the grouting efficiency. The model is applied to the curtain-grouting efficiency evaluation of a hydropower station, and the consistency, effectiveness, and superiority of the model are verified.

2. Related Work

2.1. Comprehensive Evaluation Methods under Interval-Valued Intuitionistic Fuzzy Environment

Interval-valued intuitionistic fuzzy sets (IVIFS), which are characterized by an interval-valued membership function and an interval-valued nonmembership function, are one of the important tools for handling uncertainty and hesitancy [39,40]. Zhao [41] established an optimization model based on the basic ideal of the traditional technique for order preference by similarity to an ideal solution (TOPSIS) and evaluated the teaching quality of a college class. Gu et al. [42] used interval-valued intuitionistic fuzzy numbers to evaluate the customer satisfaction of a “Door-to-Door” whole-process logistic service. Fuzzy sets may lead to the loss and distortion of assessment information; Liu [43] combined uncertain linguistic variables with IVIFS and proposed interval-valued intuitionistic uncertain linguistic sets (IVIULSs) that can simultaneously express the vagueness and uncertainty of subjective expressions. Wang et al. [44] used the ordered pairwise comparison method to determine the weight of the criteria, applied the entropy measure method of the IVIFS to determine the weights of the experts, and selected a suitable supplier for business intelligence systems. Oztaysi et al. [45] contributed to research proposal evaluation using a multicriteria approach based on IVIFS. Liu et al. [46] reconstructed a new version of the TOPSIS method to handle the problem of multicriteria decision-making. Liu et al. [47] proposed an innovative multicriteria decision-making method for sustainable supplier selection by integrating the alternative queuing method and the best–worst method within the interval-valued intuitionistic uncertain linguistic setting.

2.2. Comprehensive Evaluation Methods under D Numbers

The D number concept was developed by Deng [48] as an effective representation of missing data and incomplete decision-making information. It has been shown that D numbers can overcome the existing deficiencies in traditional Dempster–Shafer theories [49,50]. D numbers have been widely applied in the comprehensive evaluation field. For example, Ye [51] introduced a popular multiple attribute decision-making method to solve the assessment problem. Lin et al. [52] identified the risk elements of a new energy power system in China and analyzed the internal influence relations based on D numbers, a decision-making trial, and a laboratory evaluation. Deng et al. [53] proposed a D-number-based multi-sensor information fusion method to establish a new model for the fuzzy risk evaluation. Fan et al. [26] proposed a hybrid fuzzy evaluation method for grouting efficiency based on the AHP method extended by D numbers.

2.3. Comprehensive Evaluation Methods under Prospect Theory

Kahneman et al. [54] proposed prospect theory in 1979 based on the assumption of bounded rationality. Prospect theory explains the major violations of utility theory, which assumed that all reasonable people would obey the axioms of the theory [55,56]. Luca et al. [57] applied the cumulative prospect theory to model the behavior of travelers in a risky route choice context. Wu et al. [58] evaluated renewable power sources based on prospect theory and the fuzzy multicriteria decision-making technique. Wang et al. [59] simultaneously considered the psychological behavior of a decision maker and the interaction relationships among the risk factors and developed the risk evaluation method. Król et al. [60] evaluated the sustainability of maize cultivation based on prospect theory. Liu et al. [61] investigated the cross-efficiency evaluation in data envelopment analysis based on prospect theory.

2.4. Prospect Theory and Interval-Valued Intuitionistic Fuzzy Sets Extended by Improved D-Number Methods for Comprehensive Evaluation

Some researchers have recently developed and adopted prospect theory [62,63], interval-valued intuitionistic fuzzy sets [64,65], and D numbers [52,53] to solve the comprehensive evaluation problem. In summary, the existing research has made important contributions to solving the comprehensive evaluation problem. However, the existing evaluation methods have difficulty in considering hesitation and bounded rationality in the expert’s decision at the same time and have difficulty in simultaneously dealing with the problem of incomplete decision information generated by an expert giving up the evaluation.
Fortunately, interval intuitionistic fuzzy sets, prospect theory, and D numbers can solve the above problems well. For example, interval-valued intuitionistic fuzzy sets can describe the membership, nonmembership, and hesitancy of the experts [31]; prospect theory can consider the problem of the bounded rationality of the experts [33]; and D numbers can deal with the problem of incomplete information generated by experts during decision-making [32]. Considering that all the grouting-efficiency evaluation indicators are quantitative attributes, this paper proposes a comprehensive evaluation method based on prospect theory and interval-valued intuitionistic fuzzy sets extended by the improved D numbers to make the evaluation results more objective and reasonable.

3. Grouting-Efficiency Evaluation Indicators System

3.1. Indicator System for Curtain-Grouting Evaluation

In a curtain-grouting engineering project, grout material is injected into the fractures of a rock mass. The engineering properties are improved by the decreased permeability, enhanced strength, and reduced deformation of the rock. Therefore, in order to comprehensively reflect the efficiency of grouting construction, an indicator system for curtain-grouting evaluation that can comprehensively reflect the permeability, groutability, and tightness of a rock mass is established, as shown in Figure 2. The evaluation indicators consist of permeability (LU), secondary permeability index (SPI), fracture-filled rate (FFR), rock-quality designation (RQD), and acoustic velocity (V).

3.2. Calculation of the Evaluation Indicators

3.2.1. Secondary Permeability Index (SPI)

Foyo et al. [36] believed that the Lugeon (LU) could only reflect the permeability of a rock mass and could not reflect the strength and groutability of the rock mass. Therefore, the SPI was proposed, which can comprehensively reflect permeability and groutability. It has been widely used in the field of grouting analysis and in the quality evaluation of rocks [15]. Its definition is shown in Equation (1):
SPI = C ln ( 2 L r + 1 ) 2 π L V H t
where SPI is the secondary permeability index in L/m2·s; C is a constant which depends on the viscosity at 10 °C; L is the length of the tested borehole interval in m; r is the borehole radius in m; V   is the water flow absorbed by a fracture rock mass; t is the duration of the pressure applied in each step in s; and H is the total pressure expressed as a water column in m.

3.2.2. Permeability (LU)

The water-pressure test (WPT), which is usually conducted after the completion of the drilling and rinsing process, is a popular method for observing the permeability of a rock mass. The method was first proposed by Lugeon in 1933, and thus, it is also called the Lugeon test method [11]. The result of a WPT is generally expressed by the Lugeon value (LU), which can be calculated according to Equation (2):
LU = Q P L
where LU is the Lugeon value in Lu; Q is the water flow rate in L/min; and P is the pressure in the WPT in MPa.

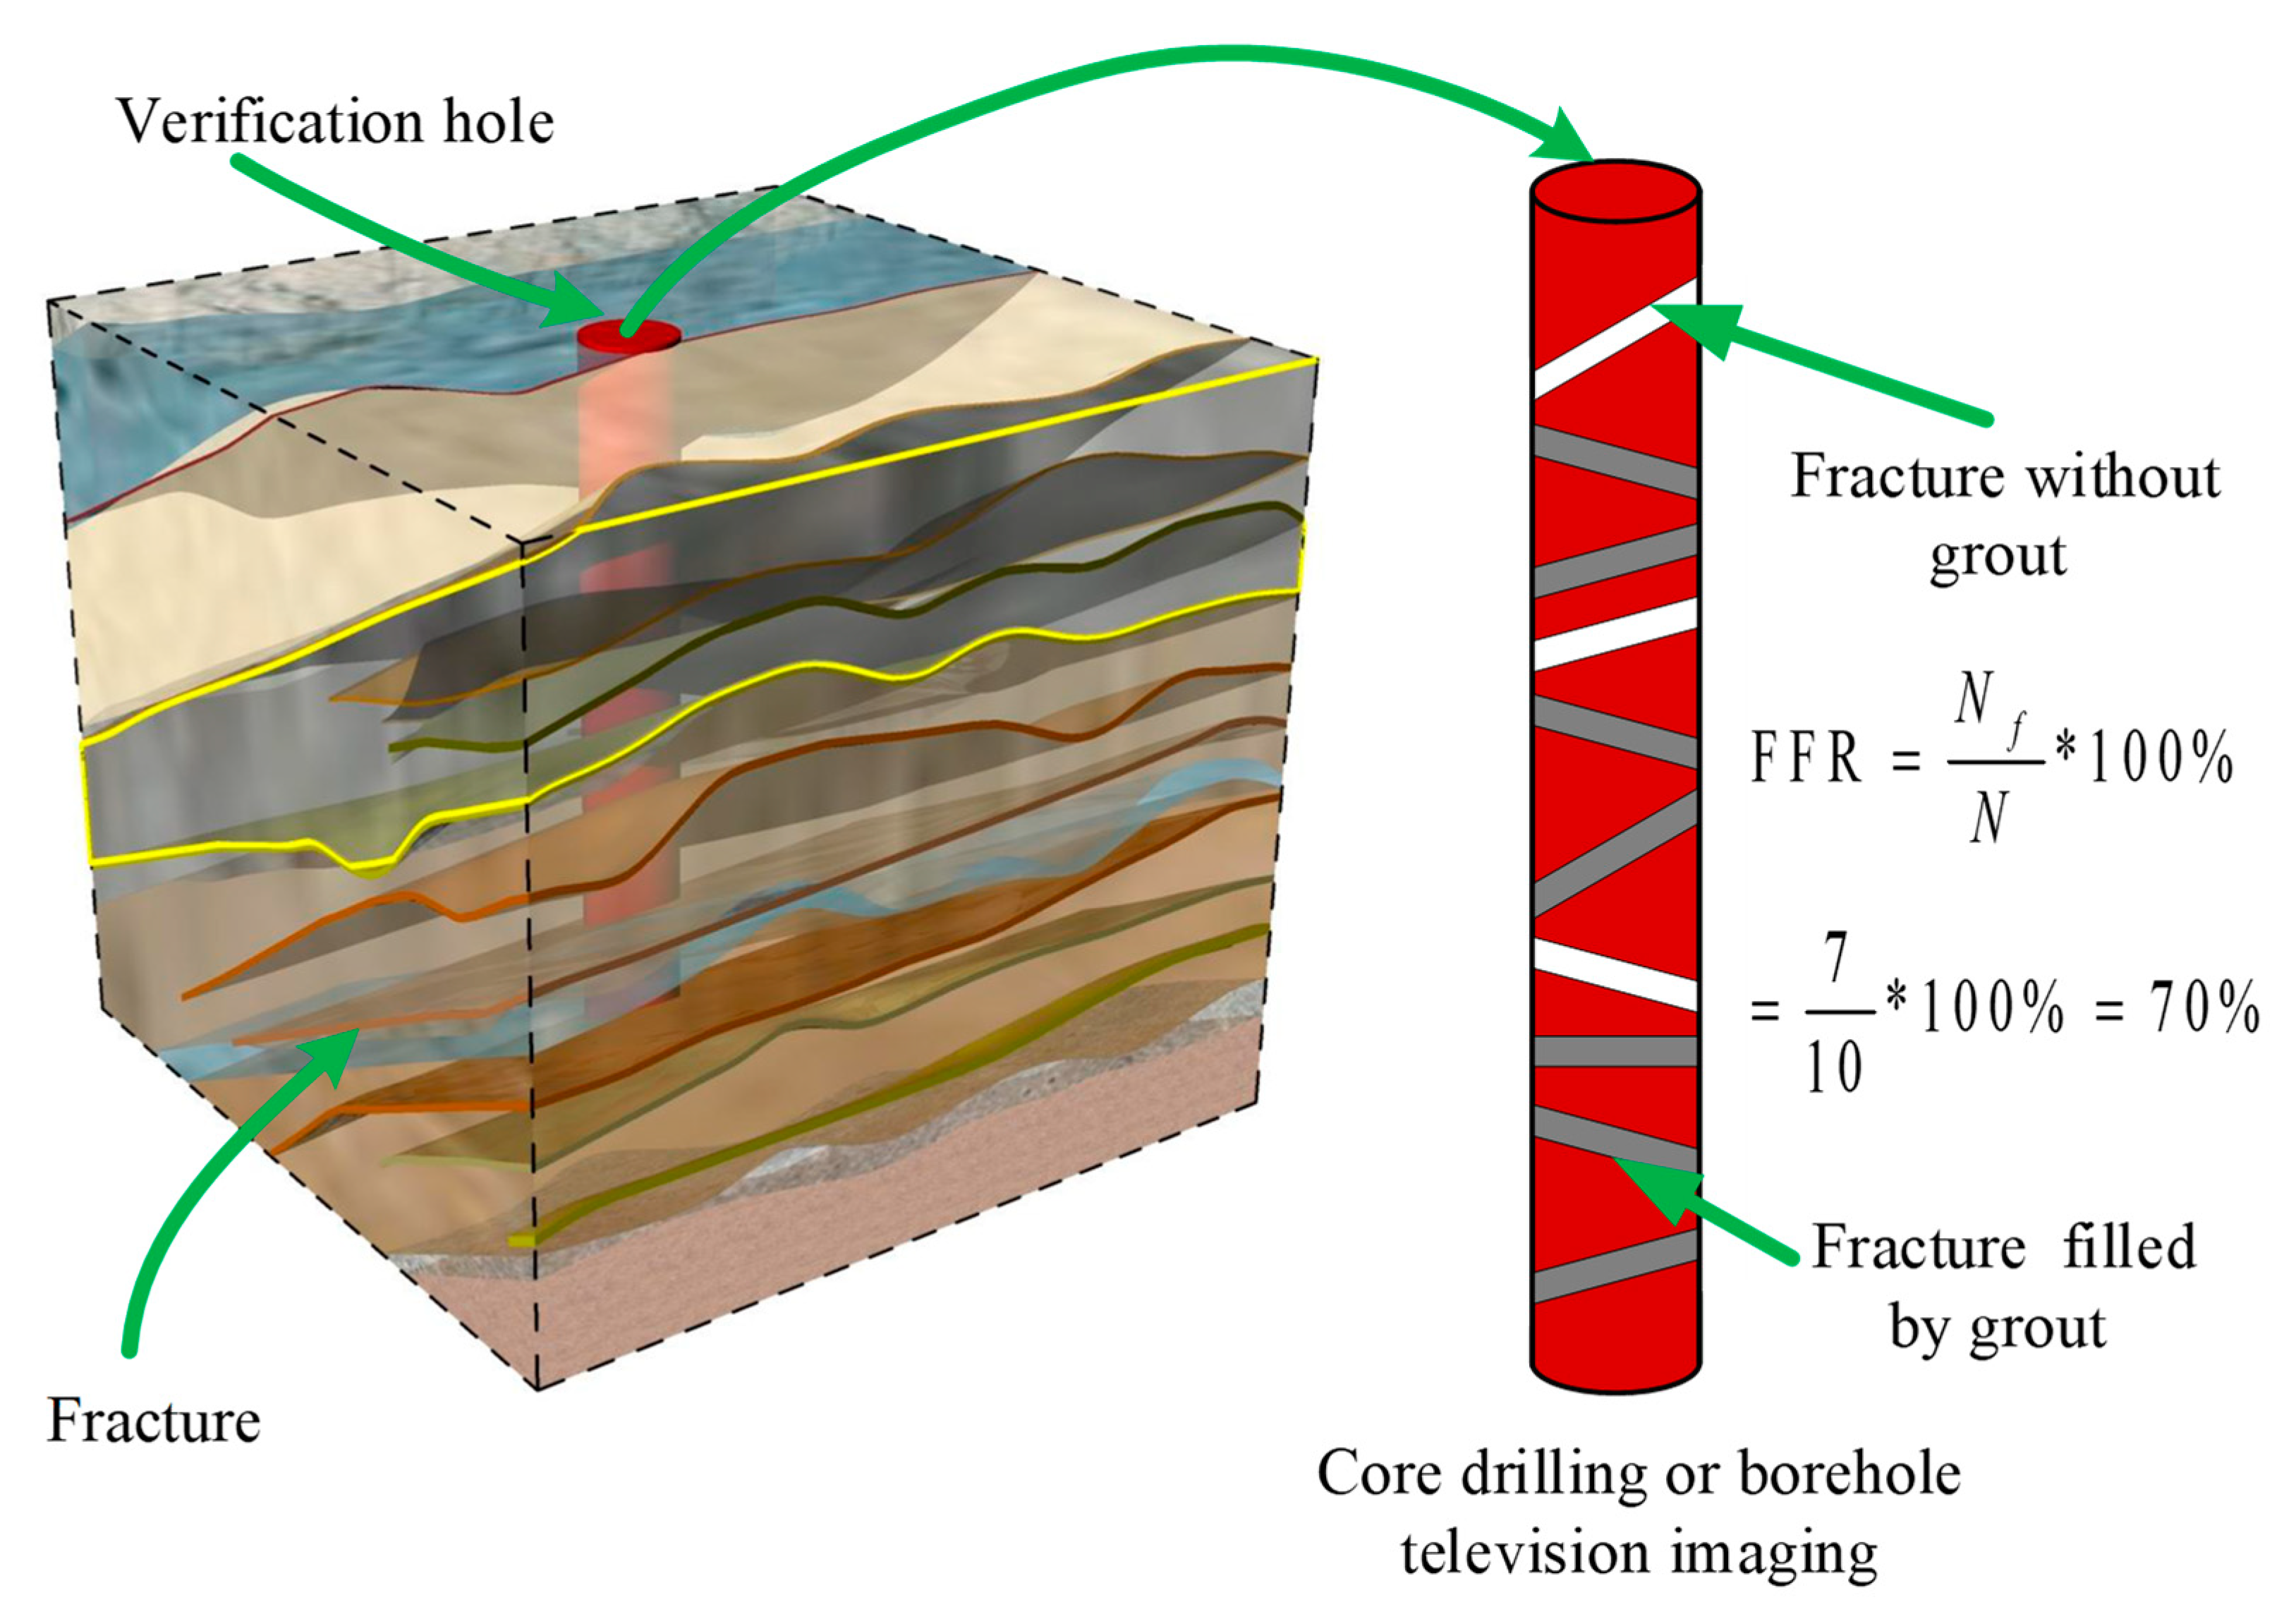
3.2.3. Fracture-Filled Rate (FFR)

The Fracture-Filled Rate (FFR) is defined as the ratio of the fractures filled by grout to the total number of fractures, which is derived from core drilling and borehole television imaging of the verification holes [26]. FFR is a key parameter in the assessment of rock quality and can be derived from Equation (3), as shown in Figure 3.
FFR = N f N * 100 %
where Nf and N are the number of fractures filled by grout and the total number of fractures in the test interval, respectively.

3.2.4. Rock-Quality Designation (RQD)

The rock-quality index (RQD) was first proposed by Deere as an index for quantitatively evaluating rock quality [66]. RQD can be obtained by the drilling core method and is widely used in rock engineering. RQD is defined as the percentage of the length of the complete core interval with a length greater than 10 cm ( L i ) as a percentage of the total core length (L), as shown in Equation (4):
RQD = L i L * 100 %

3.2.5. Acoustic Velocity (V)

The acoustic-wave velocity test is a frequently used technique for acquiring the acoustic-wave velocity value (V) of an object, such as rock or metal. This technology has been widely used in geotechnical engineering as it has the advantages of fast detection and of being a nondestructive test. There is a strong correlation between V and the elastic modulus. For intact rocks, their acoustic-wave propagation paths are often short and the acoustic-wave velocity V is relatively high and vice versa. By using the acoustic-wave test to quickly detect rock quality, grouting efficiency can be objectively evaluated.

4. Methodology

4.1. Mathematical Model of the Evaluation Method

In this study, the aim of the grouting comprehensive evaluation model is to obtain the comprehensive index E, which represents the grouting efficiency. Equation (5) shows the objective function of the efficiency evaluation, where f is the complex relationship between evaluation results E and the evaluation indicators LU, SPI, V, RQD, and FFR. Equation (6) defines the comprehensive evaluation indicators system of the grouting efficiency C, where c is the classification criteria. Equation (7) illustrates the method set of calculating the weight of each indicator (M), including the improved D numbers (Md), interval-valued intuitionistic fuzzy sets (Mi), interval-valued intuitionistic fuzzy sets extended by improved D numbers (Mdi), prospect theory (Mp), and weight-solving method (Mw), where b and v are the parameters of the improved D numbers. ( [ μ A L ( x ) , μ A R ( x ) ] , [ ν A L ( x ) , ν A R ( x ) ] ) denotes the membership matrix, and ( [ μ A L ( x ) , μ A R ( x ) ] , [ ν A L ( x ) , ν A R ( x ) ] , υ ) is the membership matrix of D-integral forms. ωi is the weight of the indicator i, and γi is the value function in the prospect theory. Equation (8) defines the evaluation method set, including the fuzzy evaluation method (Me) and the ordinary Kriging method (Mo), where ω defines the solution method of the weights of the evaluation indicators, ci is the score of the indicator i, g represents the fuzzy operation of the evaluation matrix, and λi and Zi are the parameters of the ordinary Kriging method.
Model ( E ) = f ( LU ,   SPI ,   FFR ,   RQD ,   V )
C = c ( LU ,   SPI ,   FFR ,   RQD ,   V )
{ M = M d M i M d i M p M ω M d = ( b , υ ) M i = ( [ μ A L ( x ) , μ A R ( x ) ] , [ ν A L ( x ) , ν A R ( x ) ] ) M d i = ( [ μ A L ( x ) , μ A R ( x ) ] , [ ν A L ( x ) , ν A R ( x ) ] , υ ) M p = ω i γ i M ω = ω ( LU ,   SPI ,   FFR ,   RQD ,   V )
{ M e = g ( ω i c i ) M o = λ i Z i

4.2. Preliminaries

4.2.1. D Numbers

Definition 1.
Let Ω be a finite nonempty set. The D numbers are defined as a mapping formulated by Equation (9), satisfying Equation (10) [48]:
D : Ω [ 0 , 1 ]
{ B Ω D ( B ) 1 D ( ) = 0
where is the empty set and B is a subset of Ω. From Definition 1, if B Ω D ( B ) < 1 , the information is incomplete and, if B Ω D ( B ) = 1 , the information is complete.
For a discrete set Ω = { b 1 , b 2 , , b i , , b n } , where b i R , if i j and b i b j , the D numbers can be expressed by Equation (11):
D ( b i ) = υ i   ( i = 1 , 2 , , n )
simply noted by D = { ( b 1 , v 1 ) , ( b 2 , v 2 ) , , ( b n , v n ) } , where v i 0 and i = 1 n v i 1 .
Definition 2.
Suppose that the D numbers are D = { ( b 1 , v 1 ) , ( b 2 , v 2 ) , , ( b n , v n ) } . Then, the integration representation of D is defined as Equation (12) [48]:
I ( D ) = i = 1 n b i υ i
where b i R , v i 0 and i = 1 n v i 1 .

4.2.2. Interval-Valued Intuitionistic Fuzzy Sets (IVIFS)

Definition 3.
Suppose that X is a universe of discourse. An interval-valued intuitionistic fuzzy set A in X is an object with the form of Equation (13) [39]:
A = { x , [ μ A L ( x ) , μ A R ( x ) ] , [ ν A L ( x ) , ν A R ( x ) ] | x X }
where [ μ A L ( x ) , μ A R ( x ) ] and [ ν A L ( x ) , ν A R ( x ) ] denote the interval values of membership and nonmembership of evaluation, satisfying the conditions 0 μ A L ( x ) μ A R ( x ) 1 , 0 ν A L ( x ) ν A R ( x ) 1 , and 0 sup ( μ A ( x ) ) + sup ( ν A ( x ) ) 1 , with 0 μ A R ( x ) + ν A R ( x ) 1 , for all x X . The interval values of hesitancy can be expressed by Equation (14):
π A ( x ) = [ π A L ( x ) , π A R ( x ) ] = [ 1 μ A R ( x ) ν A R ( x ) , 1 μ A L ( x ) ν A L ( x ) ]
Let S = { s 1 , s 2 , , s t } be a finite ordered discrete term set, where t is an odd value. The discrete linguistic term set S can be extended to a continuous linguistic term set S ¯ = { s α | s 1 s α s t } to preserve all the given information. Suppose that s x ˜ = [ s θ ( x ) , s τ ( x ) ]   ( s θ ( x ) , s τ ( x ) S ¯ ) is an uncertain linguistic variable s x ˜ S ¯ . Then, the interval-valued intuitionistic uncertain linguistic set can be expressed by Equation (15) [43]:
A = { x , [ s θ ( x ) , s τ ( x ) ] , [ μ A L ( x ) , μ A R ( x ) ] , [ ν A L ( x ) , ν A R ( x ) ] | x X }
Definition 4.
Suppose that A = { x , [ μ A L ( x ) , μ A R ( x ) ] , [ ν A L ( x ) , ν A R ( x ) ] | x X } and B = { x , [ μ B L ( x ) , μ B R ( x ) ] , [ ν B L ( x ) , ν B R ( x ) ] | x X } are two interval-valued intuitionistic fuzzy sets. Then, the distance d between the two sets is defined by Equation (16) [67,68]:
d = 1 4 ( μ A L ( x ) μ B L ( x ) ) 2 + ( μ A R ( x ) μ B R ( x ) ) 2 + ( ν A L ( x ) ν B L ( x ) ) 2 + ( ν A R ( x ) ν B R ( x ) ) 2 + ( π A L ( x ) π B L ( x ) ) 2 + ( π A R ( x ) π B R ( x ) ) 2
Definition 5.
Suppose that A = { x , [ μ A L ( x ) , μ A R ( x ) ] , [ ν A L ( x ) , ν A R ( x ) ] | x X } . Then, a score function S(A) and an accuracy function H(A) can be defined by Equations (17) and (18), respectively [69]:
S ( A ) = μ A L ( x ) + μ A R ( x ) ν A L ( x ) ν A R ( x ) 2
H ( A ) = μ A L ( x ) + μ A R ( x ) + ν A L ( x ) + ν A R ( x ) 2
For two interval-valued intuitionistic fuzzy sets A = { x , [ μ A L ( x ) , μ A R ( x ) ] , [ ν A L ( x ) , ν A R ( x ) ] | x X } and B = { x , [ μ B L ( x ) , μ B R ( x ) ] , [ ν B L ( x ) , ν B R ( x ) ] | x X } , we have the following:
1 
If S(A) > S(B), then A > B;
2 
If S(A) = S(B) and H(A) > H(B), then A > B; and
3 
If S(A) = S(B) and H(A) = H(B), then A = B.

4.2.3. Prospect Theory (PT)

Curtain-grouting engineering evaluation is usually based on verification holes to predict leakage of the dam foundation after dam storage operation. Due to environmental differences, experts have different levels of subjective bias in decision-making, which causes inconsistencies with reality. Prospect theory fully considers the impact of the environment in which the decision is made and the impact of expert cognition on the outcome of the decision. The model is more universal and more realistic. The prospect value P of the prospect theory is shown in Equation (19) [54]:
P = i = 1 5 ω i γ ( Δ x i )
where ω i is the weight of the grouting-evaluation indicator i and γ ( Δ x i ) is the value function described by Equation (20):
γ ( Δ x i ) = { ( Δ x i ) α where   Δ x i 0 θ ( Δ x i ) β where   Δ x i < 0
where Δ x i is the distance between the decision-making of the expert and the reference point, α and β are the coefficients of risk attitude, and θ is the loss-aversion coefficient.

4.3. ID-IVIFS Method

4.3.1. Improved D Numbers

In this section, two examples are used to illustrate the shortcomings of the D numbers theory.
Example 1.
Suppose that (8, 0.8) is a D number, and integrate the representation according to Equation (12). The integration result is identical to {(0, 0.2), (8,0.8)}. However, the meanings of the two D numbers expressed by (8, 0.8) and {(0, 0.2), (8,0.8)} are completely different. The former indicates that 80% of the experts believe that the efficiency of grouting is 8 and that 20% of the experts do not provide the evaluation due to lack of experience. The latter indicates that 80% of the experts believe that the grouting efficiency is 8 and that 20% of the experts believe that the grouting efficiency is zero. Therefore, traditional D numbers have drawbacks when integrating incomplete decision-making information.
To further illustrate the shortcomings of D numbers in integrating incomplete decision-making information, an example in the literature [34] is described.
Example 2.
There are 10 experts who evaluate the quality of two cars A and B, where 1–10 correspond to the quality being very poor to very good, respectively. The evaluation result of car A is that 6 experts scored 7, 2 experts scored 8, and 2 experts did not provide an evaluation due to lack of experience. The evaluation result of car B is that 10 experts scored 6. The evaluation results can be expressed by the following D numbers: DA = {(7, 0.6), (8,0.2)}, DB = {(6, 1)}.
The overall evaluation value is calculated based on Equation (12): I(DA) is 5.8, and I(DB) is 6.0. According to the overall score, car B has better quality than car A. In fact, the experts who are familiar with car A have given a better evaluation than car B (7 > 6 and 8 > 6), and so, the evaluation results are inconsistent with the actual situation, as the D numbers have ignored the effect of incomplete decision-making information on the results when incomplete decision-making information is integrated.
As the D numbers directly ignore incomplete decision-making information, which causes inconsistency with the actual situation, this paper proposes a method to fabricate the unknown information based on the known information. The overall integration representation is shown in Equation (21):
I ( D ) = i = 1 n b i υ i i = 1 n υ i
Using Equation (21), I(DA) is 7.25. According to the overall evaluation score, car A has better quality than car B, which is consistent with the literature [34], and so, the improved method is effective.

4.3.2. ID-IVIFS Method

The IVIFS requires each expert to provide a certain interval of (non-) membership and, so, cannot handle problems with incomplete decision-making information. However, in the actual decision-making process, due to a lack of experience, the situation of forfeiting the evaluation is extended. Therefore, combining interval-valued intuitionistic fuzzy sets (with the superiority of expressing the hesitancy of expert hesitation) and the D numbers (with the advantage of dealing with incomplete decision information), this paper proposes that the interval-valued intuitionistic fuzzy sets are extended based on the improved D numbers.
Let A be a set of grouting units, A = { A 1 , A 2 , , A m } , and let a be a set of evaluation indicators, a = { a 1 , a 2 , , a n } . Experts E = { E 1 , E 2 , , E l } in the industry are invited to evaluate the efficiency of these grouting units based on the indicators a. Each expert provides evaluation information of interval (non-) membership for each grouting unit on each indicator, with individual decisions as listed in Equation (22):
I V = [ a 1 a 2 a n A 1 I 11 1 I 12 1 I 1 n 1 E 1 A m I m 1 1 I m 1 1 I m 1 1 A 1 I 11 2 I 12 2 I 1 n 2 E 2 A m I m 1 2 I m 1 2 I m 1 2 A 1 I 11 l I 12 l I 1 n l E l A m I m 1 l I m 1 l I m 1 l ]
where I m 1 l = { a n , [ μ I m 1 l L ( a n ) , μ I m 1 l R ( a n ) ] , [ ν I m 1 l L ( a n ) , ν I m 1 l R ( a n ) ] | a n A m } is the interval-valued intuitionistic fuzzy value of the indicator ai relative to the grouting unit Am given by the expert El.
When all experts have given complete evaluation information, methods such as the arithmetic and geometric interval-valued intuitionistic fuzzy generalized λ-Shapley Choquet operator [70], the interval-valued intuitionistic fuzzy weighted geometric averaging operator [71], or the Atanassov’s interval-valued intuitionistic fuzzy weighted mean operator [68], can be used to integrate all individual decisions into a collective interval-valued intuitionistic fuzzy matrix. Then, the decision-making method is used to evaluate and analyze the grouting efficiency. However, during the decision-making process, experts may forfeit the evaluation because of the redundancy of information or incompleteness of expert knowledge. Due to the incomplete decision information, none of the above methods can effectively handle the problem. Therefore, this paper proposes the method of interval-valued intuitionistic fuzzy sets extended by improved D numbers.
Definition 6.
Suppose that the individual decisions of the grouting-efficiency evaluation are IV. Then, the D number integral form membership matrix based on the interval-valued intuitionistic fuzzy sets extended by improved D numbers is shown in Equation (23):
D = A 1 A 2 A m a 1 a 2   a n [ D 11 D 12 D 1 n D 21 D 22 D 2 n D m 1 D m 2 D m n ]
where D m n = { ( [ μ D 1 L , μ D 1 R ] , [ ν D 1 L , ν D 1 R ] , υ D 1 ) , ( [ μ D 2 L , μ D 2 R ] , [ ν D 2 L , ν D 2 R ] , υ D 2 ) , , ( [ μ D t L , μ D t R ] , [ ν D t L , ν D t R ] , υ D t ) } represents the D number integral form membership value of the indicator ai relative to the grouting unit Am and where i = 1 n v D i 1 .
Definition 7.
Suppose that a membership matrix of the D number integral form is D, which can be transformed into the collective interval-valued intuitionistic fuzzy matrix, as described in Equation (24):
I = A 1 A 2 A m a 1 a 2   a n [ I 11 I 12 I 1 n I 21 I 22 I 2 n I m 1 I m 2 I m n ]
where Imn is a collective interval-valued intuitionistic fuzzy value, which can be solved by Equation (25):
I m n = { a n , [ μ I m n L , μ I m n R ] , [ ν I m n L , ν I m n R ] | a n A m }
where μ I m n L = k = 1 t μ D k L υ D k k = 1 t υ D k , μ I m n R = k = 1 t μ D k R υ D k k = 1 t υ D k , ν I m n L = k = 1 t ν D k L υ D k k = 1 t ν D k , and ν I m n R = k = 1 t ν D k R υ D k k = 1 t ν D k .

4.4. Procedures for Comprehensive Evaluation

The solution process of the grouting-efficiency comprehensive evaluation model mainly includes three parts; the solution flow is shown in Figure 4. First, the evaluation indicators and classification criteria are determined. Second, the methods of prospect theory and interval-valued intuitionistic fuzzy sets extended by improved D numbers are used to solve the weight of each evaluation indicator. Finally, the fuzzy comprehensive evaluation method and ordinary Kriging method are used to obtain grouting-efficiency evaluation results. The solution steps for the model are as follows:
Step 1: Determine the evaluation indicators and classification criteria, and construct the comprehensive evaluation indicator system for the curtain-grouting efficiency. According to the numerical value of each indicator, the grouting efficiency is divided into five levels: excellent, good, ordinary, poor, and bad, and the score Si of each indicator is obtained.
Step 2: Establish the individual-decisions matrix. According to the evaluation results of the experts, the evaluation membership matrix is established using Equation (22).
Step 3: Establish the D number integral form membership matrix. Based on the improved D numbers, the D number integral form membership matrix is provided by Equation (23).
Step 4: Establish the collective interval-valued intuitionistic fuzzy matrix. The D number integral form membership matrix is transformed into the collective interval-valued intuitionistic fuzzy matrix using Equations (24), according to the overall integration representation solving method using Equation (25).
Step 5: Establish the distance and scoring function matrices. Firstly, the distance between the decision-making of the expert and the reference point is solved by Equation (16) and the distance matrix is formed. Secondly, the score and accuracy values of the collective interval-valued intuitionistic fuzzy sets are obtained by Equations (17) and (18), respectively, and the scoring function matrix is established.
Step 6: Calculate the weight of each indicator. First, based on the value function Equation (19), the prospect decision matrix is established. Then, the comprehensive prospect value P is maximized as the objective function and the weights of each indicator are solved, as shown in Equation (26) [72]:
ω i = j = 1 4 γ i j i = 1 5 j = 1 4 γ i j
where ω i is the weight of indicator i and γ ij is the value function of the indicator i of the unit j.
Step 7: Obtain the comprehensive efficiency evaluation index E of the verification hole based on the fuzzy evaluation method, as shown in Equation (27):
E = i = 1 5 ω i C i
where Ci is the score of the indicator i.
Step 8: Obtain the efficiency-evaluation results of the entire grouting area. Based on the ordinary Kriging method, the comprehensive evaluation index E of the verification hole is interpolated to the entire grouting construction area.

5. Case Study

5.1. Project Overview

The curtain grouting of a hydropower station in Southwest China was taken as the research object, and its efficiency was evaluated. The hydropower station includes a dam, a powerhouse, and a spillway, as shown in Figure 5. The curtain grouting of the project is provided, with two curtain-grouting lines of the upstream and downstream lines, and the curtain lines are divided into three sections and 90 grouting units, as shown in Figure 6.

5.2. Determining Evaluation Indicators and Criteria

The curtain-grouting efficiency was divided into five levels, which were excellent, good, ordinary, poor, and bad. The classification criteria of the grouting-efficiency evaluation indicators are shown in Table 1.

5.3. Data Collection

Techniques such as core drilling, borehole television imaging, water-pressure tests, and acoustic-wave velocity tests were carried out from top to bottom 14 days after finishing curtain grouting. The development and application of a real-time monitoring system for grouting engineering can effectively collect information related to geophysical verification [35]. The comprehensive evaluation model was applied to four of the units (units 32–35) to determine the curtain-grouting efficiency, as shown in Figure 6. The total number of verification boreholes in the four grouting units was 8, which included 175 grouting intervals, and all the verification holes were arranged on the curtain center line. A longitudinal section of the study area inspection hole is shown in Figure 7.
Based on the flow sensor, the pressure sensor, and the grouting real-time monitoring system, parameters such as the water flow (V), pressure (H), length of the tested borehole interval (L), borehole radius (r), and duration of water-pressure test (t) could be obtained in real time. The secondary permeation index value was calculated by Equation (1). Table 2 gives a sample of the data set of the secondary permeability index.
The permeability (LU) value was obtained by Equation (2) based on the grouting real-time monitoring system. Table 3 gives the permeability value of verification hole DJ1-1.
The results of the acoustic velocity, core drilling, and borehole television imaging could be collected and stored in the real-time monitoring system. Figure 8 and Figure 9 show the results of the core drilling and the borehole television imaging, respectively, of verification hole DJ1-1. Among these, the acoustic-velocity value could be directly read by the system and the FFR and RQD values could be calculated based on the results of core drilling and the borehole television imaging by using Equations (3) and (4), respectively. Summary statistics of each indicator variable for evaluation of grouting efficiency are shown in Table 4. Additionally, the data of each indicator of DJ1-1 and DJ3-1 are given in Figure 10.

5.4. Calculating the Weights of the Indicators

1
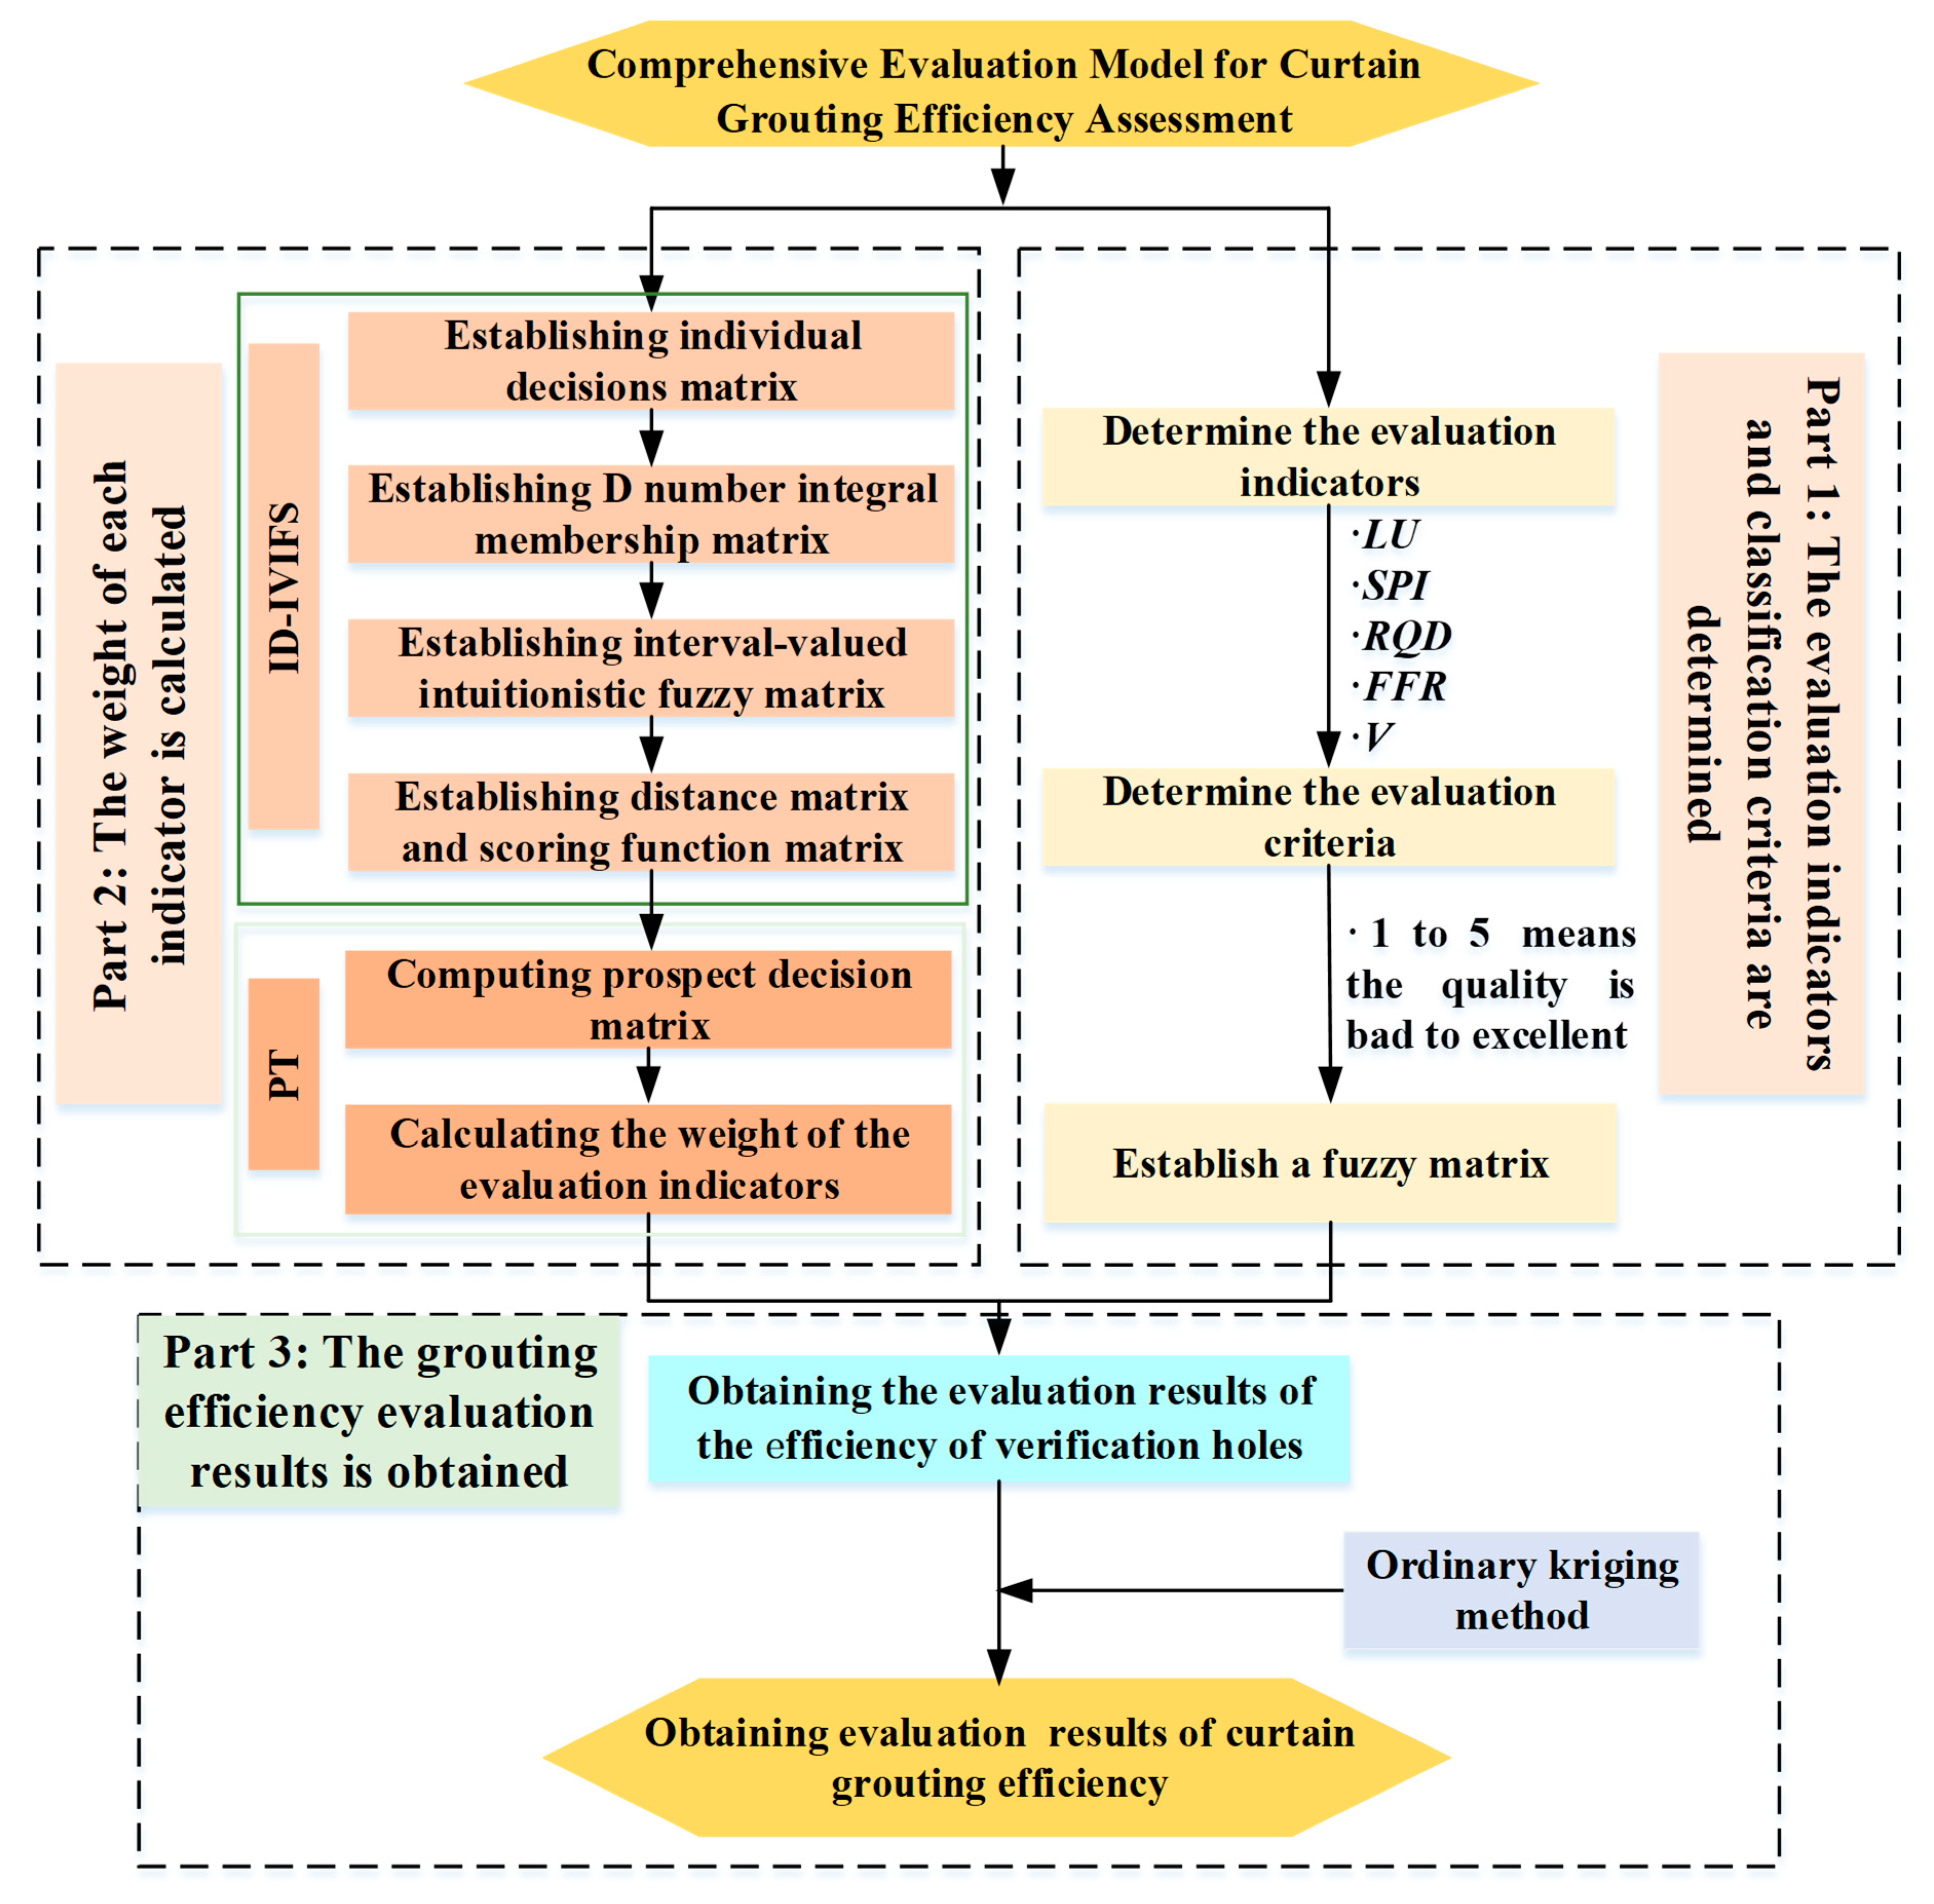
Firstly, considering that all the grouting-efficiency evaluation indicators are quantitative attributes, 10 experts from the industry were invited to consult and provide interval-valued (non-) membership of each evaluation indicator relative to each unit and an individual evaluation decision matrix is established. During the consultation process, the experts agreed that the average result of the evaluations of 10 experts was to be used as a reference point. The evaluation membership matrix was converted into a D number integral form evaluation matrix based on the improved D numbers, as shown in Table 5, where { ( [ 0.35 , 0.85 ] , [ 0.03 , 0.05 ] , 1 ) } indicates that all experts agreed that the FFR relative to the unit 2 evaluation interval-valued (non-) membership was ( [ 0.35 , 0.85 ] , [ 0.03 , 0.05 ] ) .
2
Secondly, the collective interval-valued intuitionistic fuzzy evaluation membership matrix was established. Using the overall integration representation solution method (Equation (25)) proposed in this study, the D number integral form evaluation matrix in step (1) was transformed into the collective interval-valued intuitionistic fuzzy evaluation membership matrix, as tabulated in Table 6. The reference points O of LU, SPI, FFR, RQD, and V were ([0.817, 0.903], [0.036, 0.075]), ([0.764, 0.841], [0.092, 0.145]), ([0.514, 0.778], [0.054, 0.167]), ([0.446, 0.776], [0.097, 0.167]), and ([0.663, 0.767], [0.071, 0.141]).
3
Thirdly, based on the score and accuracy of the interval-valued intuitionistic fuzzy sets (Equations (17) and (18)), the scoring function matrix was established. The results are shown in Table 7.
4
Finally, the weights of each indicator were solved based on the principle of prospect value maximization. Primarily, based on the interval-valued intuitionistic fuzzy sets judgment criterion, the size of the interval-valued intuitionistic fuzzy sets, reference point O of each evaluation indicator, and the solution method of the value function γ ( Δ x i ) were determined. Then, the distance between each indicator and reference point O was found using Equation (16) in order to establish the distance matrix. Finally, the value function γ ( Δ x i ) was solved, the prospect decision matrix was established, and the weights of each indicator were solved. The prospect decision matrix is shown in Table 8. The weights of LU, SPI, FFR, RQD, and V based on Equation (26) were ω =   ( 0.27 ,   0.26 ,   0.12 ,   0.17 ,   0.18 ) T .

5.5. Evaluation Results

Based on the established comprehensive evaluation model of the curtain-grouting efficiency, the fuzzy evaluation matrix giving the comprehensive evaluation index E of each verification hole could be obtained by Equation (27). Equation (28) represents the fuzzy evaluation matrix of the verification hole DJ1-1:
E = ω i × S i = [ 0.27 0.26 0.12 0.17 0.18 ] T × [ 3 4 1 4 5   4 5 5 2 5   2 3 1 4 4   3 4 4 4 5   4 4 1 2 4   3 3 3 3 3   3 4 1 3 4   3 3 2 2 4   3 4 2 3 4   4 4 2 2 4   4 4 2 3 3   4 4 1 4 3   4 4 2 2 4   4 4 1 2 5   2 3 2 1 4   3 3 1 2 4   2 3 2 4 3   3 3 4 2 4   4 4 1 3 3   4 4 5 2 3 ] = [ 3.55   4.22   2.84   3.91   3.3   3.00   3.20   2.89   3.06   3.42   3.41   3.46   3.42   3.48   2.45   2.77   2.78   3.13   3.29   3.6 ]
Thus, classification of the grouting-efficiency level of the verification hole was realized. The result is shown in Figure 11. From the evaluation results of the verification hole, the average value of E of the 175-interval verification hole was 3.64 and the overall value was at a good level; the maximum value of index E was 5, which is an excellent level, and the minimum value is 2.45, which is an ordinary level. There were 166 intervals with index E greater than or equal to 3, which accounted for 94.86% of the total, and 26 intervals in the excellent level (4 < E ≤ 5), which accounted for 14.86% of the total. From the evaluation results of each verification hole, the average value of the DJ1-2 verification hole was 3.84, which was the highest score, followed by the DJ3-1 average score of 3.75. The lowest was DJ1-1, with a score of 3.26. In summary, the efficiency of each verification hole was generally good.
The ordinary Kriging model was used to obtain the grouting efficiency of the study area. The results are shown in Figure 12. The comprehensive evaluation index E of grouting in the study area was greater than 2.5 according to the classification criteria, and the overall level was ordinary. The light blue dotted areas (1) and (2) had the lowest comprehensive evaluation indices, which were the weak grouting-efficiency regions of the study area. Hence, it is necessary to pay attention to these regions in the later stages of the construction process. Figure 12 indicates the grouting comprehensive evaluation index E of any point in the grouting construction area, which reflects the defect parts of grouting construction and provides references for the construction site decision-making process, therefore providing results of theoretical and practical significance.

6. Discussion

6.1. Rationality of Evaluation Method

At present, the evaluation of grouting efficiency often adopts a single-indicator (LU) evaluation or D-AHP, as proposed in the literature [26]. To further illustrate the advantages of the proposed method, the grouting efficiency was evaluated based on the above three methods and the rationality of the model was explained in terms of the consistency, representativeness, and superiority. The results are shown in Figure 11, Figure 12, Figure 13, Figure 14 and Figure 15. The comparative analysis results are as follows:
1
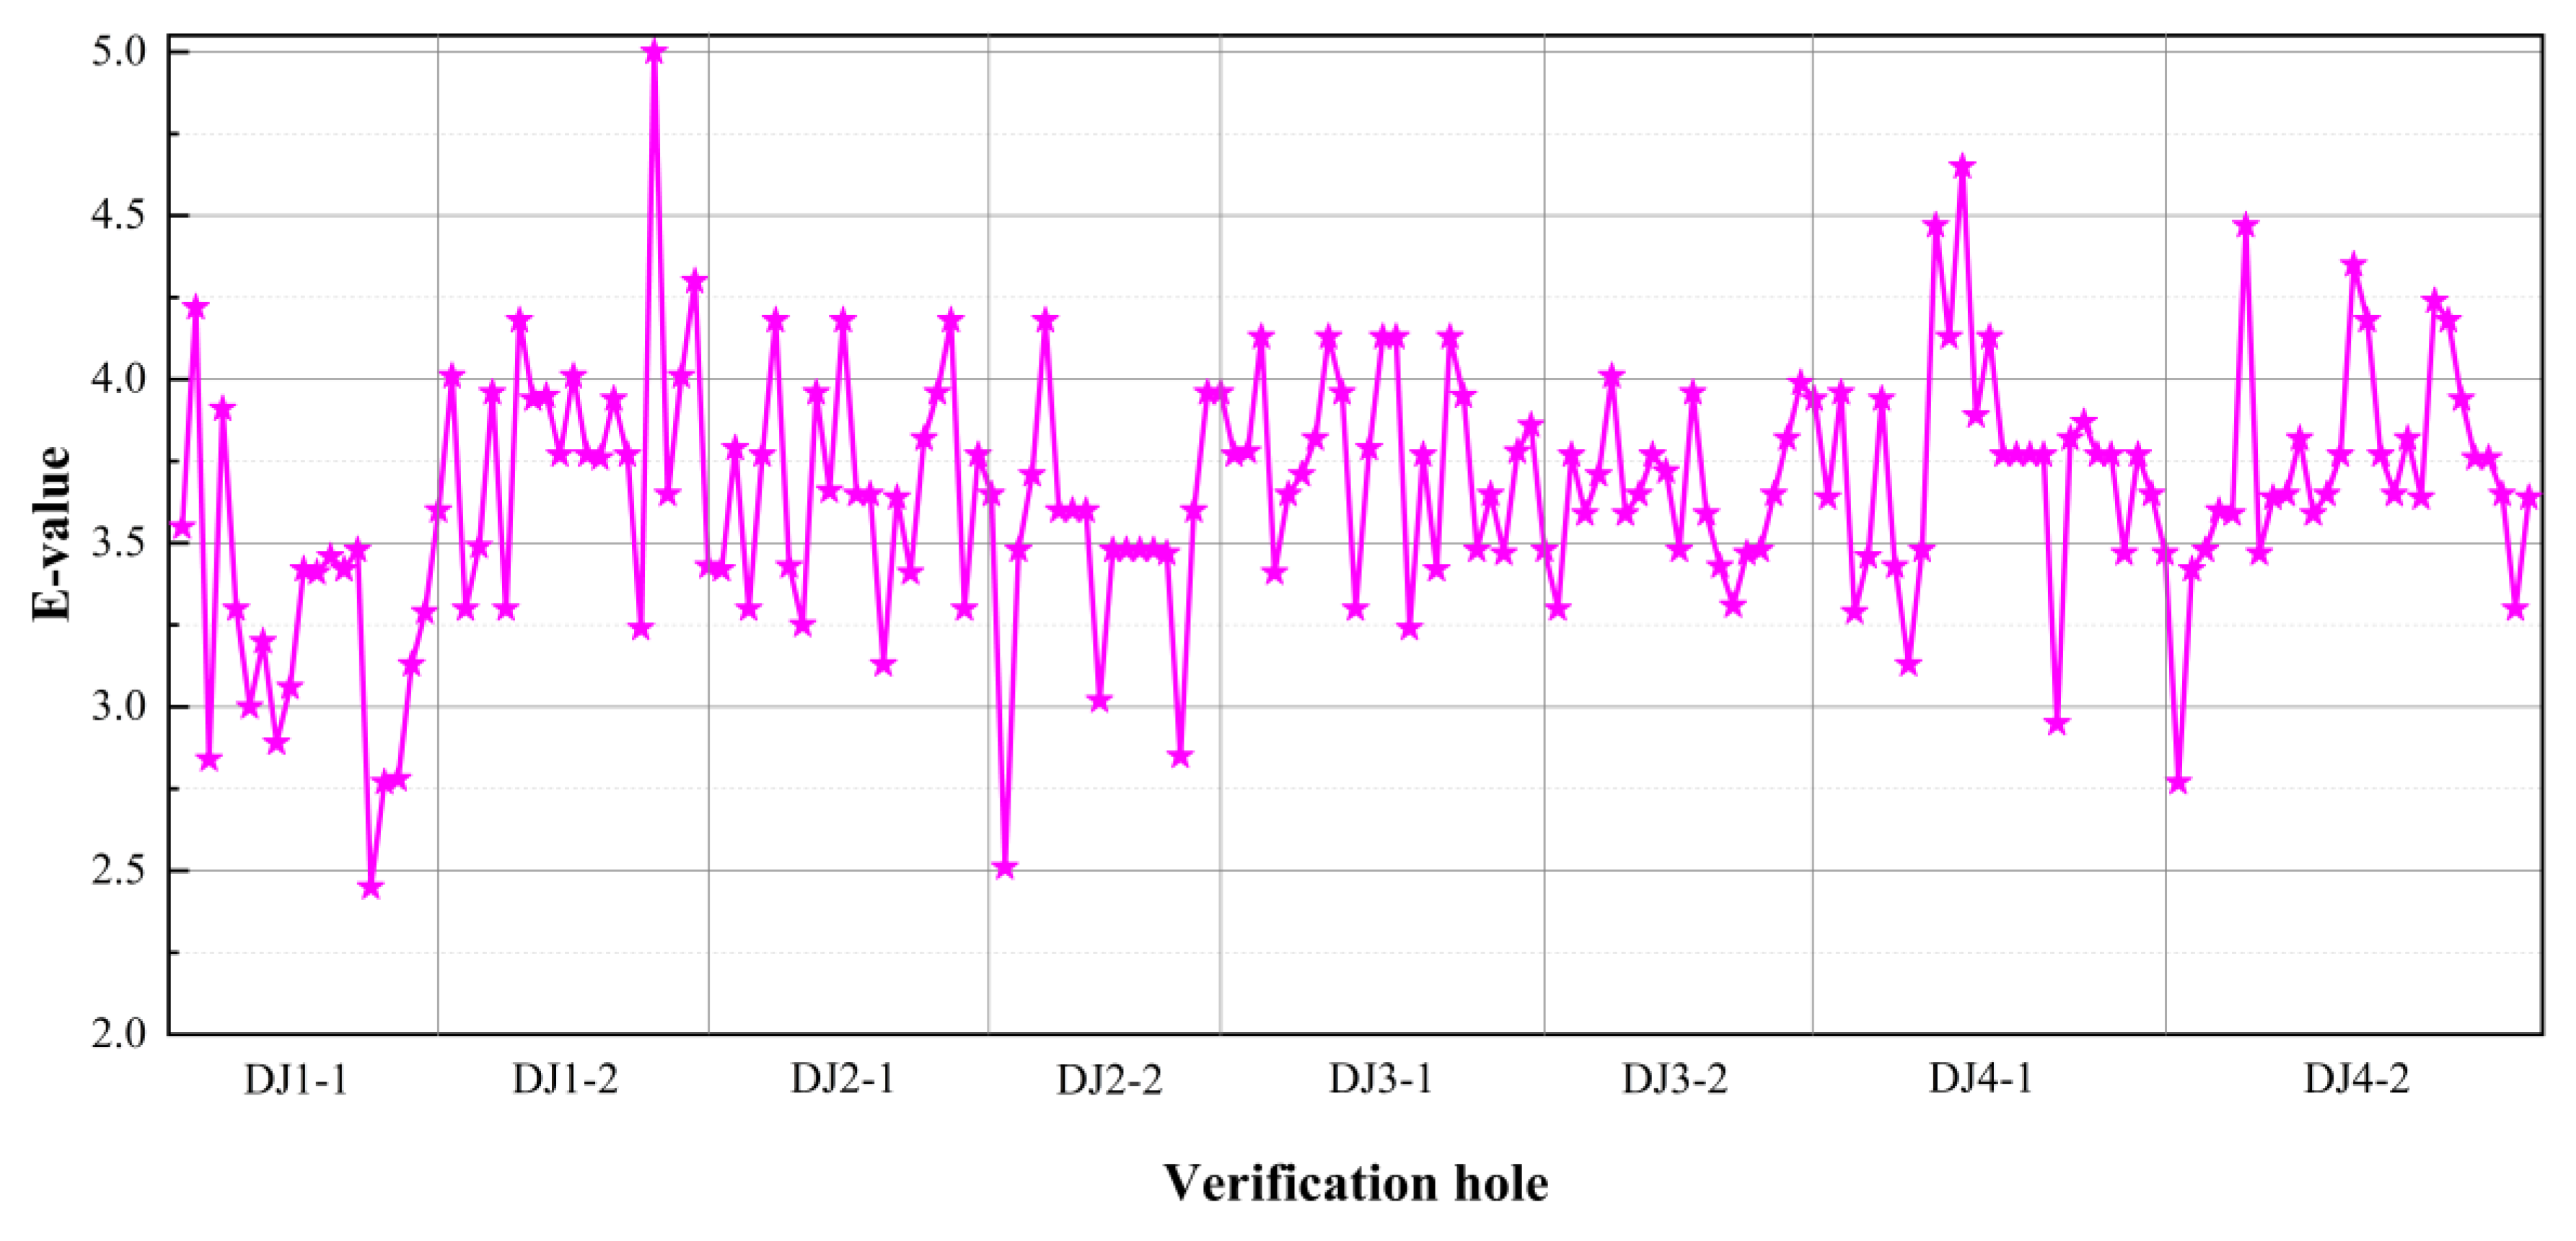
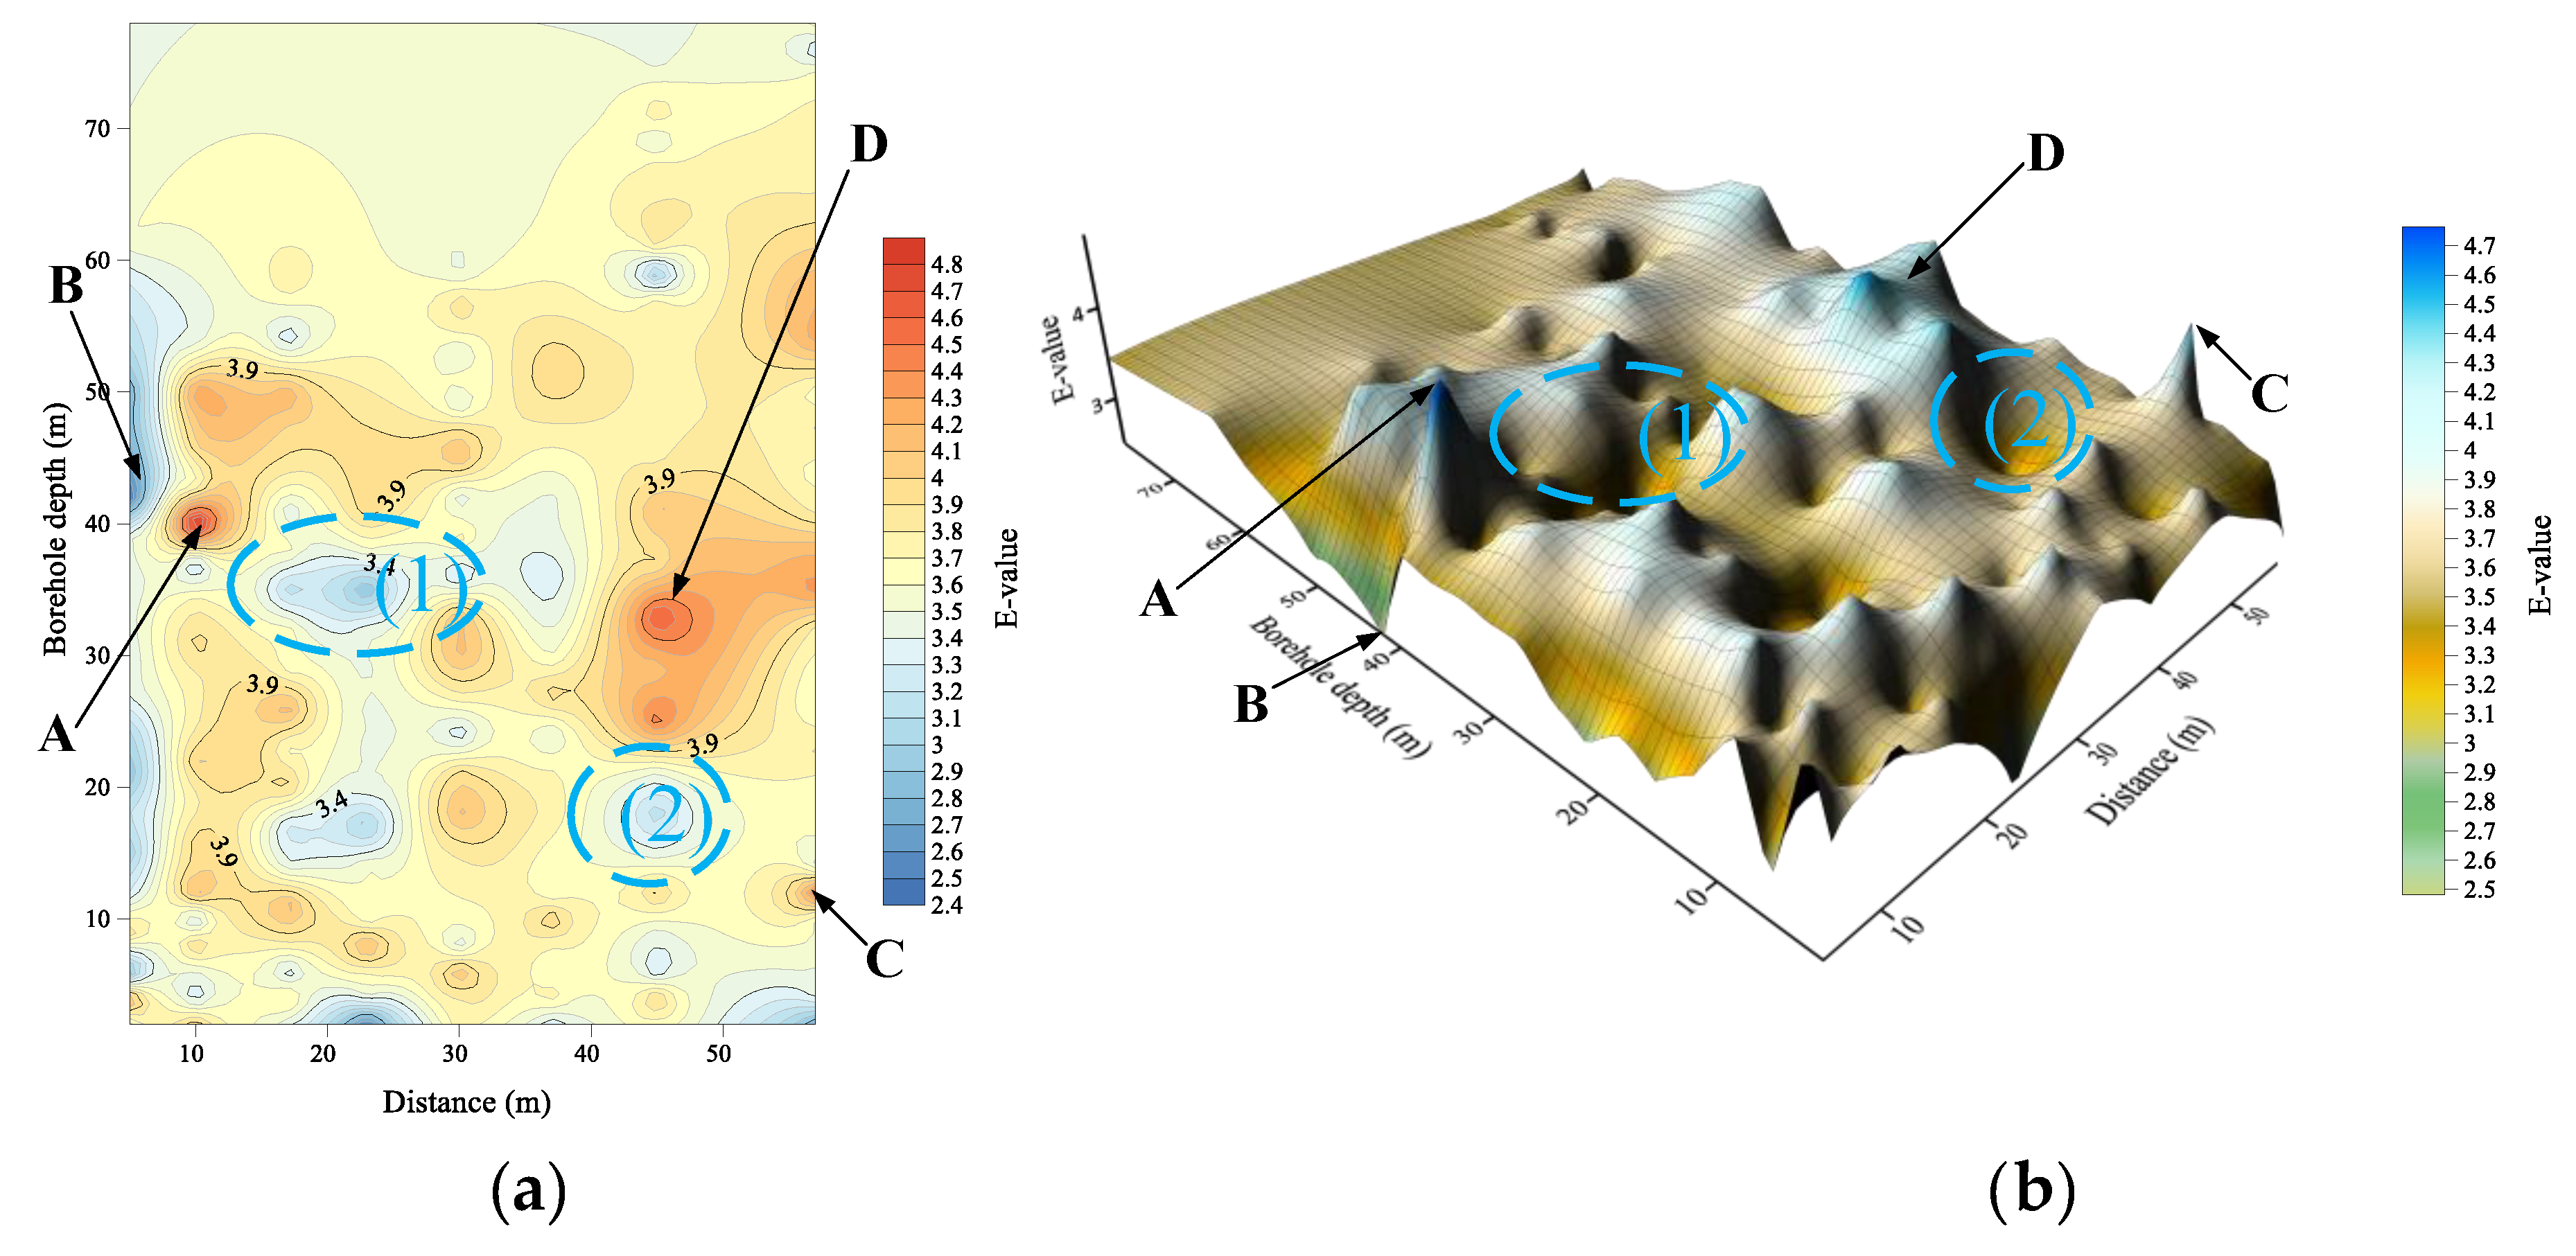
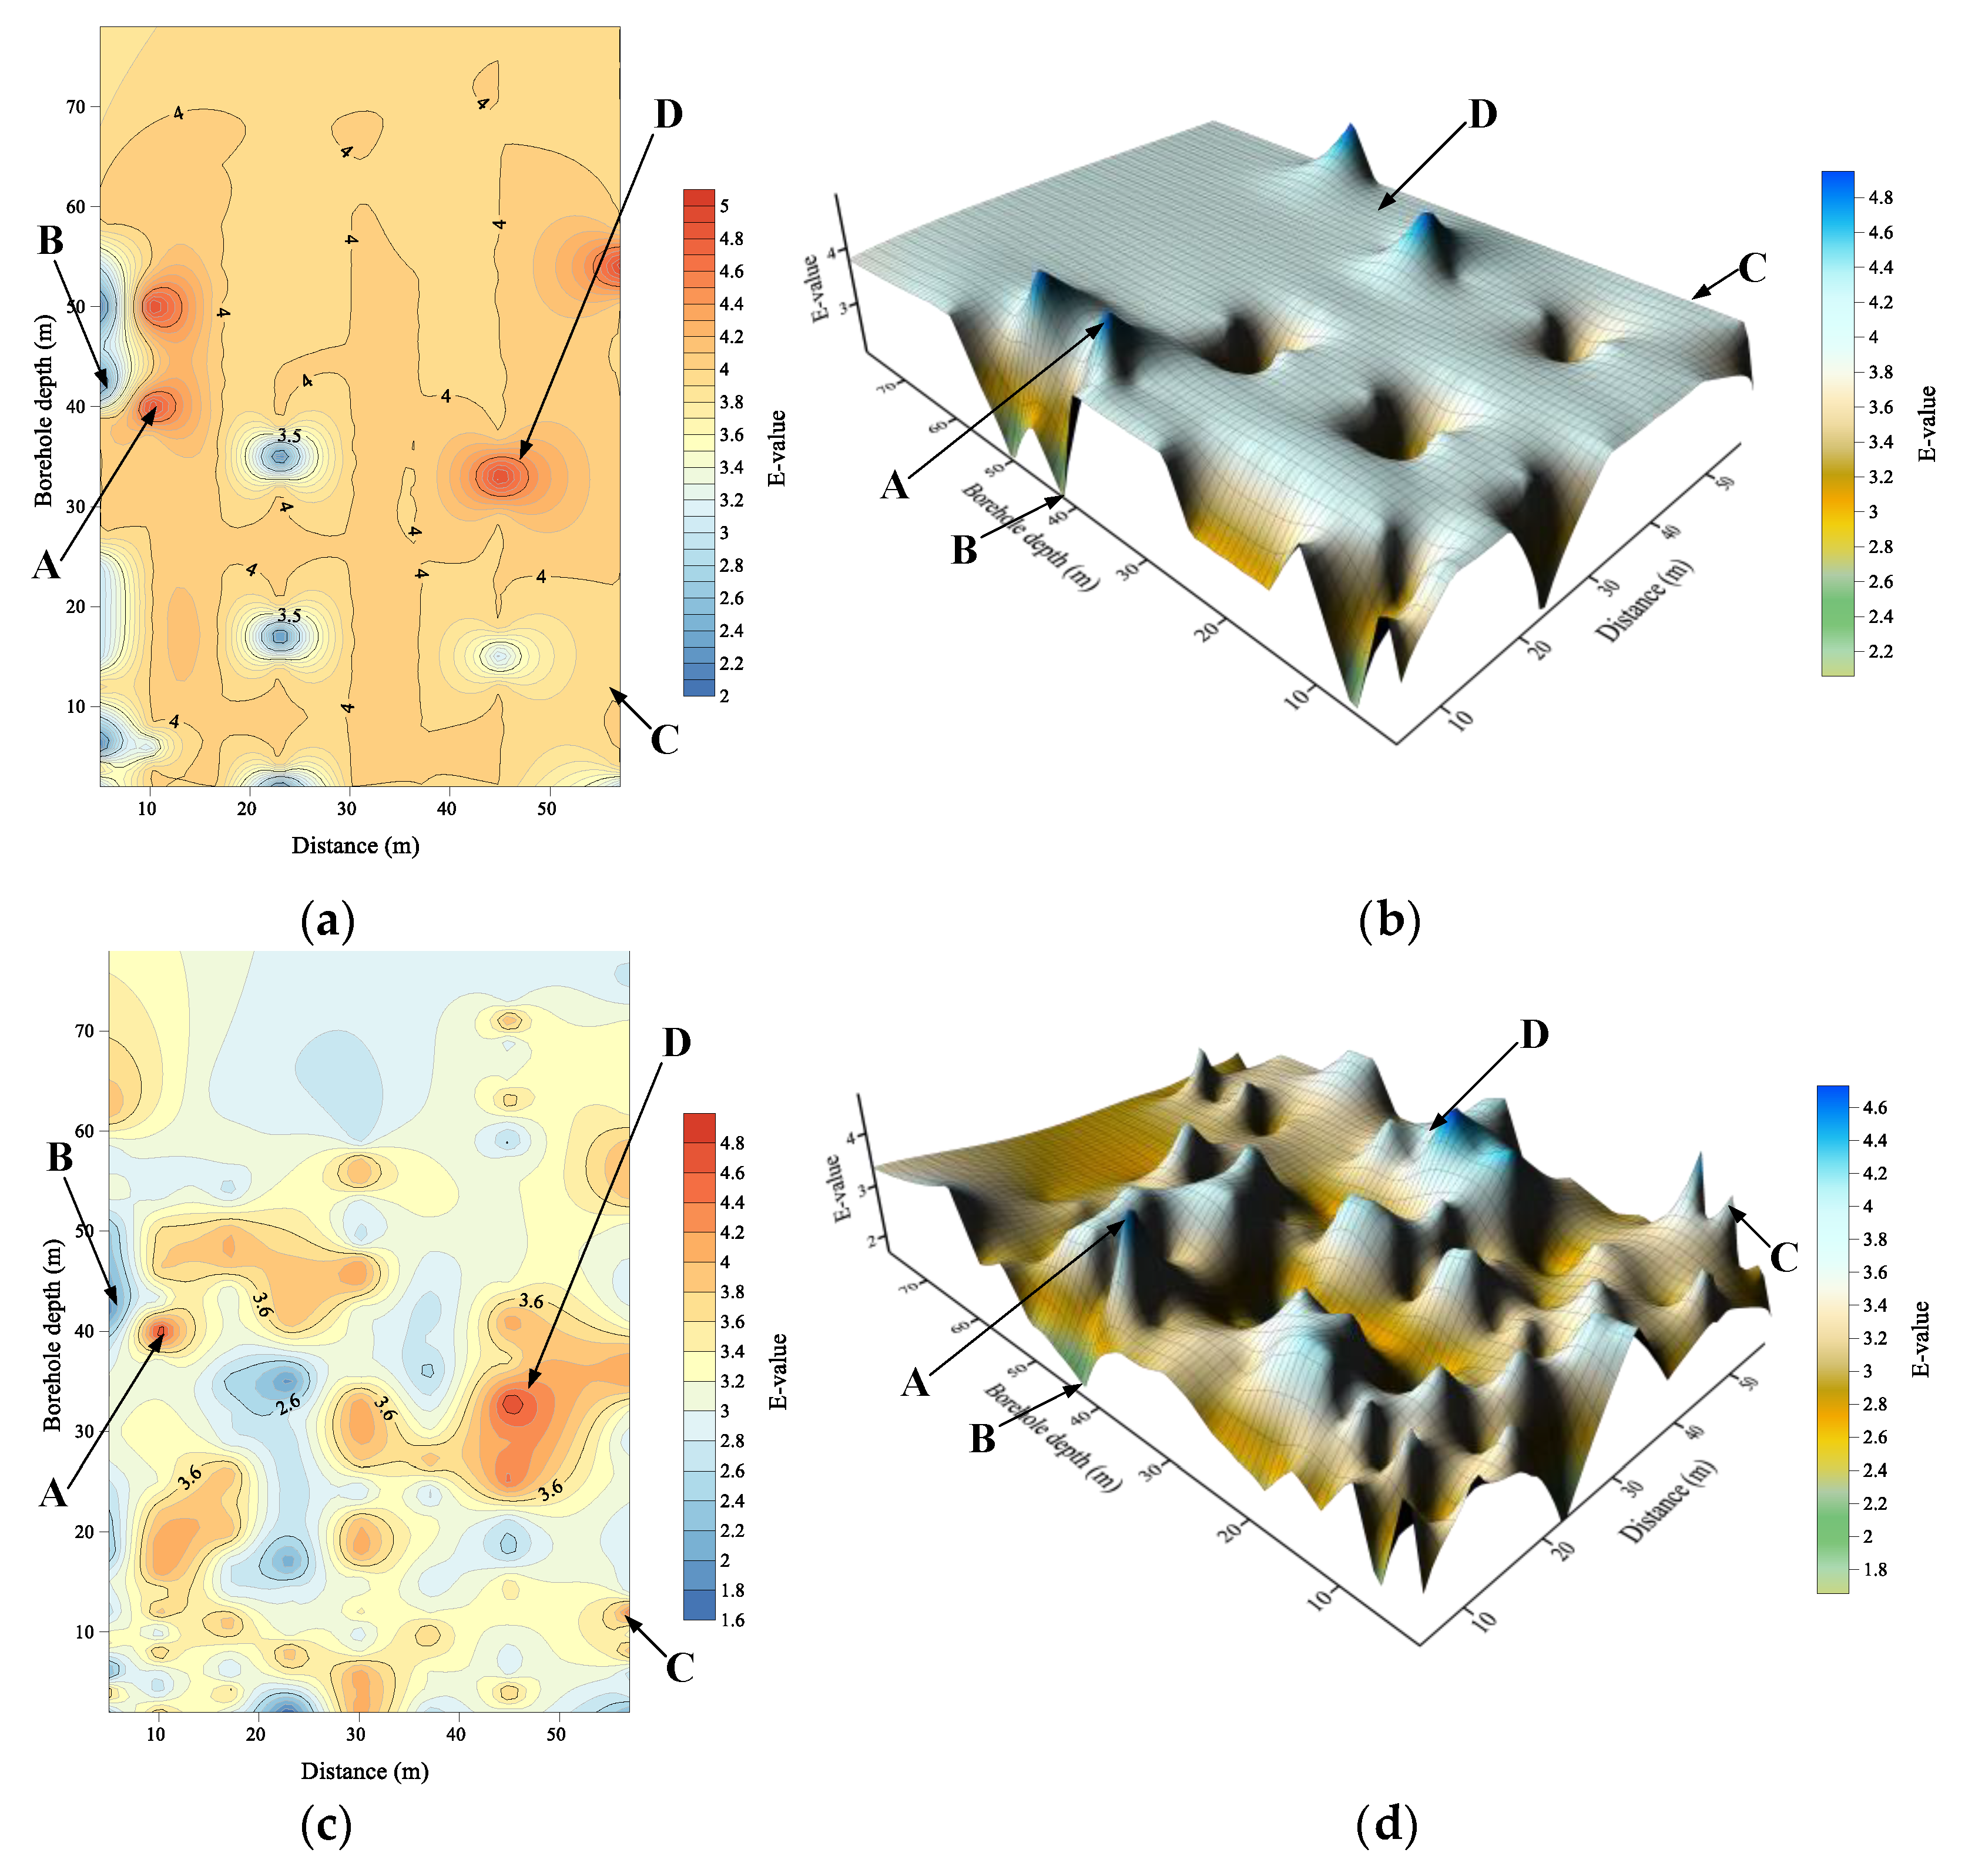
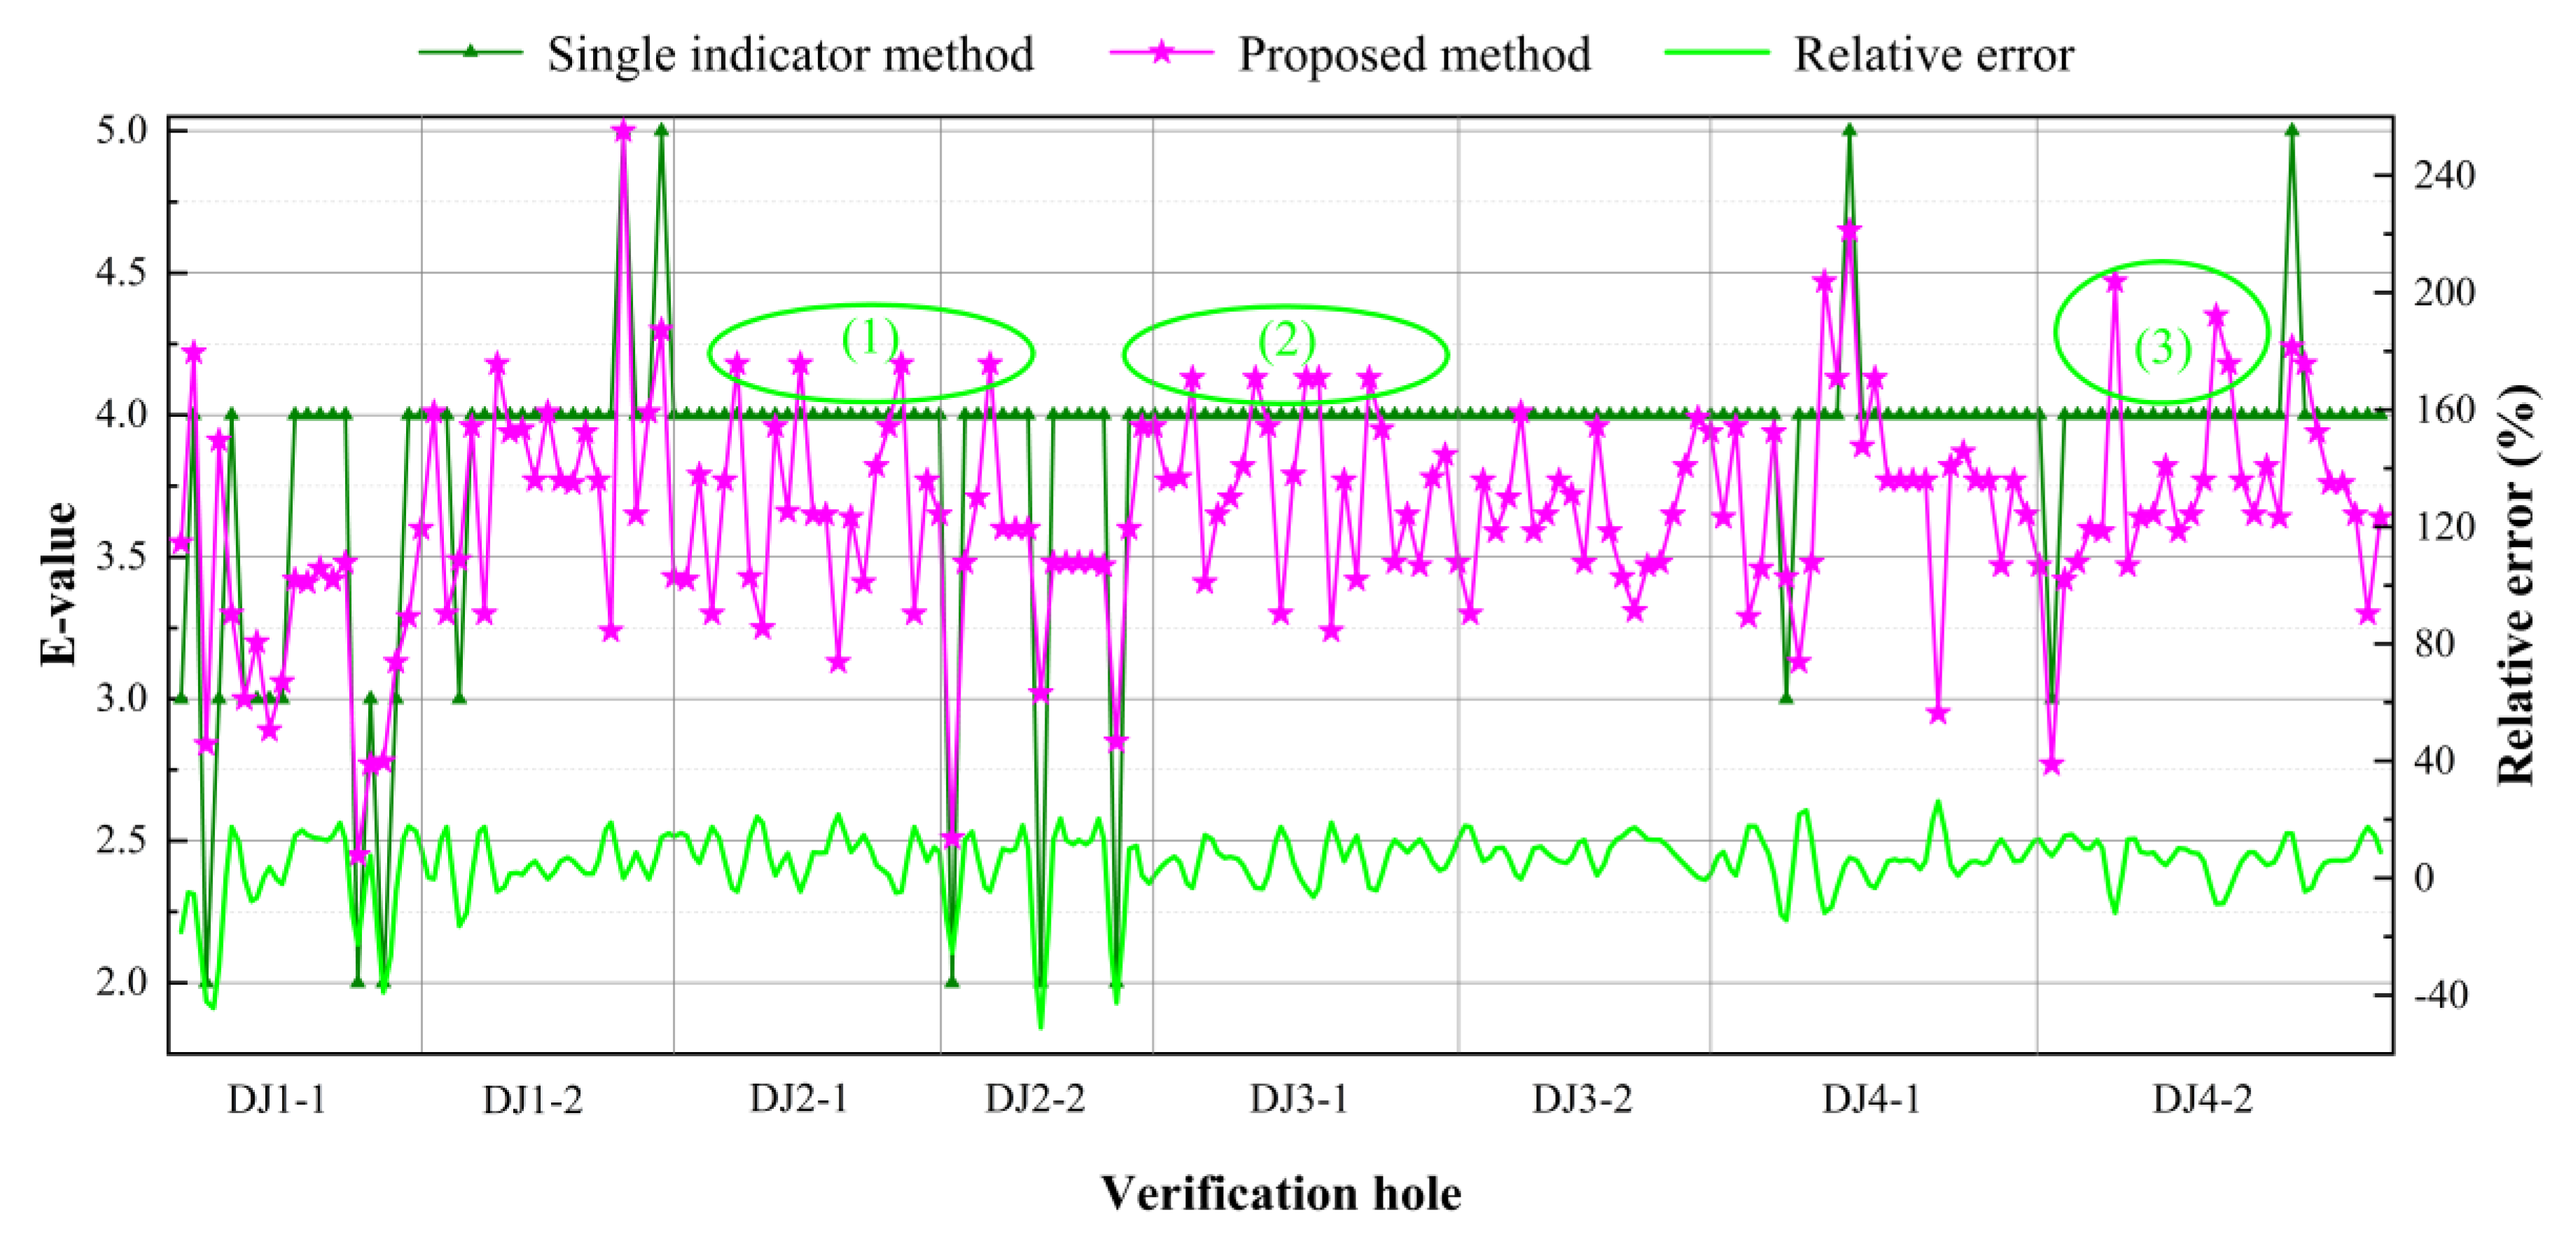
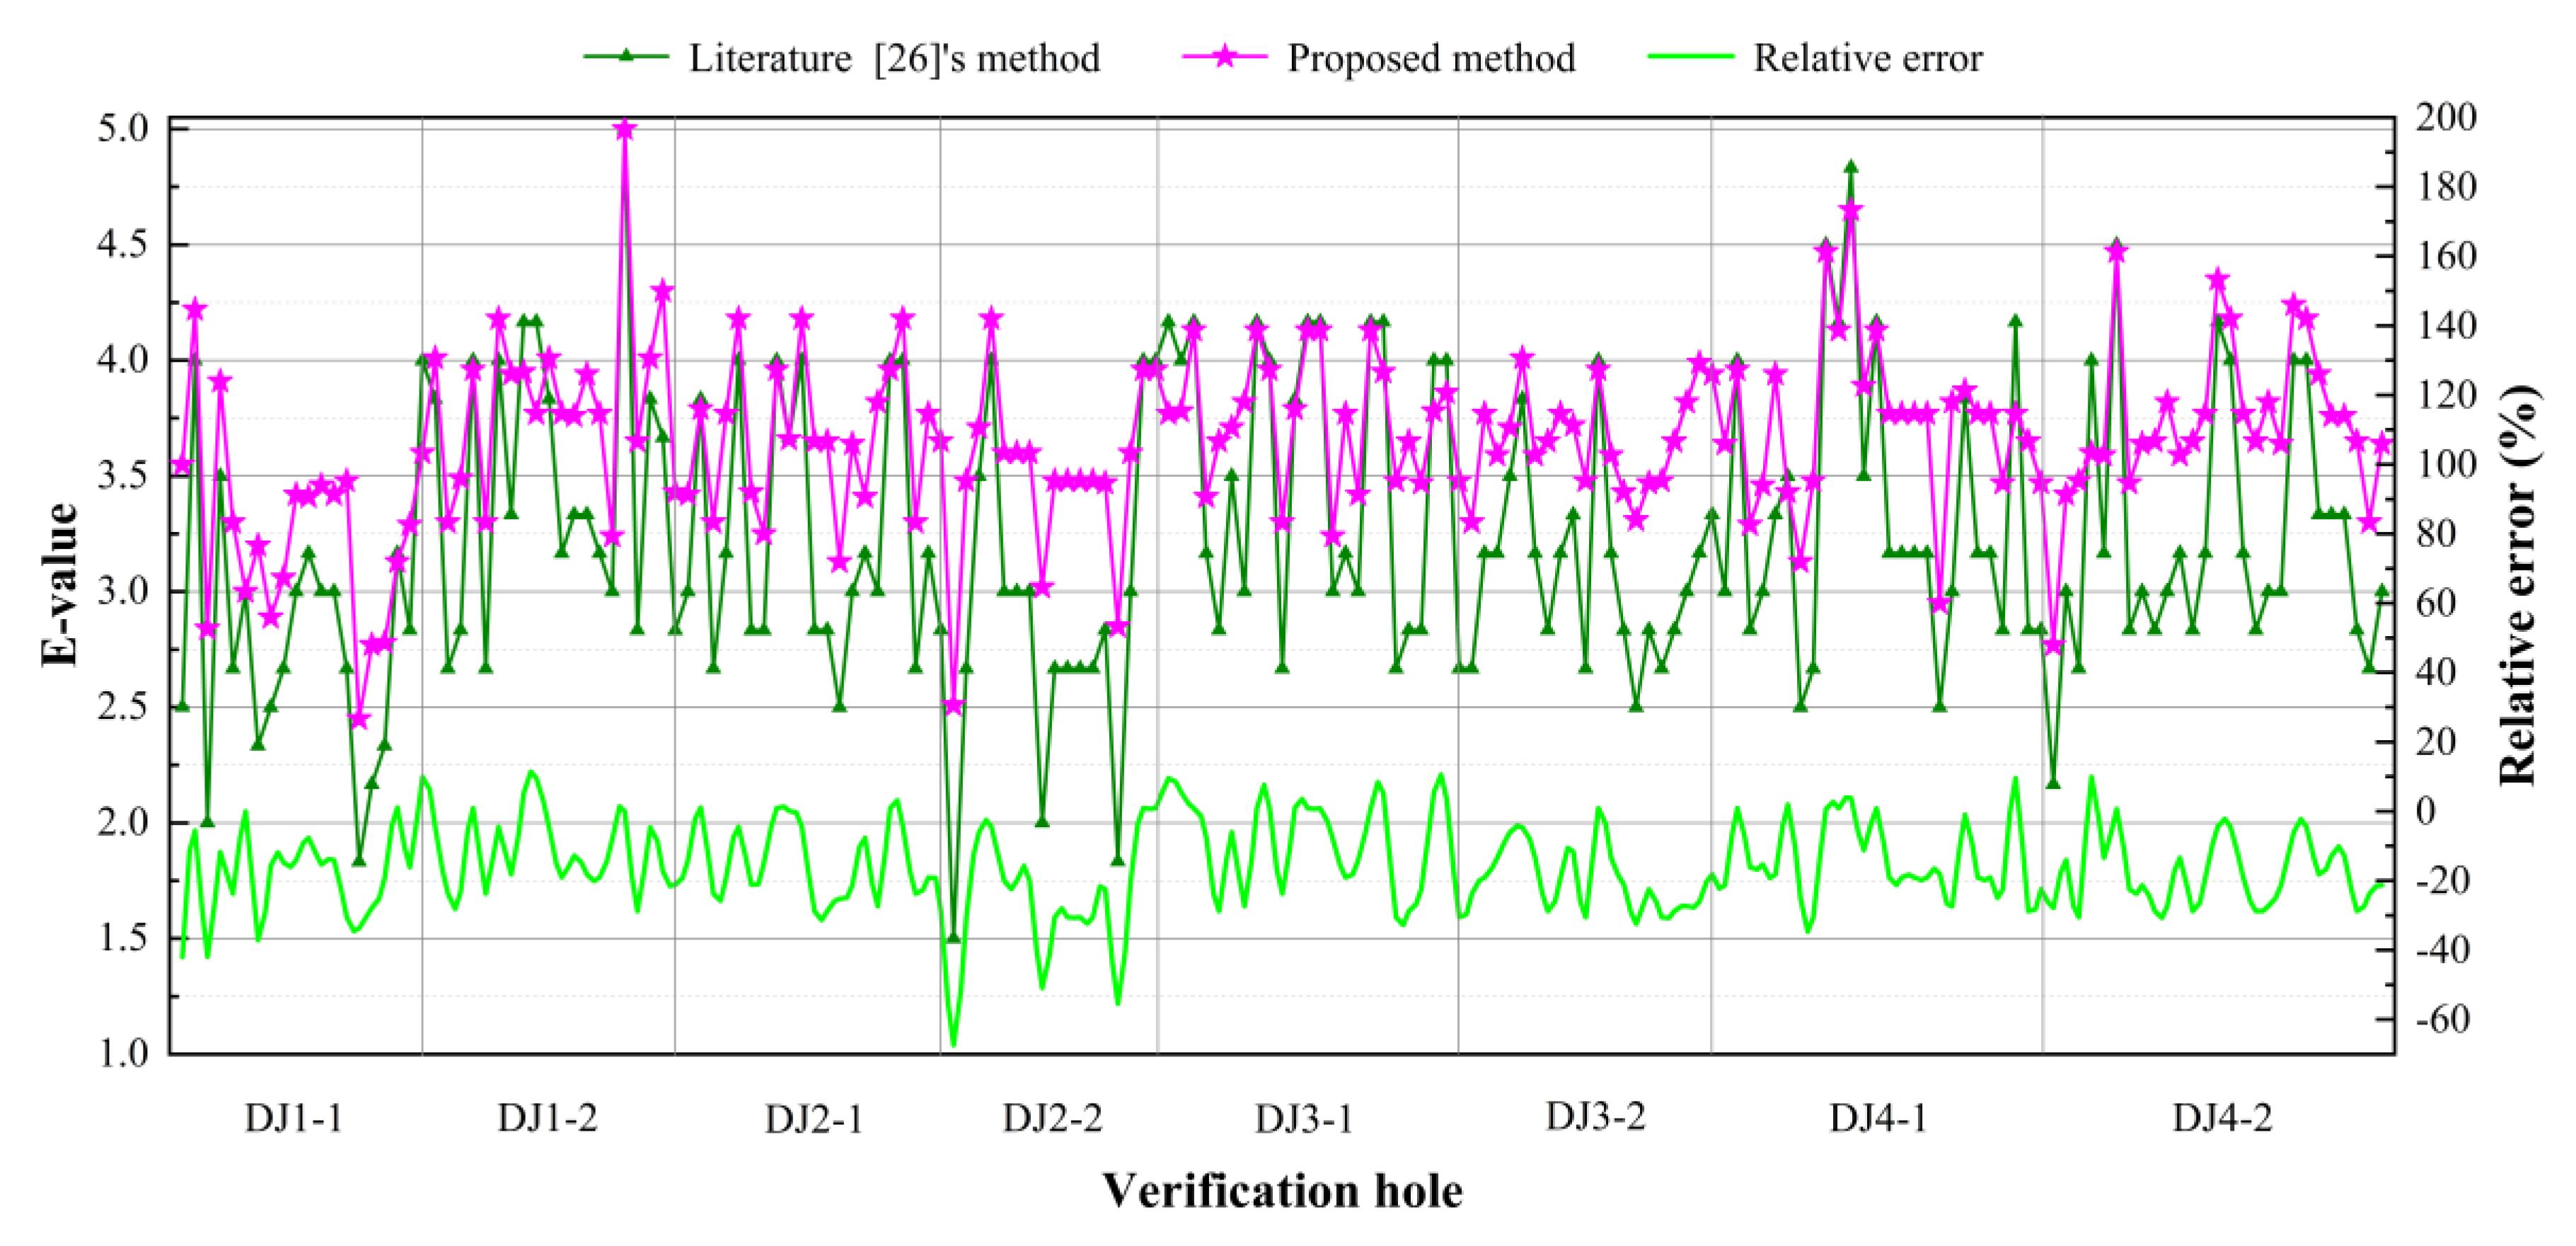
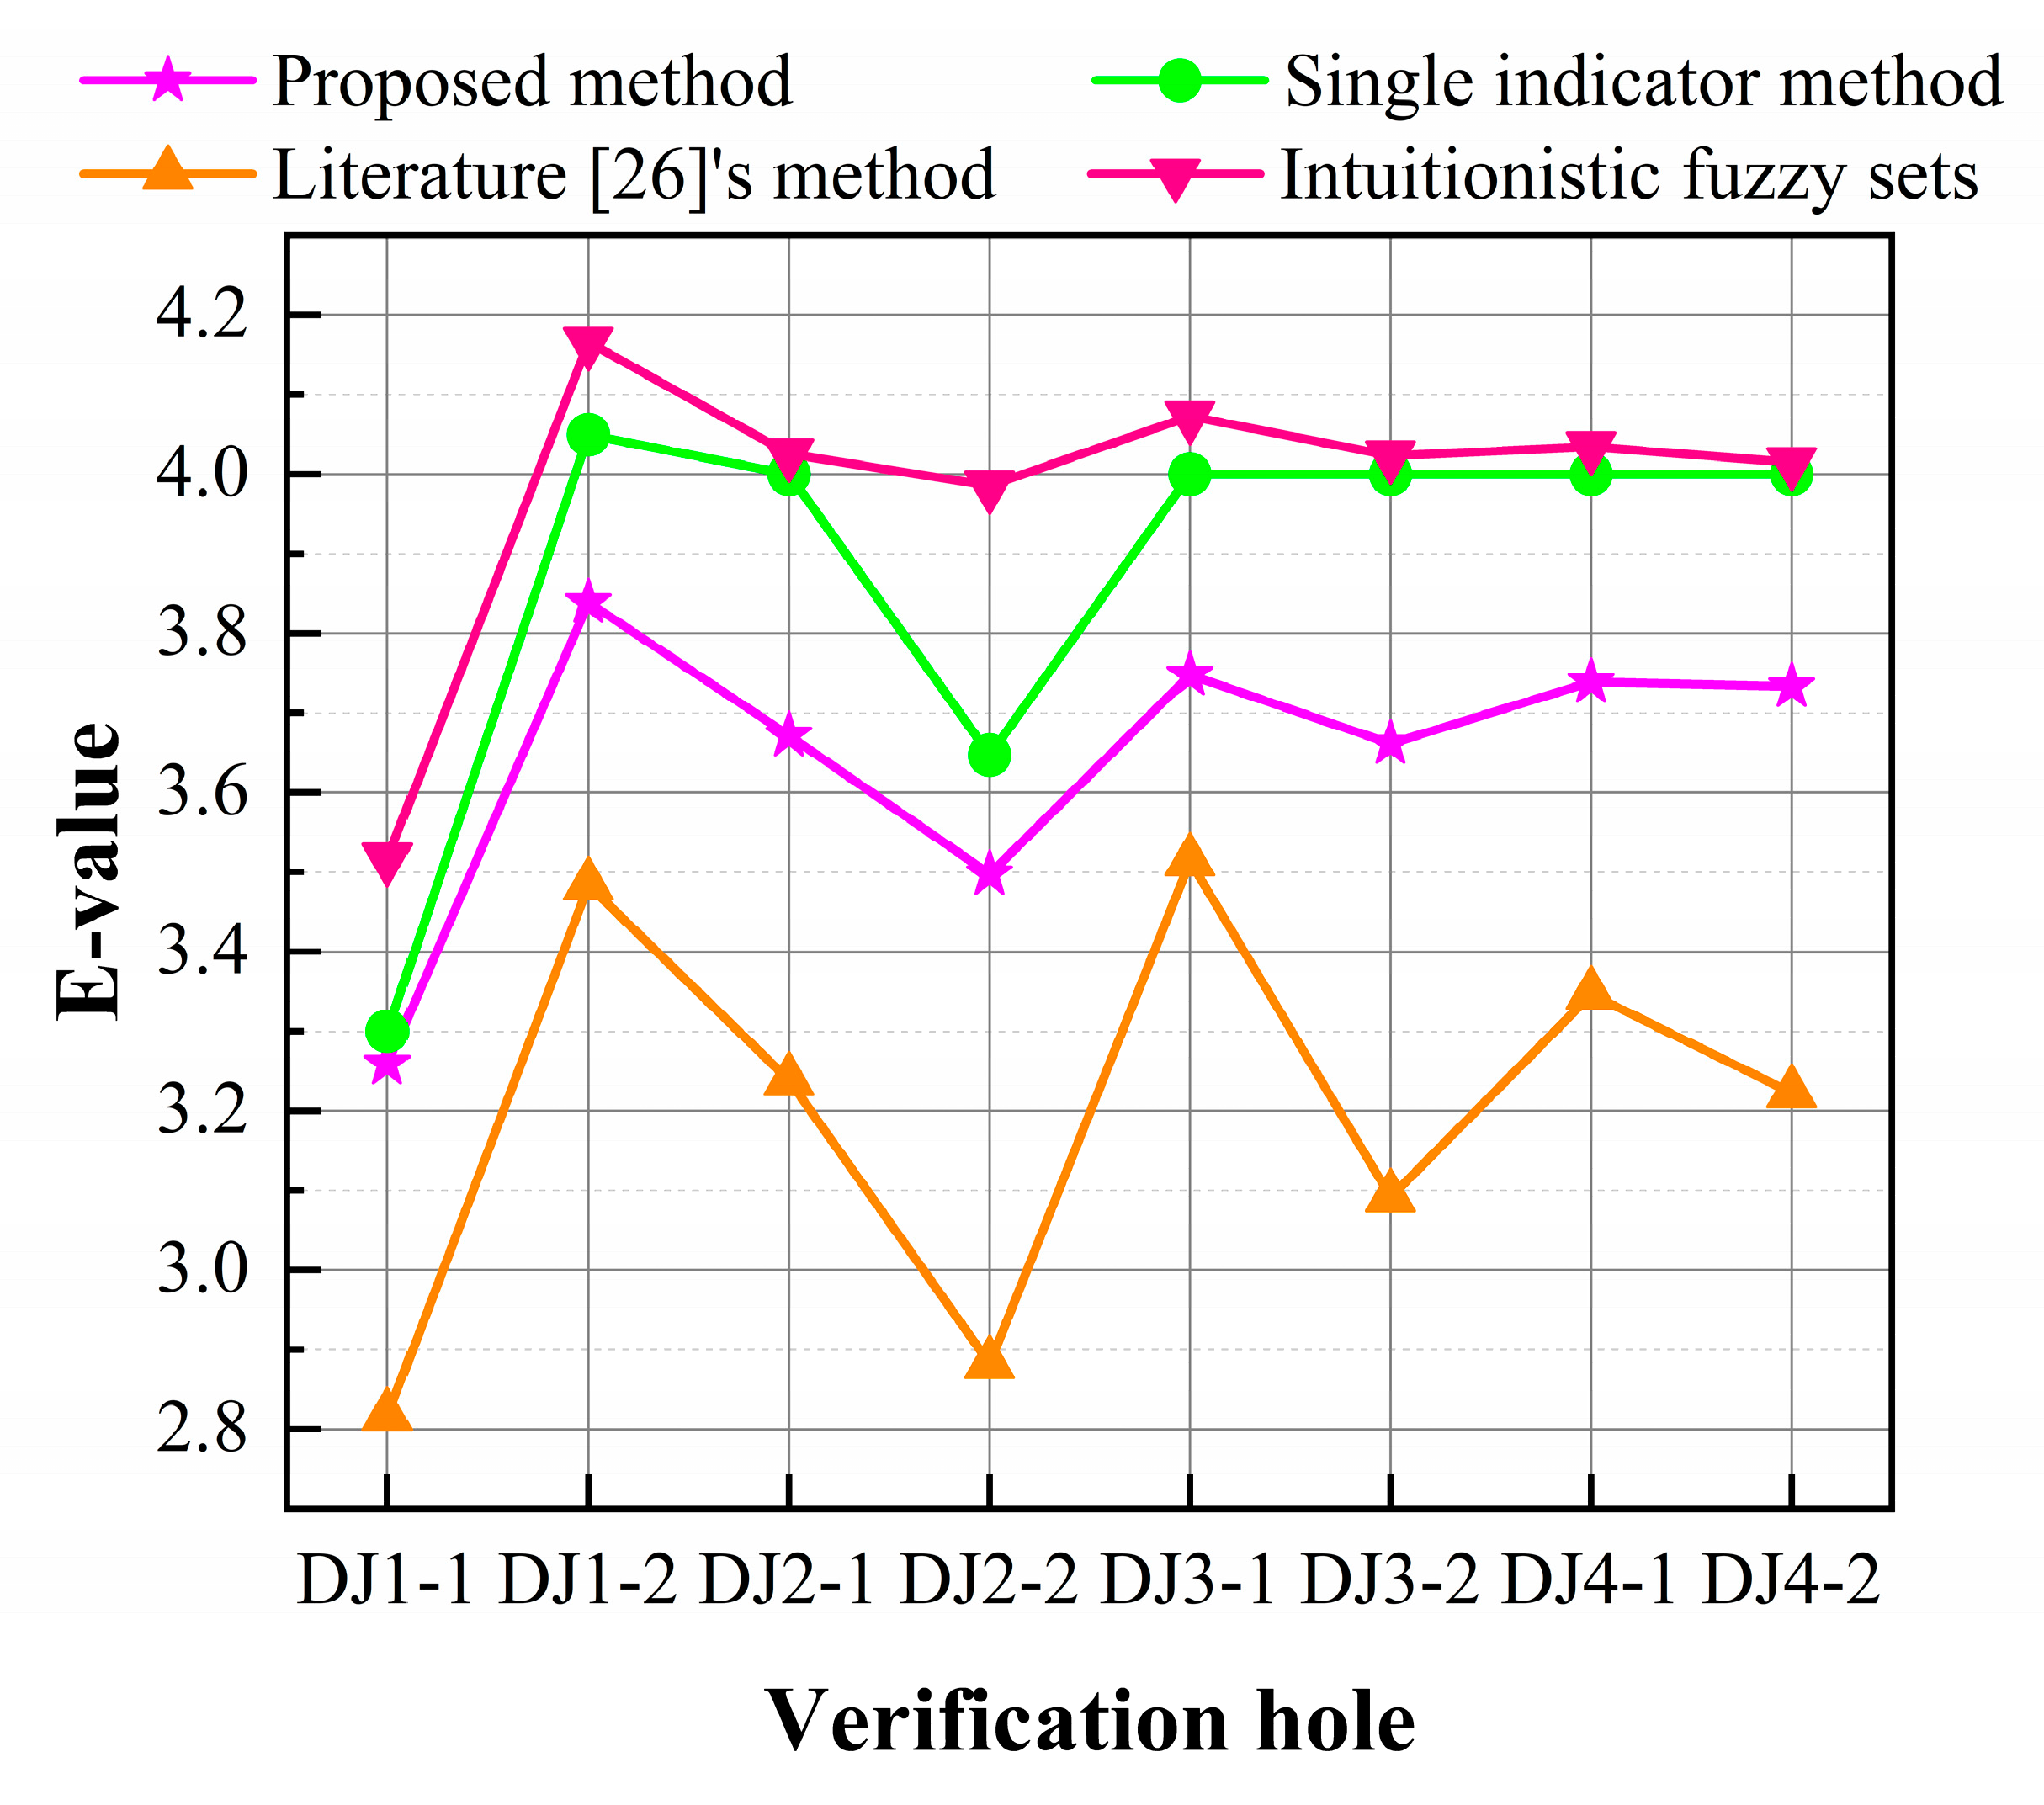
Figure 11, Figure 12, Figure 13, Figure 14 and Figure 15 show that the three methods had consistent evaluation results. First, the mean values of the evaluation results were almost identical: The average value of the proposed method was 3.64, the average value based on the single-indicator evaluation was 3.87, and the average value based on the method of Reference [26] was 3.20. According to the evaluation-level classification criteria, the evaluation results of the three methods show that the grouting efficiency of the study area was generally good. Second, from the details, the results of all three methods at A were 5, which consistently indicated that the grouting efficiency was excellent, and all evaluation results at B were 2–3, which consistently showed that the grouting efficiency was ordinary. Finally, the average relative error between the evaluation results of the proposed method and that of the single-indicator evaluation was only 5% and the average relative error between the evaluation results of the proposed method and that of the evaluation results of the method in Reference [26] was -16%; therefore, the results of the three methods tended to be consistent. Therefore, the proposed method has consistent evaluation results with the original method.
2
The evaluation results of the proposed method were representative. From the results of the consistency analysis, the results of the proposed method were between the results of the single-indicator evaluation and the method in Reference [26]. In other words, the proposed method led to a lower evaluation level than the single-indicator evaluation. This conclusion can be verified in some areas, but the opposite was shown at C and D. At C and D, the results of the single-indicator evaluation were less than 4, which were at the good level, and the results of the proposed method were greater than 4.4, which were at the excellent level; so, the evaluation levels increased. Based on the evaluation results of the method of Reference [26], the rationality of the evaluation results of the proposed method at C and D can be verified. Second, Figure 14 shows that the proposed method had better results than the single-indicator evaluation results in the green areas (1)–(3). Finally, the proposed method had larger evaluation results than the single-indicator evaluation, which accounted for 21.14% of the total 175 intervals. The results of the two methods tended to be identical (the relative errors differing by ±10%) for 108 intervals, which accounted for 61.71% of the total. From the consistency analysis results, compared with the mean value of the method of Reference [26], the evaluation results of the proposed method increased the evaluation level; however, this conclusion could only be verified in some areas. In Figure 15, the evaluation result of the proposed method was less than that of the method of Reference [26] for 35 intervals, which accounted for 20% of the total. The results of the two methods tended to be consistent for 38 intervals, which accounted for 33.14% of the total. Therefore, the proposed method in this paper neither reduces nor improves the evaluation level. It considers the effects of multiple factors on the grouting efficiency; enriches the information in the evaluation result E; enhances the refinement evaluation ability of the grouting efficiency; and makes the grouting-efficiency evaluation results more scientific, reasonable, and representative.
3
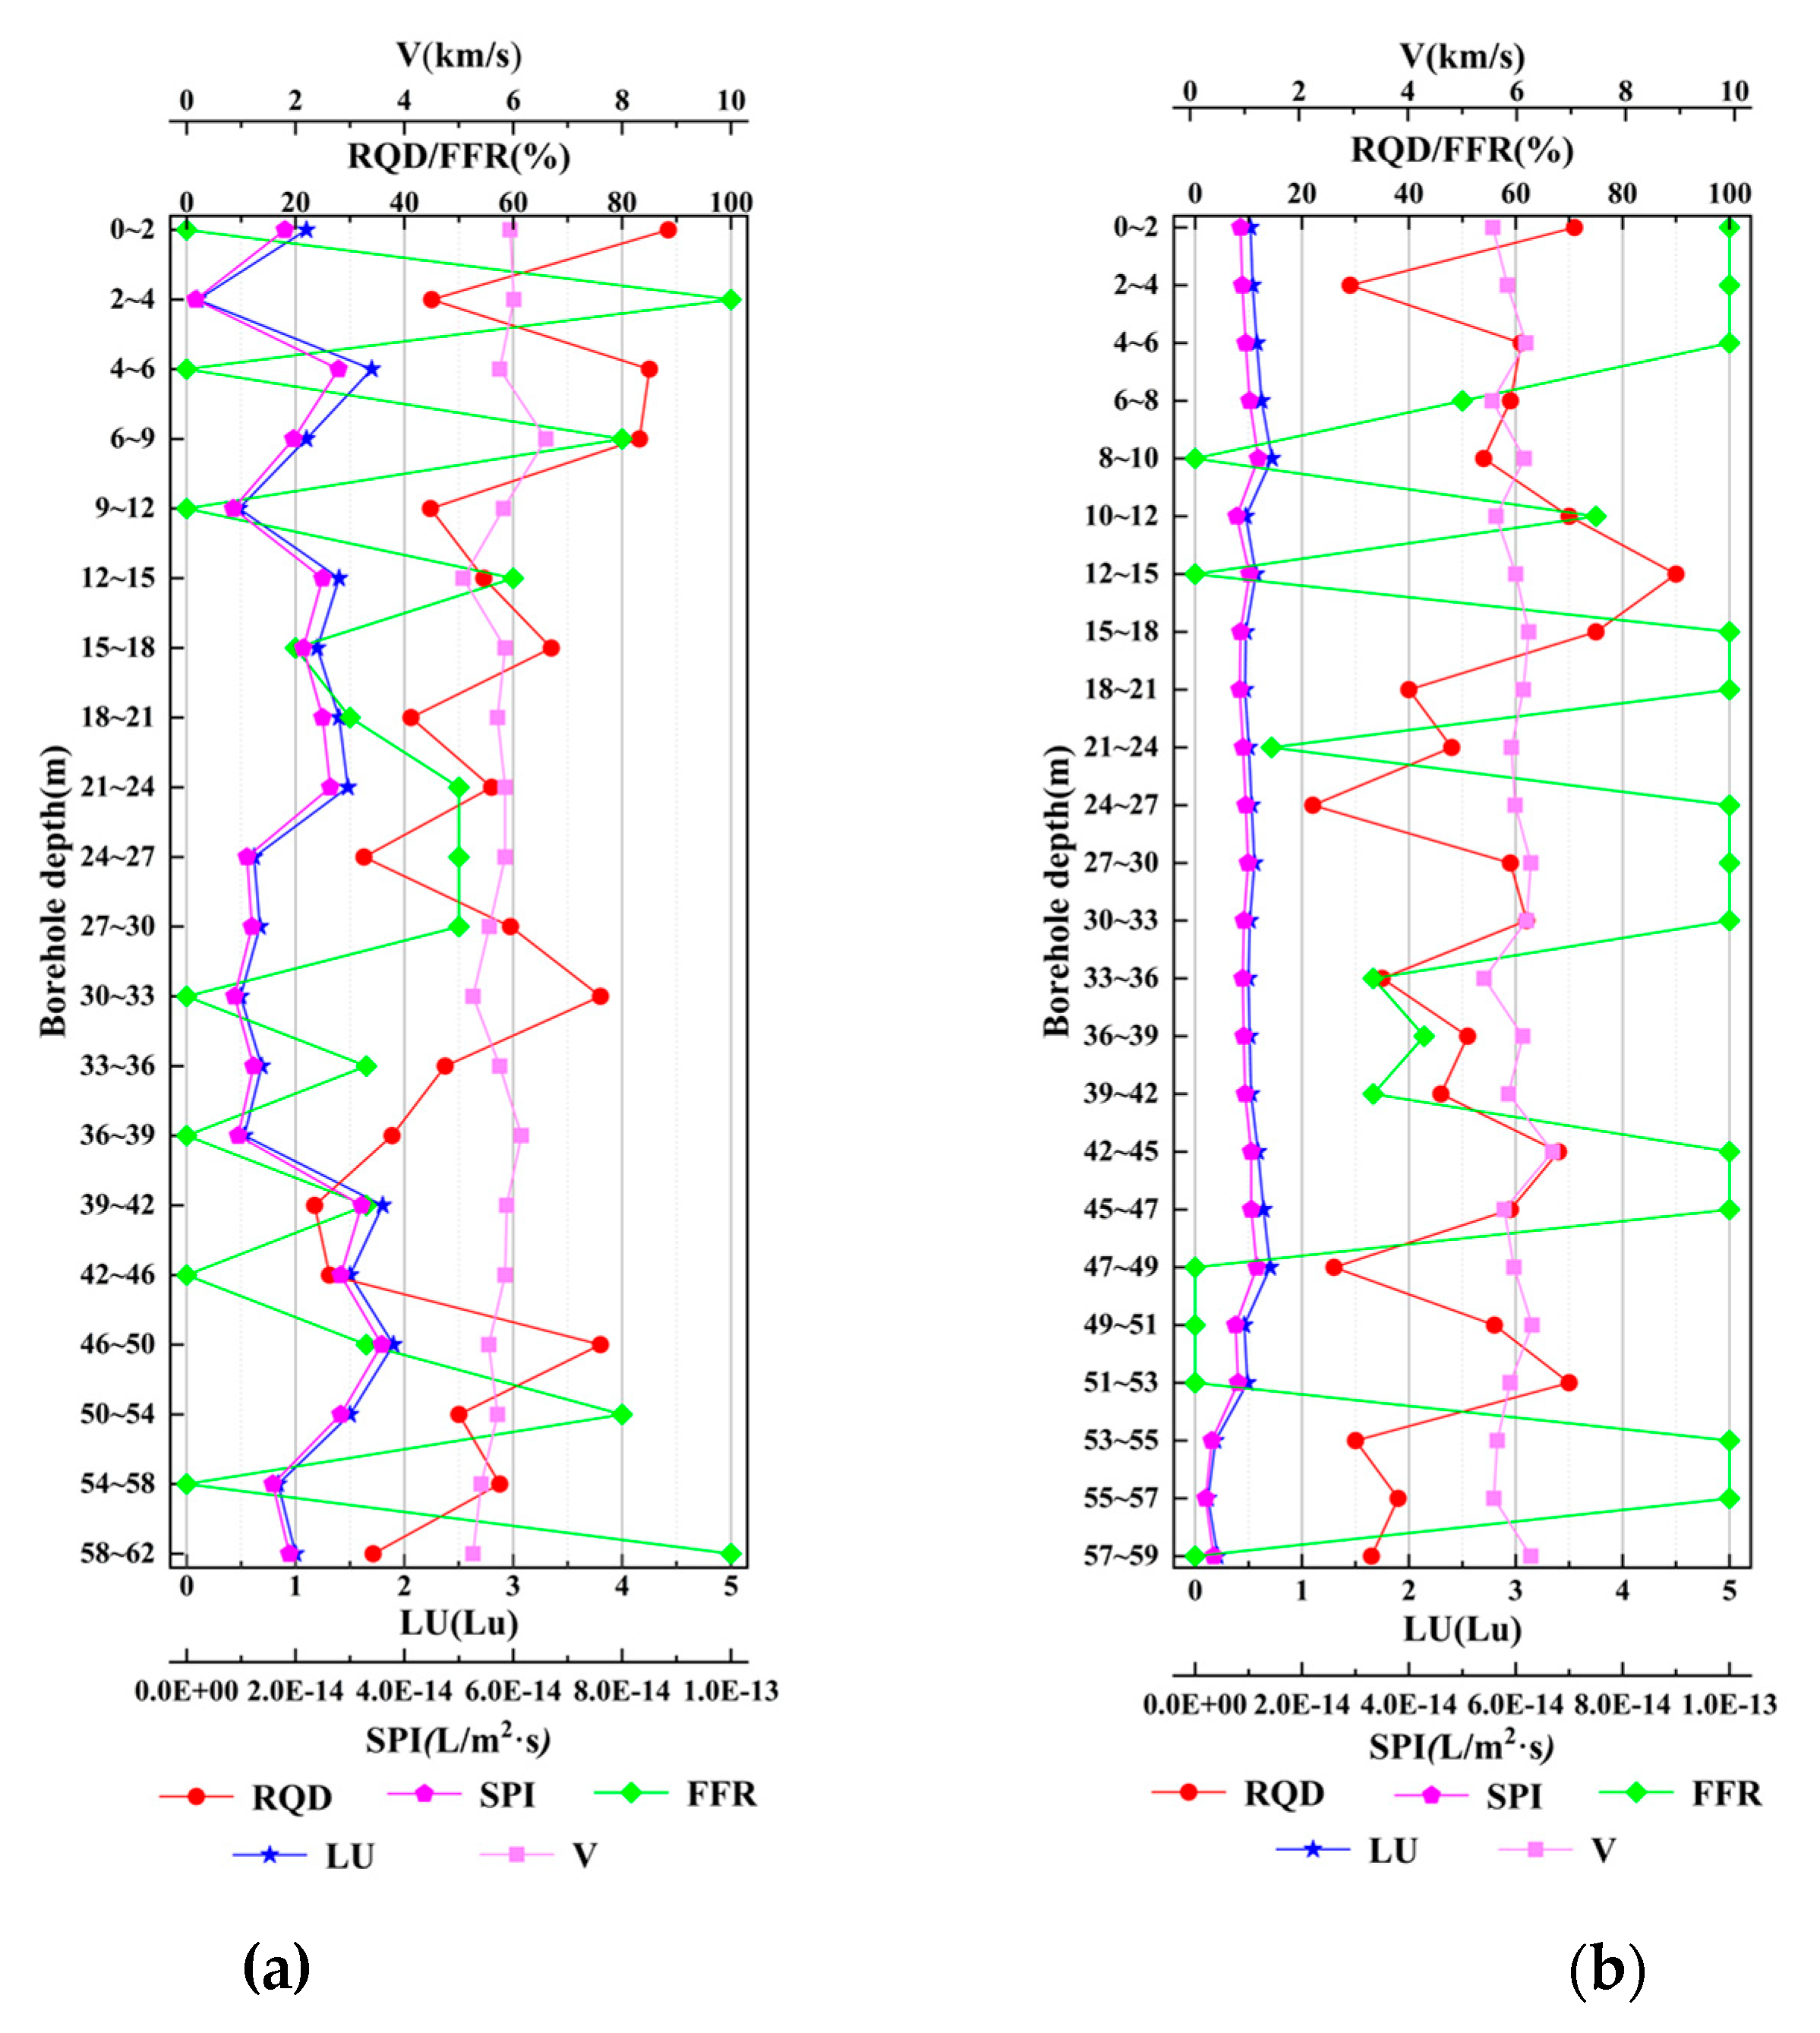
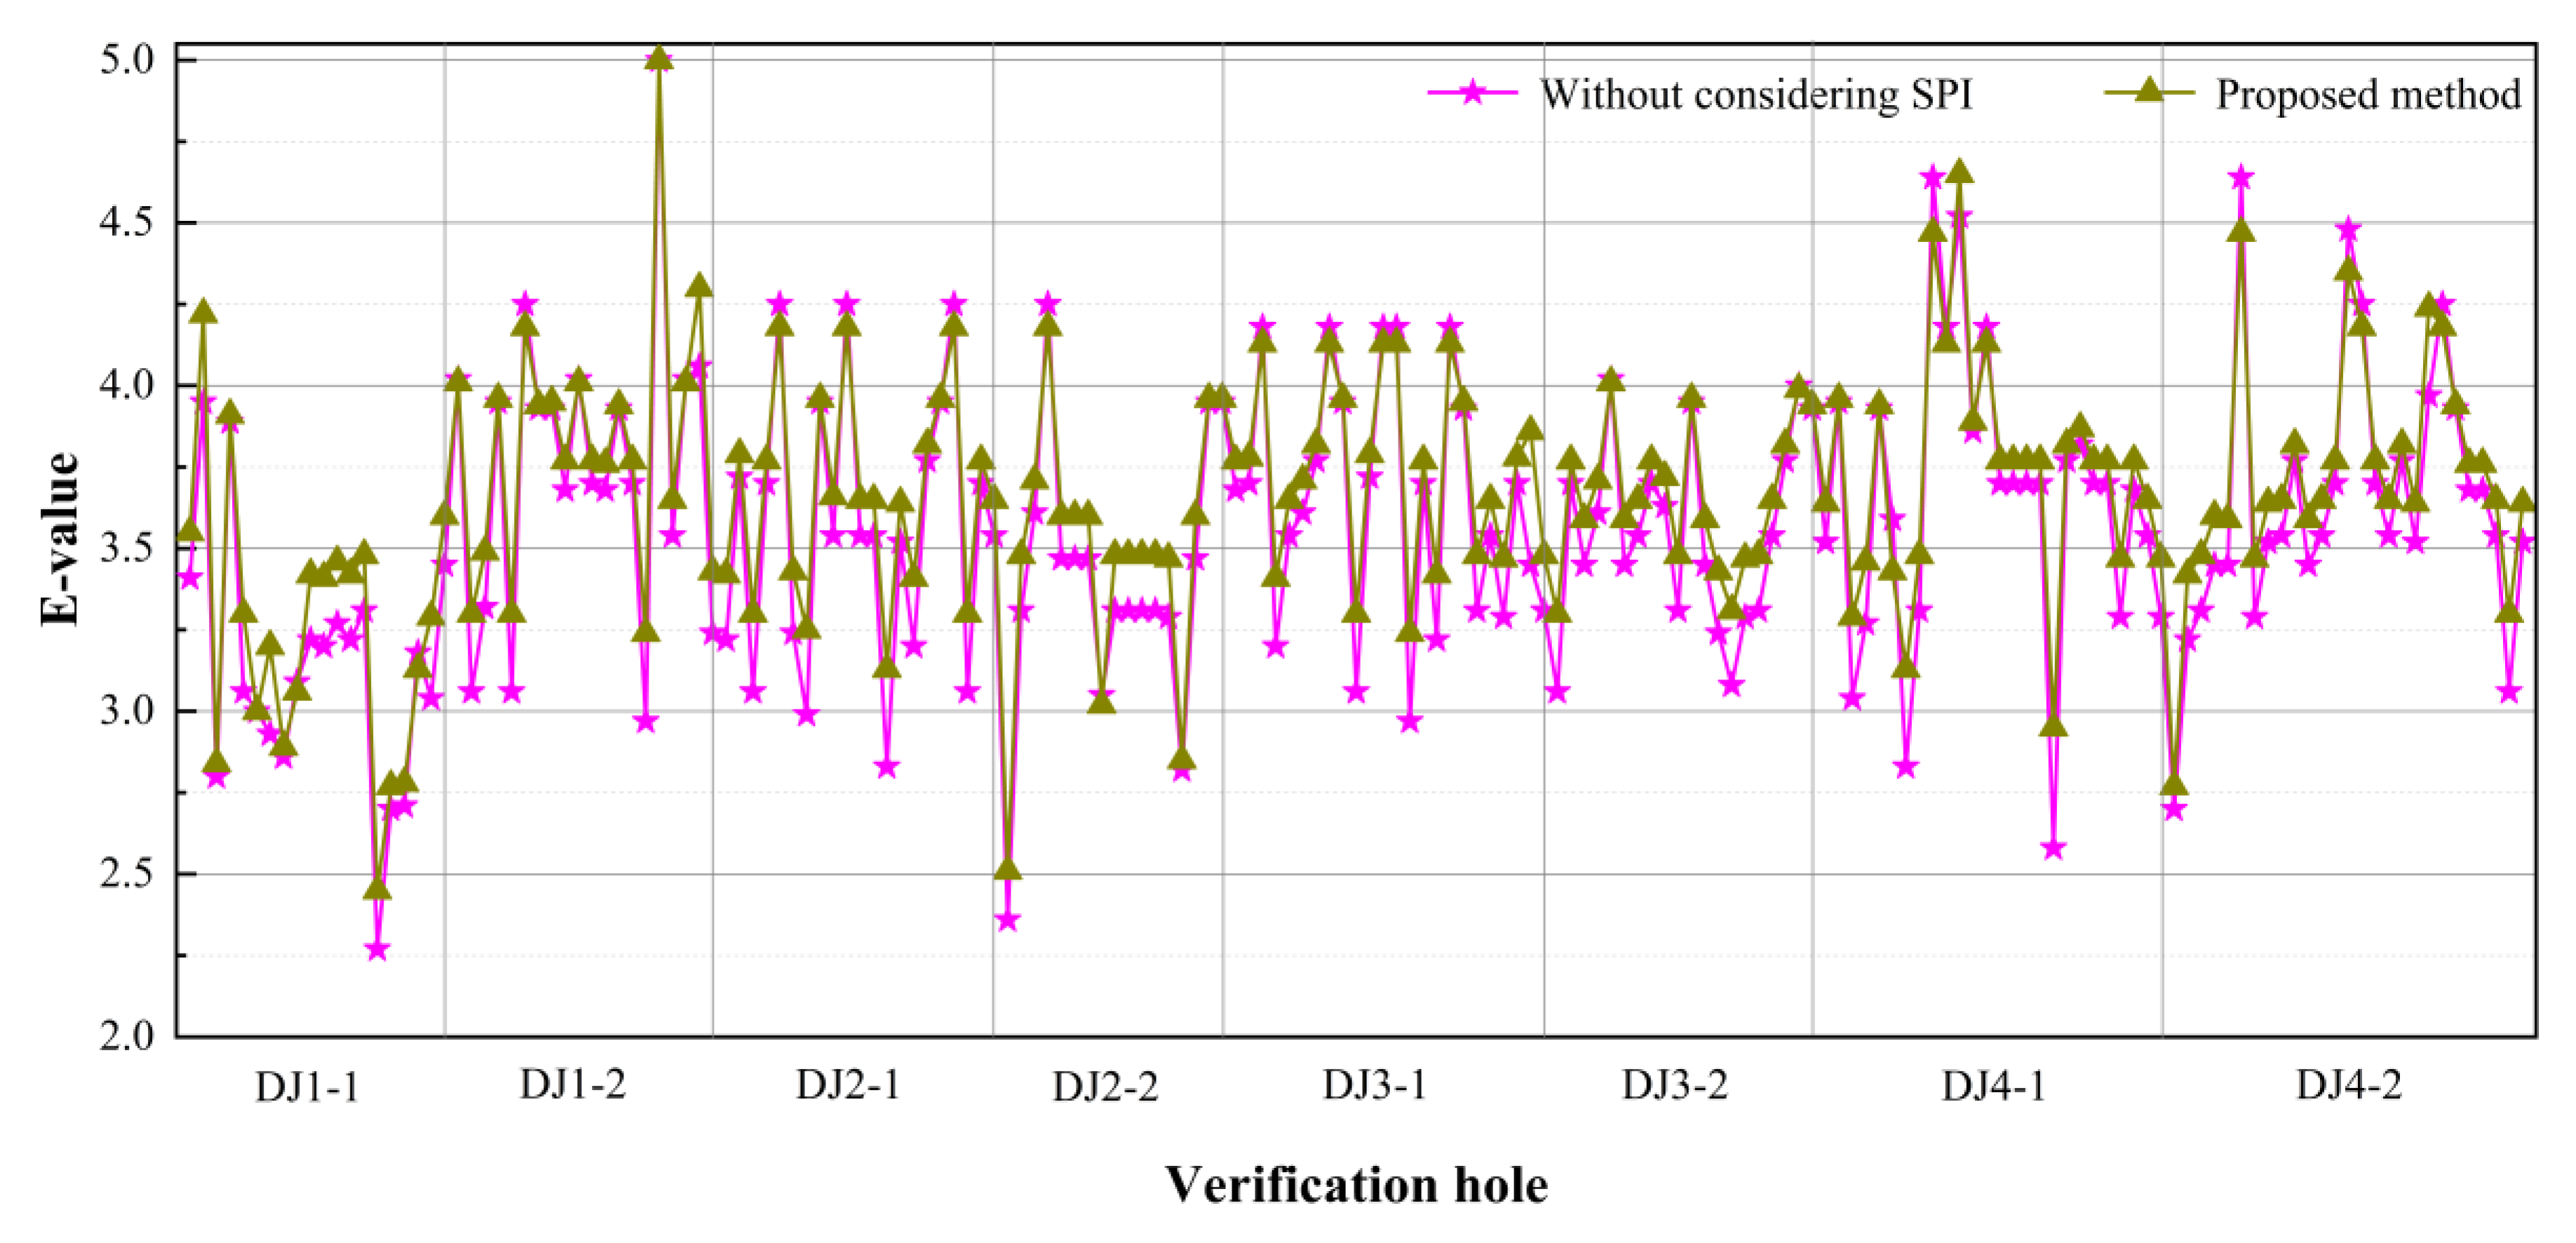
The evaluation results based on the proposed method were superior. First, the original single-indicator evaluation method only relies on the permeability (Lugeon, LU) to evaluate grouting efficiency. There is only one indicator, and it is difficult to achieve a refined evaluation of the grouting efficiency. As the LU of each interval of DJ2-1, DJ3-1, and DJ3-2 was between 0.1–1, as shown in Figure 14, the single-indicator evaluation method considered that each interval E was 4. However, the grouting efficiency is related to LU along with other indicators, such as SPI, V, RQD, and FFR. Therefore, it is difficult to achieve a refined evaluation of grouting using only single-indicator evaluation. Second, compared with the evaluation method proposed in Reference [26], the proposed method can consider the hesitation and bounded rationality of the experts and conforms to the actual decision-making process of the experts, such that the evaluation results are more reasonable.
In summary, compared with the single-indicator evaluation and the evaluation method proposed in Reference [26], the proposed method features good consistency, representativeness, and superiority.

6.2. Rationality of Interval-Valued Intuitionistic Fuzzy Sets

In order to illustrate the rationality of introducing interval-valued intuitionistic fuzzy sets in the field of grouting-efficiency evaluation, the grouting efficiency was obtained based on the intuitionistic fuzzy sets, as shown in Figure 16. Firstly, the mean value of the evaluation results of the proposed method was between the mean values of the other three methods, the correlation between the other three methods was the highest, and the error was minimal; thus, the evaluation results were more scientific and reasonable. Secondly, compared with intuitionistic fuzzy sets, interval-valued intuitionistic fuzzy sets are more reasonable in expressing hesitation using interval numbers. Intuitionistic fuzzy sets require membership, nonmembership, and hesitation to be a concrete real number. In the actual decision-making process, due to the ambiguity of the decision-making environment or the limitations of experts on the understanding of objective things, it is difficult for experts to give a specific real number and it is easier to give an interval number, such that the evaluation results based on interval-valued intuitionistic fuzzy sets are more reasonable. Therefore, it is reasonable to evaluate the grouting efficiency based on interval-valued intuitionistic fuzzy sets.

6.3. Necessity of the Secondary Permeability Index

Many studies have evaluated the grouting efficiency based on indicators such as LU, V, RQD, and FFR. This section will compare and analyze the results of the grouting-efficiency evaluation with and without considering the effects of SPI. The results are shown in Figure 17, and the necessity of the new indicator is verified.
First, Figure 17 shows that the evaluation result obtained without considering SPI was less than that of the proposed method for 149 intervals, which accounted for 85.14% of the total. Meanwhile, the average value obtained without considering SPI was less than that of the proposed method for all verification holes. Therefore, not considering SPI reduced the evaluation results.
Second, grouting efficiency is closely related to groutability. Researchers have often used LU to characterize the groutability of the rock mass. In fact, LU is mainly used to evaluate the permeability of the rock mass, which is not equivalent to the groutability of the rock mass. The main reasons are as follows: (1) There are many microfractures in the rock, which lead to high permeability and poor groutability, and (2) LU is only related to the geometric characteristics of the fracture and the degree of weathering. However, the groutability is related to the fracture opening and quality of the rock. Studies have shown that SPI can be used to describe permeability and to characterize rock quality. Therefore, it is necessary to evaluate grouting efficiency by considering the effect of SPI.
In summary, it is reasonable and necessary to establish a comprehensive evaluation indicator system for SPI.

7. Conclusions

The construction efficiency of curtain grouting is a key point of quality control in dam construction. The traditional grouting-efficiency evaluation model cannot consider the hesitation and bounded rationality of experts and has difficulty in handling the problem of incomplete decision-making information, which makes the evaluation results unreasonable and nonobjective. This research proposed a comprehensive evaluation model for curtain-grouting efficiency assessment based on prospect theory and interval-valued intuitionistic fuzzy sets extended by improved D numbers. Firstly, a comprehensive evaluation method coupled with improved D numbers, interval-valued intuitionistic fuzzy sets, prospect theory, and fuzzy evaluation was proposed. Secondly, an evaluation indicator system including LU, SPI, V, FFR, and RQD was established. Finally, the method was applied to evaluate the curtain-grouting efficiency in a hydropower station in southwest China. The results of this study can be summarized as follows:
1
The comprehensive evaluation model proposed in this paper, which combines the strength of interval-valued intuitionistic fuzzy sets in defining the expert’s hesitation, the advantage of prospect theory in considering the bounded rationality of experts, and the superiority of improved D numbers in effectively handling incomplete decision-making information in the evaluation process, makes the evaluation results more objective and reasonable.
2
Considering the effect of the secondary permeability index, the proposed evaluation indicators system consists of LU, SPI, FFR, RQD, and V; integrates several types of grouting-efficiency evaluation technologies, and ensures a more comprehensive evaluation result. In addition, based on the ordinary Kriging method, the evaluation results of the verification holes are mapped to the grouting construction area, which realizes the comprehensive evaluation of grouting efficiency.
3
Compared with the original evaluation methods, the proposed method has the advantages of consistency, representativeness, and superiority, which can increase the reliability of the grouting-efficiency evaluation.
The proposed method can consider the expert’s hesitation and bounded rationality as well as can handle incomplete decision-making information in the evaluation process; it can be applied to decision-making, evaluation, method optimization, and other fields. In the future, it is necessary to combine this method with machine-learning technology to achieve the dynamic evaluation of the efficiency of grouting construction. In addition, this paper focused on the problem of construction-efficiency assessment of curtain-grouting engineering. However, due to the complexity of real-life environments, quantitative attributes and qualitative attributes often exist in most decision problems at the same time. Therefore, the use of multiple types of data, such as interval numbers and interval linguistic variables, as evaluation is the next research direction.

Author Contributions

Z.L. and W.S. conceived, designed, and wrote the paper; B.C. and X.W. provided the help of overall guidance and funds; H.Y. revised the manuscript.

Funding

This research was funded by the National Key R&D Program of China (grant number 2018YFC0406704), the Science Fund for Creative Research Groups of the National Natural Science Foundation of China (grant number 51621092), and the National Key R&D Program of China (grant number 2018YFC0406706).

Acknowledgments

The authors are very grateful to the respected editors and the anonymous referees for their insightful and constructive comments, which helped to improve the overall quality of the paper.

Conflicts of Interest

The authors declare no conflict of interest.

Appendix A

(1) The calculation equation of the standard deviation can be described as Equation (A1):
S t d = i = 1 N ( X i X ¯ ) 2 N 1
where Xi is the value of sample i; X ¯ is the mean of the sample; and N is the number of samples.
(2) The calculation equation of relative error can be described as Equation (A2):
ζ = a b a × 100 %

References

  1. Li, X.; Zhong, D.; Ren, B.; Fan, G.; Cui, B. Prediction of curtain grouting efficiency based on ANFIS. Bull. Eng. Geol. Environ. 2019, 78, 281–309. [Google Scholar] [CrossRef]
  2. Zhu, Y.; Wang, X.; Deng, S.; Chen, W.; Shi, Z.; Xue, L.; Lv, M. Grouting Process Simulation Based on 3D Fracture Network Considering Fluid–Structure Interaction. Appl. Sci. 2019, 9, 667. [Google Scholar] [CrossRef]
  3. Dreese, T.L.; Wilson, D.B.; Heenan, D.M.; Cockburn, J. State of the Art in Computer Monitoring and Analysis of Grouting. In Proceedings of the Third International Conference on Grouting and Ground Treatment, New Orleans, Louisiana, 10–12 February 2003; pp. 1440–1453. [Google Scholar]
  4. Kvartsberg, S.; Fransson, Å. Hydrogeological characterisation and stochastic modelling of a hydraulically conductive fracture system affected by grouting: A case study of horizontal circular drifts. Tunn. Undergr. Sp. Technol. 2013, 38, 38–49. [Google Scholar] [CrossRef]
  5. Alberti, L.; Angelotti, A.; Antelmi, M.; La Licata, I. A numerical study on the impact of grouting material on borehole heat exchangers performance in aquifers. Energies 2017, 10, 703. [Google Scholar] [CrossRef]
  6. Tinoco, J.; Gomes Correia, A.; Cortez, P. Application of data mining techniques in the estimation of the uniaxial compressive strength of jet grouting columns over time. Constr. Build. Mater. 2011, 25, 1257–1262. [Google Scholar] [CrossRef] [Green Version]
  7. Spross, J.; Johansson, F.; Uotinen, L.K.T.; Rafi, J.Y. Using Observational Method to Manage Safety Aspects of Remedial Grouting of Concrete Dam Foundations. Geotech. Geol. Eng. 2016, 34, 1613–1630. [Google Scholar] [CrossRef] [Green Version]
  8. Lisa, H.; Christian, B.; Åsa, F.; Gunnar, G.; Johan, F. A hard rock tunnel case study: Characterization of the water-bearing fracture system for tunnel grouting. Tunn. Undergr. Sp. Technol. 2012, 30, 132–144. [Google Scholar] [CrossRef]
  9. Kim, Y.U.; Park, J.; Chun, Y.W.; Zhang, G.M. Evaluation and prediction of physical properties of pressure grouting using laboratory testing and elastic wave velocity. KSCE J. Civ. Eng. 2013, 17, 364–367. [Google Scholar] [CrossRef]
  10. Le, H.; Sun, S.; Wei, J. Influence of Types of Grouting Materials on Compressive Strength and Crack Behavior of Rocklike Specimens with Single Grout-Infilled Flaw under Axial Loads. J. Mater. Civ. Eng. 2018, 31, 06018022. [Google Scholar] [CrossRef]
  11. Barrages et Geologic Methods de Recherché Terrasement et un Permeabilisation. Available online: https://link.springer.com/article/10.1007/s12205-019-0519-y (accessed on 28 August 2019).
  12. Roman, W.M.; Hockenberry, A.N.; Berezniak, J.N.; Wilson, D.B.; Knight, M.A. Evaluation of grouting for hydraulic barriers in rock. Environ. Eng. Geosci. 2013, 19, 363–375. [Google Scholar] [CrossRef]
  13. Saeidi, H.; Ghafoori, M.; Lashkaripour, G.R.; Ghafoori, M. Evaluation of grout curtain performance and seepage behavior in Doosti Dam, Iran. Indian J. Nat. Sci. 2015, 6, 8539–8551. [Google Scholar]
  14. Lisa, H.; Gunnar, G.; Åsa, F.; Tommy, N. A statistical grouting decision method based on water pressure tests for the tunnel construction stage-A case study. Tunn. Undergr. Sp. Technol. 2013, 33, 54–62. [Google Scholar] [CrossRef]
  15. Sadeghiyeh, S.M.; Hashemi, M.; Ajalloeian, R. Comparison of permeability and groutability of ostur dam site rock mass for grout curtain design. Rock Mech. Rock Eng. 2013, 46, 341–357. [Google Scholar] [CrossRef]
  16. Butrón, C.; Gustafson, G.; Fransson, Å.; Funehag, J. Drip sealing of tunnels in hard rock: A new concept for the design and evaluation of permeation grouting. Tunn. Undergr. Sp. Technol. 2010, 25, 114–121. [Google Scholar] [CrossRef]
  17. Deng, S.; Wang, X.; Zhu, Y.; Lv, F.; Wang, J. Hybrid Grey Wolf Optimization Algorithm–Based Support Vector Machine for Groutability Prediction of Fractured Rock Mass. J. Comput. Civ. Eng. 2018, 33, 1–9. [Google Scholar] [CrossRef]
  18. Öge, İ.F. Prediction of cementitious grout take for a mine shaft permeation by adaptive neuro-fuzzy inference system and multiple regression. Eng. Geol. 2017, 228, 238–248. [Google Scholar] [CrossRef]
  19. Funehag, J.; Gustafson, G. Design of grouting with silica sol in hard rock-New design criteria tested in the field, Part II. Tunn. Undergr. Sp. Technol. 2008, 23, 9–17. [Google Scholar] [CrossRef]
  20. Hernqvist, L.; Fransson, Å.; Gustafson, G.; Emmelin, A.; Eriksson, M.; Stille, H. Analyses of the grouting results for a section of the APSE tunnel at Äspö Hard Rock Laboratory. Int. J. Rock Mech. Min. Sci. 2009, 46, 439–449. [Google Scholar] [CrossRef]
  21. Chen, M.; Lu, W.; Zhang, W.; Yan, P.; Zhou, C. An Analysis of Consolidation Grouting Effect of Bedrock Based on its Acoustic Velocity Increase. Rock Mech. Rock Eng. 2015, 48, 1259–1274. [Google Scholar] [CrossRef]
  22. Wang, H.; Zheng, P.; Zhao, W.; Tian, H. Application of a combined supporting technology with U-shaped steel support and anchor-grouting to surrounding soft rock reinforcement in roadway. J. Cent. South Univ. 2018, 25, 1240–1250. [Google Scholar] [CrossRef]
  23. Zolfaghari, A.; Sohrabi Bidar, A.; Maleki Javan, M.R.; Haftani, M.; Mehinrad, A. Evaluation of rock mass improvement due to cement grouting by Q-system at Bakhtiary dam site. Int. J. Rock Mech. Min. Sci. 2015, 74, 38–44. [Google Scholar] [CrossRef]
  24. Bryson, L.S.; Ortiz, R.; Leandre, J. Effects of a grout curtain on hydraulic and electrical conductivity in a laboratory-scale seepage model. In Proceedings of the Geo-Congress 2014: Geo-characterization and Modeling for Sustainability, Atlanta, GA, USA, 23–26 February 2014; pp. 3233–3242. [Google Scholar]
  25. Wang, X.; Qin, Q.; Fan, C. Research on comprehensive evaluation for grouting effect of broken and soft floor. Arab. J. Geosci. 2017, 10, 1–7. [Google Scholar] [CrossRef]
  26. Fan, G.; Zhong, D.; Yan, F.; Yue, P. A hybrid fuzzy evaluation method for curtain grouting efficiency assessment based on an AHP method extended by D numbers. Expert Syst. Appl. 2016, 44, 289–303. [Google Scholar] [CrossRef]
  27. Zhu, Y.; Wang, X.; Deng, S.; Zhao, M.; Ao, X. Evaluation of Curtain Grouting Efficiency by Cloud Model–Based Fuzzy Comprehensive Evaluation Method. KSCE J. Civ. Eng. 2019. [Google Scholar] [CrossRef]
  28. Xu, W.; Shang, X.; Wang, J.; Li, W. A Novel Approach to Multi-Attribute Group Decision-Making based on Interval-Valued Intuitionistic Fuzzy Power Muirhead Mean. Symmetry 2019, 11, 441. [Google Scholar] [CrossRef]
  29. Phochanikorn, P.; Tan, C. An Integrated Multi-Criteria Decision-Making Model Based on Prospect Theory for Green Supplier Selection under Uncertain Environment: A Case Study of the Thailand Palm Oil Products Industry. Sustainability 2019, 11, 1872. [Google Scholar] [CrossRef]
  30. Saeidi, O.; Azadmehr, A.; Torabi, S.R. Development of a Rock Groutability Index Based on the Rock Engineering Systems (RES): A Case Study. Indian Geotech. J. 2014, 44, 49–58. [Google Scholar] [CrossRef]
  31. Roy, J.; Das, S.; Kar, S.; Pamučar, D. An Extension of the CODAS Approach Using Interval-Valued Intuitionistic Fuzzy Set for Sustainable Material Selection in Construction Projects with Incomplete Weight Information. Symmetry 2019, 11, 393. [Google Scholar] [CrossRef]
  32. Deng, X.; Hu, Y.; Deng, Y.; Mahadevan, S. Supplier selection using AHP methodology extended by D numbers. Expert Syst. Appl. 2014, 41, 156–167. [Google Scholar] [CrossRef]
  33. Peng, X.; Yang, Y. Algorithms for interval-valued fuzzy soft sets in stochastic multi-criteria decision making based on regret theory and prospect theory with combined weight. Appl. Soft Comput. 2017, 54, 415–430. [Google Scholar] [CrossRef]
  34. Wang, N.; Liu, F.; Wei, D. A Modified Combination Rule for D Numbers Theory. Math. Probl. Eng. 2016, 2016, 1–10. [Google Scholar] [CrossRef]
  35. Zhong, D.H.; Yan, F.G.; Li, M.C.; Huang, C.X.; Fan, K.; Tang, J.F. A Real-Time Analysis and Feedback System for Quality Control of Dam Foundation Grouting Engineering. Rock Mech. Rock Eng. 2015, 48, 1947–1968. [Google Scholar] [CrossRef]
  36. Foyo, A.; Sánchez, M.A.; Tomillo, C. A proposal for a Secondary Permeability Index obtained from water pressure tests in dam foundations. Eng. Geol. 2005, 77, 69–82. [Google Scholar] [CrossRef]
  37. Azimian, A.; Ajalloeian, R. Permeability and groutability appraisal of the Nargesi dam site in Iran based on the secondary permeability index, joint hydraulic aperture and Lugeon tests. Bull. Eng. Geol. Environ. 2015, 74, 845–859. [Google Scholar] [CrossRef]
  38. Zhang, P.; Zhang, S.; Liu, X.; Qiu, L.; Yi, G. A Least Squares Ensemble Model Based on Regularization and Augmentation Strategy. Appl. Sci. 2019, 9, 1845. [Google Scholar] [CrossRef]
  39. Atanassov, K.T. Interval-valued Intuitionistic Fuzzy Sets. Fuzzy Sets Syst. 1989, 31, 343–349. [Google Scholar] [CrossRef]
  40. Xu, Z.; Chen, J. Approach to Group Decision Making Based on Interval-Valued. Syst. Eng. Theory Pract. 2007, 27, 1–5. [Google Scholar] [CrossRef]
  41. Zhao, X. TOPSIS method for interval-valued intuitionistic fuzzy multiple attribute decision making and its application to teaching quality evaluation. J. Intell. Fuzzy Syst. 2014, 26, 3049–3055. [Google Scholar]
  42. Gu, S.; Hua, J.; Lv, T. Evaluation of customer satisfaction of “door-to-Door” whole-process logistic service with interval-valued intuitionistic fuzzy information. J. Intell. Fuzzy Syst. 2016, 30, 2487–2495. [Google Scholar] [CrossRef]
  43. Liu, P. Some geometric aggregation operators based on interval intuitionistic uncertain linguistic variables and their application to group decision making. Appl. Math. Model. 2013, 37, 2430–2444. [Google Scholar] [CrossRef]
  44. Wang, C.; Cai, X.; Li, B. Fuzzy comprehensive evaluation based on multi-attribute group decision making for business intelligence system. J. Intell. Fuzzy Syst. 2016, 31, 2203–2212. [Google Scholar]
  45. Oztaysi, B.; Onar, S.C.; Goztepe, K.; Kahraman, C. Evaluation of research proposals for grant funding using interval-valued intuitionistic fuzzy sets. Soft Comput. 2017, 21, 1203–1218. [Google Scholar] [CrossRef]
  46. Liu, S.; Yu, F.; Wang, P.S.P. Granularity Approach for Multi-Criteria Decision Making About Hybrid Evaluation Information. Int. J. Pattern Recognit. Artif. Intell. 2018, 32, 1859020. [Google Scholar] [CrossRef]
  47. Liu, H.-C.; Quan, M.-Y.; Li, Z.; Wang, Z.-L. A new integrated MCDM model for sustainable supplier selection under interval-valued intuitionistic uncertain linguistic environment. Inf. Sci. 2019, 486, 254–270. [Google Scholar] [CrossRef]
  48. Deng, Y. D Numbers: Theory and Applications Background Knowledge. J. Inf. Comput. Sci. 2012, 9, 2421–2428. [Google Scholar]
  49. Duan, Y.; Cai, Y.; Wang, Z.; Deng, X. A Novel Network Security Risk Assessment Approach by Combining Subjective and Objective Weights under Uncertainty. Appl. Sci. 2018, 8, 428. [Google Scholar] [CrossRef]
  50. Chen, L.; Deng, X. A Modified Method for Evaluating Sustainable Transport Solutions Based on AHP and Dempster–Shafer Evidence Theory. Appl. Sci. 2018, 8, 563. [Google Scholar] [CrossRef]
  51. Ye, H. Assessment of E-learning system in higher education based on hesitant fuzzy information with incomplete attribute weights. Int. J. Emerg. Technol. Learn. 2015, 10, 34–37. [Google Scholar] [CrossRef]
  52. Lin, S.; Li, C.; Xu, F.; Liu, D.; Liu, J. Risk identification and analysis for new energy power system in China based on D numbers and decision-making trial and evaluation laboratory (DEMATEL). J. Clean. Prod. 2018, 180, 81–96. [Google Scholar] [CrossRef]
  53. Deng, X.; Jiang, W. Fuzzy risk evaluation in failure mode and effects analysis using a D numbers based multi-sensor information fusion method. Sensors 2017, 17, 2086. [Google Scholar] [CrossRef]
  54. Kahneman, D.; Tversky, A. Prospect Theory: An Analysis of Decision under Risk. Econometrica 1979, 47, 263. [Google Scholar] [CrossRef] [Green Version]
  55. Zhao, H.; Guo, S.; Zhao, H. Selecting the Optimal Micro-Grid Planning Program Using a Novel Multi-Criteria Decision Making Model Based on Grey Cumulative Prospect Theory. Energies 2018, 11, 1840. [Google Scholar] [CrossRef]
  56. Bao, T.; Xie, X.; Long, P.; Wei, Z. MADM method based on prospect theory and evidential reasoning approach with unknown attribute weights under intuitionistic fuzzy environment. Expert Syst. Appl. 2017, 88, 305–317. [Google Scholar] [CrossRef]
  57. Luca, S.-D.; Pace, R.-D. Evaluation of Risk Perception in Route Choice Experiments: An Application of the Cumulative Prospect Theory. IEEE Conf. Intell. Transp. Syst. Proc. ITSC 2015, 10, 309–315. [Google Scholar]
  58. Wu, Y.; Xu, C.; Zhang, T. Evaluation of renewable power sources using a fuzzy MCDM based on cumulative prospect theory: A case in China. Energy 2018, 147, 1227–1239. [Google Scholar] [CrossRef]
  59. Wang, W.; Liu, X.; Qin, Y.; Fu, Y. A risk evaluation and prioritization method for FMEA with prospect theory and Choquet integral. Saf. Sci. 2018, 110, 152–163. [Google Scholar] [CrossRef]
  60. Król, A.; Ksiȩzak, J.; Kubińska, E.; Rozakis, S. Evaluation of sustainability of maize cultivation in Poland. A prospect theory-PROMETHEE approach. Sustainability 2018, 10, 4263. [Google Scholar] [CrossRef]
  61. Liu, H.H.; Song, Y.Y.; Yang, G.L. Cross-efficiency evaluation in data envelopment analysis based on prospect theory. Eur. J. Oper. Res. 2019, 273, 364–375. [Google Scholar] [CrossRef]
  62. Metzger, L.P.; Rieger, M.O. Non-cooperative games with prospect theory players and dominated strategies. Games Econ. Behav. 2019, 115, 396–409. [Google Scholar] [CrossRef]
  63. Gonzalez-Ramirez, J.; Arora, P.; Podesta, G. Using insights from prospect theory to enhance sustainable decision making by agribusinesses in Argentina. Sustainability 2018, 10, 2693. [Google Scholar] [CrossRef]
  64. Oztaysi, B.; Cevik Onar, S.; Kahraman, C.; Yavuz, M. Multi-criteria alternative-fuel technology selection using interval-valued intuitionistic fuzzy sets. Transp. Res. Part D Transp. Environ. 2017, 53, 128–148. [Google Scholar] [CrossRef]
  65. Onar, S.C.; Oztaysi, B.; Otay, I.; Kahraman, C. Multi-expert wind energy technology selection using interval-valued intuitionistic fuzzy sets. Energy 2015, 90, 274–285. [Google Scholar] [CrossRef]
  66. Deere, D.U. Technical description of rock cores for engineering purpose. Rock Mech. Eng. Geol. 1964, 1, 17–22. [Google Scholar]
  67. Wan, S.; Li, D. Atanassov’s intuitionistic fuzzy programming method for heterogeneous multiattribute group decision making with Atanassov’s intuitionistic fuzzy truth degrees. IEEE Trans. Fuzzy Syst. 2013, 22, 300–312. [Google Scholar] [CrossRef]
  68. Wan, S.; Xu, G.; Wang, F.; Dong, J. A new method for Atanassov’s interval-valued intuitionistic fuzzy MAGDM with incomplete attribute weight information. Inf. Sci. 2015, 316, 329–347. [Google Scholar] [CrossRef]
  69. Xu, Z. Methods for aggregating interval-valued intuitionistic fuzzy information and their application to decision making. Control Decis. 2007, 2, 19. [Google Scholar]
  70. Chiclana, F.; Herrera, F.; Herrera-Viedma, E. Integrating three representation models in fuzzy multipurpose decision making based on fuzzy preference relations. Fuzzy Sets Syst. 1998, 97, 33–48. [Google Scholar] [CrossRef]
  71. Hashemi, H.; Bazargan, J.; Mousavi, S.M.; Vahdani, B. An extended compromise ratio model with an application to reservoir flood control operation under an interval-valued intuitionistic fuzzy environment. Appl. Math. Model. 2014, 38, 3495–3511. [Google Scholar] [CrossRef]
  72. Gao, J.; Liu, H.; Gu, Y. Interval-valued intuitionistic fuzzy multi-criteria decision-makingmethod based on prospect theory. Syst. Eng. Theory Pract. 2014, 34, 3175–3181. (In Chinese) [Google Scholar]
Figure 1. Research framework.
Energies 12 03674 g001
Figure 2. Indicator system for curtain-grouting evaluation.
Energies 12 03674 g002
Figure 3. Schematic diagram for the calculation of Fraction-Filled Rate (FFR).
Energies 12 03674 g003
Figure 4. Solution process of the grouting-efficiency comprehensive evaluation model.
Energies 12 03674 g004
Figure 5. Details of a hydropower station in southwest China.
Energies 12 03674 g005
Figure 6. Curtain-grouting construction area and unit.
Energies 12 03674 g006
Figure 7. Longitudinal section of the grouting verification hole in the study area.
Energies 12 03674 g007
Figure 8. The results of core drilling of the verification hole DJ1-1: (a) The core specimen image of DJ1-1 from depths of 2.3–3.9 m; (b) the core specimen image of DJ1-1 from depths of 10.4–11.7 m; (c) the core specimen image of DJ1-1 from depths of 13.6–15.5 m; and (d) the core specimen image of DJ1-1 from depths of 21.9–23.9 m.
Energies 12 03674 g008
Figure 9. The results of borehole television imaging of the verification hole DJ1-1: (a) The image from depths of 4.0–6.0 m; (b) the image from depths of 15.0–18.0 m; (c) the image from depths of 42.0–44.0 m; and (d) the image from depths of 55.0–58.0 m.
Energies 12 03674 g009
Figure 10. Data of each indicator of a typical borehole: (a) Data of each indicator of DJ1-1 and (b) data of each indicator of DJ3-1.
Energies 12 03674 g010
Figure 11. Comprehensive evaluation index E of each verification hole.
Energies 12 03674 g011
Figure 12. Grouting-efficiency assessment result based on the comprehensive evaluation model: (a) Contour map of grouting efficiency and (b) 3-D cloud map of grouting efficiency.
Energies 12 03674 g012
Figure 13. Grouting-efficiency assessment results based on the original evaluation methods: (a) Contour map of grouting efficiency based on single-indicator evaluation; (b) 3-D cloud map of grouting efficiency based on single-indicator evaluation; (c) contour map of grouting efficiency based on the method of Reference [26]; and (d) 3-D cloud map of grouting efficiency based on the method in Reference [26].
Energies 12 03674 g013
Figure 14. Comparison of the evaluation results by the single-indicator method and the proposed method. Note: The calculation equation of relative error is shown in the Appendix A.
Energies 12 03674 g014
Figure 15. Comparison of the evaluation results in the literature [26] and the proposed method. Note: The calculation equation of relative error is shown in the Appendix A.
Energies 12 03674 g015
Figure 16. Comparison of the evaluation results by the proposed method, original evaluation methods, and the intuitionistic fuzzy sets.
Energies 12 03674 g016
Figure 17. Comparison of the evaluation results by the proposed method and without secondary permeability index (SPI).
Energies 12 03674 g017
Table 1. The classification criteria of grouting efficiency evaluation indicators.
LevelLU (Lu)SPI
(×10−15 L/m2·s)
RQD
(%)
FFR
(%)
V
(km/s)
Score
excellent<0.1<2.1690–10090–100>5.905
good0.1–1.02.16–21.6075–9075–905.58–5.904
ordinary1.0–1.521.60–17250–7550–754.93–5.583
poor1.5–2.0172–172025–5025–504.60–4.932
bad>2.0>1720<25<25<4.601
Table 2. Sample of the data set of the secondary permeability index.
Verification HoleIntervalCL
(m)
r
(m)
V
(L)
t
(s)
H
(m)
SPI
(L/m2·s)
DJ1-111.49 × 10−1020.049.02471581.80582 × 10−14
DJ1-121.49 × 10−1020.041.26425991.64165 × 10−15
DJ1-131.49 × 10−1020.0437.355351372.79081 × 10−14
DJ1-141.49 × 10−1030.0427.184581201.96317 × 10−14
DJ1-151.49 × 10−1030.044.982311008.56658 × 10−15
DJ1-161.49 × 10−1030.0435.995551032.49858 × 10−14
DJ1-171.49 × 10−1030.048.491541022.14164 × 10−14
DJ1-181.49 × 10−1030.0424.113791012.49858 × 10−14
DJ1-191.49 × 10−1030.0438.02577992.64136 × 10−14
DJ1-1101.49 × 10−1030.048.664711001.10668 × 10−14
Table 3. Permeability value of verification hole DJ1-1.
IntervalQ
(L/min)
L
(m)
P
(MPa)
LU
(Lu)
IntervalQ
(L/min)
L
(m)
P
(MPa)
LU
(Lu)
11.2820.581.10112.4231.200.67
20.2020.990.10121.3430.900.49
34.6621.371.70132.1731.050.69
43.9631.201.10141.9331.210.53
51.4431.000.48155.5131.021.80
64.3331.031.40166.0041.001.50
73.6731.021.20177.5240.991.90
84.2431.011.40186.0641.011.50
94.4030.991.48193.3641.000.84
101.8631.000.62204.0841.021.00
Table 4. Summary statistics of each indicator variable.
LevelIndicatorUnitNumberRatio (%)MinMaxMeanStd
badLULu00.00----
SPIL/m2·s00.00----
FFR%6738.2902025.49
RQD%126.86024177.85
Vkm/s00.00----
poorLULu63.431.521.91.690.14
SPIL/m2·s00.00----
FFR%5229.7125503910.25
RQD%5229.712550387.88
Vkm/s00.00----
ordinaryLULu116.291.11.51.340.16
SPIL/m2·s137.432.33 × 10−143.58 × 10−142.77 × 10−143.33 × 10⁻¹⁵
FFR%84.576075674.92
RQD%7040.005175636.98
Vkm/s1910.865.085.585.360.17
goodLULu15488.000.110.540.17
SPIL/m2·s15689.142.68 × 10−152.14 × 10−149.75 × 10−153.32 × 10⁻¹⁵
FFR%158.578090824.14
RQD%3520.0075.590824.49
Vkm/s5430.865.595.95.780.09
excellentLULu42.2900.090.040.05
SPIL/m2·s63.4301.97 × 10−151.10 × 10−158.80 × 10⁻¹⁶
FFR%3318.861001001000
RQD%63.4391100964.1
Vkm/s10258.295.9176.270.27
Note: Mean represents the average; Std stands for standard deviation, and the calculation equation is shown in the Appendix A.
Table 5. D number integral form evaluation matrix.
ProjectUnit 32Unit 33Unit 34Unit 35
LU { ( [ 0.88 , 0.96 ] , [ 0.01 , 0.04 ] , 0.6 ) ( [ 0.85 , 0.90 ] , [ 0.05 , 0.08 ] , 0.3 ) } { ( [ 0.85 , 0.88 ] , [ 0.05 , 0.10 ] , 0.8 ) ( [ 0.85 , 0.90 ] , [ 0.05 , 0.07 ] , 0.2 ) } { ( [ 0.80 , 0.90 ] , [ 0.02 , 0.05 ] , 0.7 ) ( [ 0.80 , 0.85 ] , [ 0.05 , 0.15 ] , 0.2 ) } { ( [ 0.75 , 0.90 ] , [ 0.06 , 0.08 ] , 0.9 ) ( [ 0.73 , 0.88 ] , [ 0.05 , 0.10 ] , 0.1 ) }
SPI { ( [ 0.70 , 0.80 ] , [ 0.10 , 0.20 ] , 0.7 ) ( [ 0.75 , 0.85 ] , [ 0.10 , 0.15 ] , 0.2 ) } { ( [ 0.75 , 0.80 ] , [ 0.15 , 0.20 ] , 0.6 ) ( [ 0.80 , 0.85 ] , [ 0.10 , 0.15 ] , 0.4 ) } { ( [ 0.78 , 0.82 ] , [ 0.10 , 0.15 ] , 1 ) } { ( [ 0.80 , 0.92 ] , [ 0.03 , 0.05 ] , 0.9 ) ( [ 0.75 , 0.85 ] , [ 0.10 , 0.15 ] , 0.1 ) }
FFR { ( [ 0.60 , 0.75 ] , [ 0.10 , 0.20 ] , 0.7 ) ( [ 0.45 , 0.85 ] , [ 0.05 , 0.15 ] , 0.3 ) } { ( [ 0.35 , 0.85 ] , [ 0.03 , 0.05 ] , 1 ) } { ( [ 0.40 , 0.65 ] , [ 0.05 , 0.30 ] , 1 ) } { ( [ 0.75 , 0.85 ] , [ 0.05 , 0.15 ] , 0.6 ) ( [ 0.75 , 0.80 ] , [ 0.05 , 0.10 ] , 0.3 ) }
RQD { ( [ 0.35 , 0.70 ] , [ 0.15 , 0.20 ] , 1 ) } { ( [ 0.45 , 0.85 ] , [ 0.05 , 0.15 ] , 1 ) } { ( [ 0.39 , 0.70 ] , [ 0.15 , 0.20 ] , 0.7 ) ( [ 0.45 , 0.85 ] , [ 0.10 , 0.15 ] , 0.2 ) } { ( [ 0.50 , 0.80 ] , [ 0.05 , 0.15 ] , 0.6 ) ( [ 0.70 , 0.85 ] , [ 0.05 , 0.10 ] , 0.4 ) }
V { ( [ 0.59 , 0.75 ] , [ 0.10 , 0.15 ] , 0.9 ) ( [ 0.65 , 0.75 ] , [ 0.15 , 0.20 ] , 0.1 ) } { ( [ 0.75 , 0.79 ] , [ 0.10 , 0.15 ] , 0.5 ) ( [ 0.65 , 0.81 ] , [ 0.05 , 0.10 ] , 0.4 ) } { ( [ 0.70 , 0.80 ] , [ 0.05 , 0.15 ] , 0.6 ) ( [ 0.70 , 0.85 ] , [ 0.05 , 0.10 ] , 0.4 ) } { ( [ 0.65 , 0.70 ] , [ 0.05 , 0.15 ] , 1 ) }
Table 6. The collective interval-valued intuitionistic fuzzy evaluation membership matrix.
ProjectUnit 32Unit 33Unit 34Unit 35
LU([0.87,0.94],[0.01,0.05])([0.85,0.88],[0.05,0.09]) ([0.80,0.89],[0.03,0.07]) ([0.75,0.90],[0.06,0.08])
SPI([0.71,0.81],[0.10,0.19]) ([0.77,0.82],[0.13,0.18]) ([0.78,0.82],[0.10,0.15]) ([0.80,0.91],[0.04,0.06])
FFR([0.56,0.78],[0.09,0.19]) ([0.35,0.85],[0.03,0.05]) ([0.40,0.65],[0.05,0.30]) ([0.75,0.83],[0.05,0.13])
RQD([0.35,0.70],[0.15,0.20]) ([0.45,0.85],[0.05,0.15]) ([0.40,0.73],[0.14,0.19]) ([0.58,0.82],[0.05,0.13])
V([0.60,0.75],[0.11,0.16])([0.71,0.80],[0.08,0.13])([0.70,0.82],[0.05,0.13])([0.65,0.70],[0.05,0.15])
Table 7. The scoring function matrix.
ProjectUnit 32Unit 33Unit 34Unit 35O
LU[0.873, 0.937][0.795, 0.939][0.795, 0.894][0.753, 0.894][0.804, 0.930]
SPI[0.617, 0.906][0.640, 0.950][0.675, 0.925][0.806, 0.903][0.684, 0.851]
FFR[0.533, 0.803][0.560, 0.640][0.350, 0.700][0.700, 0.883][0.536, 0.738]
RQD[0.350, 0.700][0.550, 0.750][0.404, 0.732][0.610, 0.790][0.479, 0.700]
V[0.543, 0.803][0.649, 0.855][0.670, 0.850][0.575, 0.775][0.609, 0.815]
Table 8. The prospect decision matrix.
ProjectUnit 32Unit 33Unit 34Unit 35
LU0.059−0.109−0.072−0.142
SPI−0.145−0.122−0.0730.091
FFR−0.1510.182−0.3570.209
RQD−0.2300.081−0.1310.118
V−0.1400.0570.060−0.159

