A Methodological Analysis Approach to Assess Solar Energy Potential at the Neighborhood Scale


Abstract

1. Introduction
2. Background and Motivation
2.1 State-Of-The-Art of the Existing Solar Mapping
2.2 Solar Energy Potential in Norway
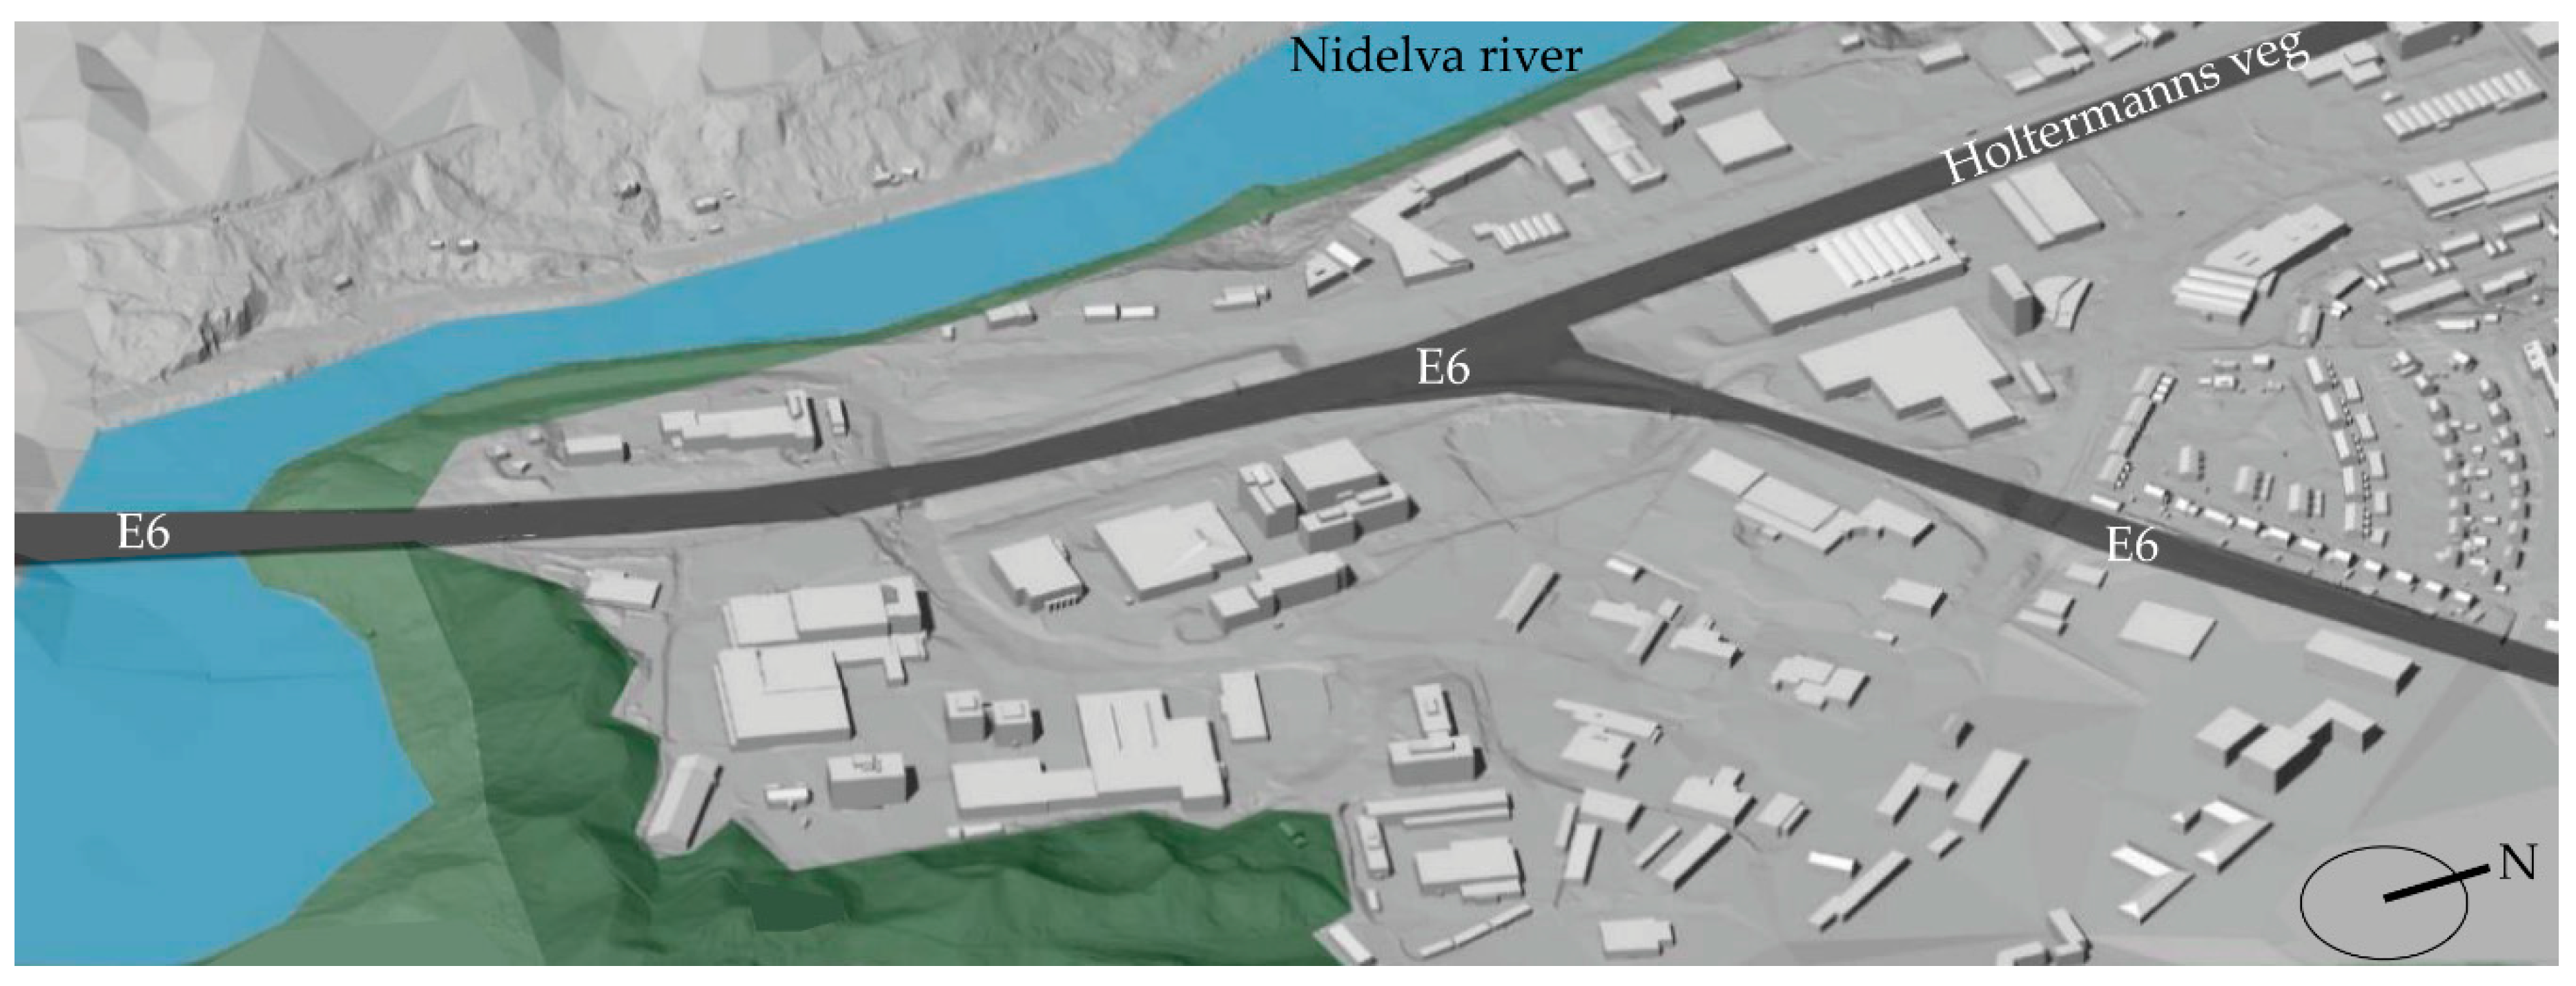
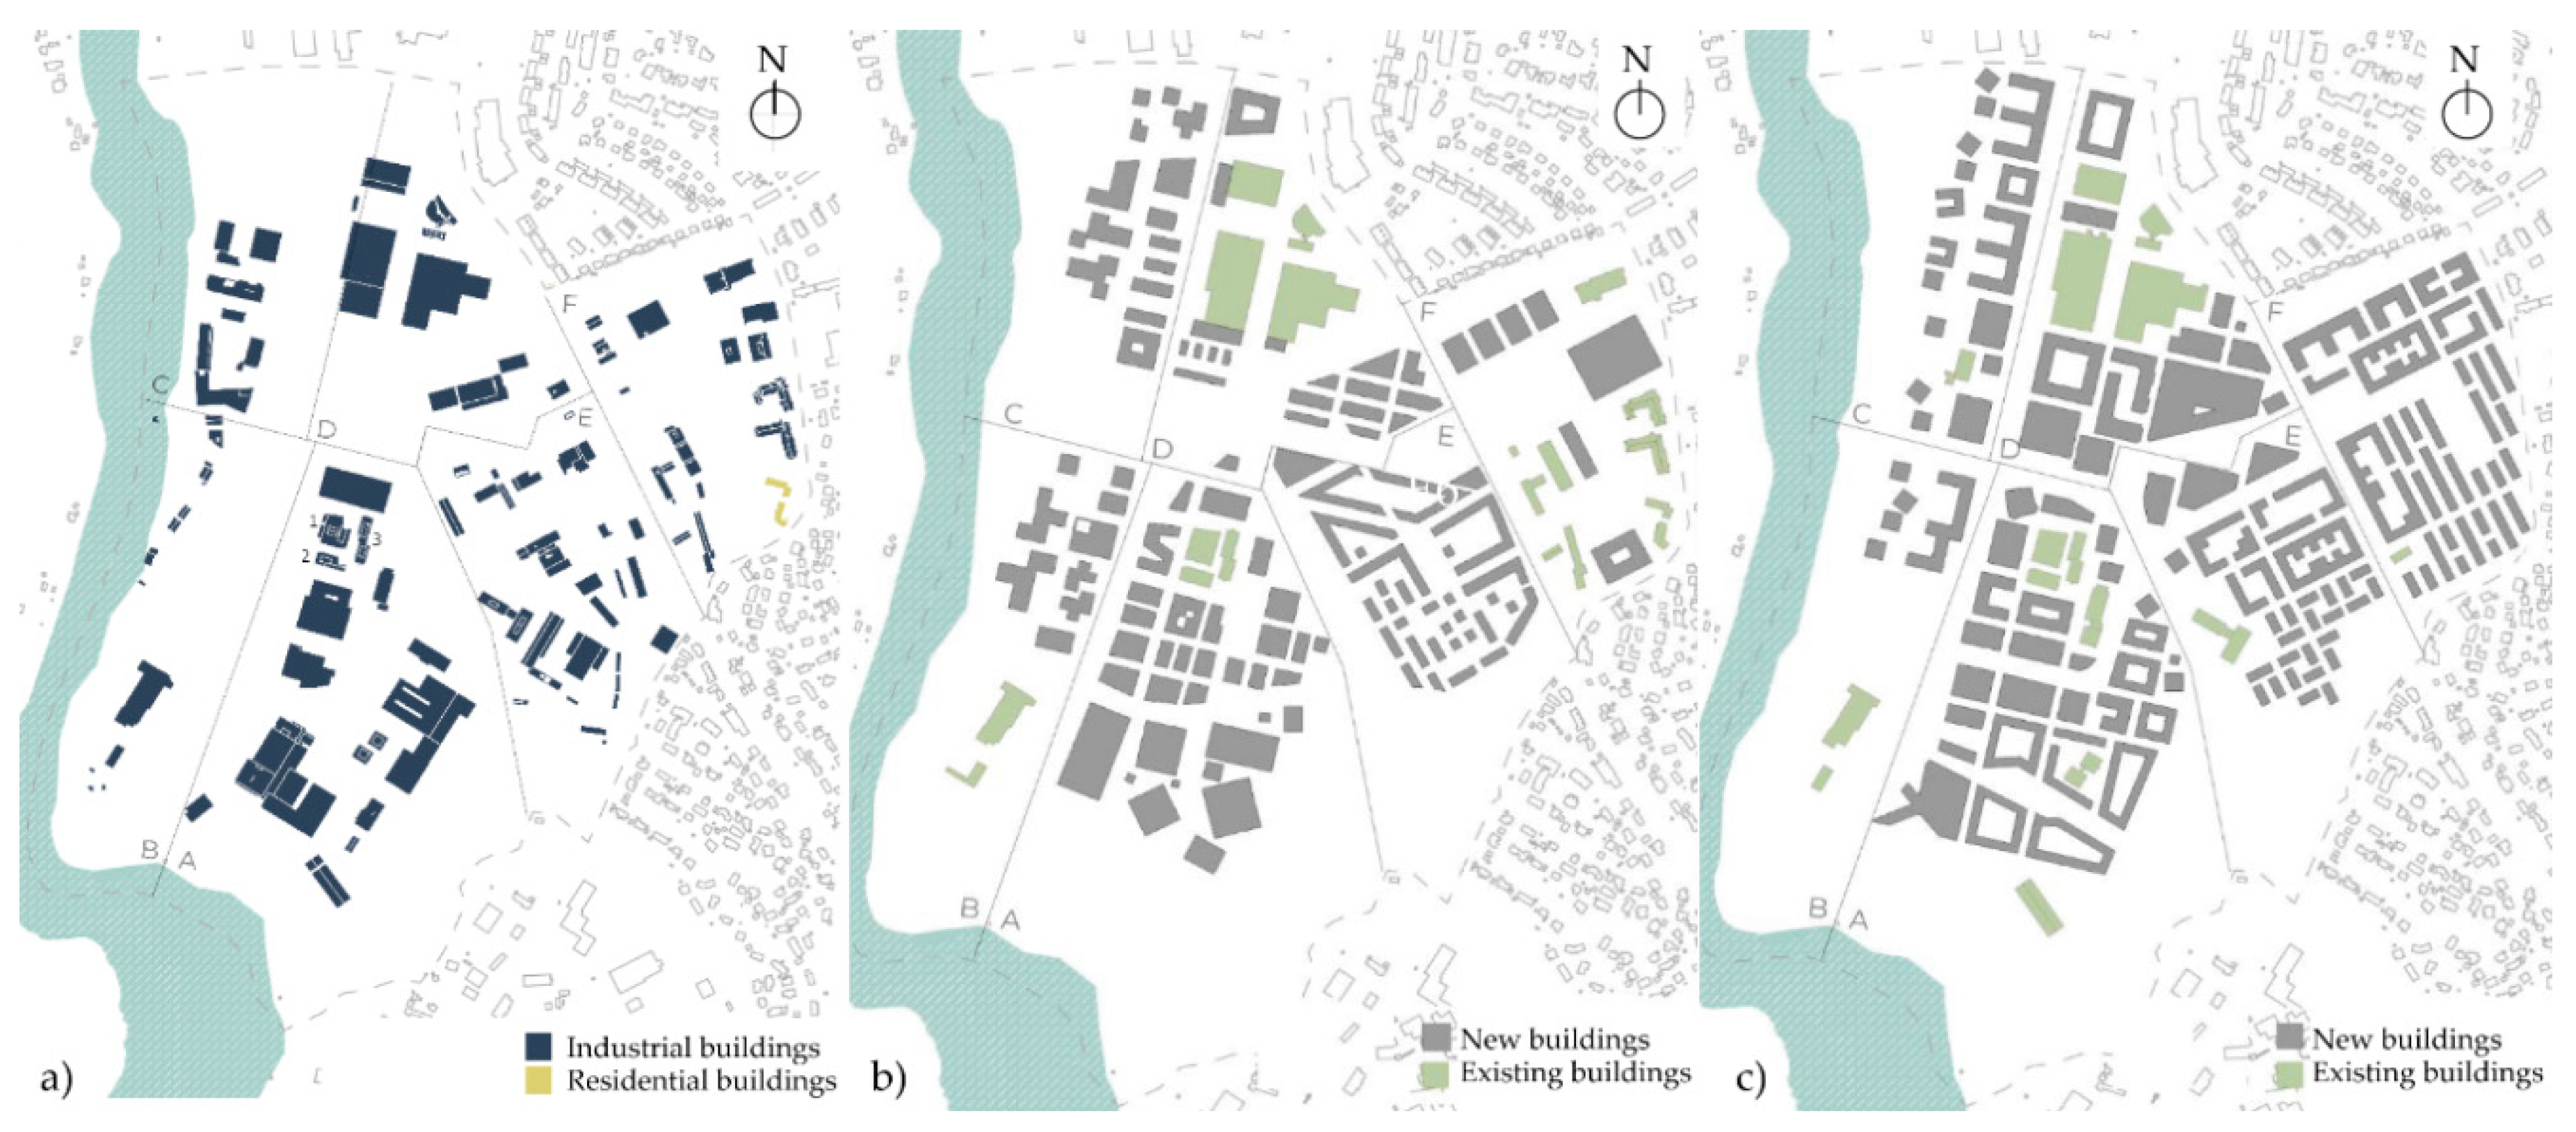
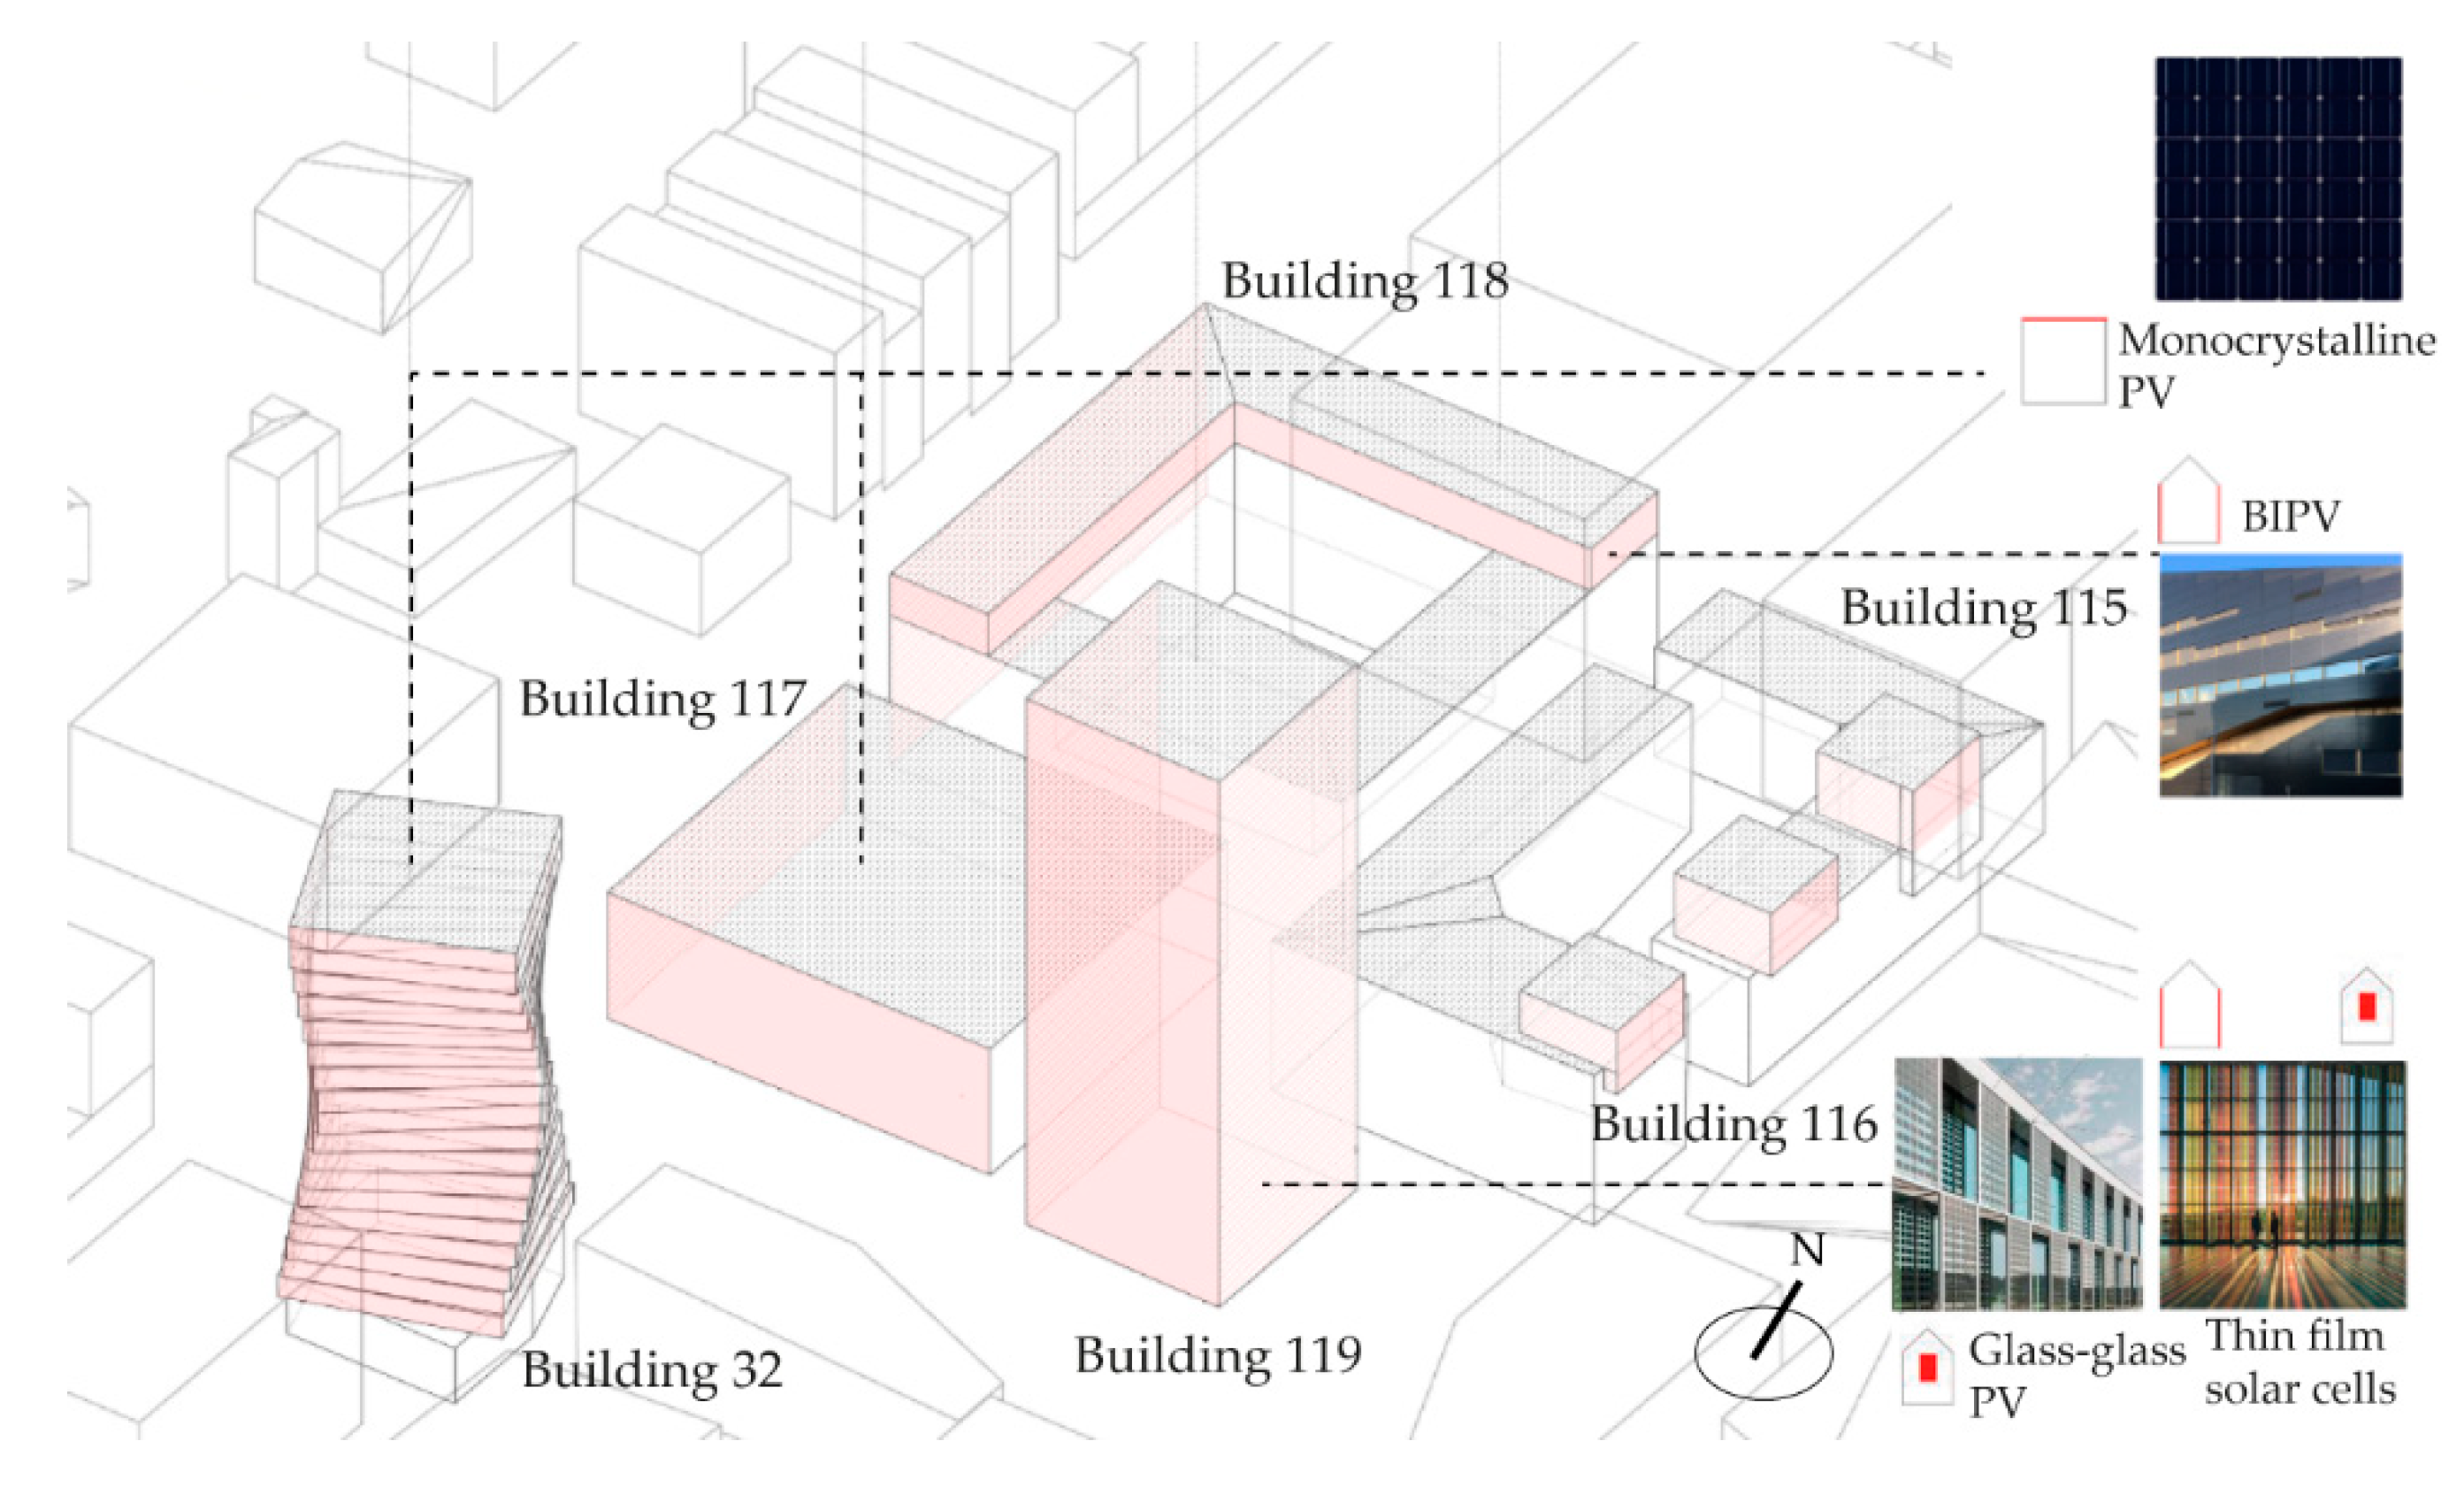
2.3. Case study Area
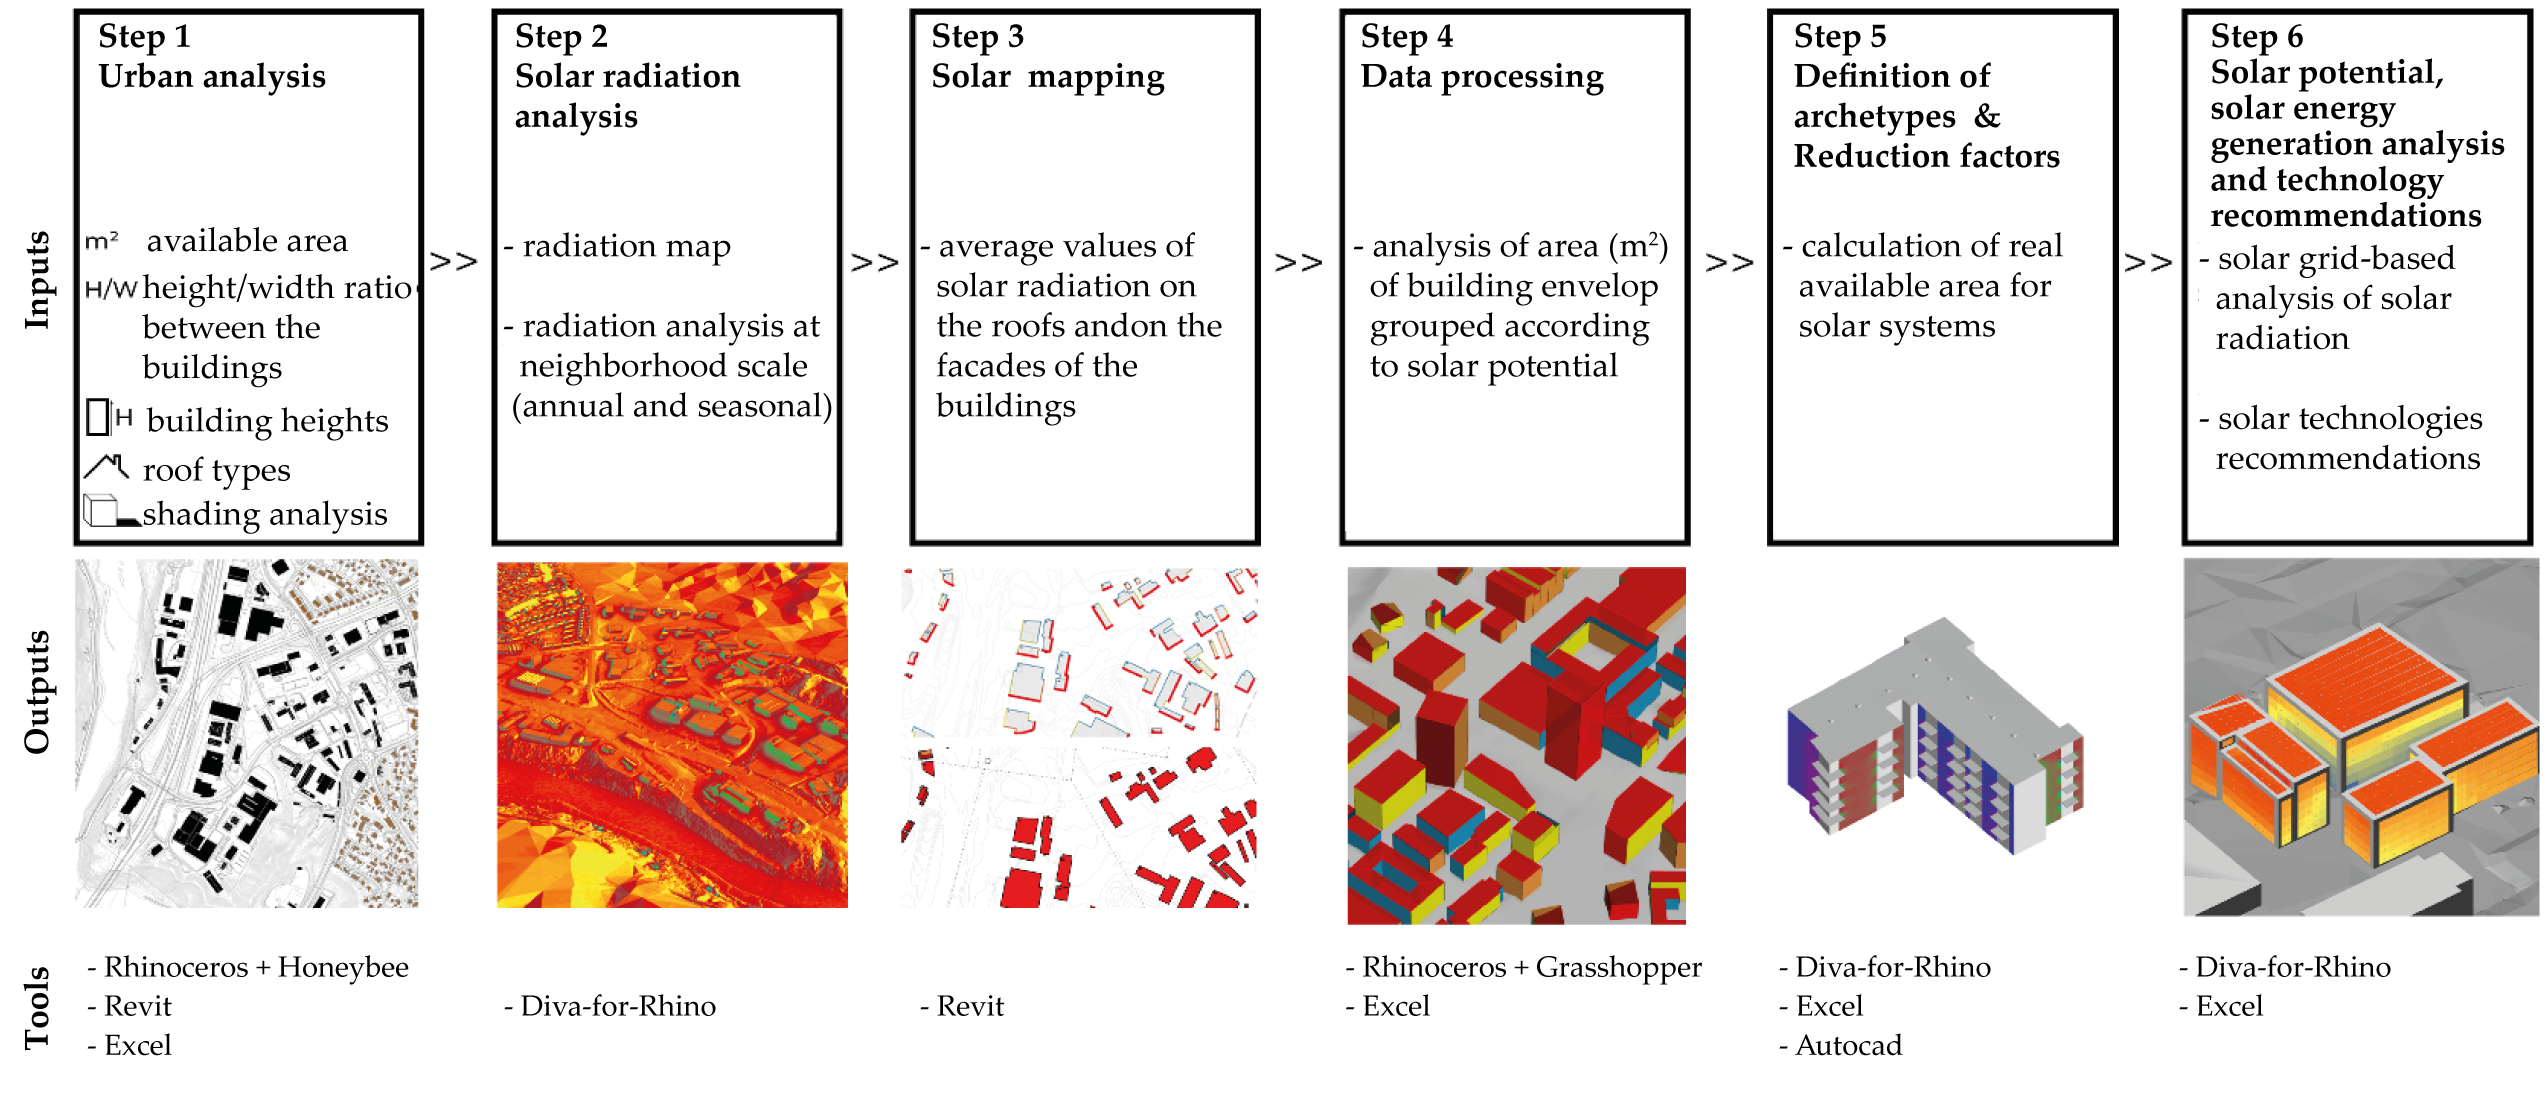
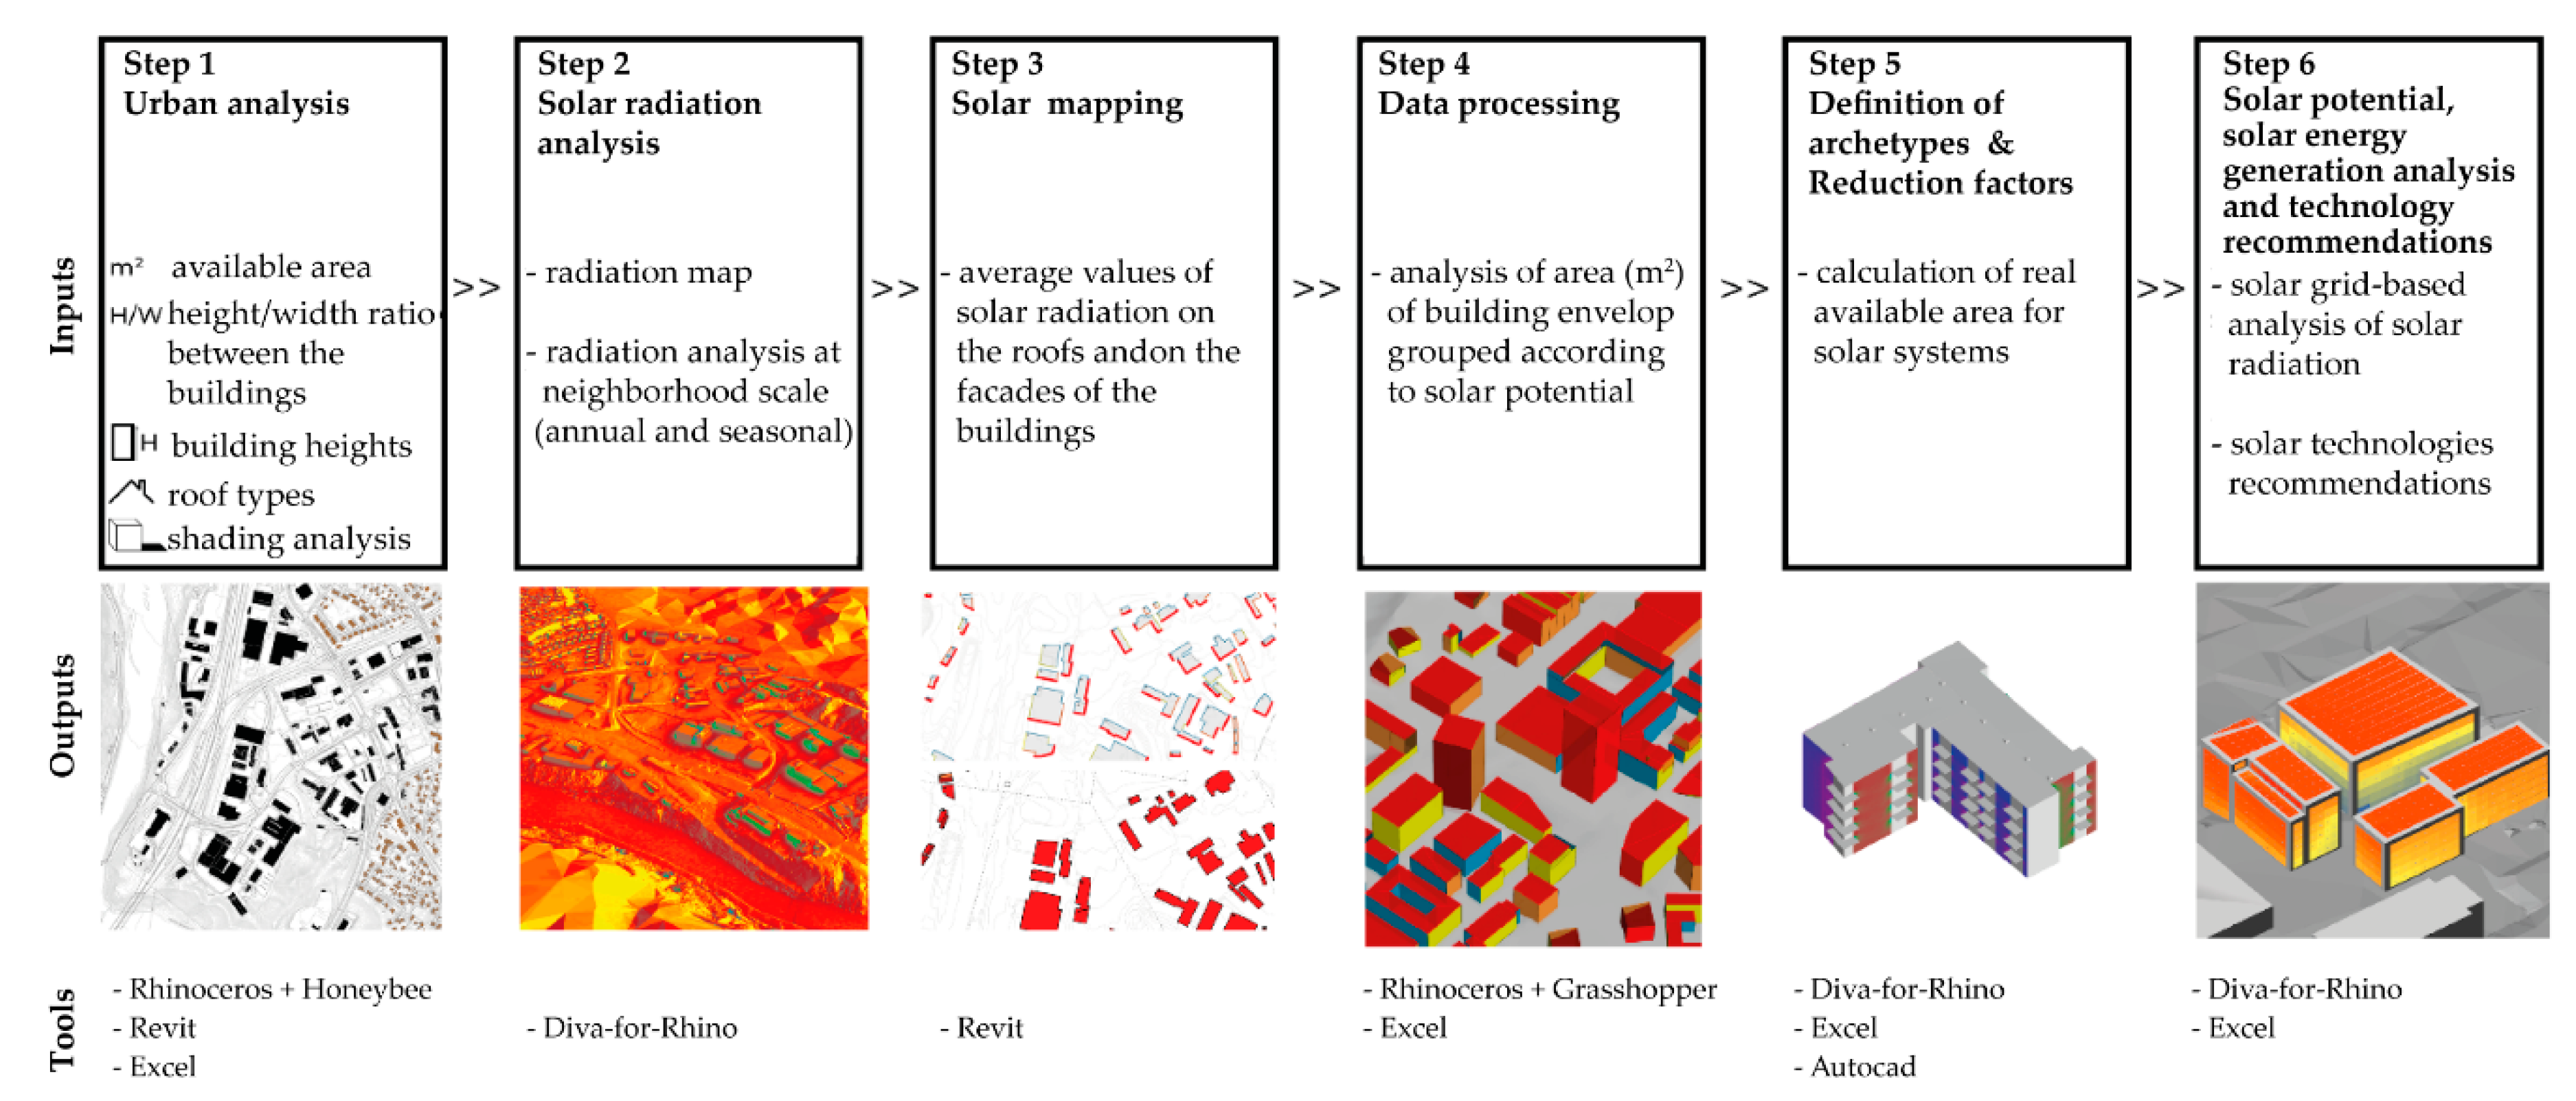
3. Methodology
3.1. Step 1–Urban Analysis
3.2. Step 2–Solar Irradiation Analysis
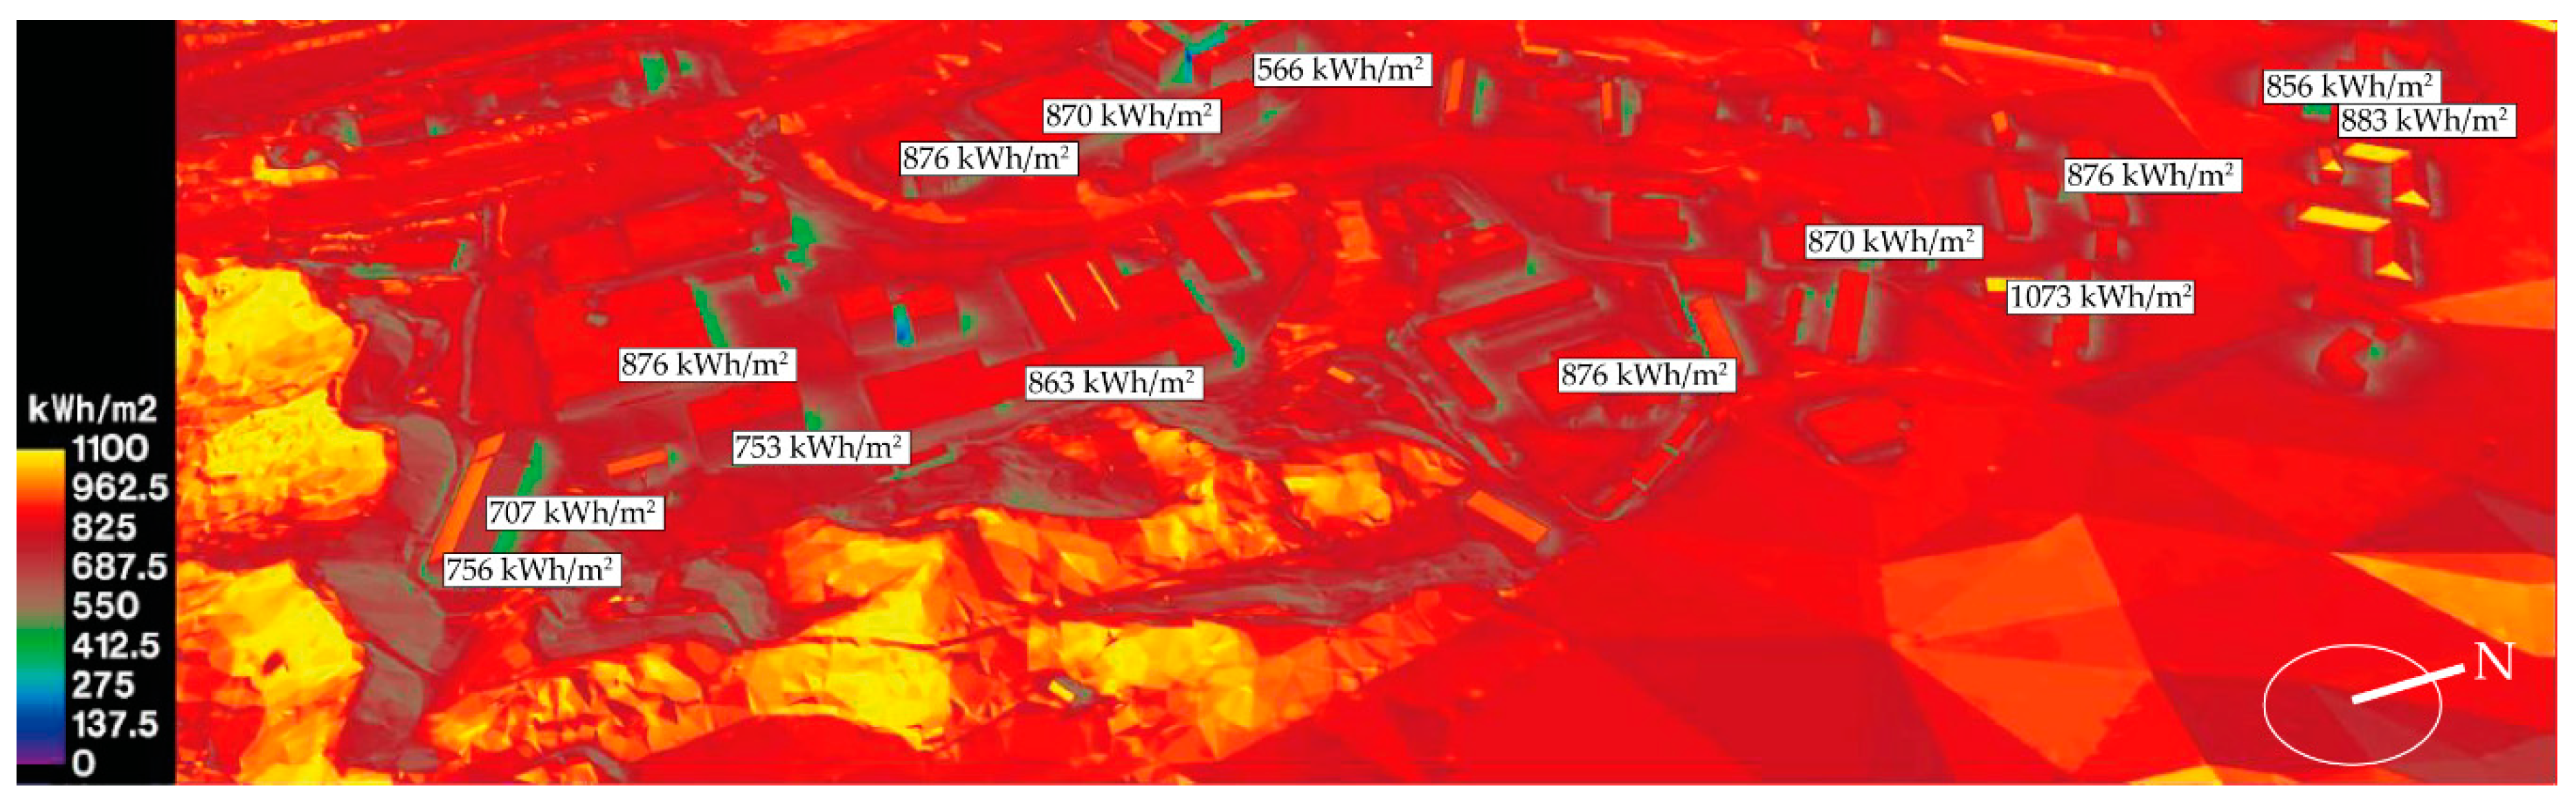
3.3. Step 3–Solar Mapping
- Exposure of the urban surfaces (roofs, façades, and terrain) to solar irradiation;
- Orientation of the façades and roofs (flat and pitched);
- Shadows among the buildings and self-shading by other parts of the building, only when the protruding volume affects the middle point of the façade or roof surface;
3.4. Step 4–Data Processing
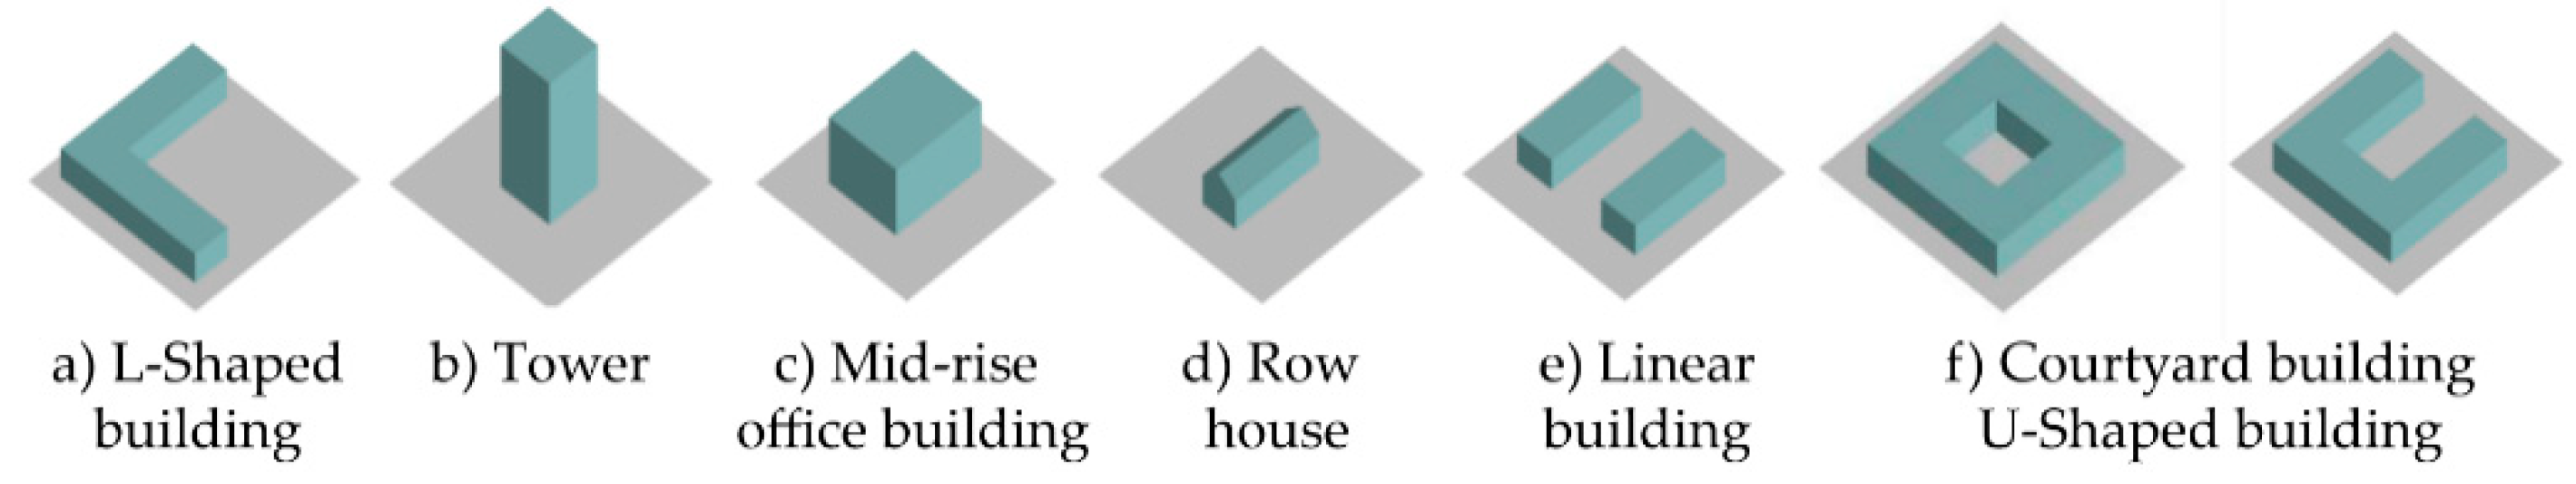
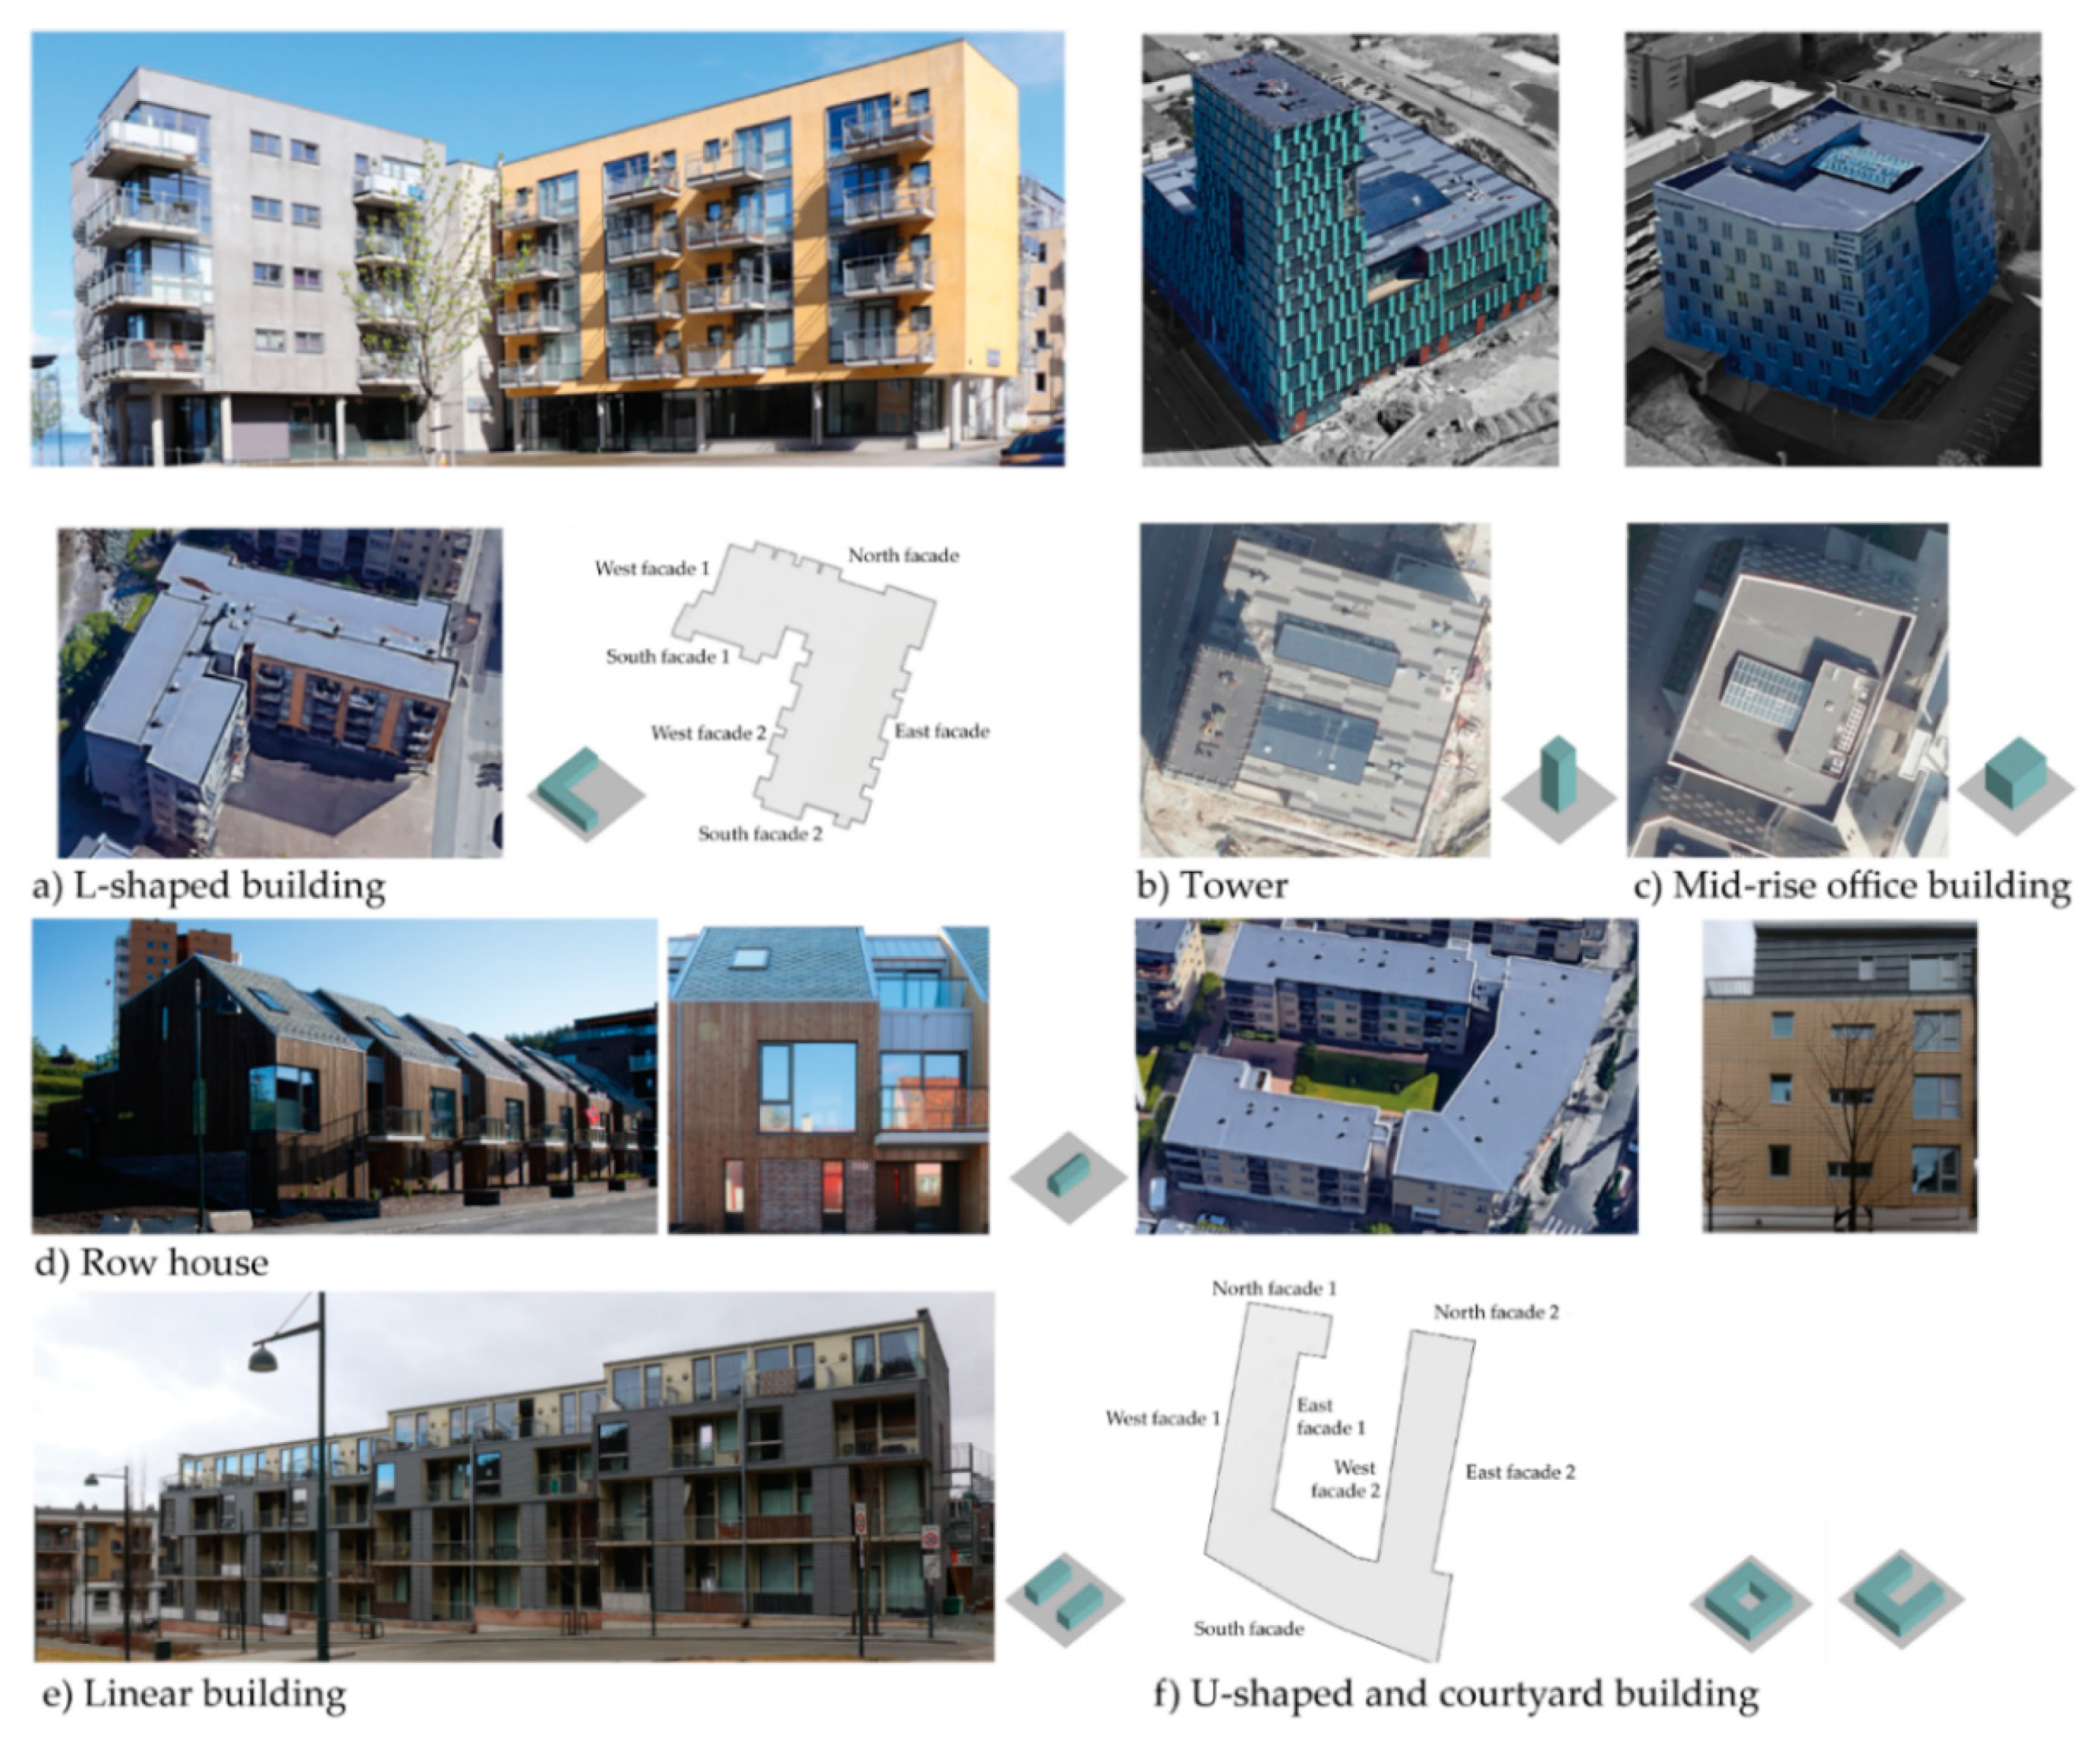
3.5. Step 5–Definition of Building Archetypes and Reduction Factors
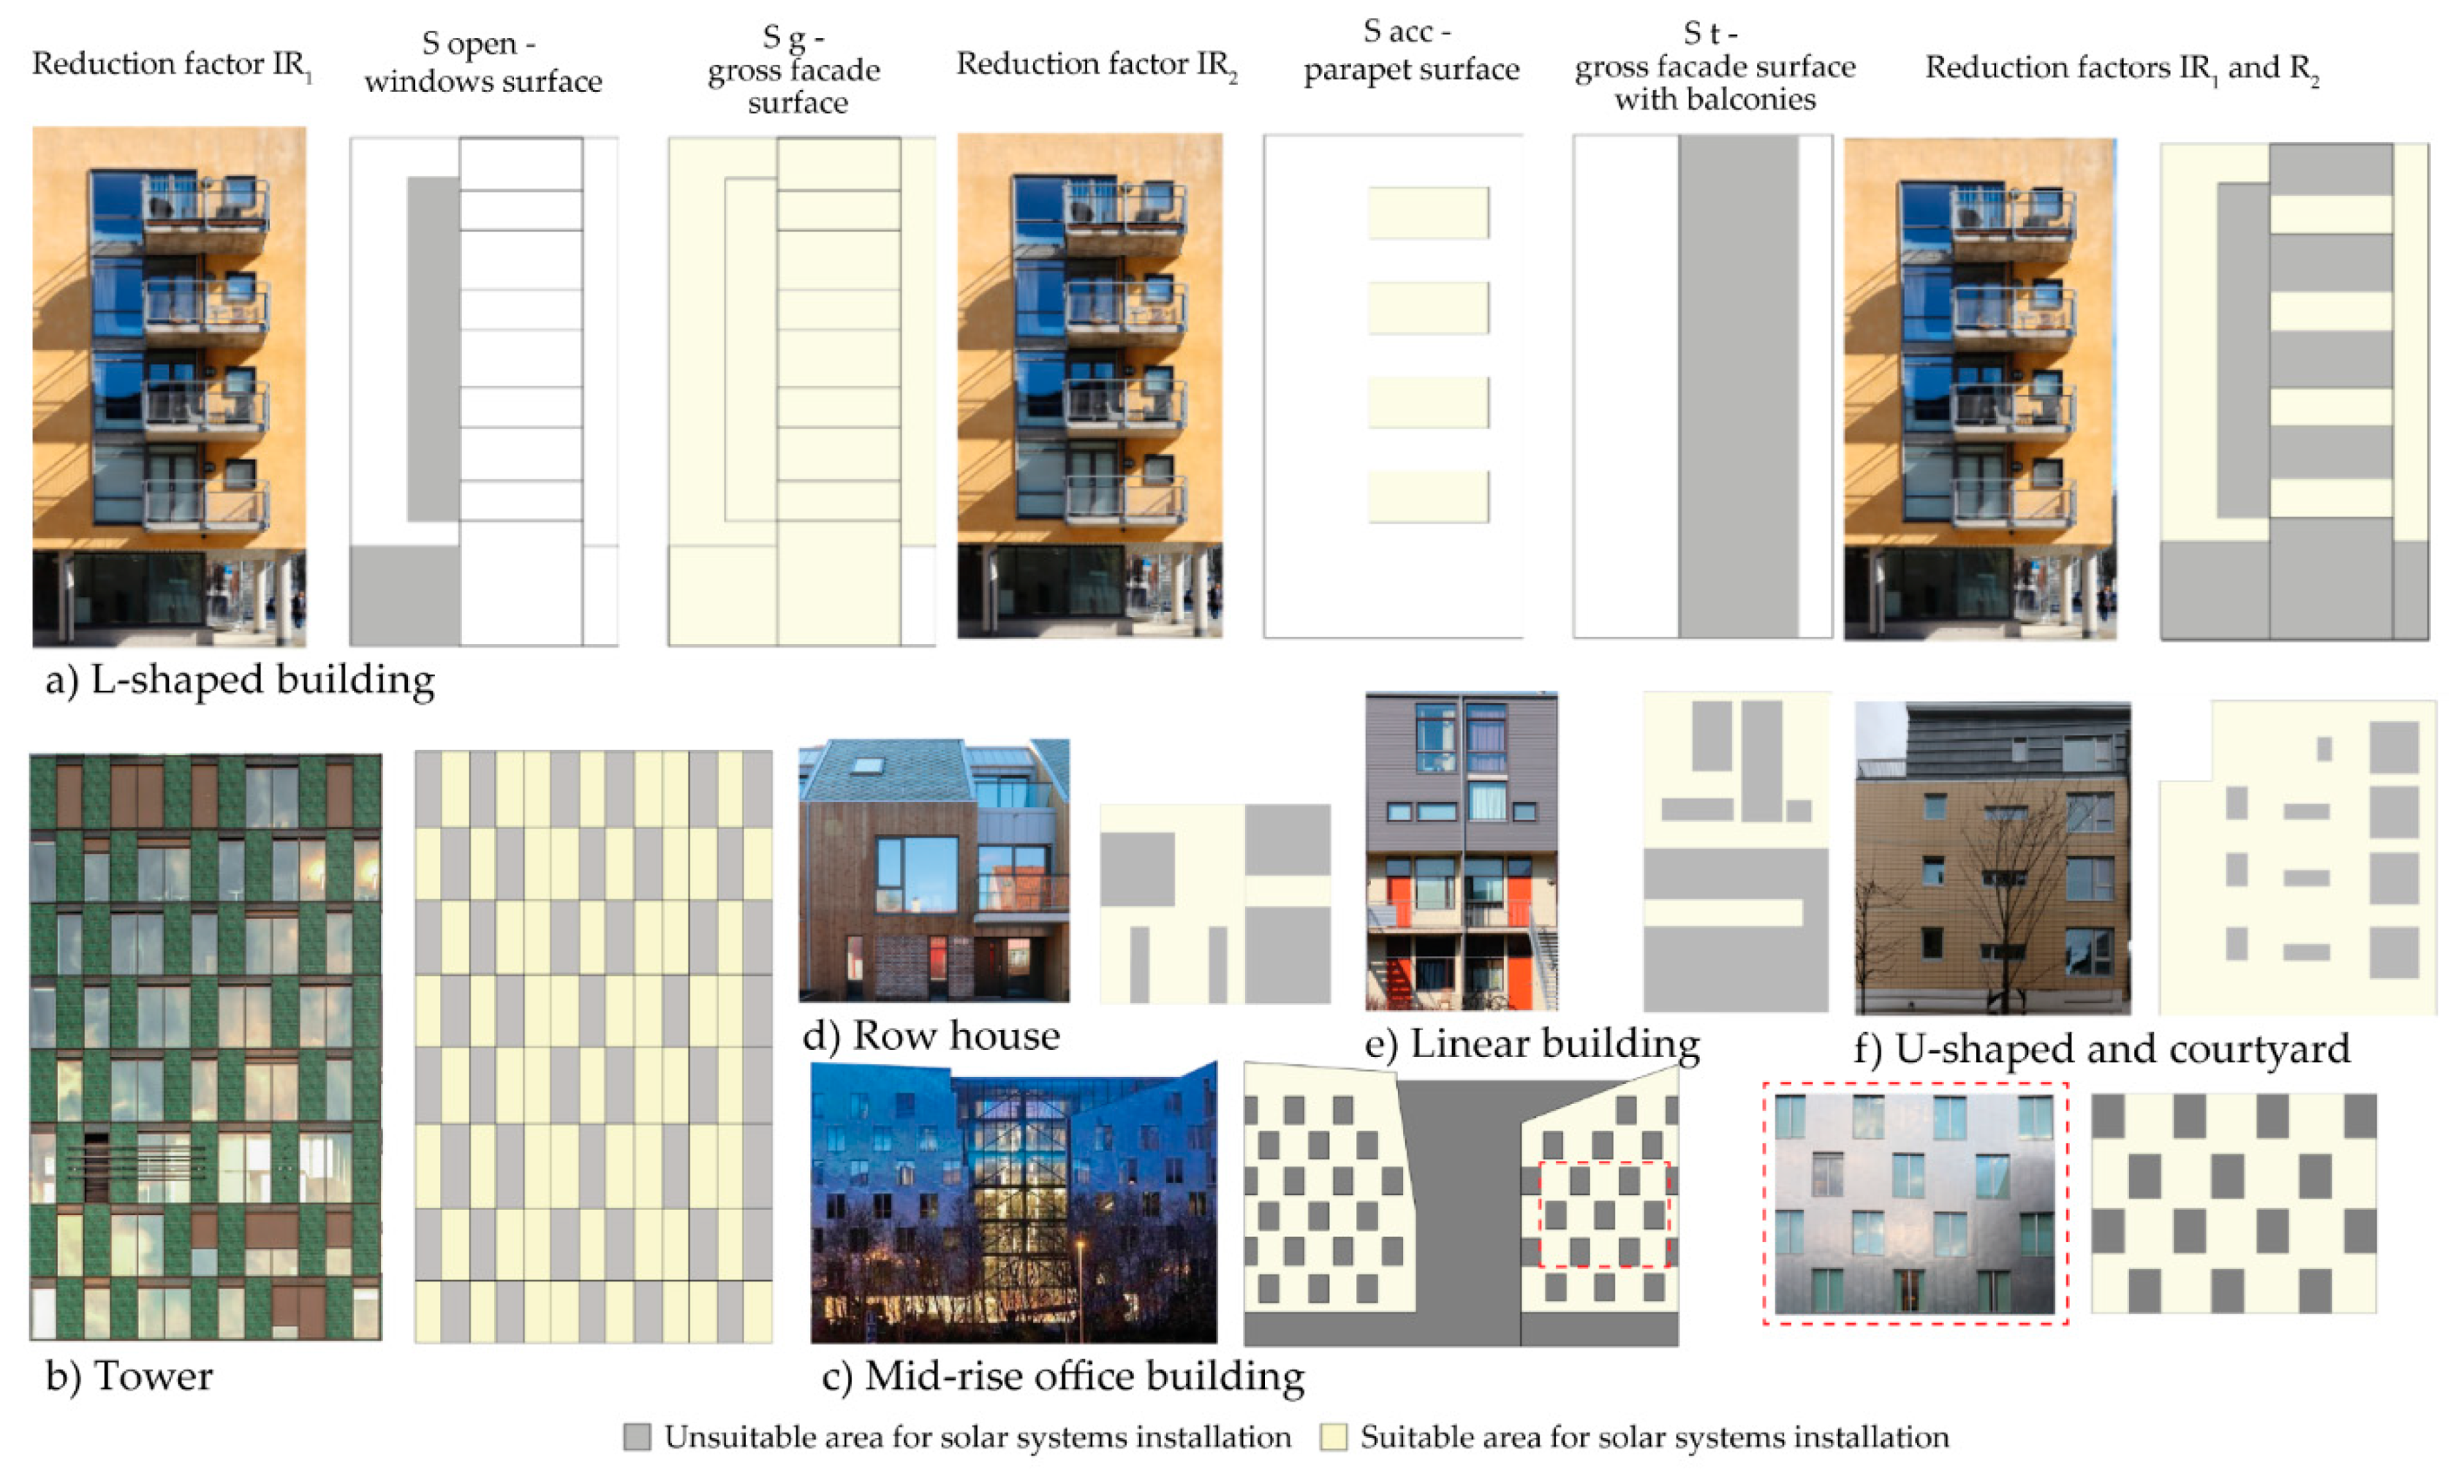
Calculation and Application of the Reduction Factors
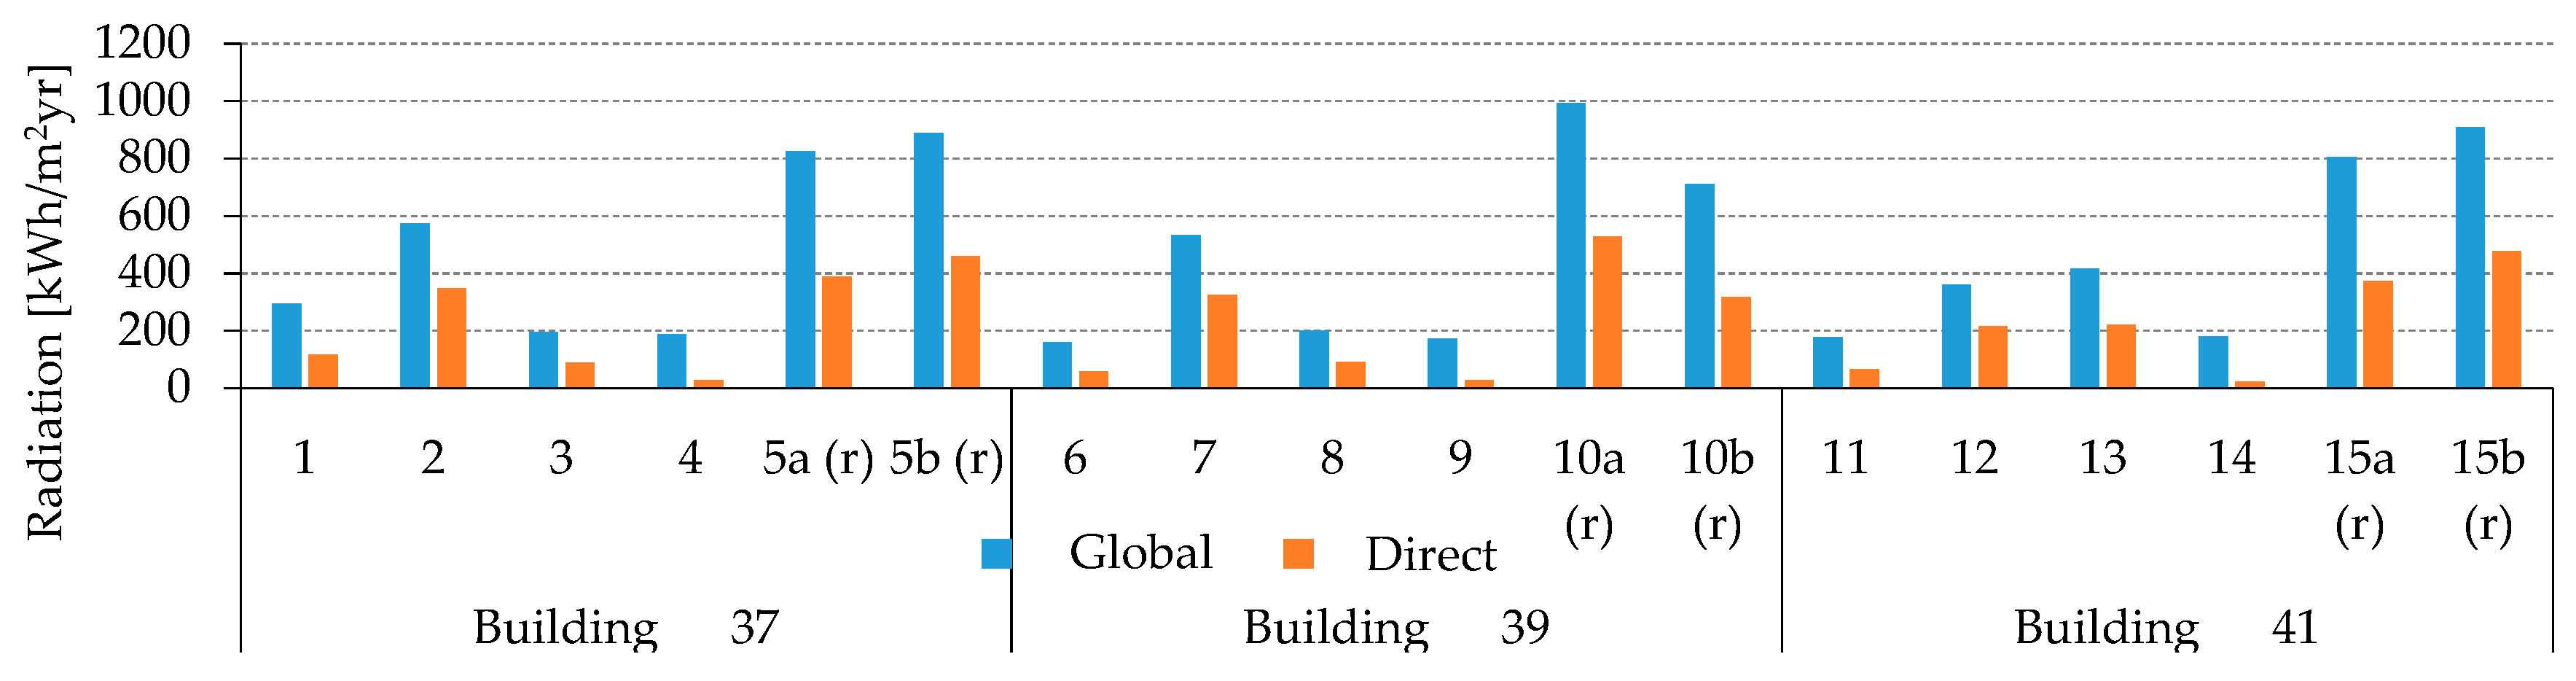
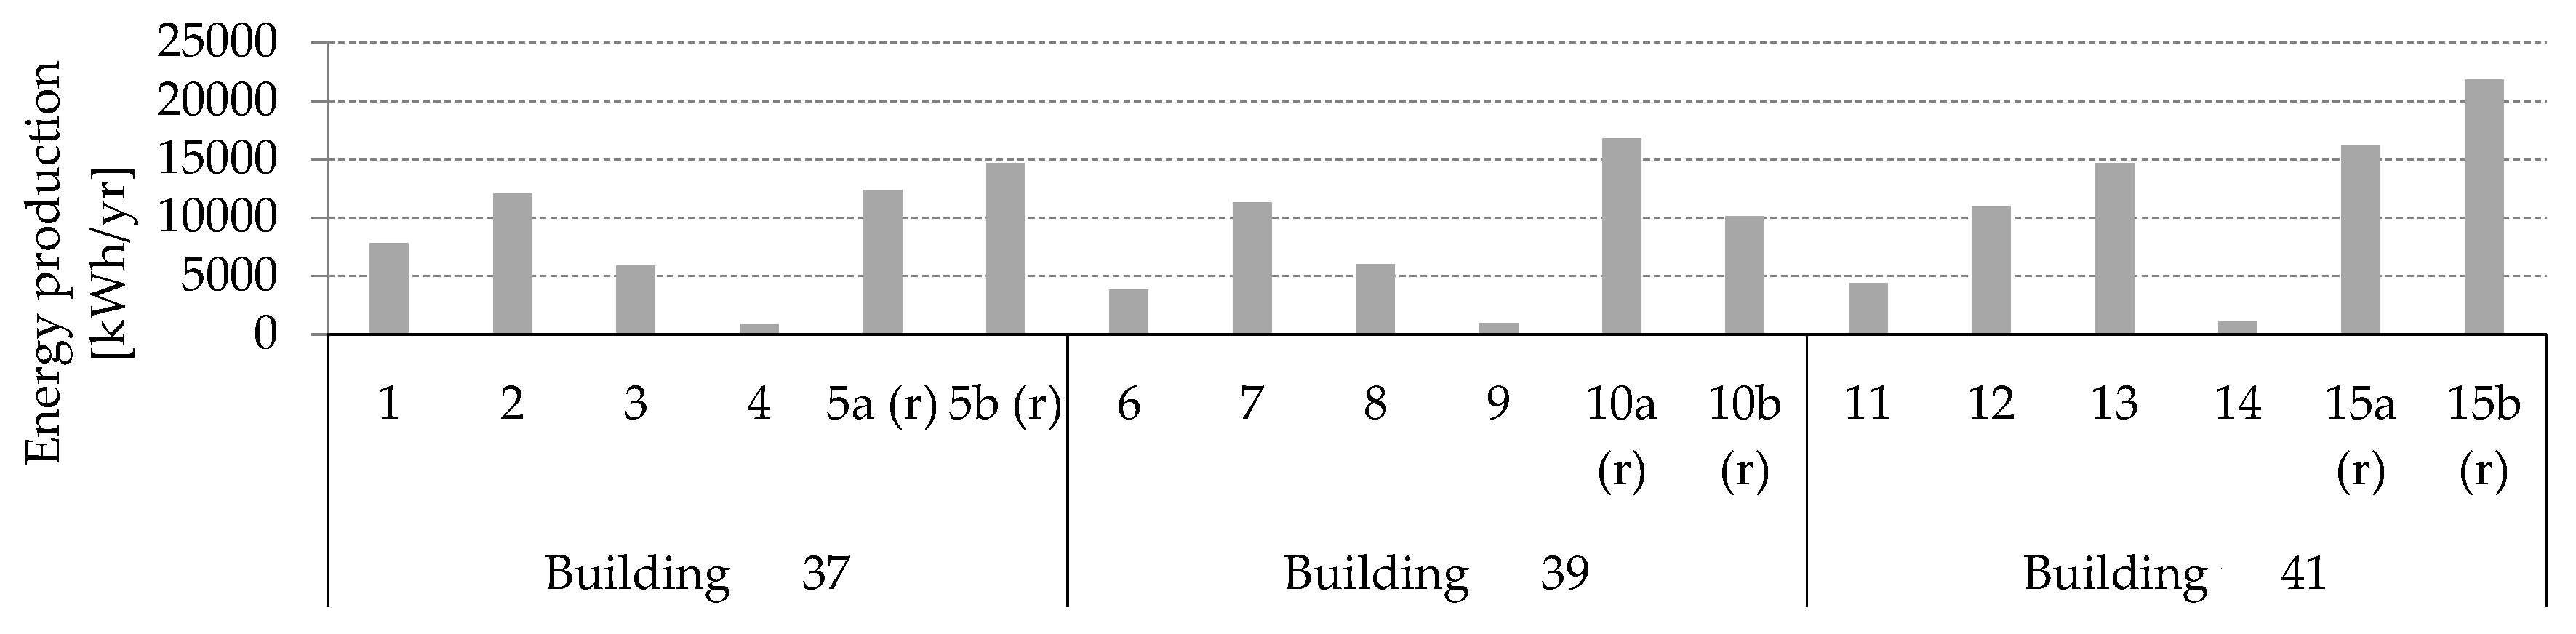
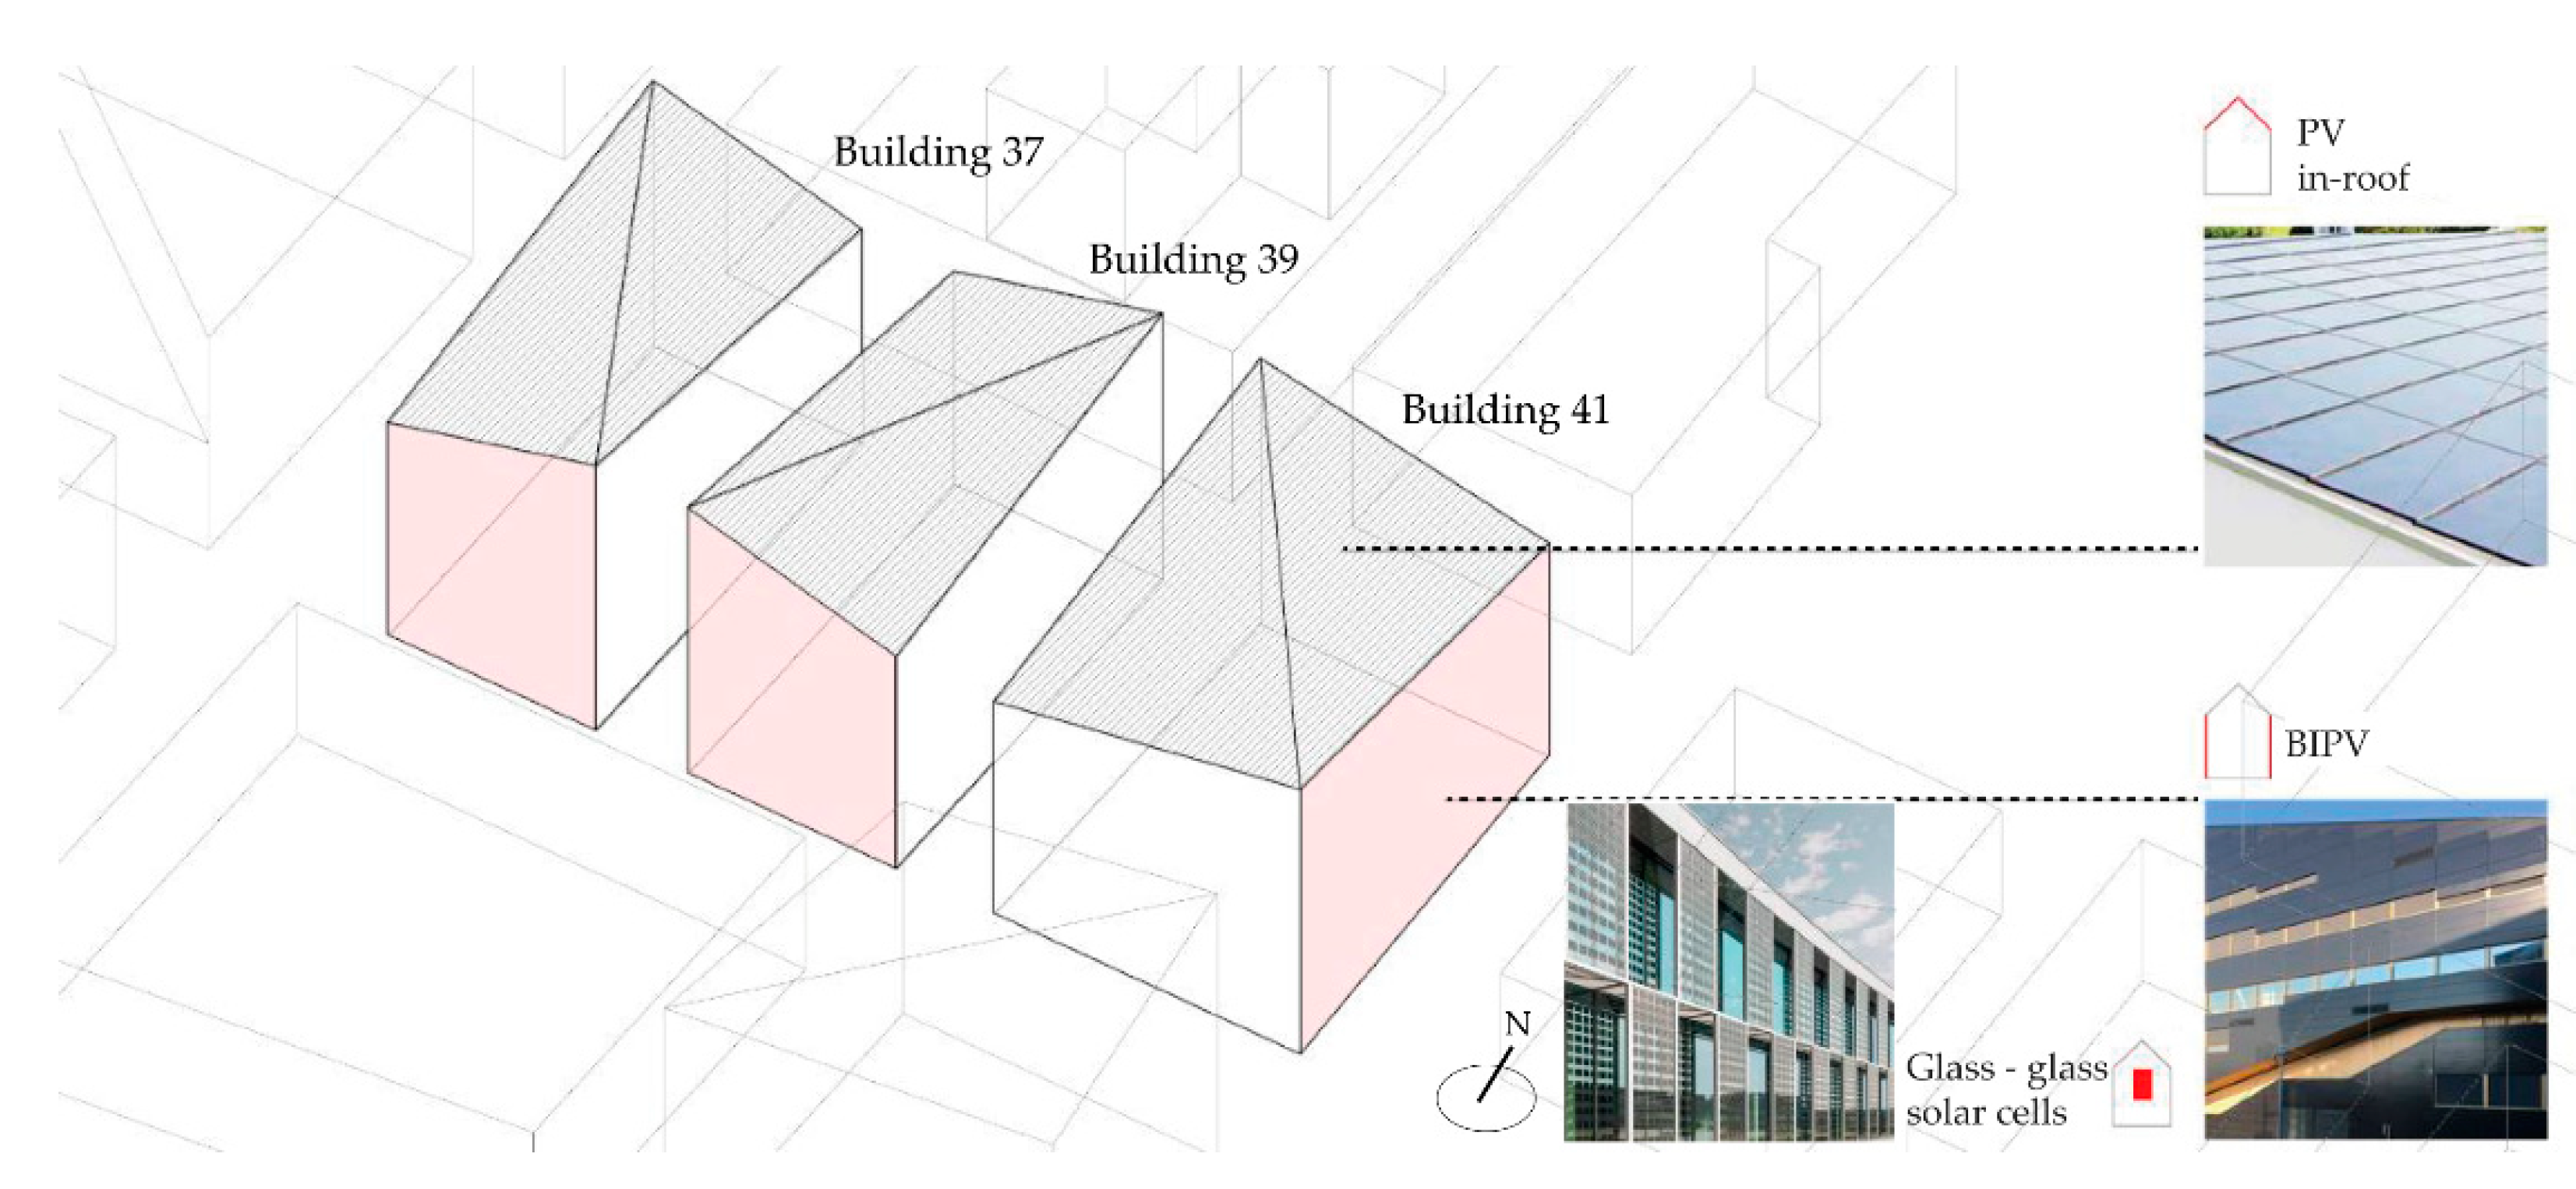
3.6. Step 6–Solar Potential, Solar Energy Generation Analysis, and Technology Recommendations
4. Application in the Case Study Are of Sluppen
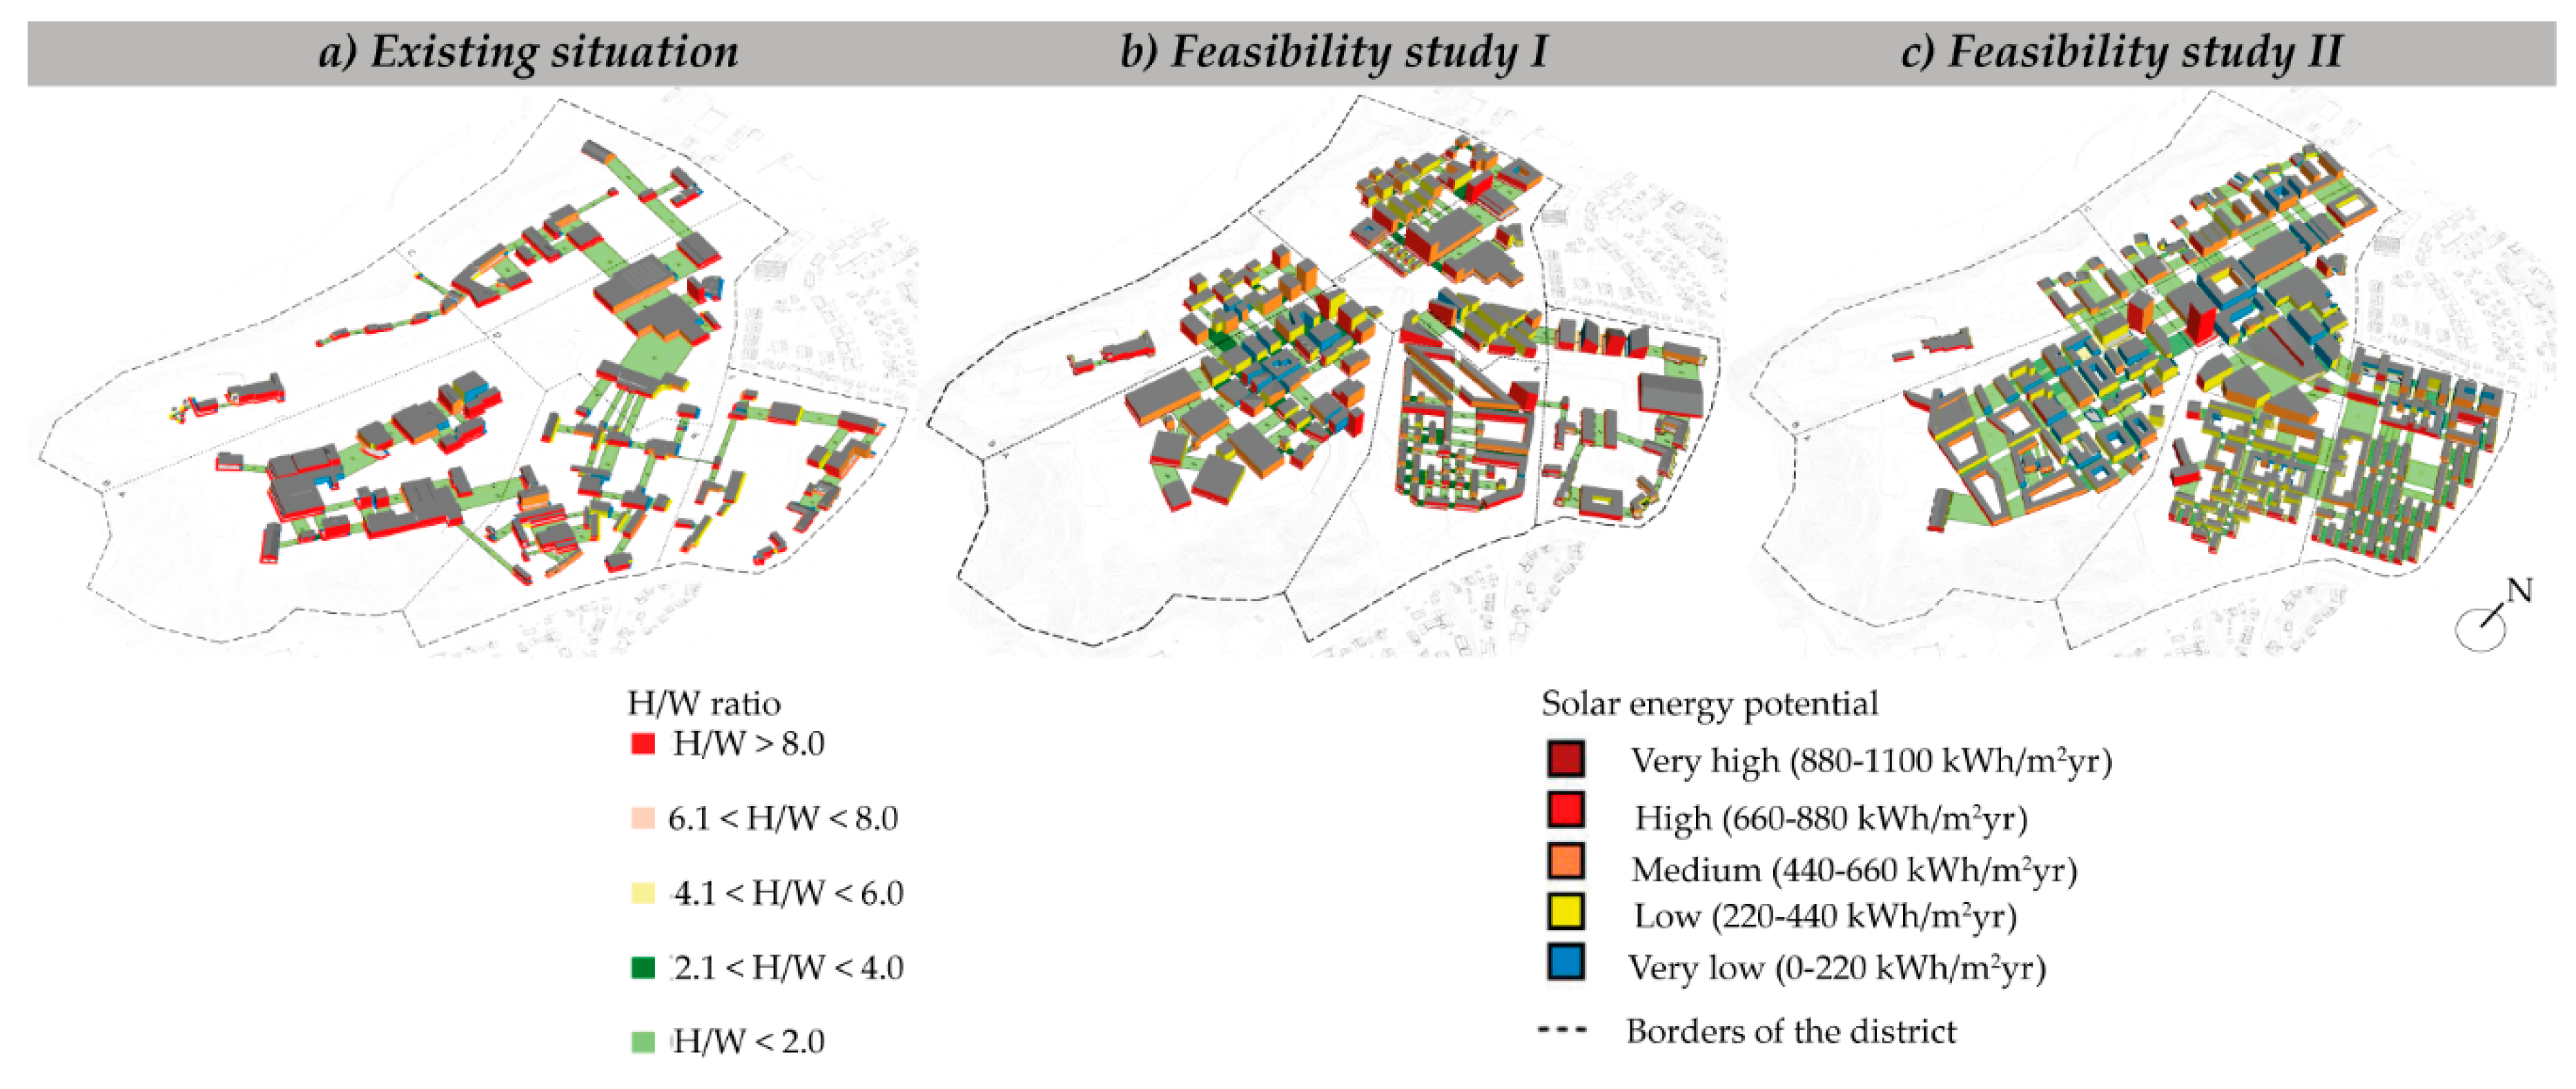
4.1. Step 1–Urban Analysis
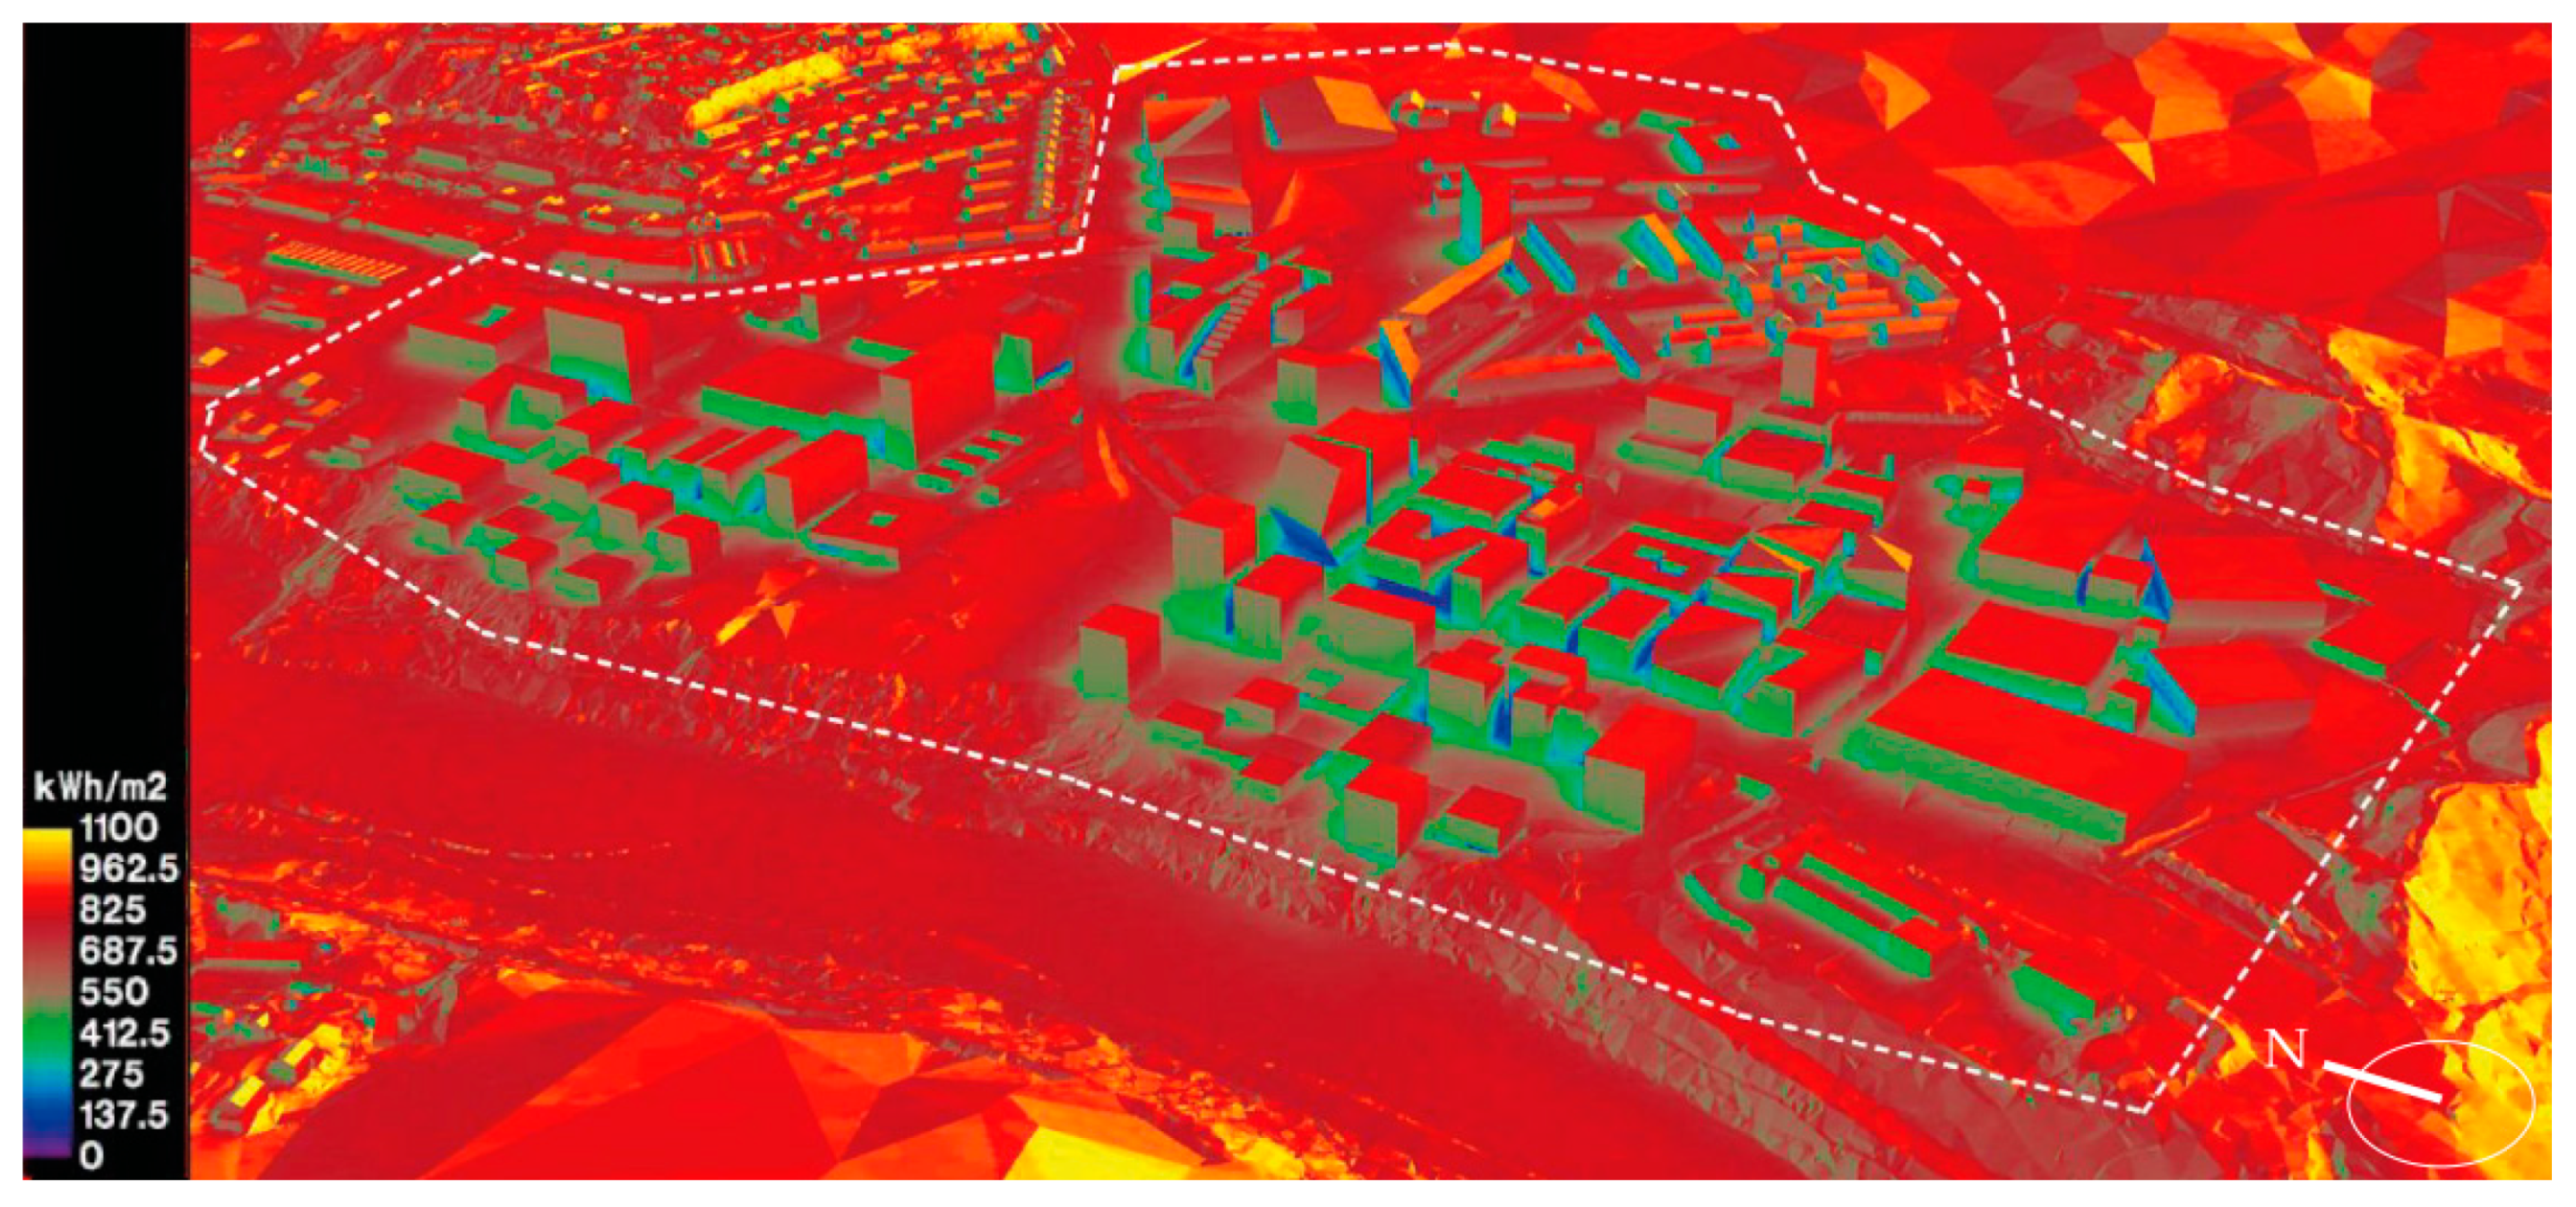
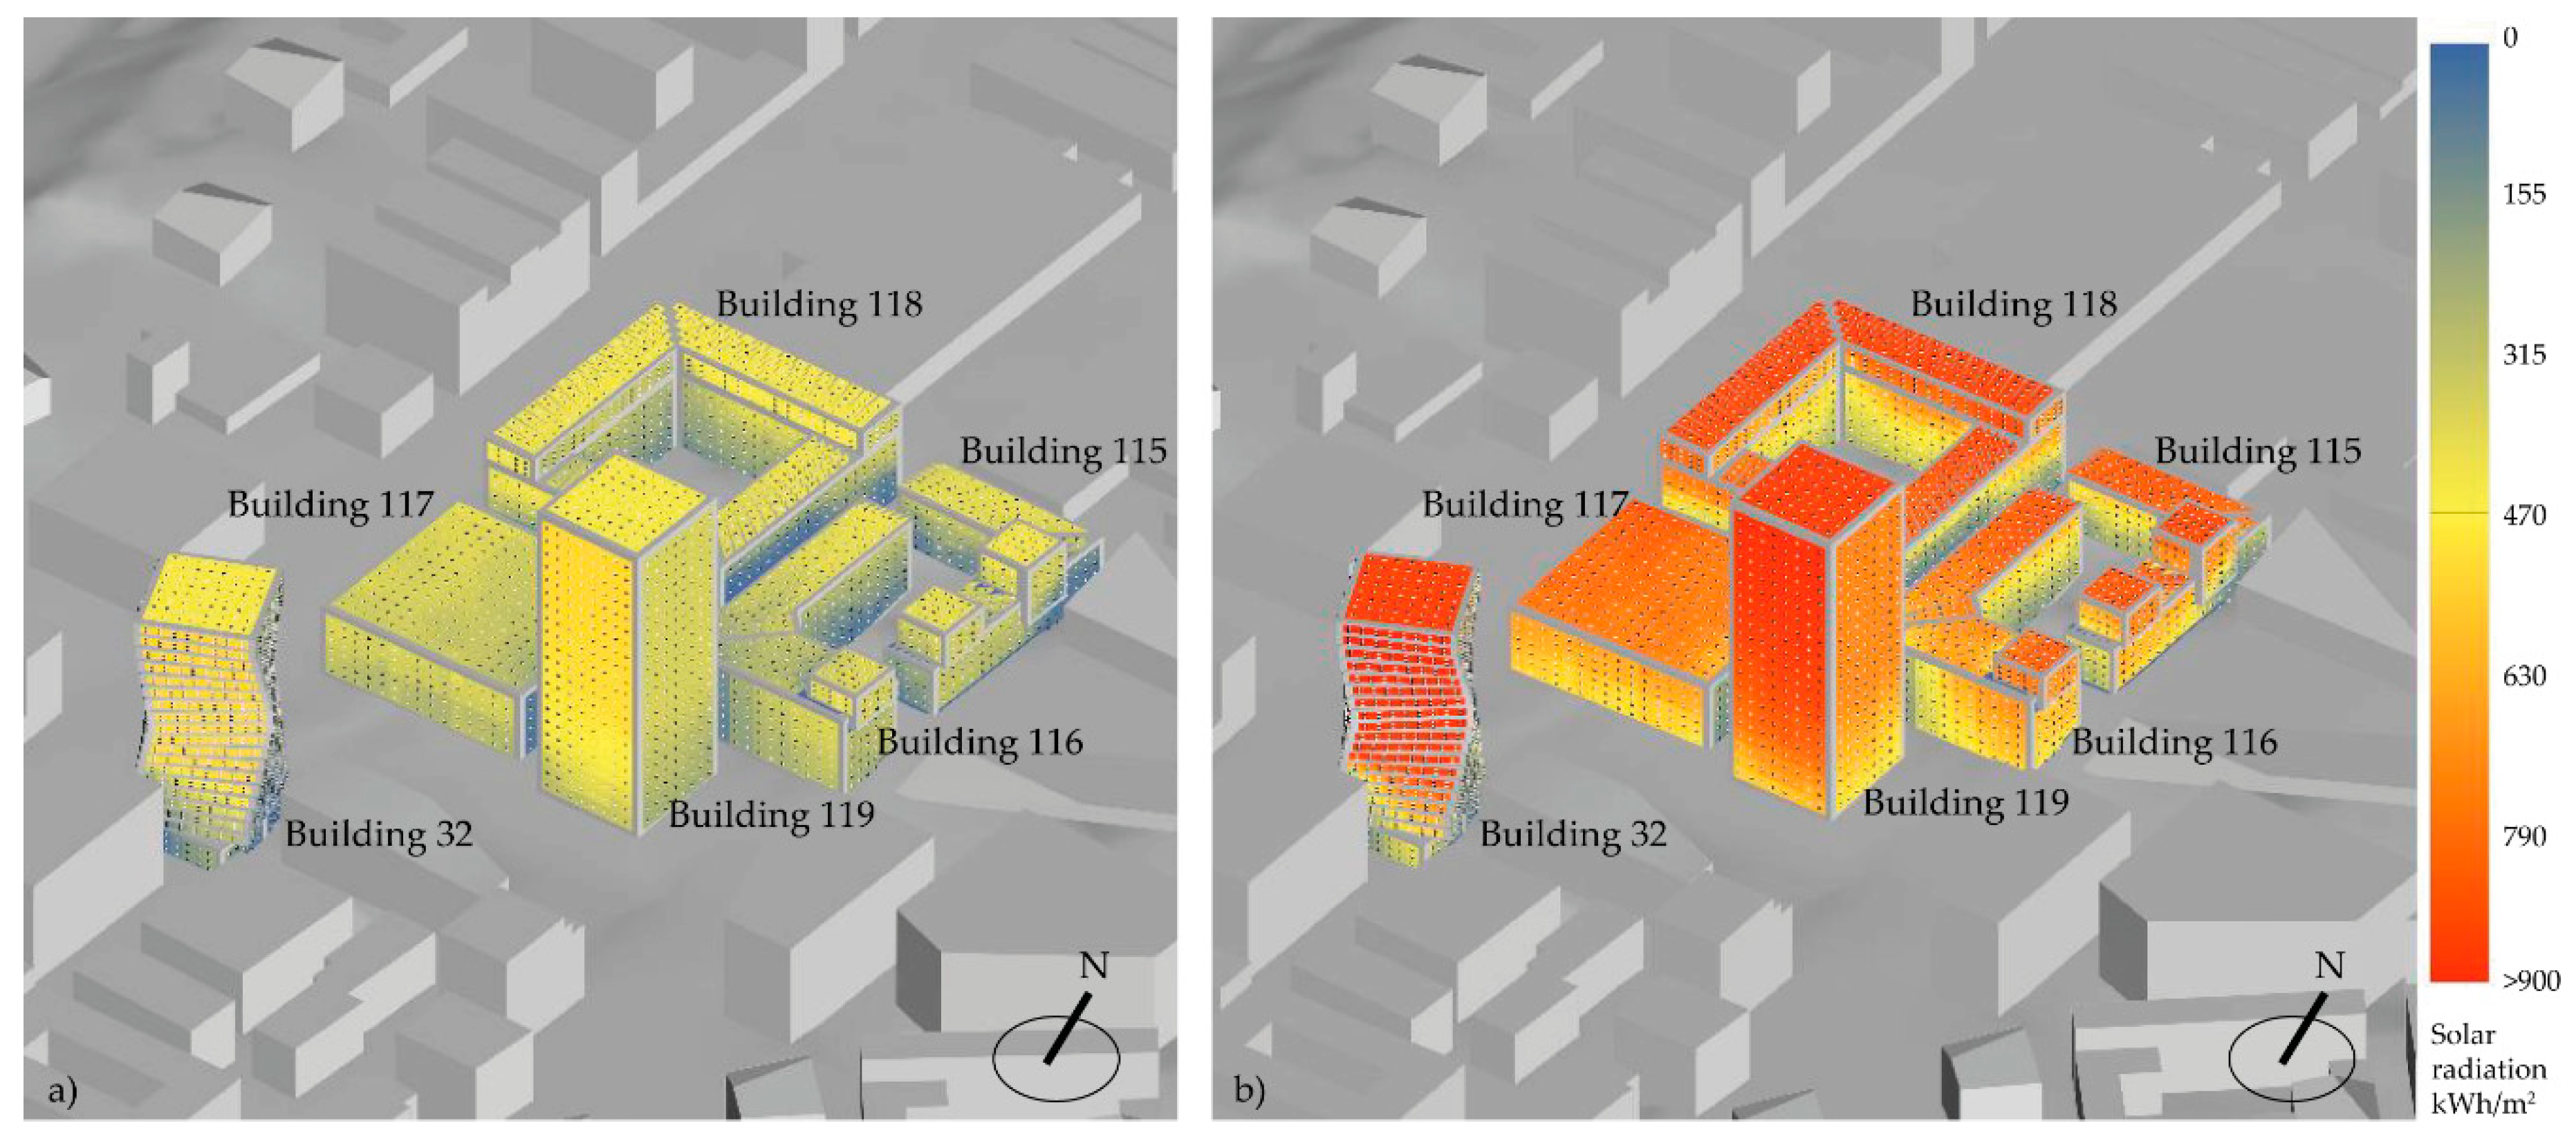
4.2. Step 2—Solar Irradiation Analysis
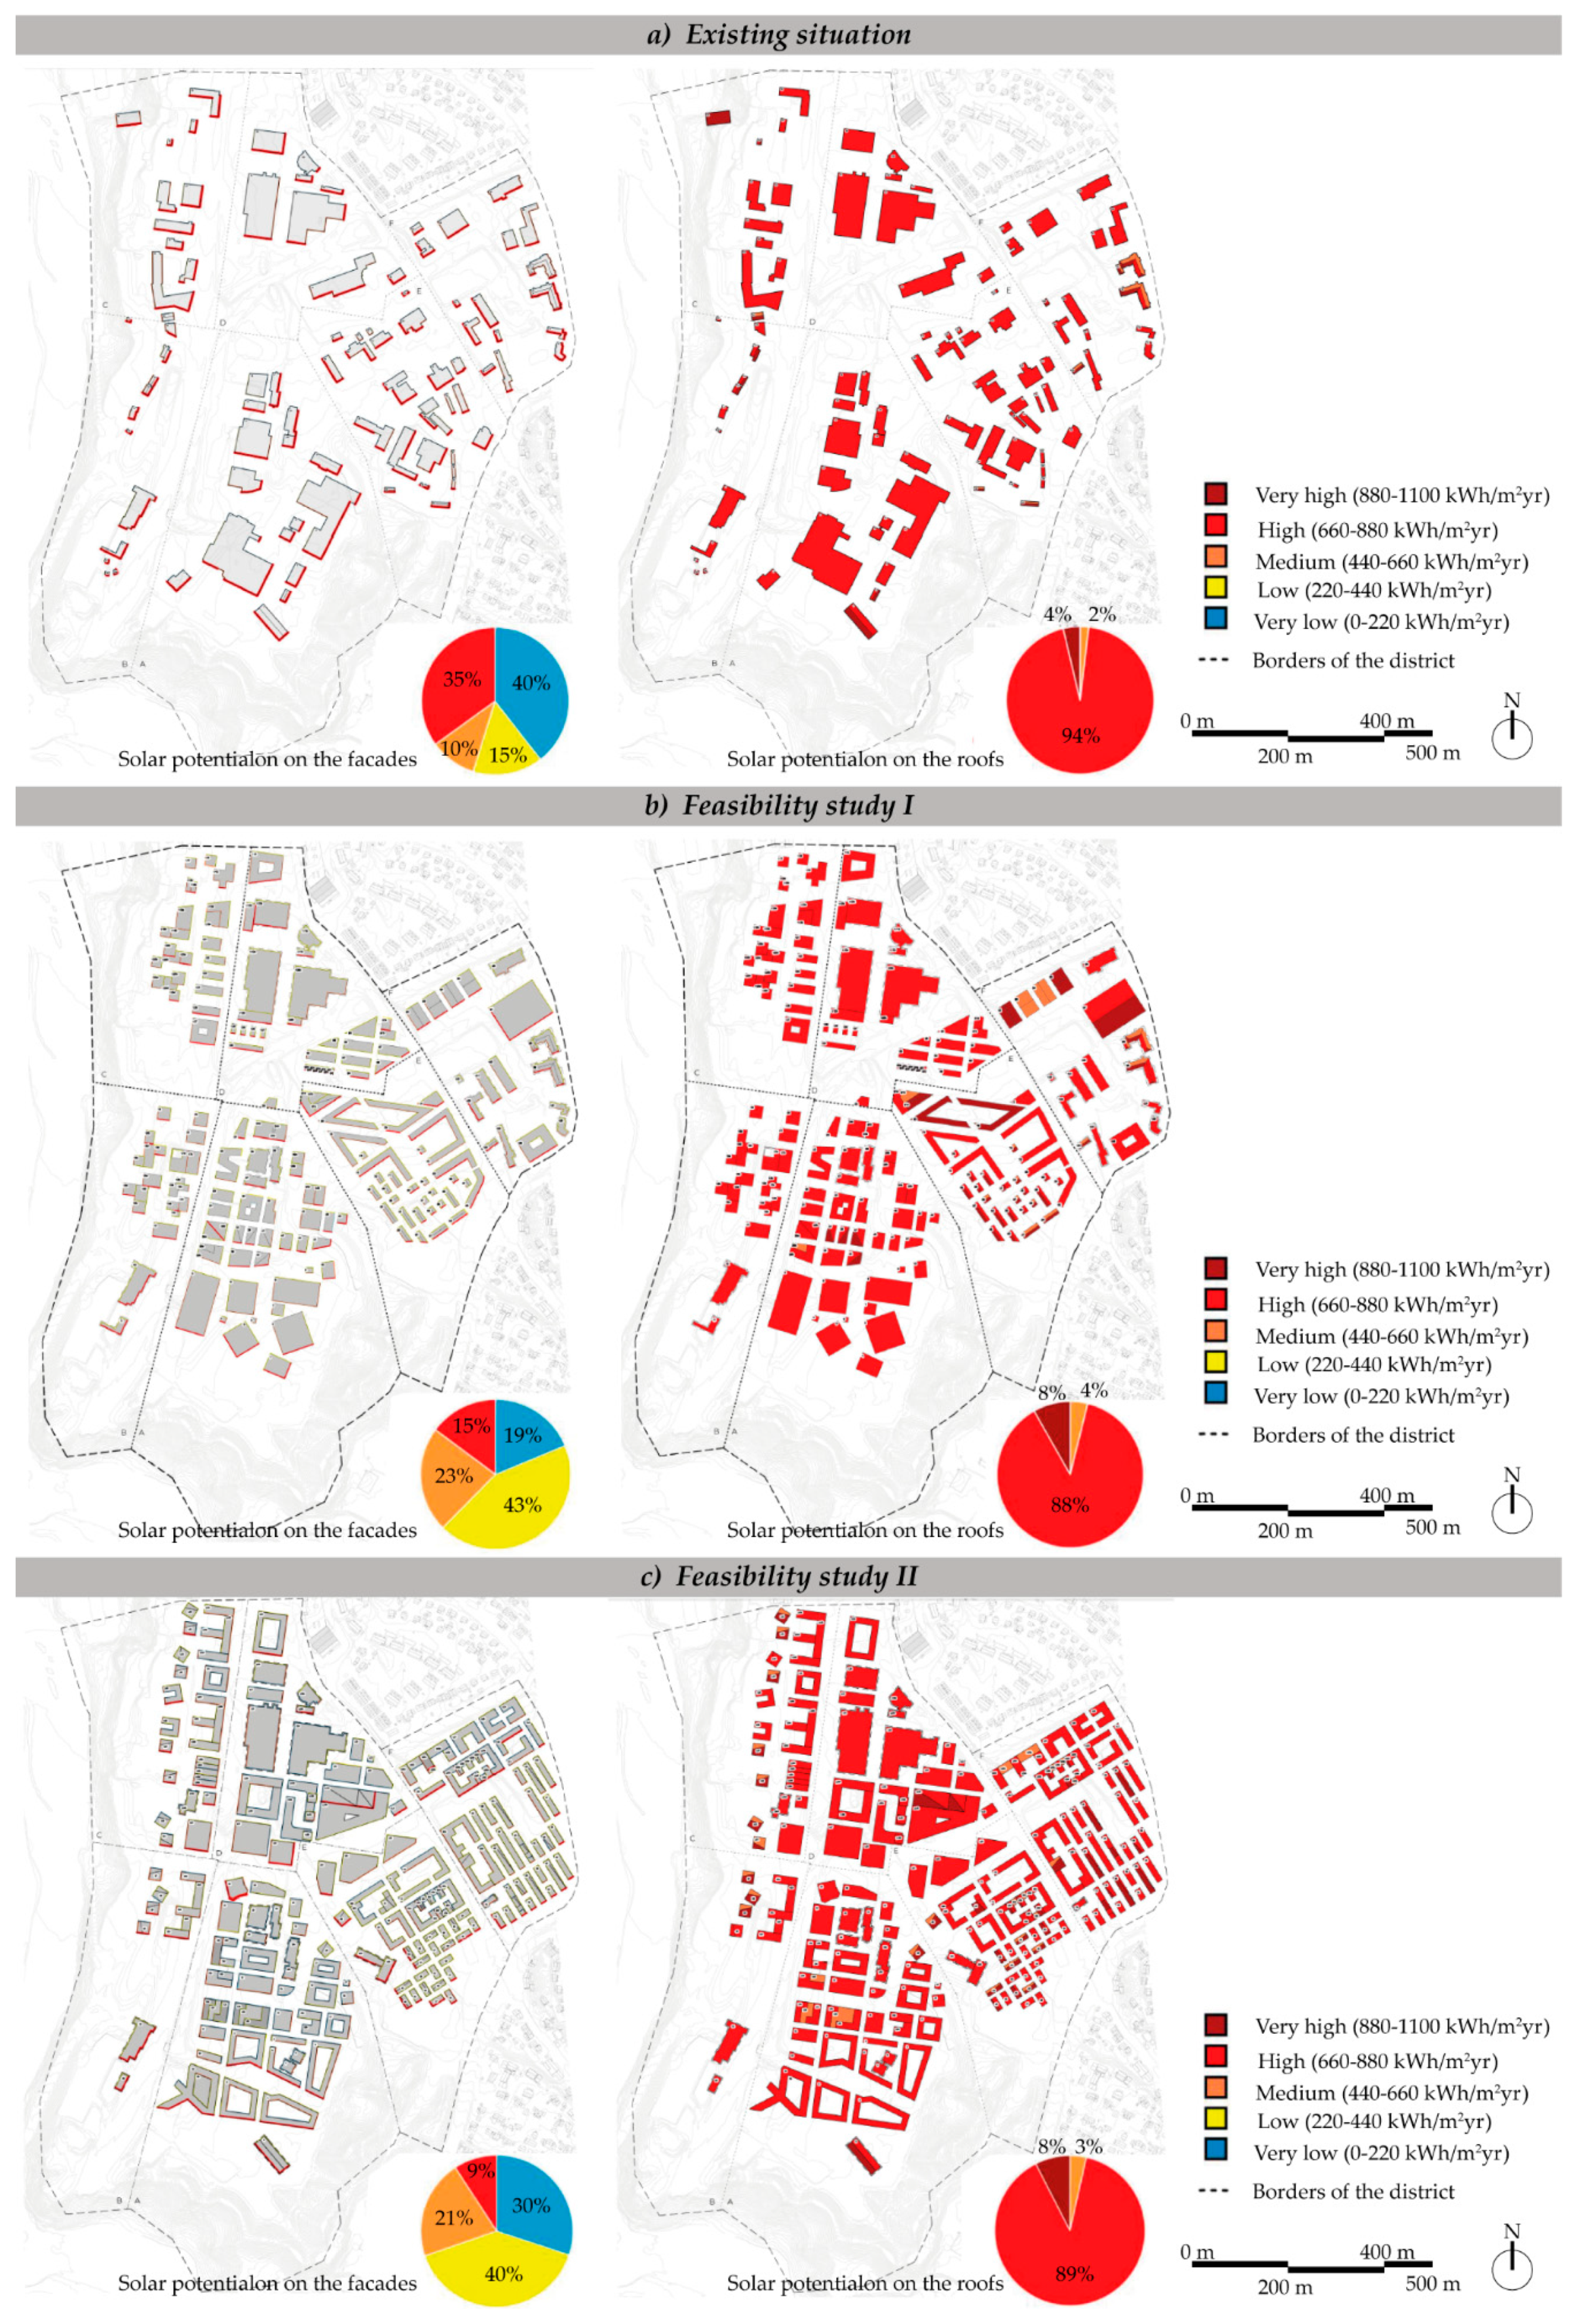
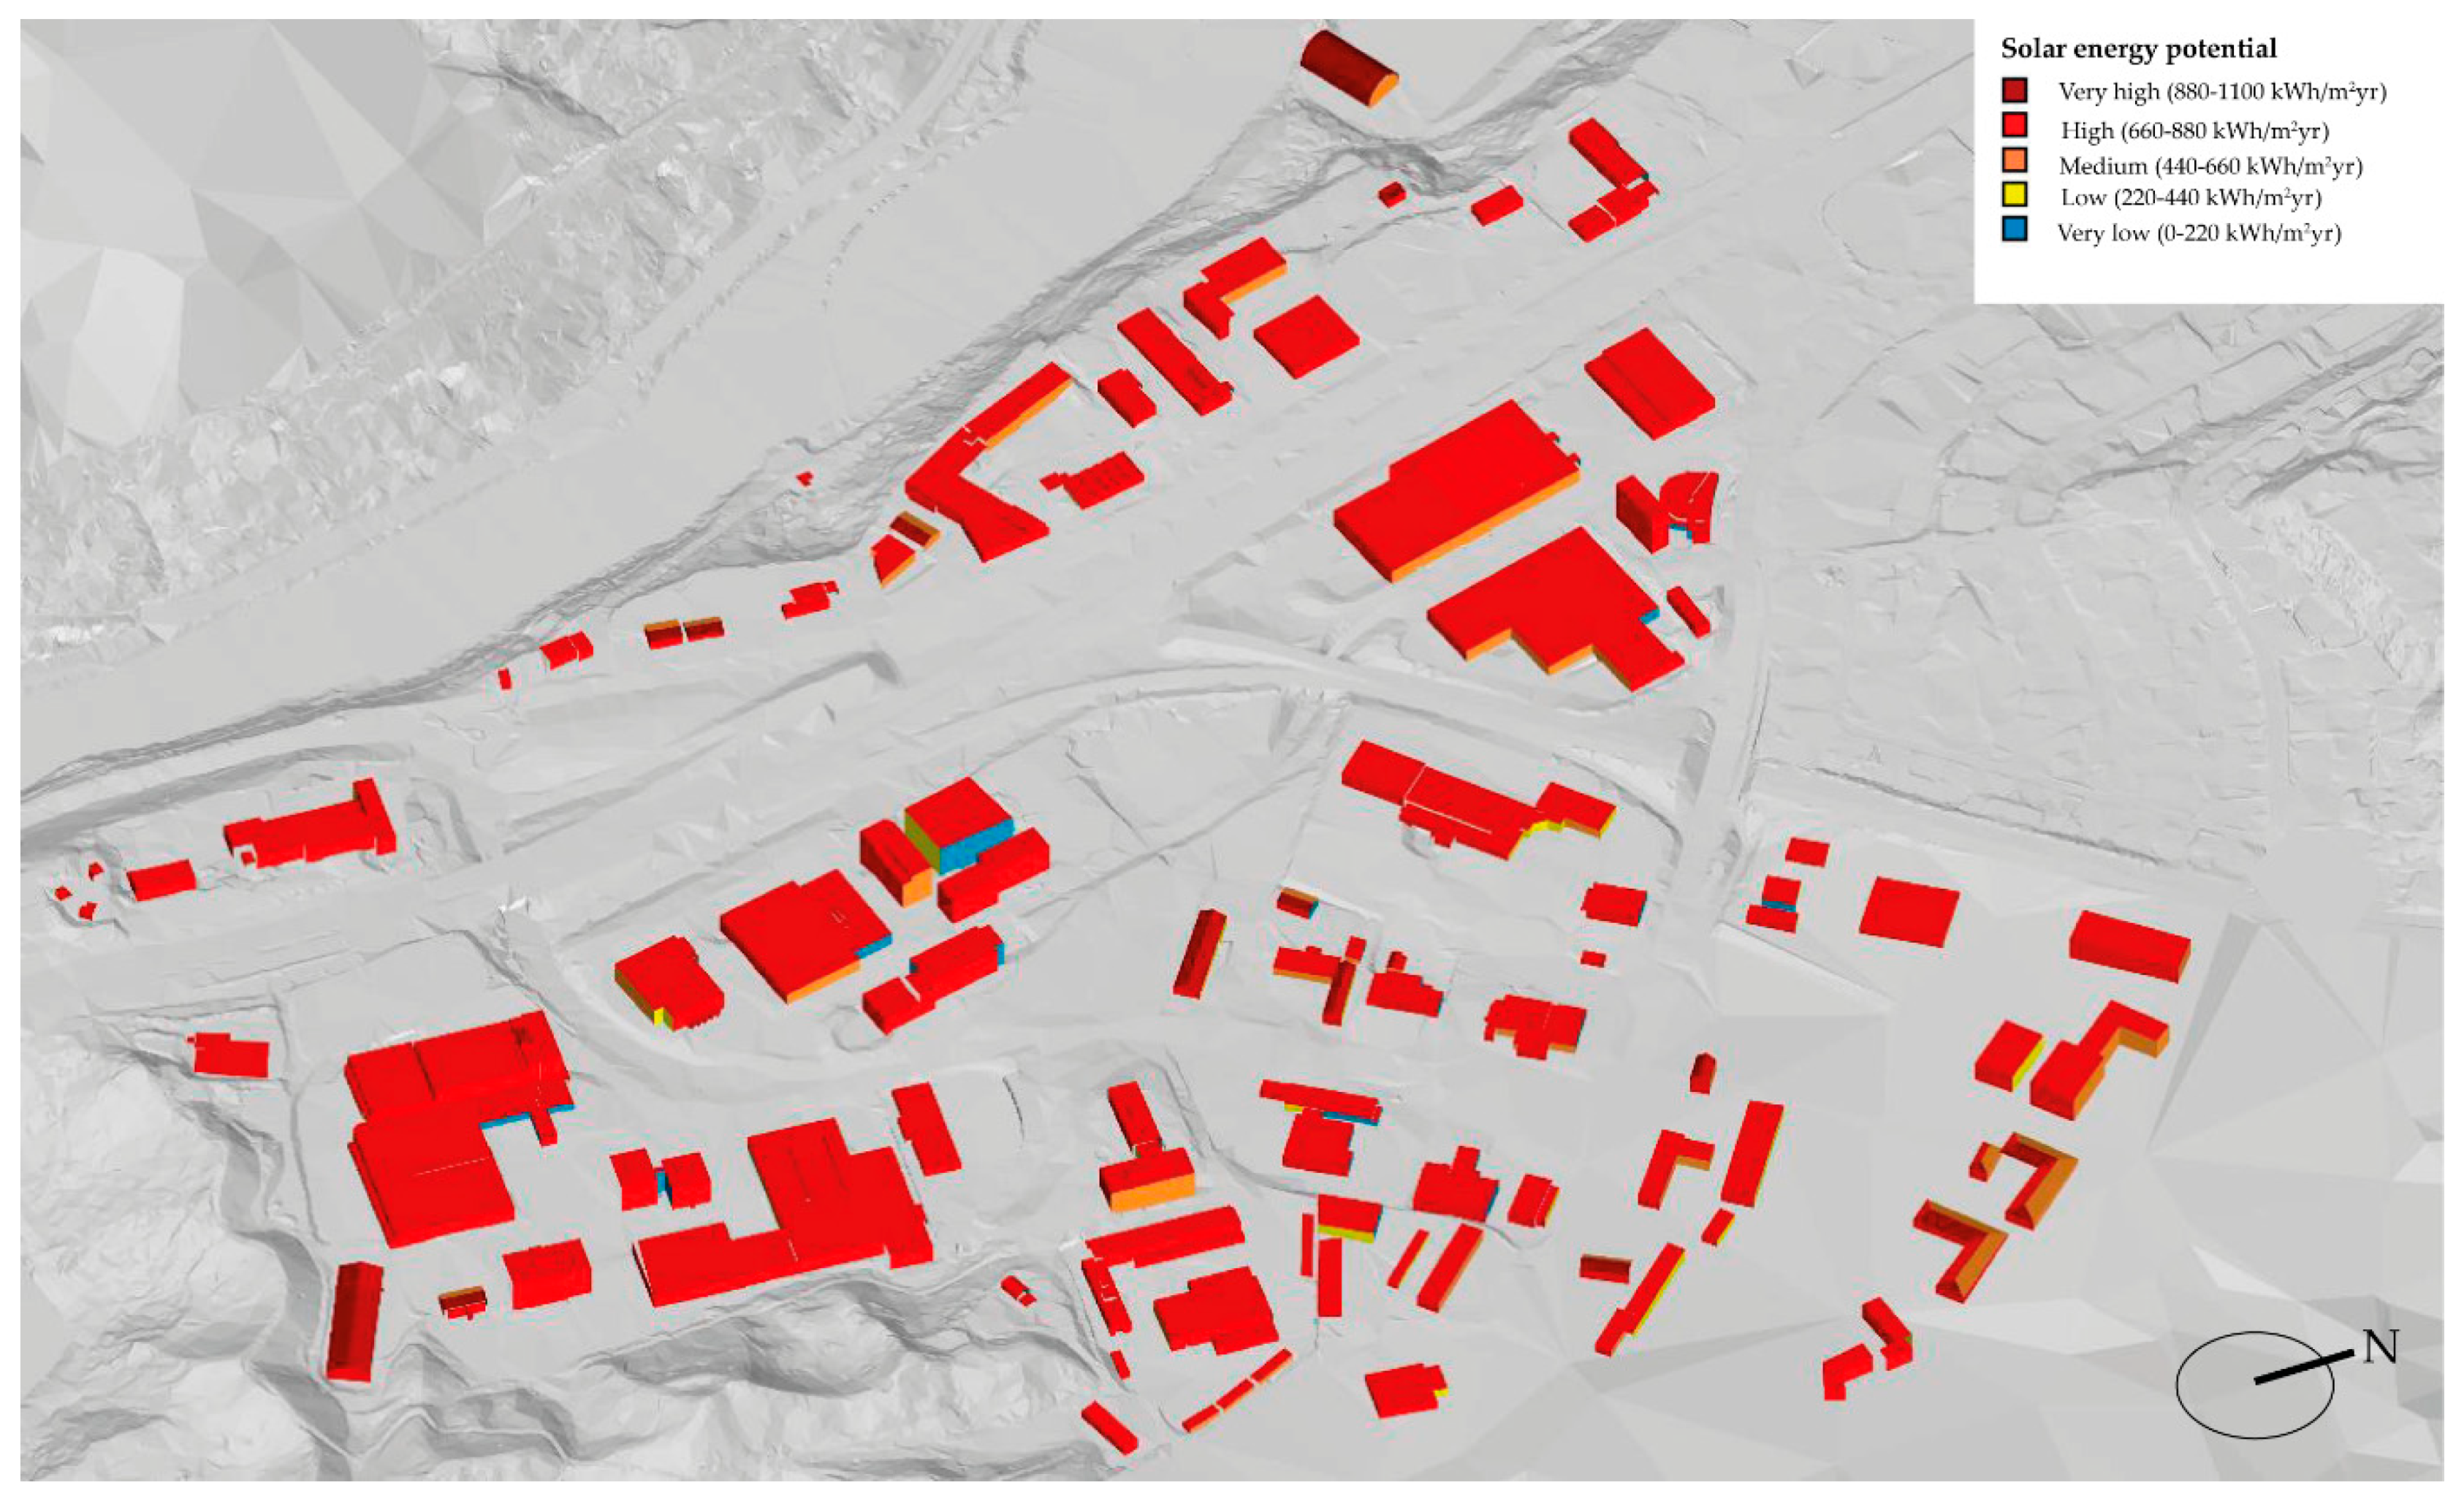
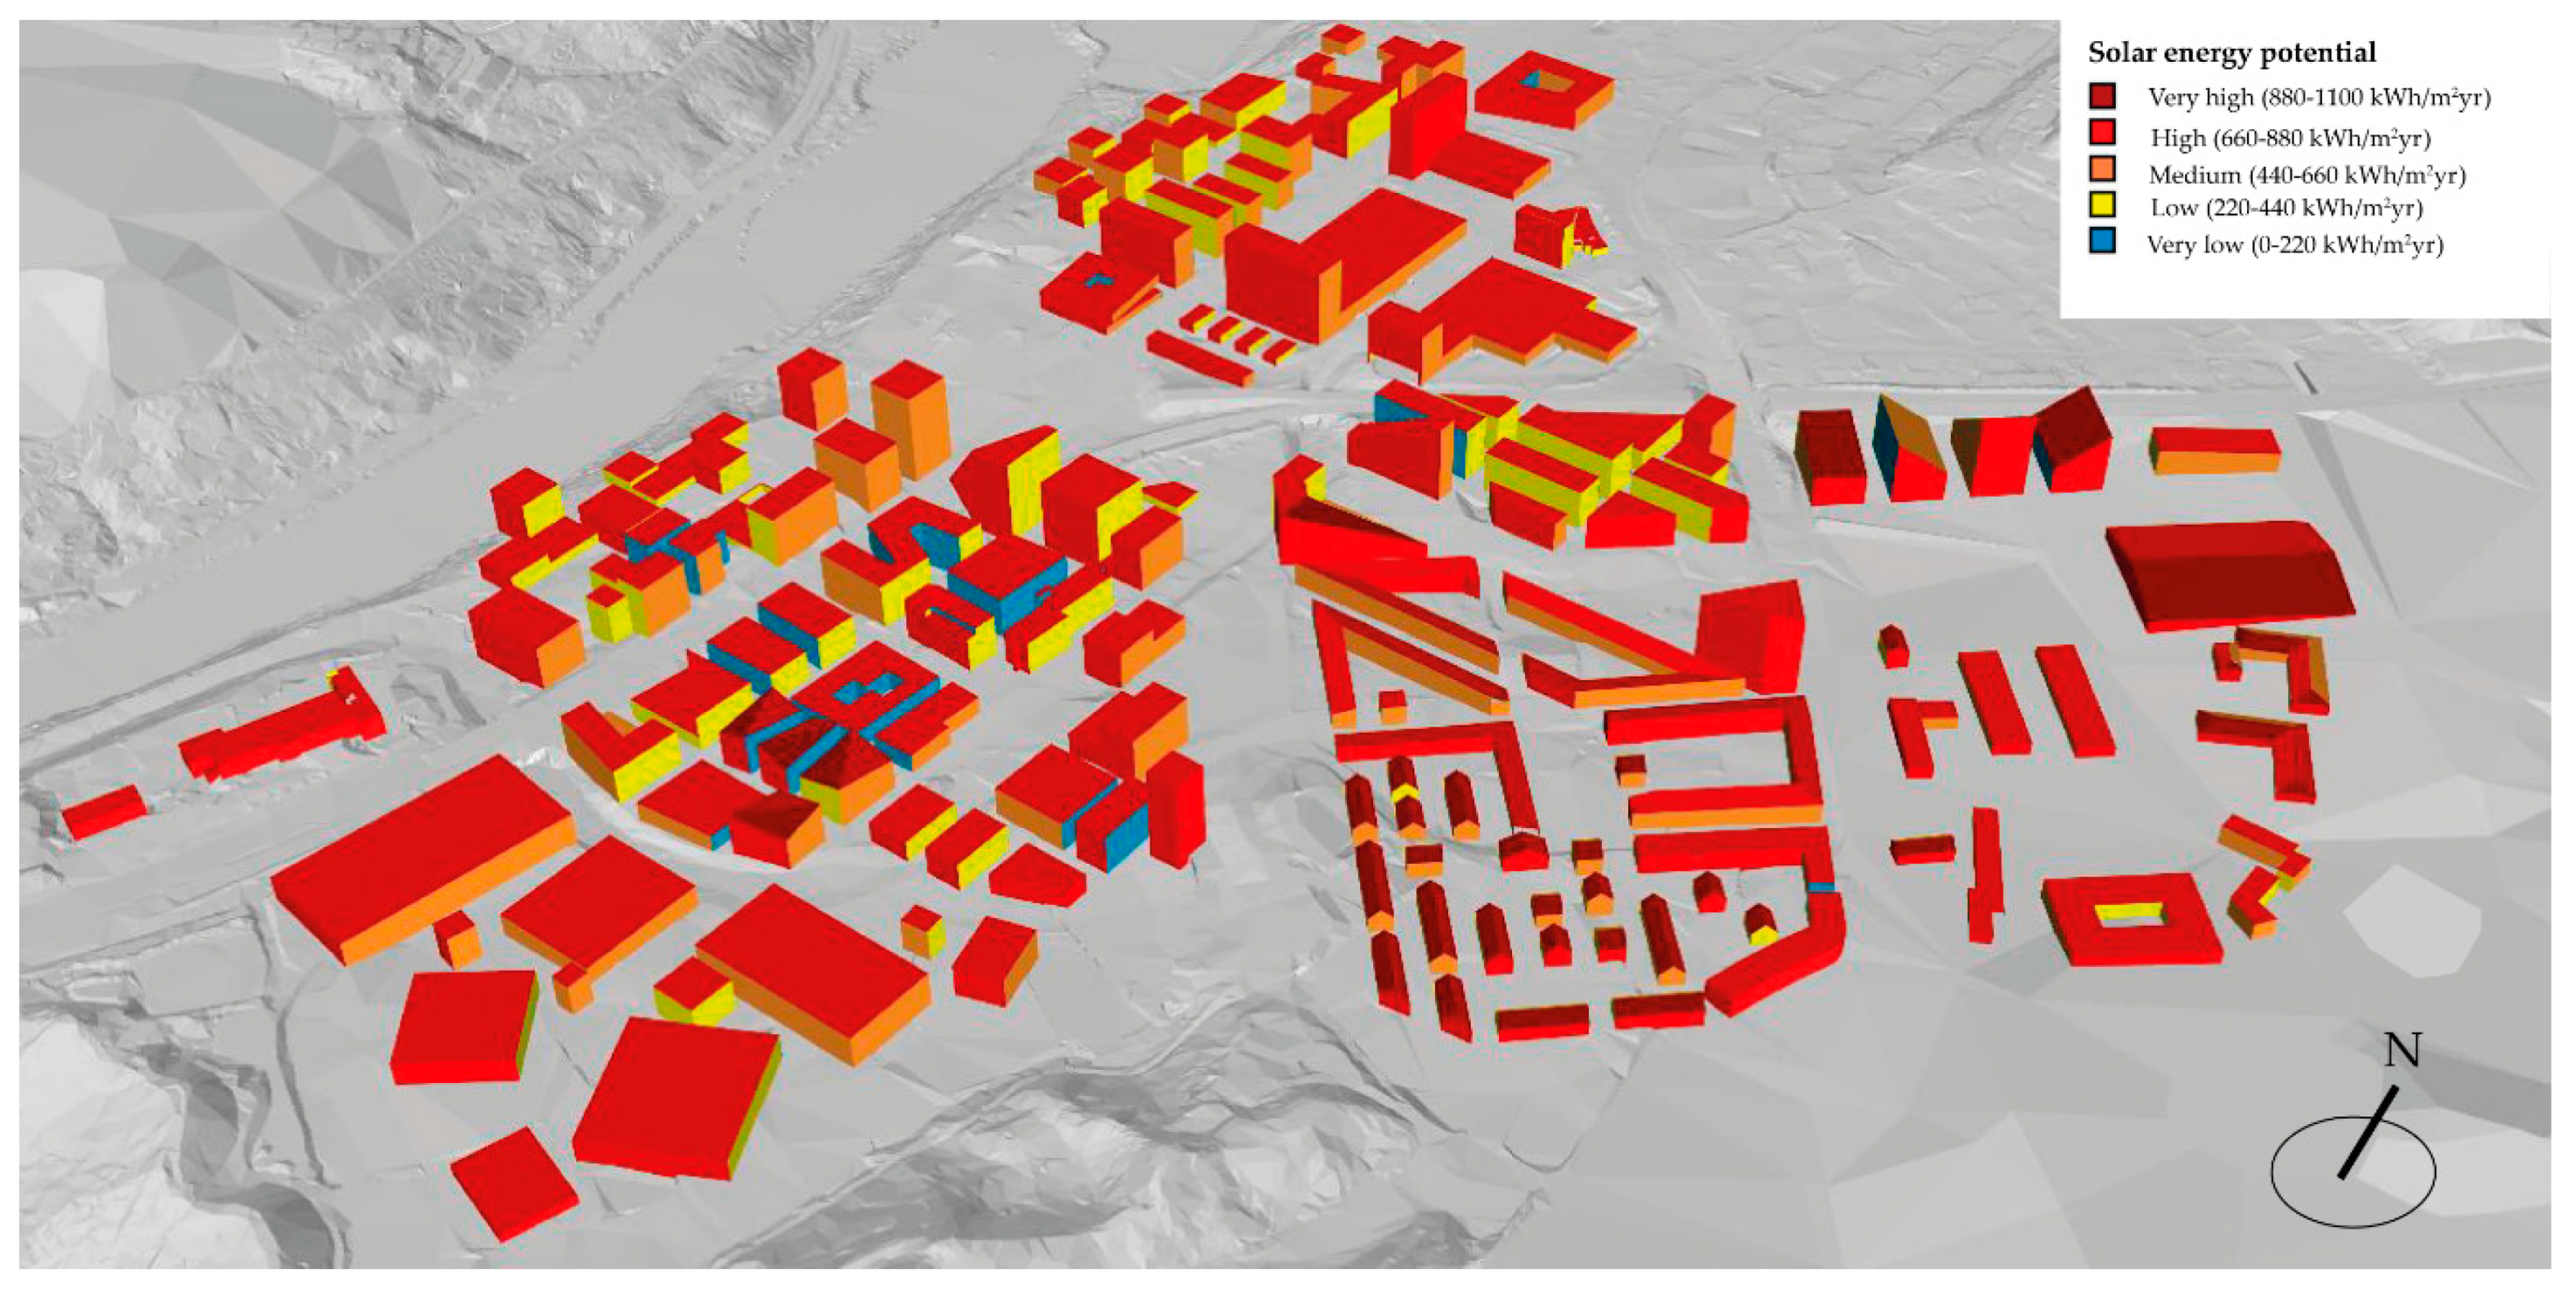
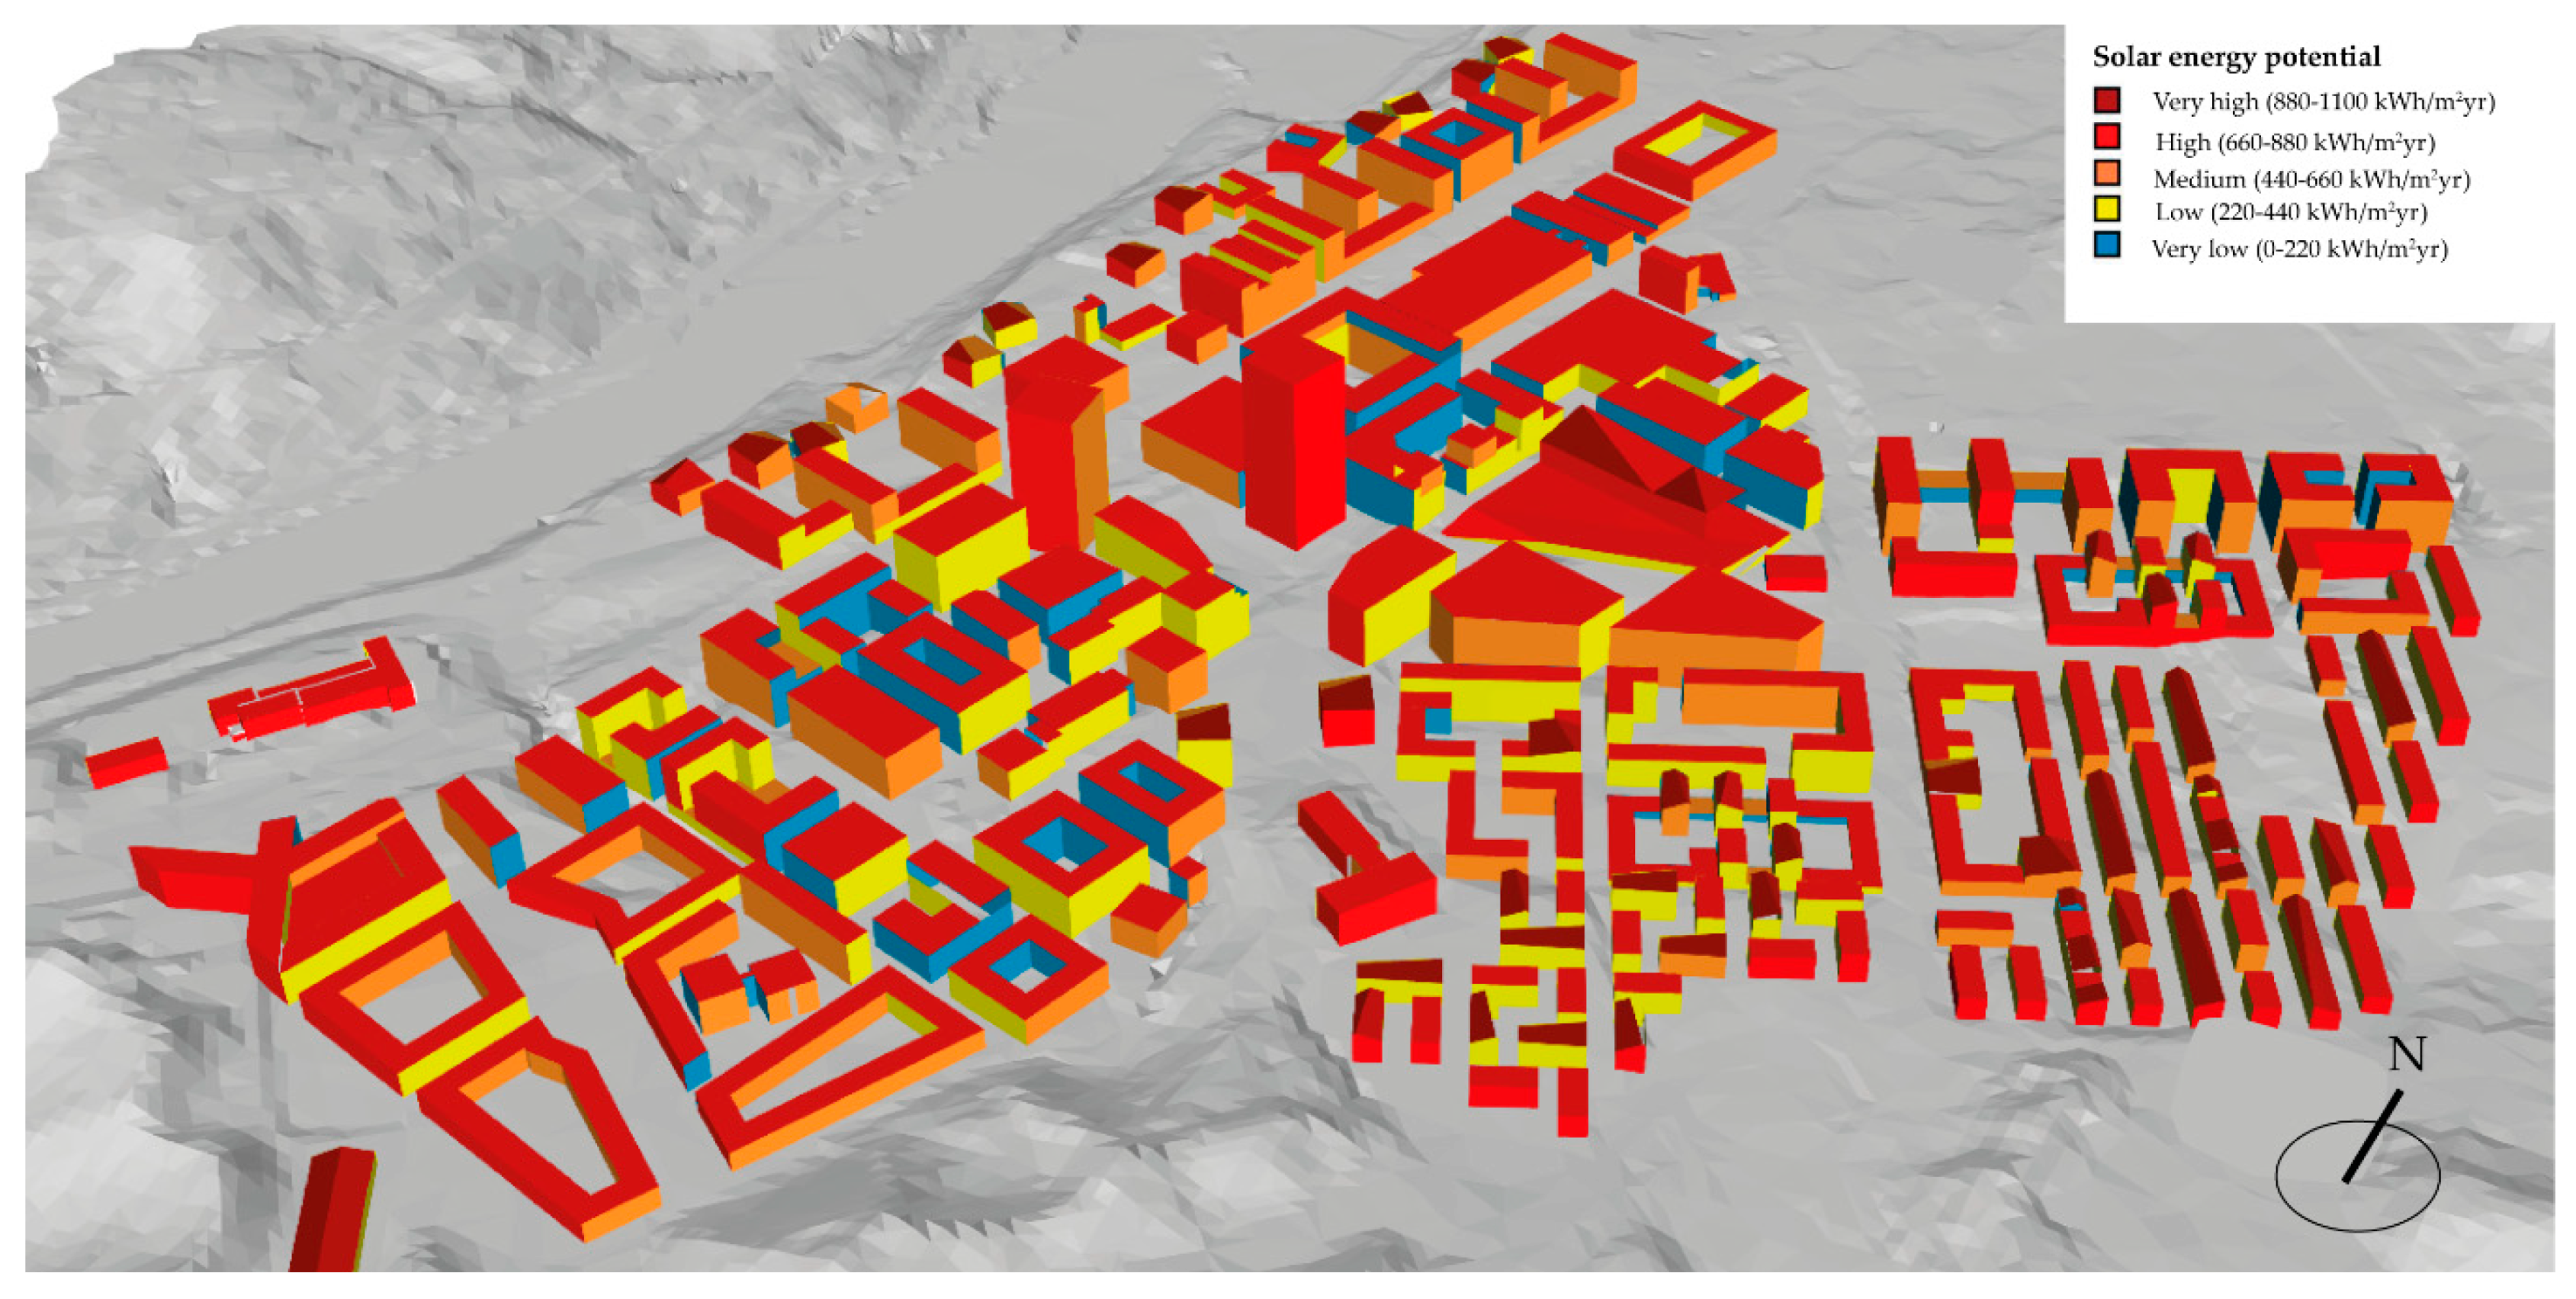
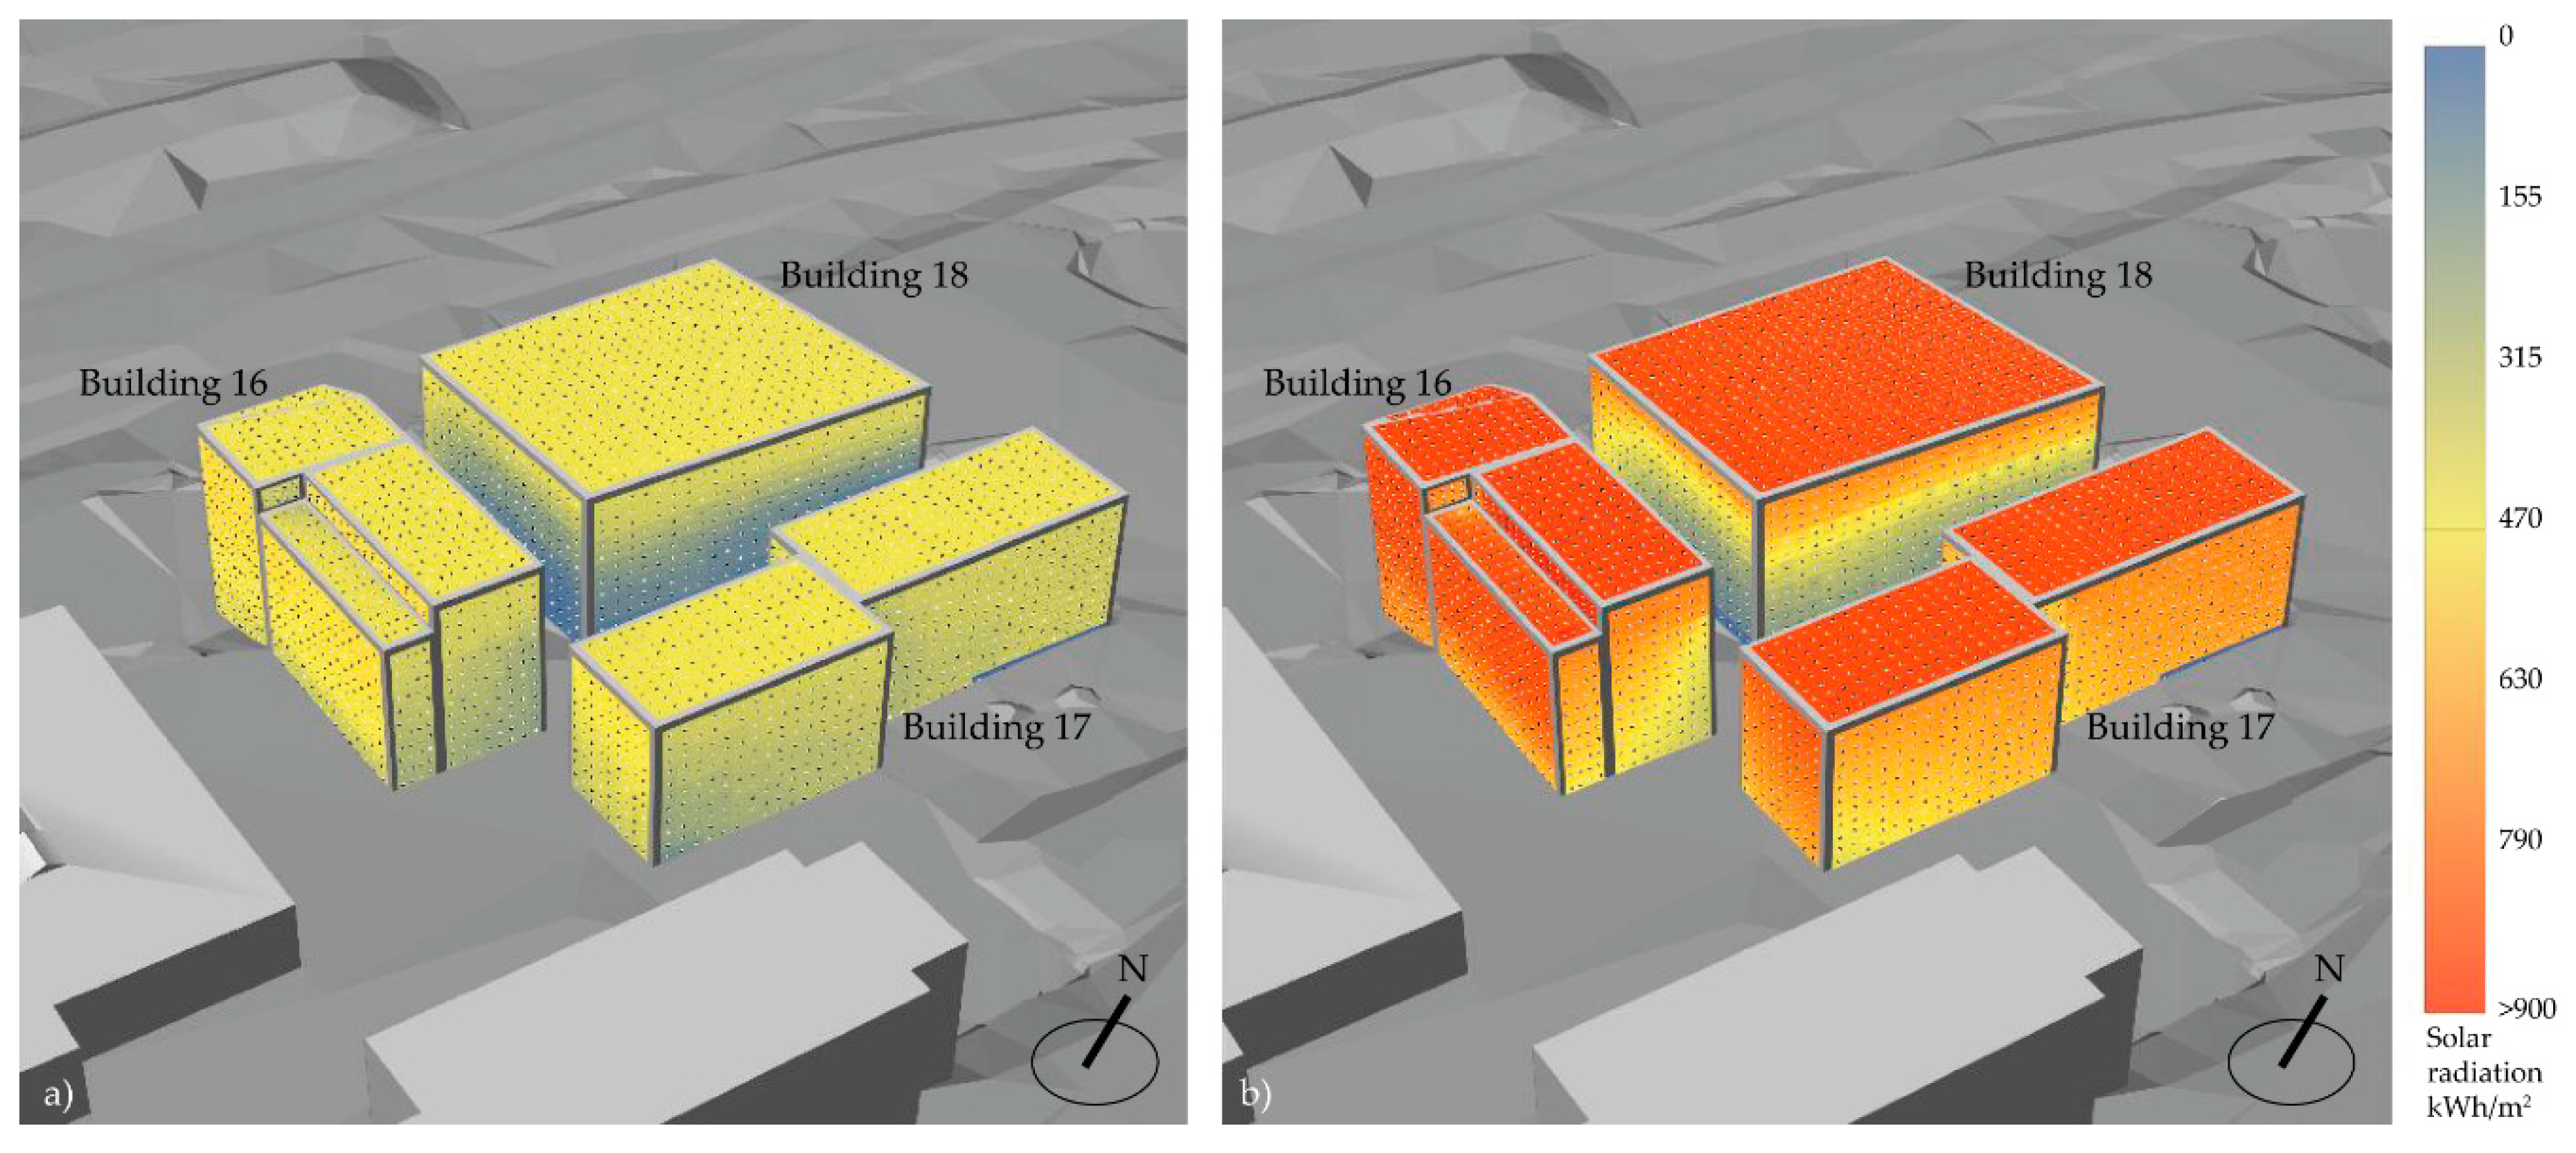
4.3. Step 3 and Step 4—Solar Mapping and Data Processing
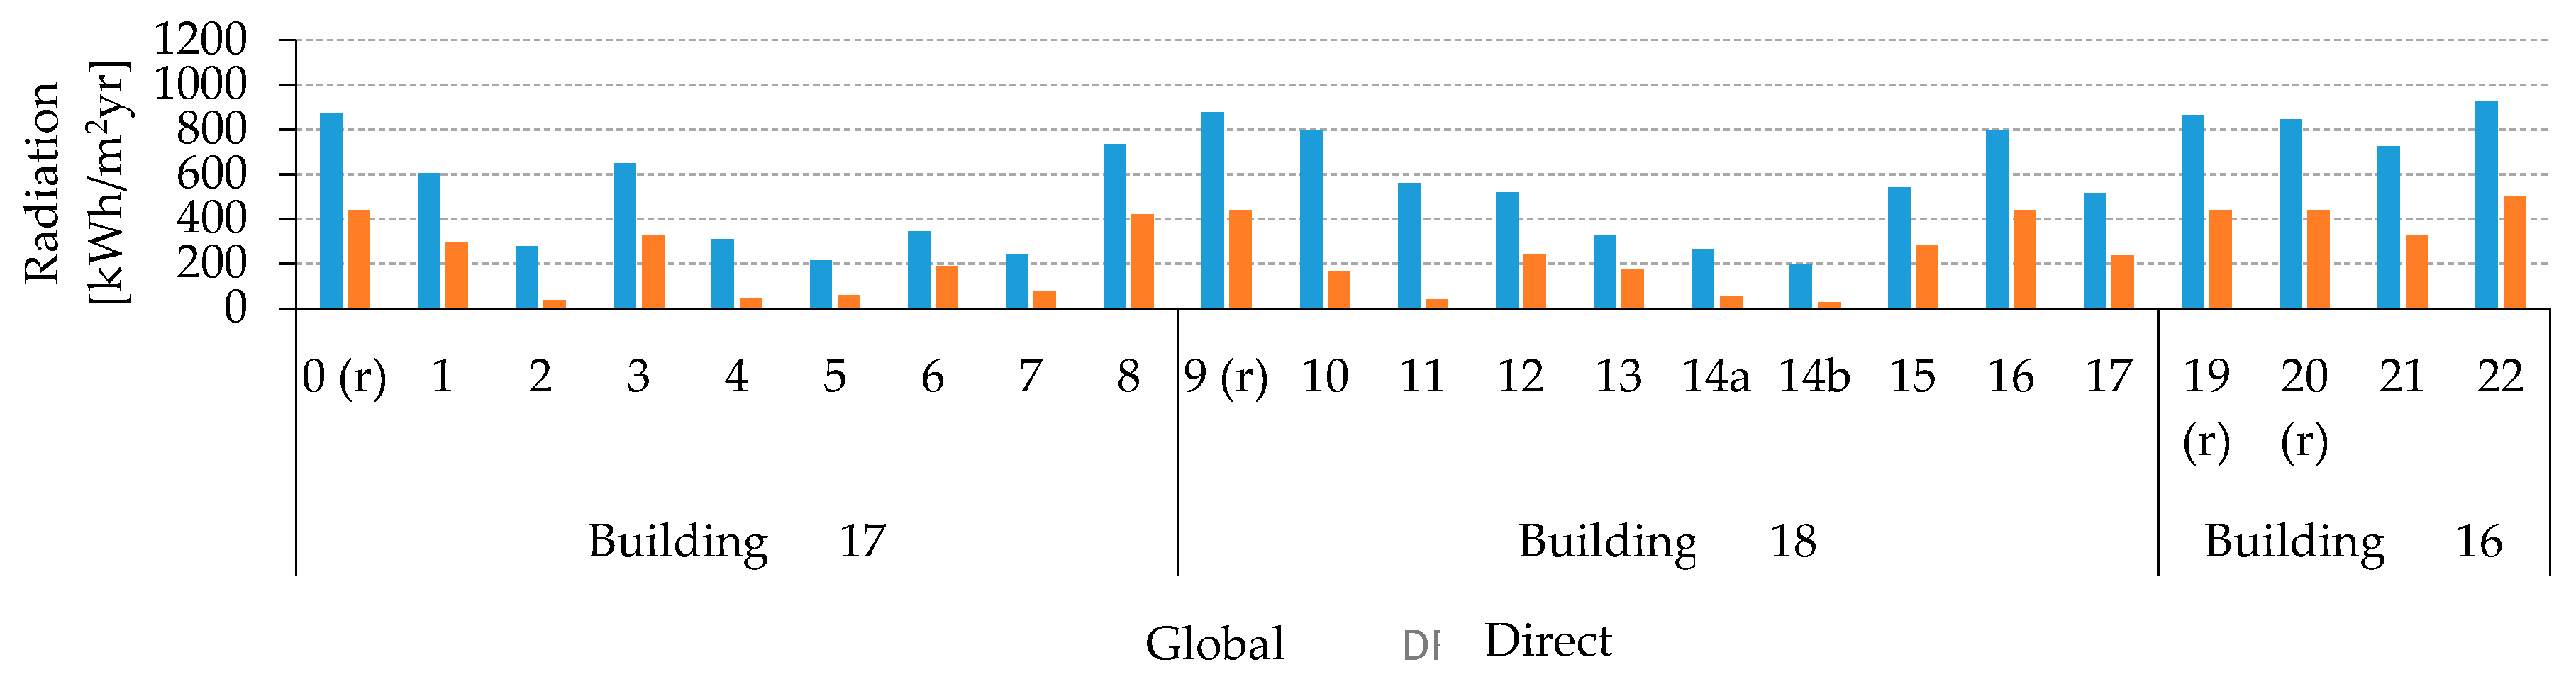
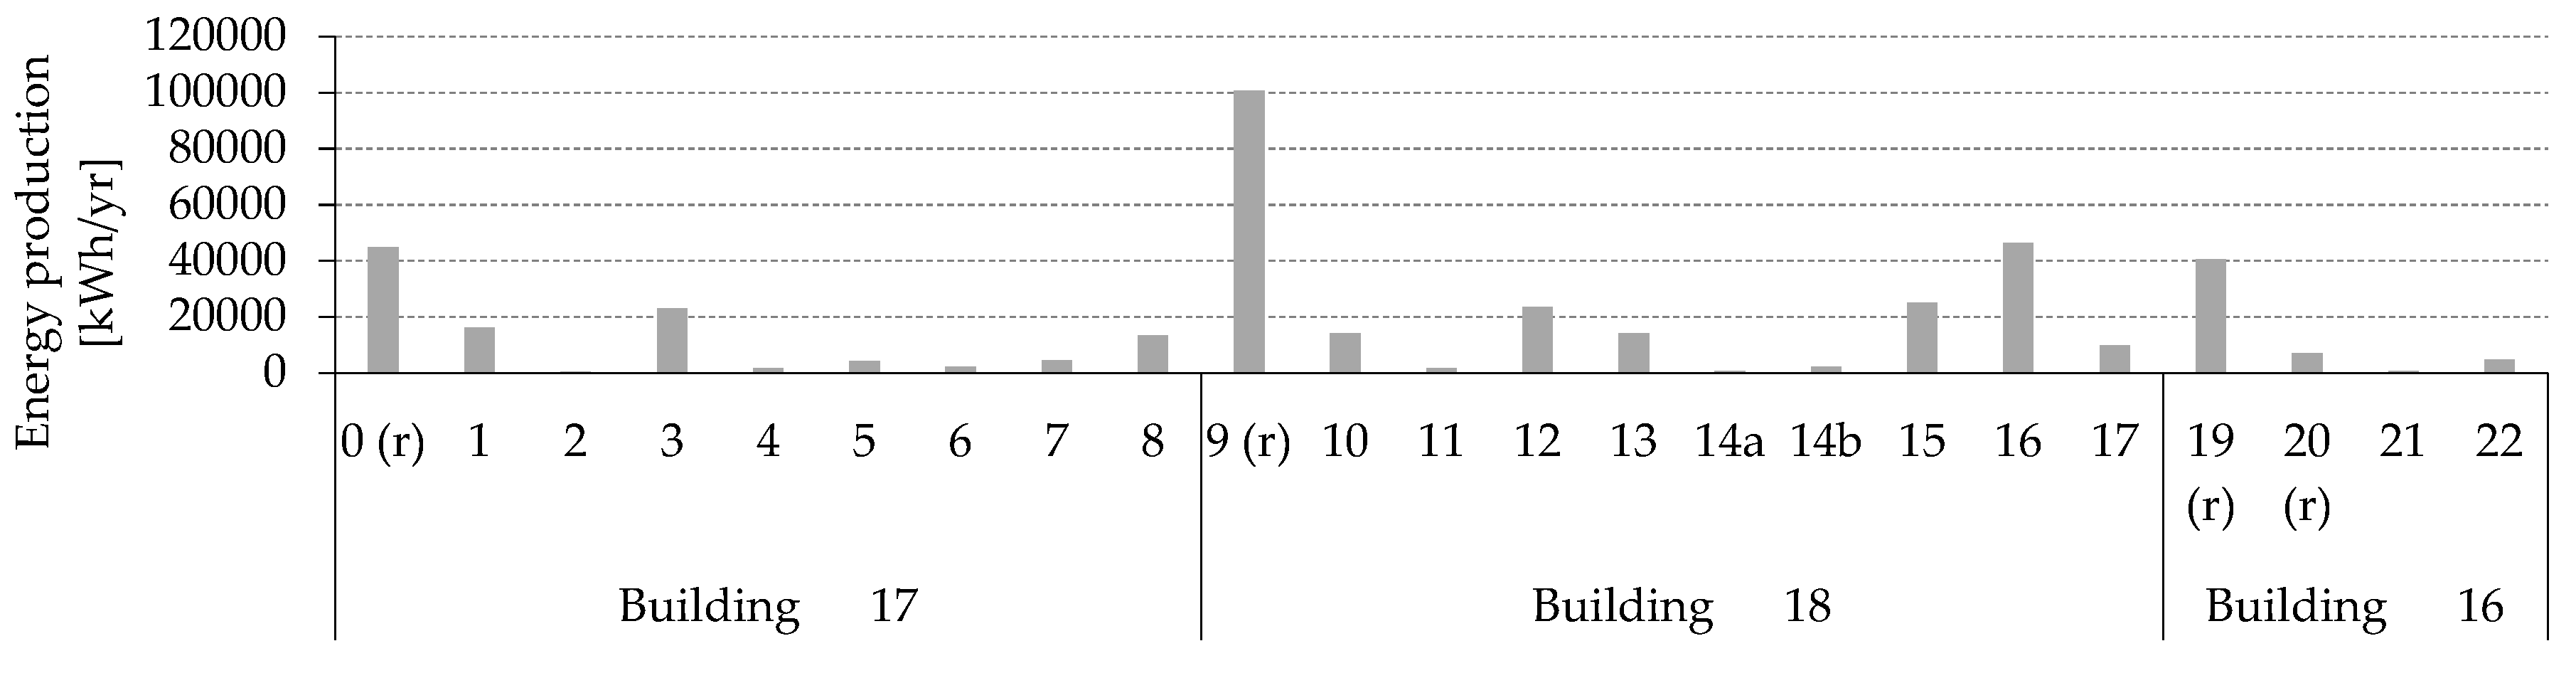
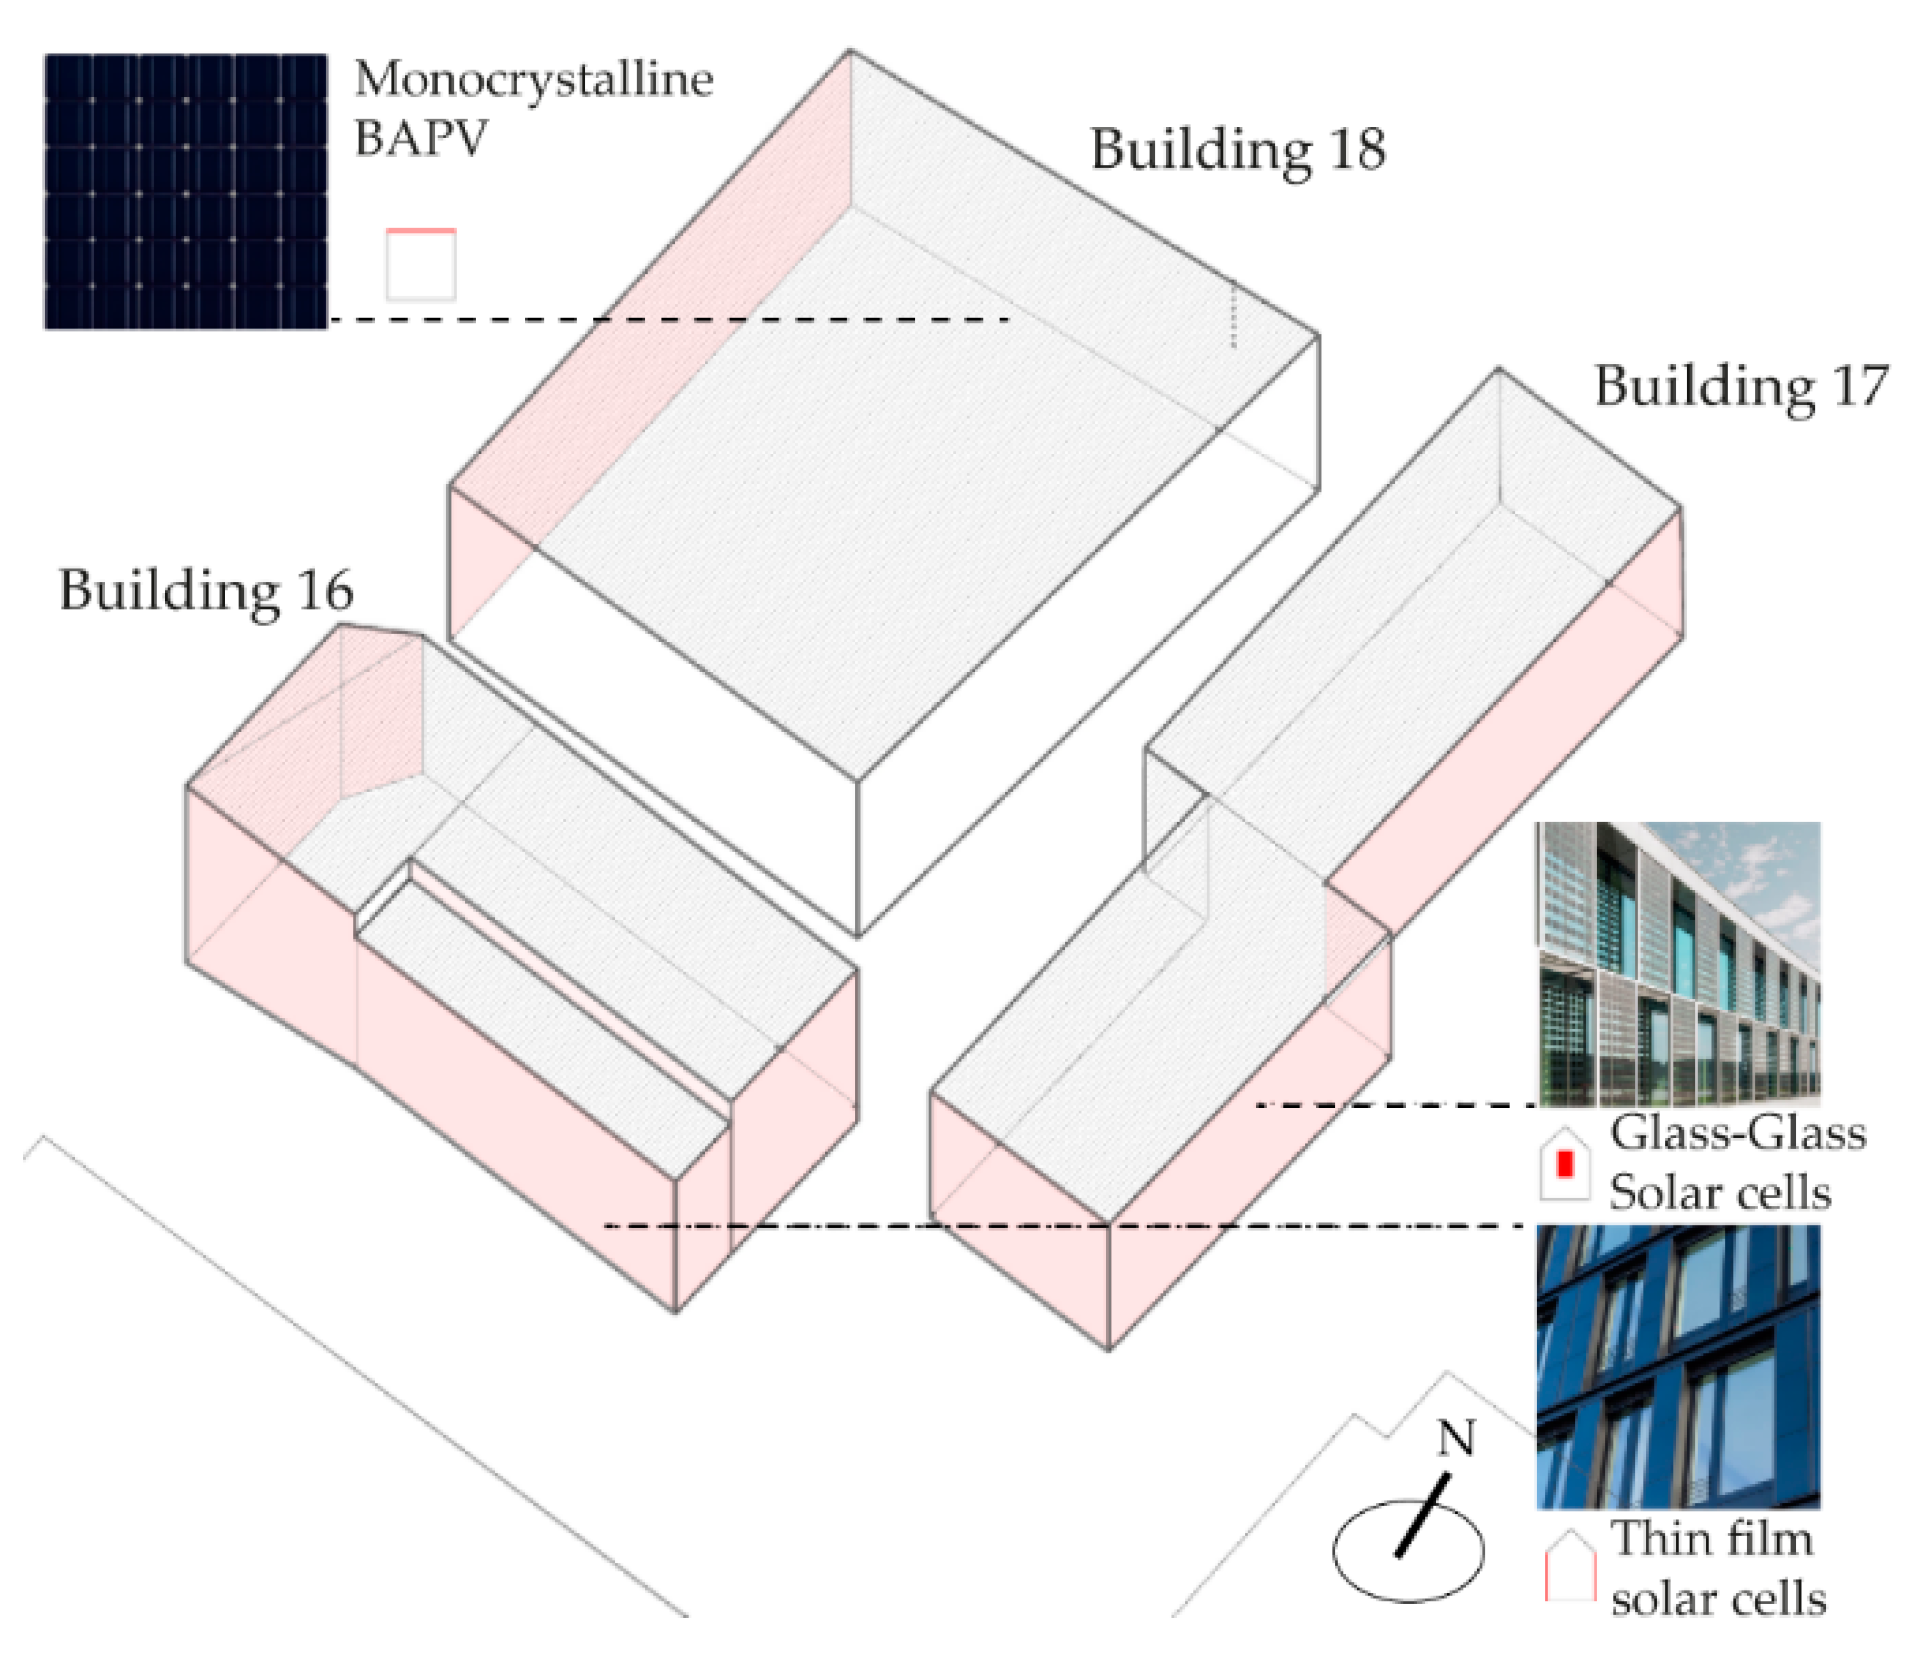
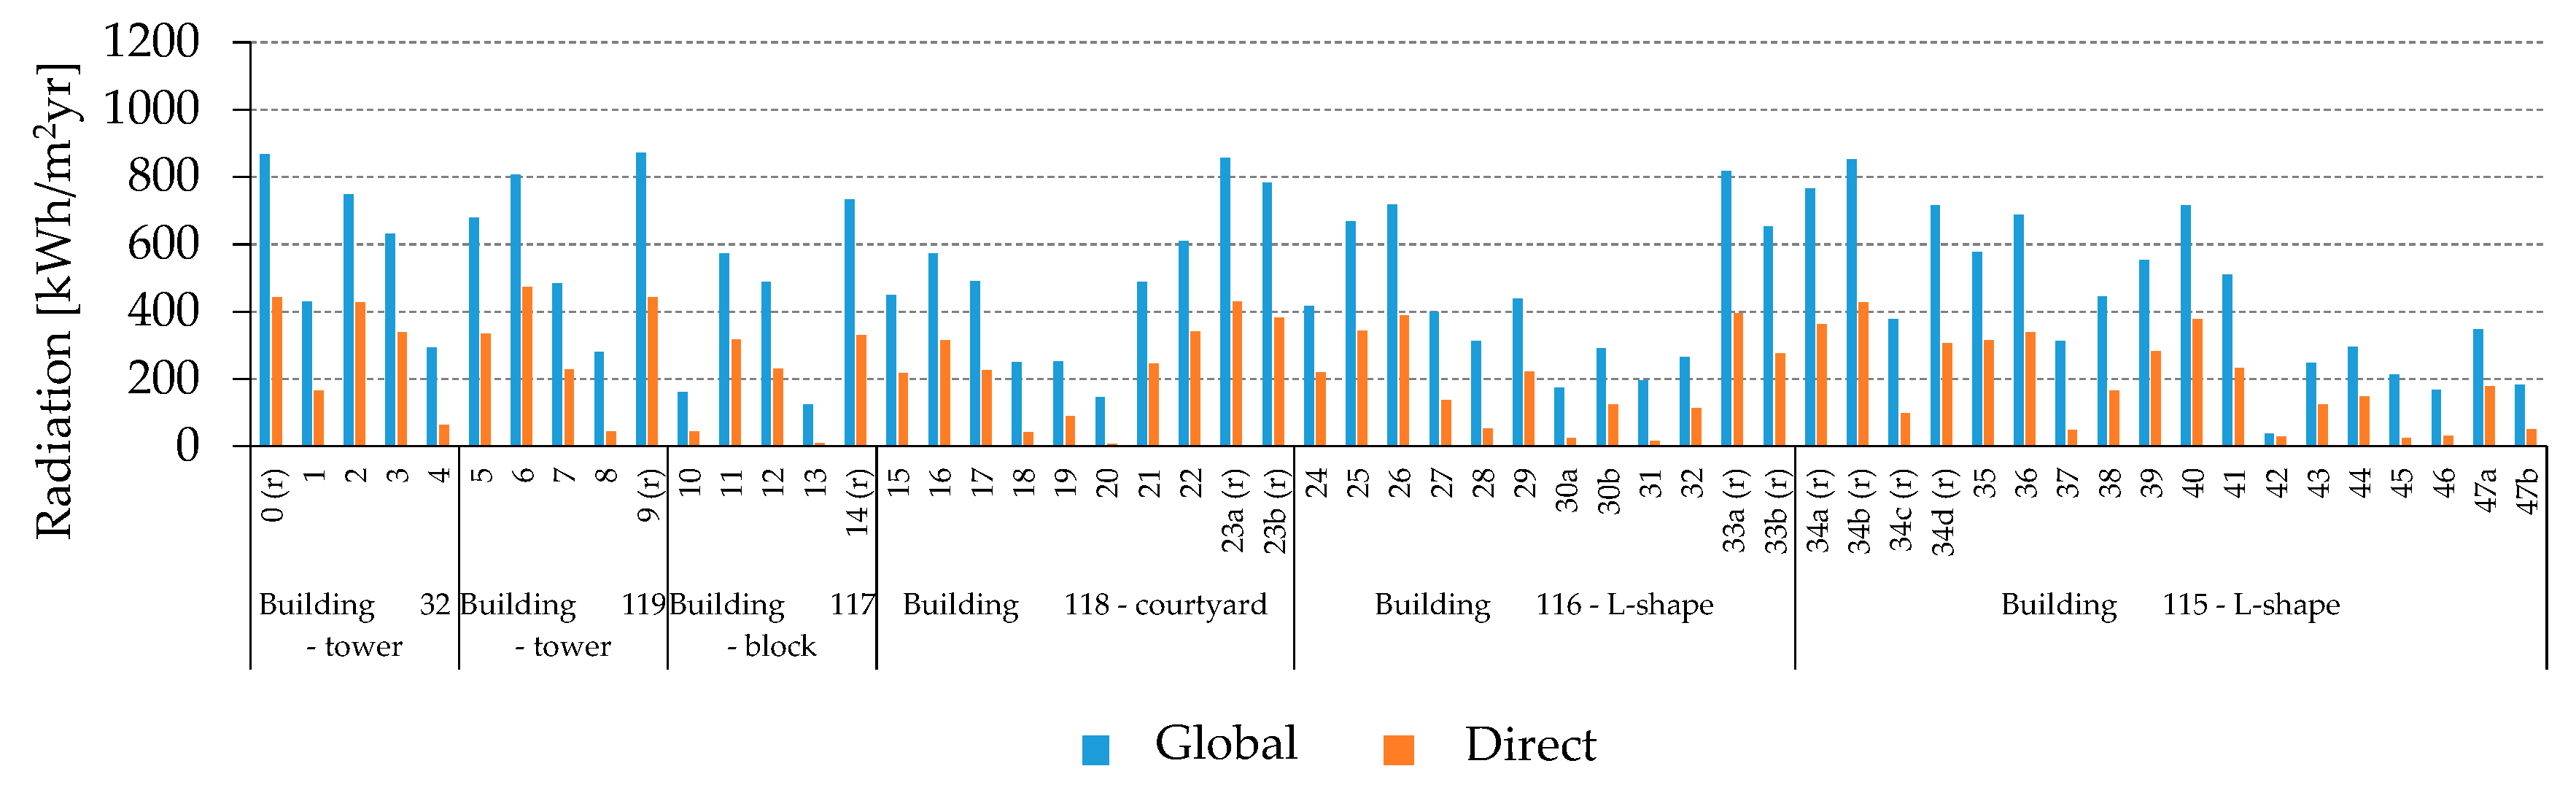
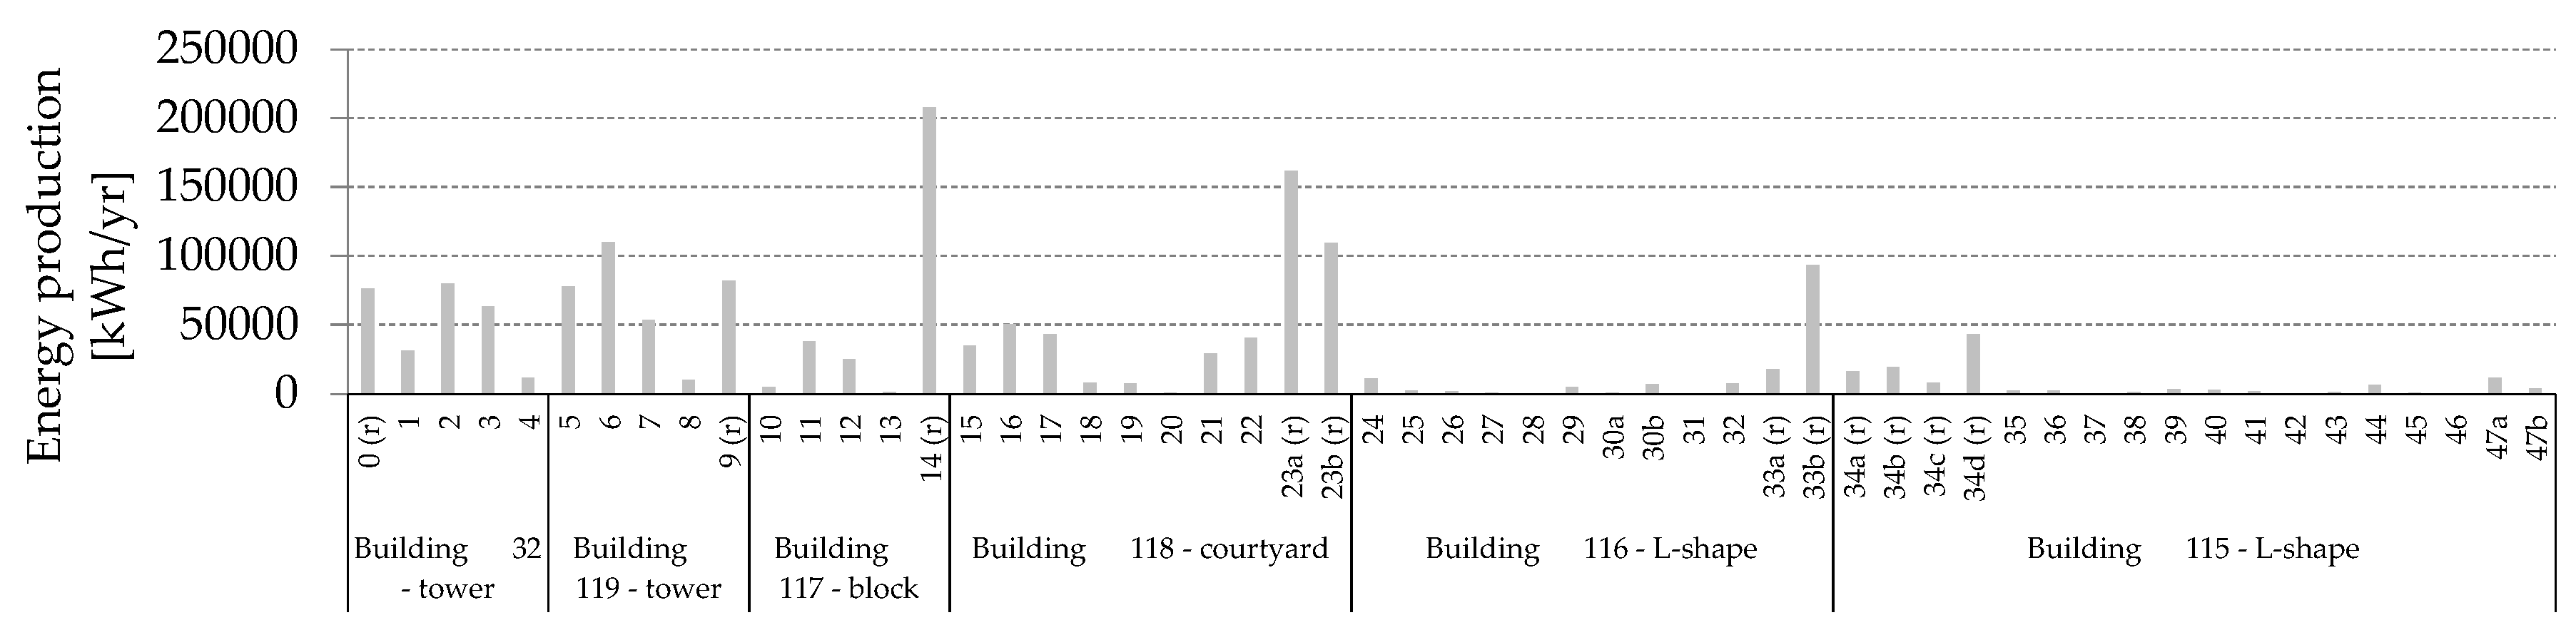
4.4. Step 5 and Step 6—Reduction Factor Application and Solar Potential, Energy Generation Analysis, and Technology Recommendations in Critical Areas
5. Discussion
Limitations of the Study
6. Conclusions and Outlook to Further Work
- High-rise buildings have a high potential for BIPV façade integration, even though in the analyzed scenario the energy coverage by solar systems is quite low. Solar systems for buildings higher than 40 m can cover only up to 12% of the total energy needs.
- High-rise buildings produce significant shading in all seasons (even in the summer, when the sun angle is as high as 60° at Trondheim’s latitude) on the surrounding buildings. High-rise buildings reduce the solar potential of the surrounding buildings by lowering solar energy production potential by 15%. This latter percentage strictly depends on the local urban scenario.
- Low-rise buildings characterized by lower energy demand, such as linear buildings, row houses, and simple blocks with considerable roof area (flat or pitched), are the most suitable building typologies for rooftop PV system installation, with potential energy coverage by solar systems ranging from 26% to 44% depending on the local conditions.
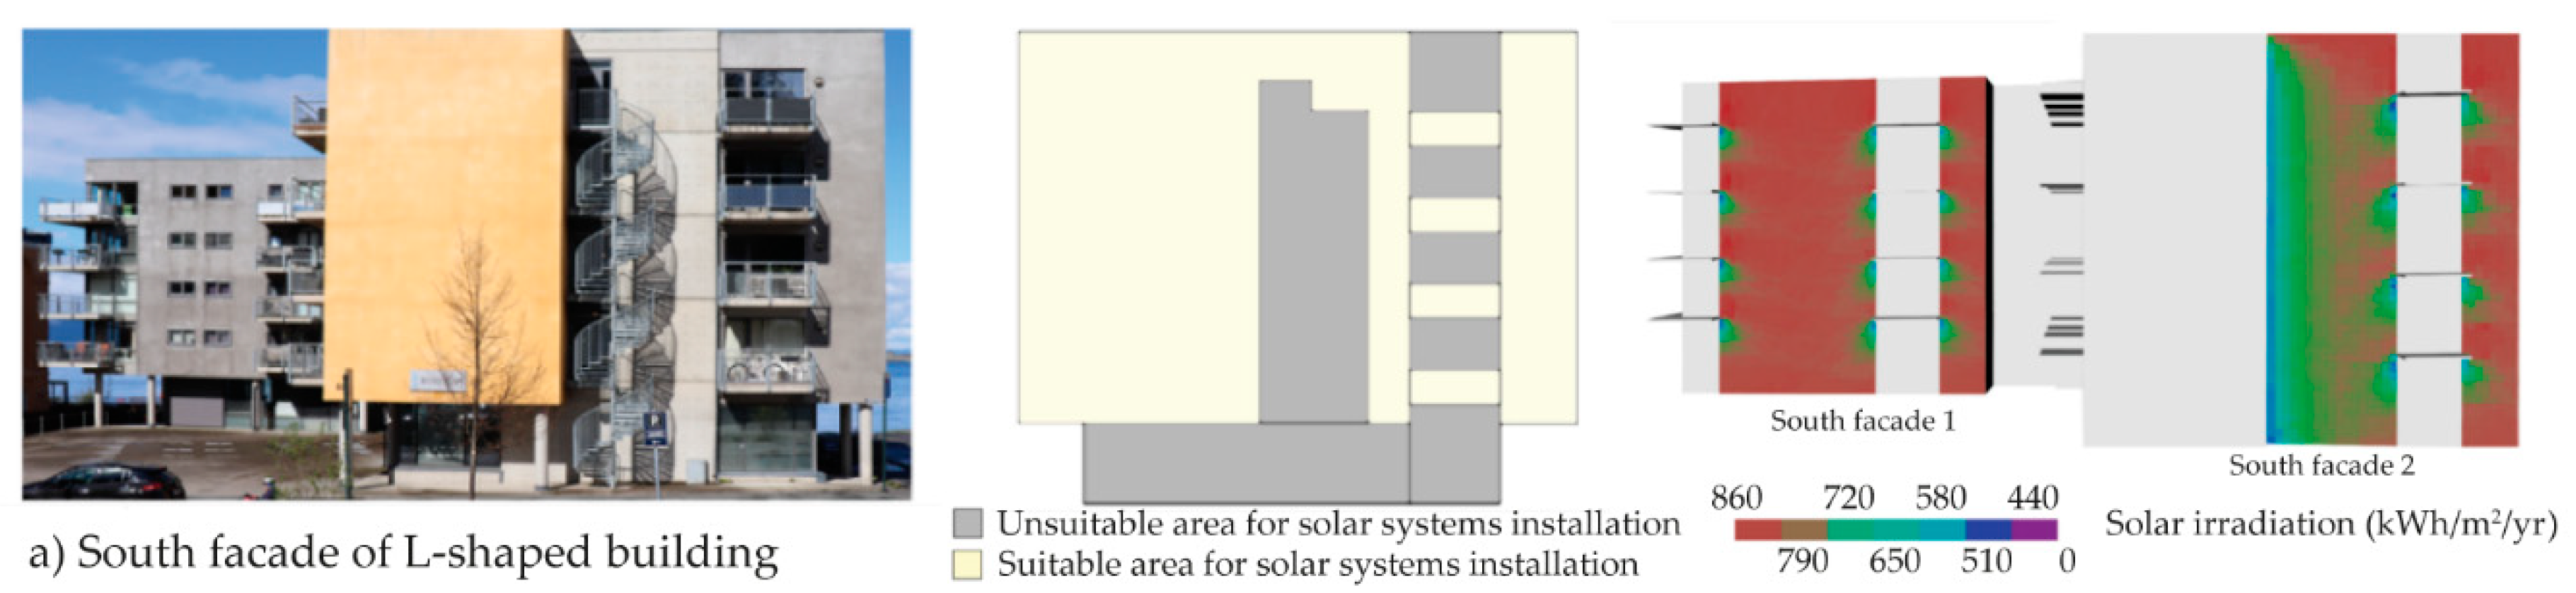
- L-shaped and U-shaped buildings are characterized by low suitability for solar system installation due to shadowing from the surrounding buildings. For those buildings, the energy generation from solar systems can cover up to 11%–14% and 16% of their total energy needs, respectively.
- Provide a support planning decision-making instrument to consider the solar energy integration since in early design stages by identifying the most suitable building surfaces, roofs, and façades for BIPV installations in both new and consolidated urban areas.
- Evaluate and compare the solar potential of different project scenarios.
- Optimize the solar energy potential of projects currently under development by controlling their impact on the solar accessibility of the existing buildings.
- Architects. There is a false myth that among architecture professionals, the implementation of solar energy technologies on buildings compromises their aesthetics and proportions [43]. Solar technologies available today show that there are many ways to integrate solar energy technologies into a building’s exterior, and installing building-added PV systems on roofs is not the only or most effective solution in many cases.
- Urban planners. Urban planners focus their work on designing public spaces, regulating land use in the projects of existing and new neighborhoods. Often solar energy is not a priority, and urban planners do not always have competences to evaluate the design based on the energy performance of PV systems [44]. This study shows how solar potential evaluation can be implemented in the design process.
- City authorities. This methodology can be used as an energy-planning instrument by urban decision makers by localizing the most suitable urban surfaces for solar energy system integration.
- Citizens. Solar maps developed at the city scale can be used as informative tools to showing the buildings’ owners the potential for solar energy generation on the building envelope.
- Evaluation of Life-Cycle Assessment and energy saving in terms of reduction of GHG emissions. Energy generated by solar systems contributes to reducing carbon and energy footprints in built environments [45].
- Potential of ST energy and ST system integration.
- Accessibility of sunlight at the ground level to design more attractive outdoor urban areas.
- Microgrid and storage solutions for solar energy at the neighborhood scale.
- Analysis to maximize the solar potential of a building, ensuring good indoor daylight conditions.
- Develop 3D model applications to visualize and quantify energy production, along with environmental and economic impacts of the PV integration.
- Further studies are required on the influence of solar inter-building and ground reflections on the solar potential and reduction factors. An earlier study conducted for the Øvre Rotvoll neighborhood in Trondheim showed that different finishing materials used on the façades of the buildings and terrain had a significant influence on the solar reflections, which can compensate for losses due to shadowing caused by the surrounding buildings. The presence of snow in combination with light-colored façade finishing materials can improve the solar availability by around 20% [28].
Author Contributions
Funding
Acknowledgments
Conflicts of Interest
References
- Amado, M.; Poggi, F. Solar Energy Integration in Urban Planning: GUUD Model. Energy Procedia 2014, 50, 277–284. [Google Scholar] [CrossRef]
- Beckers, B. Solar Energy at Urban Scale; Wiley-ISTE: New York, NY, USA, 2012. [Google Scholar]
- United Nations, Department of Economic and Social Affairs, Population Division. World Population Prospects: The 2015 Revision, Key Findings and Advance Tables; United Nations: New York, NY, USA, 2015. [Google Scholar]
- Kabir, E.; Kumar, P.; Kumar, S.; Adelodun, A.A.; Kim, K. Solar energy: Potential and future prospects. Renew. Sustain. Energy Rev. 2018, 82, 894–900. [Google Scholar] [CrossRef]
- Lobaccaro, G.; Croce, S.; Lindkvist, C.; Munari Probst, M.; Scognamiglio, A.; Dahlberg, J.L.M.; Wall, M. A cross-country perspective on solar energy in urban planning: Lessons learned from international case studies. Renew. Sustain. Energy Rev. 2019, 108, 209–237. [Google Scholar] [CrossRef]
- Bonomo, P.; Polo López, C.S.; Saretta, E.; Corti, P.; Frontini, F. bFAST: A Methodology for Assessing the Solar Potential of Façades in Existing Building Stocks. In Proceedings of the Conference: ISES EuroSun 2018 Conference—12th International Conference on Solar Energy for Buildings and Industry, Rapperswil, Switzerland, 10–13 September 2018. [Google Scholar]
- Good, C.S.; Lobaccaro, G.; Hårklau, S. Optimization of Solar Energy Potential for Buildings in Urban Areas —A Norwegian Case Study. Energy Procedia 2014, 58, 166–171. [Google Scholar] [CrossRef]
- Hestnes, A.G. Building integration of solar energy systems. Sol. Energy 1999, 67, 181–187. [Google Scholar] [CrossRef]
- Desthieux, G.; Carneiro, C.; Camponovo, R.; Ineichen, P.; Morello, E.; Boulmier, A.; Abdennadher, N.; Dervey, S.; Ellert, C. Solar Energy Potential Assessment on Rooftops and Façades in Large Built Environments Based on LiDAR Data, Image Processing, and Cloud Computing. Methodological Background, Application, and Validation in Geneva (Solar Cadaster). Front. Built Environ. 2018, 4, 14. [Google Scholar] [CrossRef]
- Desthieux, G.; Carneiro, C.; Susini, A.; Abdennadher, N.; Boulmier, A.; Dubois, A.; Camponovo, R.; Beni, D.; Bach, M.; Leverington, P.; et al. Solar cadaster of Geneva: A decision support system for sustainable energy management. In From Science to Society; Otjacques, B., Hitzelberger, P., Naumann, S., Wohlgemuth, V., Eds.; Springer: Cham, Switzerland, 2018; pp. 129–137. [Google Scholar]
- Redweik, P.; Catita, C.; Brito, M. Solar energy potential on roofs and façades in an urban landscape. Sol. Energy 2013, 97, 332–341. [Google Scholar] [CrossRef]
- Saretta, E.; Bonomo, P.; Frontini, F. A Calculation Method for the BIPV Potential of Swiss Façades at LOD2.5 in Urban Areas: A Case from Ticino Region. Sol. Energy 2019. submitted. [Google Scholar]
- IEA SHC Task 51 Solar Energy in Urban Planning. In Approaches, Methods and Tools for Solar Energy in Urban Planning; International Energy Agency: Paris, France, 2018.
- Kanters, J.; Wall, M.; Kjellsson, E. The solar map as a knowledge base for solar energy use. Energy Procedia 2014, 48, 1597–1606. [Google Scholar] [CrossRef]
- Lobaccaro, G.; Frontini, F.; Masera, G.; Poli, T. SolarPW: A new solar design tool to exploit solar potential in existing urban areas. Energy Procedia 2012, 30, 1173–1183. [Google Scholar] [CrossRef]
- Jakubiec, J.; Reinhart, C. A method for predicting city-wide electricity gains from photovoltaic panels based on LiDAR and GIS data combined with hourly Daysim simulations. Sol. Energy 2013, 93, 127–143. [Google Scholar] [CrossRef]
- Freitas, S.; Catita, C.; Redweik, P.; Brito, M. Modelling solar potential in the urban environment: State-of-the-art review. Renew. Sustain. Energy Rev. 2015, 41, 915–931. [Google Scholar] [CrossRef]
- Solcellespesialisten. Solar Map of Norway; Solcellespesialisten: Fredrikstad, Norway, 2019. [Google Scholar]
- Swiss Federal Office of Energy SFOE. Federal Office of Meteorology and Climatology MeteoSwiss. Federal Office of Topography swisstopo, Solar Map of Switzerland. Available online: https://www.uvek-gis.admin.ch/BFE/sonnenfassade/index.html?lang=en (accessed on 8 August 2019).
- Klauser, D. Suitability of Roofs for Use of Solar Energy/Solarpotentialanalyse Für Sonnendach.ch. Schlussbericht; Meteotest for Swiss Federal Office of Energy: Bern, Switzerland, 2016. [Google Scholar]
- Meteorologisk Institutt. Værvarsel for Trondheim. 2018. Available online: https://www.yr.no/sted/Norge/Tr%C3%B8ndelag/Trondheim/Trondheim/ (accessed on 8 August 2019).
- Nilsen, J. Ville kle Bygget Med Grønne Solceller—Endte Opp Med Helt ny Teknologi. 2015. Available online: https://www.tu.no/artikler/ville-kle-bygget-med-gronne-solceller-endte-opp-med-helt-ny-teknologi/275882 (accessed on 8 August 2019).
- Solenergi FUSen. Referanseprosjekter fra Solenergi FUSen. 2019. Available online: https://www.fusen.no/prosjekter (accessed on 8 August 2019).
- Johanessen, T. Verdens Nordligste Plusshus Åpner Dørene. 2019. Available online: https://www.tu.no/artikler/verdens-nordligste-plusshus-apner-dorene/458951 (accessed on 8 August 2019).
- Hegli, T. Presentasjon av Skisser. Powerhouse-Alliansens to Første Prosjekter. 2012. Available online: http://www.zeb.no/index.php/en/conference/item/413-presentasjon-av-skisser-powerhouse-alliansens-to-f%C3%B8rste-prosjekter (accessed on 8 August 2019).
- Fufa, S.; Andresen, I.; Schlanbusch, R.D.; Kjendseth Wiik, M.; Sørnes, K. A Norwegian ZEB Definition Guideline; SINTEF Academic Press: Oslo, Norway, 2016. [Google Scholar]
- Multiconsult and Asplan Viak. Solcellesystemer Og Sol i Systemet; Solenergiklyngen: Kjeller, Norway, 2018. [Google Scholar]
- Lobaccaro, G.; Carlucci, S.; Croce, S.; Paparella, R.; Finocchiaro, L. Boosting solar accessibility and potential of urban districts in the Nordic climate: A case study in Trondheim. Sol. Energy 2017, 149, 347–369. [Google Scholar] [CrossRef]
- Jones, A.D.; Underwood, C.P. A thermal model for photovoltaic systems. Sol. Energy 2001, 70, 349–359. [Google Scholar] [CrossRef]
- Miljøverndepartementet. Nasjonale Forventninger til Regional og Kommunal Planlegging. Available online: https://www.regjeringen.no/no/dokumenter/nasjonale-forventninger-til-regional-og-/id649919/ (accessed on 8 August 2019).
- Trondheim Kommune. Kommunedelplan: Energi og Klima 2017–2030; Trondheim Kommune: Trondheim, Norway, 2017. [Google Scholar]
- FME Zero Emission Neighborhoods in Smart Cities. ZEN Pilot Projects. Available online: https://fmezen.no/knowledge-axis-trondheim/ (accessed on 8 August 2019).
- Trondheim Kommune. Kommunedelplan for Sluppen—Mulighetsstudie Sluppen 2050. Available online: https://sites.google.com/trondheim.kommune.no/kdpsluppen/mulighetsstudiet-sluppen-2050 (accessed on 8 August 2019).
- Direktoriat for Byggkvalitet. Byggteknisk Forskrift (TEK17). 2017. Available online: https://www.regjeringen.no/contentassets/20503ddfe0664fac9e2185c1a6c80716/veiledning-til-byggteknisk-forskrift-tek17_01_07_2017_oppdatert_15_09_2017.pdf (accessed on 8 August 2019).
- Fath, K.; Kuhn, T.E.; Schultmann, F.; Sprenger, W.; Stengel, J. A method for predicting the economic potential of (building-integrated) photovoltaics in urban areas based on hourly Radiance simulations. Sol. Energy 2015, 116, 357–370. [Google Scholar] [CrossRef]
- Kanters, J.; Horvat, M. Solar energy as a design parameter in urban planning. Energy Procedia 2012, 30, 1143–1152. [Google Scholar] [CrossRef]
- IEA SHC Task 41 Solar Energy and Architecture. T.41.A.2: Solar Energy Systems in Architecture—Integration Criteria and Guidelines. 2013. Available online: http://task41.iea-shc.org/Data/Sites/1/publications/T41DA2-Solar-Energy-Systems-in-Architecture-28March2013.pdf (accessed on 8 August 2019).
- Saretta, E.; Bonomo, P.; Frontini, F. Active BIPV Glass Façades: Current Trends of Innovation. In Proceedings of the Glass Performance Days 2017, Tampere, Finland, 28–30 June 2017. [Google Scholar]
- EPFL—École Polytechnique Fédérale de Lausanne. EPFL’s Campus has the World’s First Solar Window. Available online: https://actu.epfl.ch/news/epfl-s-campus-has-the-world-s-first-solar-window/ (accessed on 8 August 2019).
- Krippner, R. Building-Integrated Solar Technology: Architectural Design with Photovoltaics and Solar Thermal Energy; DETAIL: München, Germany, 2017. [Google Scholar]
- Lobaccaro, G.; Croce, S.; Vettorato, D.; Carlucci, S. A holistic approach to assess the exploitation of renewable energy sources for design interventions in the early design phases. Energy Build. 2018, 175, 235–256. [Google Scholar] [CrossRef]
- Probst, M.C.M.; Roecker, C. Criteria and policies to master the visual impact of solar systems in urban environments: The LESO-QSV method. Sol. Energy 2019, 184, 672–687. [Google Scholar] [CrossRef]
- Dunay, R.; Schubert, R.; Wheeler, J. No Compromise: The Integration of Technology and Aesthetics. J. Archit. Educ. 2016, 60, 8–17. [Google Scholar] [CrossRef]
- Kanters, J.; Wall, M. Experiences from the urban planning process of a solar neighbourhood in Malmö, Sweden. UrbanPlan. Transp. Res. 2018, 6, 54–80. [Google Scholar] [CrossRef]
- Tiantian, Z.; Meng, W.; Hongxing, Y. A Review of the Energy Performance and Life-Cycle Assessment of Building-Integrated Photovoltaic (BIPV) System. Energies 2018, 11, 3157. [Google Scholar]


| Area | Nr | City/Country | Analyzed Building Envelope Elements | Solar System | Module Efficiency/Energy Output | Categories | Solar Irradiation Ranges (kWh/m2/year) | Base for Categories |
|---|---|---|---|---|---|---|---|---|
| North Europe | 1 | Norway | Roofs | PV | PV: 16%/Yes | Unsuitable Suitable Very suitable | N/A | Solar irradiation, roof geometry |
| 2 | Stockholm, Sweden | Roofs | PV/ST | PV: 14%/Yes ST: 50%/Yes | Hesitant Promising Excellent | <950 950–1000 >1000 | Solar irradiation, roof geometry | |
| 3 | Copenhagen, Denmark | Roofs | N/A | N/A | Not good Reasonable Good Very good | N/A | Solar irradiation | |
| Central Europe | 4 | Berlin, Germany | Roofs | PV | 12%/Yes | Reasonable Good Very good | <920 920–1035 1035–1093 | N/A |
| 5 | Bristol, United Kingdom | Roofs | PV | N/A/Yes | Reasonable Good Very good | <950 950–1000 >1000 | Solar irradiation | |
| 6 | Vienna, Austria | Roofs | PV/ST | PV: 14%/Yes ST: 90%/Yes | Good Very good | 900 < 1200 >1200 | Solar irradiation | |
| 7 | Switzerland | Roofs | PV/ST | PV: 17%/Yes (PV both for façades and roofs) ST: varies based on statistical data | Low Medium High Very high Excellent | <800 800–1000 1000–1200 1200–1400 >1400 | Solar irradiation, roof geometry | |
| Façades | Low Medium High Very high Excellent | <600 600–800 800–1000 1000–1200 >1200 | ||||||
| 8 | Genève, Switzerland | PV/ST | N/A | Favorable Very favorable | <1200 >1200 | Solar irradiation, roof geometry | ||
| 9 | Lyon, France | Roofs | PV | PV: 15.5%/Yes | Bad Low Average Very good Good Excellent | <350 350–650 650–850 850–1100 1100–1250 1250–1344 | Solar irradiation, roof geometry | |
| 10 | Annecy, France | Roofs | PV | PV: 15.5%/Yes | Bad Fair Way Good Very good Excellent | <1093 1093–1166 1166–1238 1238–1311 1311–1384 >1384 | Solar irradiation | |
| 11 | Bordeaux, France | Roofs | PV | N/A | Fair Good Excellent | 1080–1230 1230–1390 1390–1540 | Solar irradiation | |
| South Europe | 12 | Bolzano | Roofs | PV | Cadmium telluride photovoltaics and poly crystalline silicon/Yes | NA | <800 800–1000 1000–1200 >1200 | Solar irradiation, roof geometry |
| 13 | Bologna, Italy | Roofs | PV/ST | N/A | Low Average Very good Good Excellent | <500 500–800 800–1100 1100–1400 >1400 | Solar irradiation | |
| 14 | Lisbon, Portugal | Roofs | N/A | N/A | Class I Class II Class III Class IV | <1000 1000–1400 1400–1600 >1600 | Direct solar irradiation, roof geometry | |
| 15 | Vitoria-Gasteiz, Portugal | Roofs | N/A | N/A | Class A Class B Class C Class D Class E Class F Class G | 0–5% 5–10% 10–20% 20–30% 30–40% 40–50% >50% | Solar potential |
| Type of Analysis | Description | Categories |
|---|---|---|
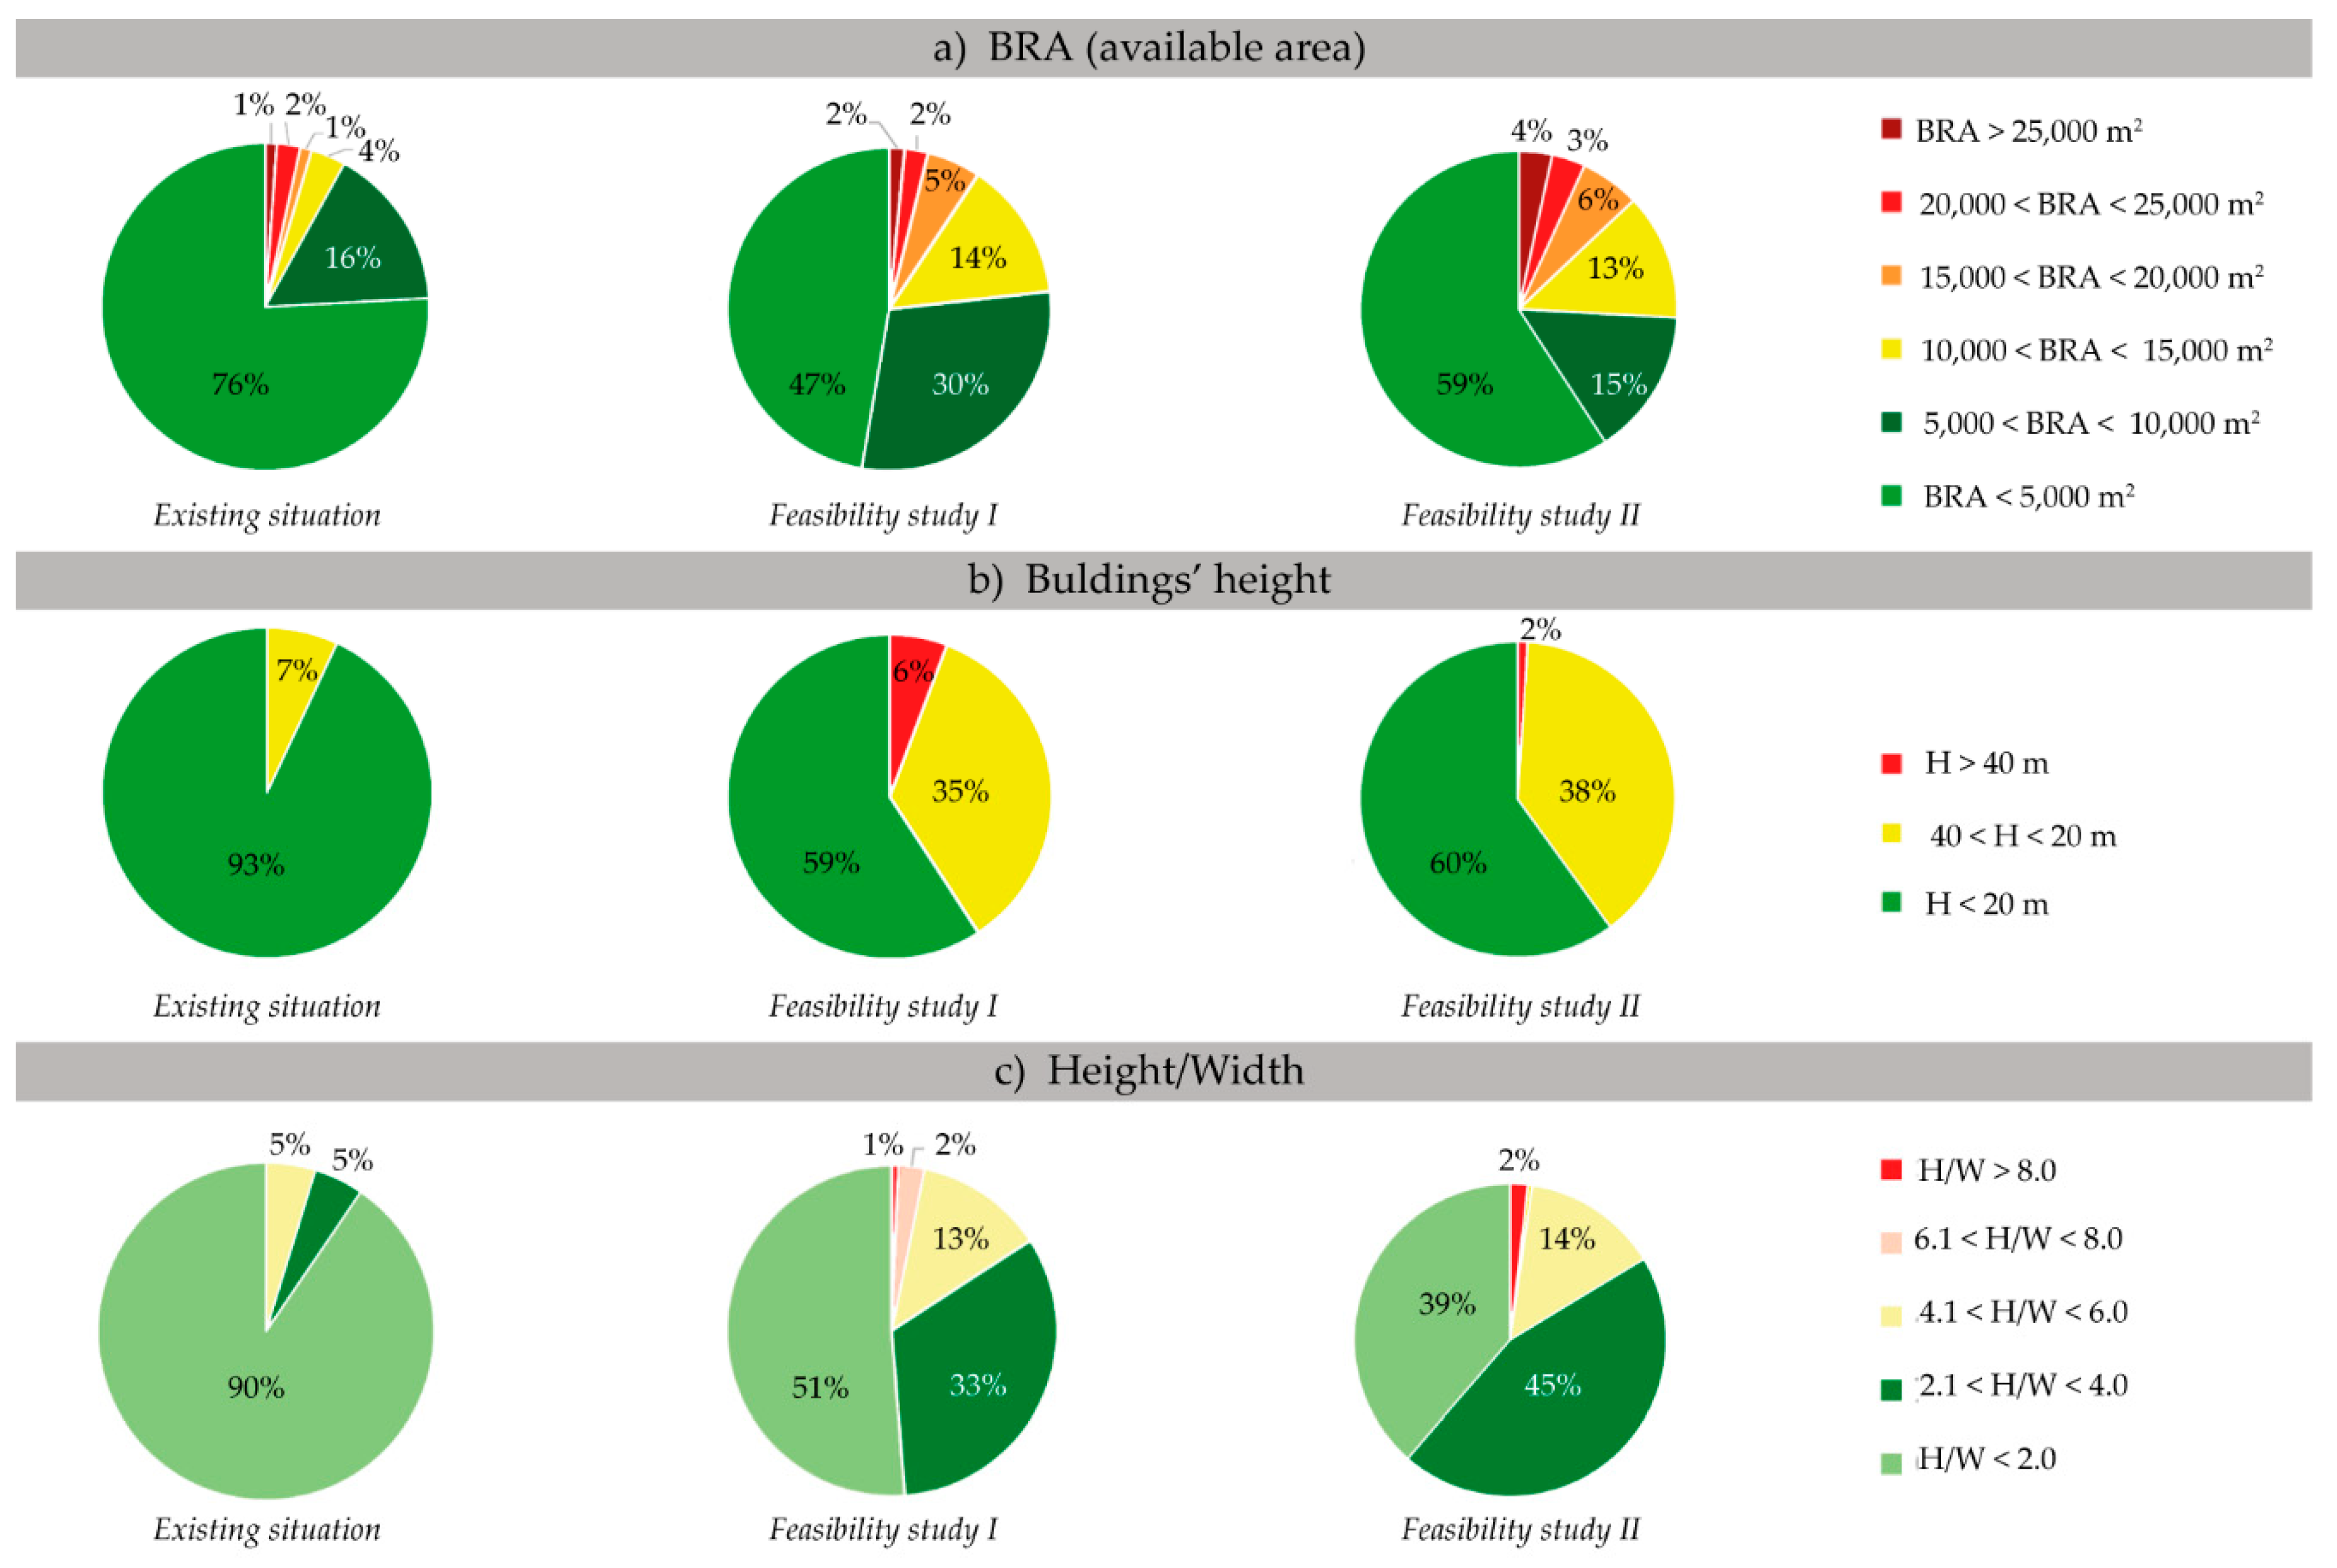
| Analysis of BRA * | Determines the building density in urban areas in Norway [34]. | very low (0–5000 m2) low (5000–10,000 m2) medium (10,000–15,000 m2) medium-high (15,000–20,000 m2) high (20,000–25,000 m2) very high (> 25,000 m2) |
| Analysis of building heights | Analyzes the height of the building in the district area. | low (0 < H < 20 m), medium (20 < H < 40 m) high (H > 40 m). |
| Analysis of height/width | Takes into account the aspect ratio between heights (H) of the building and the distance (W) between them. | very low (0.0 < H/W < 2.0) low (2.0 < H/W < 4.0) medium (4.0 < H/W < 6.0) high (6.0 < H/W < 8.0) very high (H/W > 8.0) |
| Analysis of roof types | Analyzes the morphology of the roofs. | flat and pitched roofs |
| Analysis of shading | The analysis, run in Ladybug for Grasshopper, presents the seasonal variations of the buildings’ shading. | solstices and equinoxes |
| ab | ad | as | ar | aa |
|---|---|---|---|---|
| 0–3 | 1000 | 20 | 300 | 0.1 |
| Surface | R | G | B | SP | RG | Analysis Period (Start dd.mm–End dd.mm) |
|---|---|---|---|---|---|---|
| Façade | 0.35 | 0.35 | 0.35 | 0.00 | 0.00 | 01.01–31.12 |
| Roof | 0.35 | 0.35 | 0.35 | 0.00 | 0.00 | 01.01–31.12 |
| Ground (Asphalt) | 0.20 | 0.20 | 0.20 | 0.00 | 0.00 | 21.03–20.12 |
| Ground (snow) | 0.90 | 0.90 | 0.90 | 0.00 | 0.00 | 21.12–20.03 |
| Type of Analysis | Analyzed Surfaces | Analyzed Parameters | Outcomes |
|---|---|---|---|
| Surface area calculations | Roofs and façades | Orientation | Orientation of the roofs and façades of the buildings in the whole district |
| Solar potential | Solar potential of the whole district | ||
| Façades | Orientation, H/W ratio, solar potential | Influence of the H/W ratio and orientation on solar potential | |
| Orientation of the façades, height of the building, solar potential of the façades | Influence of the height of the buildings and orientation of the façades on solar potential |
| Indicator | Aspects Considered by Indicator | Equation |
|---|---|---|
| IR1 | Presence of windows. | |
| IR2 | Presence of balconies. | |
| IR3 | Shading of balconies. | |
| IR4 | Self-shading by other elements of the buildings. | |
| IR5 | Presence of external elements of the building, for example, staircases. |
| Importance | Category | Criteria | Explanation |
|---|---|---|---|
| Primary | Year of construction | 2000 or later | Majority of buildings in Sluppen are new, therefore buildings of no more than 20 years old are taken into consideration. |
| Secondary | Location |
| Design of new buildings can be inspired by structures in new neighborhoods. Ilsvika district in Trondheim is chosen due to the presence of various building typologies (U-shaped buildings, L-shaped buildings, linear and row houses). |
| Façade | Sgr (m2) | IR1 | IR2 | IR3 | IR4 | IR5 | Total | SBIPV (m2) |
|---|---|---|---|---|---|---|---|---|
| Façade West 1 | 264 | 81% | 70% | 71% | 64% | - | 26% | 68 |
| Façade West 2 | 440 | 80% | 60% | - | 84% | 73% | 30% | 132 |
| Façade South 1 | 277 | 85% | 71% | - | 100% | 76% | 46% | 127 |
| Façade South 2 | 267 | 67% | 37% | - | 100% | - | 25% | 66 |
| Façade North | 612 | 81% | 70% | - | - | - | 54% | 328 |
| Façade East | 640 | 88% | 62% | 51% | - | 98% | 27% | 174 |
| Average | 2500 | 80% | 62% | 61% | 87% | 83% | 22% | 537 |
| Building Type | Building Morphology | IR1 | IR2 | IR3 | IR4 | IR5 | Total |
|---|---|---|---|---|---|---|---|
| Residential | L-shaped building | 80% | 62% | 61% | 89% | 80% | 22% |
| Row house | 56% | 83% | - | - | - | 47% | |
| U-shaped building | 77% | 64% | - | 94% | - | 46% | |
| Linear building | 83% | 77% | - | - | 83% | 53% | |
| Office | Mid-rise | 52% | - | - | - | - | 52% |
| High rise | 47% | - | - | - | - | 47% |
| Solar Irradiation Component | Grid Size | ab | Metric | Outcomes |
|---|---|---|---|---|
| Direct irradiation | 2 m × 2 m | 0 | Dayism-based hourly method | Produces an hourly result file (.ill) and time-cumulative irradiation rendering |
| Direct, diffuse irradiation and solar inter-building and ground reflections | 2 m × 2 m | 3 | Cumulative sky method | Creates a cumulative sky Radiance distribution |
| Building Category | Delivered Energy per Heated Floor Area (BRA) (kWh/m2) | ||||||
|---|---|---|---|---|---|---|---|
| Class A | Class B | Class C | Class D | Class E | Class F | Class G | |
| Row houses | 95 + 800/A | 120 + 1600/A | 145 + 2500/A | 175 + 4100/A | 205 + 5800/A | 250 + 8000/A | >F |
| Apartment in block | 85 + 600/A | 95 + 1000/A | 110 + 1500/A | 135 + 2200/A | 160 + 3000/A | 200 + 4000/A | >F |
| Kindergarten | 85 | 115 | 145 | 180 | 220 | 275 | >F |
| Office | 90 | 115 | 145 | 180 | 220 | 275 | >F |
| School | 75 | 105 | 135 | 175 | 220 | 280 | >F |
| University | 90 | 125 | 160 | 200 | 240 | 300 | >F |
| Hospital | 175 | 240 | 305 | 360 | 415 | 505 | >F |
| Hotel | 140 | 190 | 240 | 290 | 340 | 415 | >F |
| Sport facility | 125 | 165 | 205 | 275 | 345 | 440 | >F |
| Analysis Period (Start dd.mm–End dd.mm)/Season | Average Solar Irradiation (kWh/m2year) | Surfaces of the Building Envelope with Highest Solar Potential | ||||
|---|---|---|---|---|---|---|
| Existing | Feasibility Study I | Feasibility Study II | Existing | Feasibility Study I | Feasibility Study II | |
| 21.03–20.06/spring | 384 | 385 | 347 | roofs | roofs | roofs |
| 21.06–20.09/summer | 347 | 347 | 333 | roofs | roofs | roofs |
| 21.09–20.12/autumn | 58 | 58 | 62 | façades | façades | façades |
| 21.12–20.03/winter | 58 | 66 | 70 | façades | façades | façades |
| Building Type | Building No. | BRA (m2) | Total Energy Needs (kWh/year) | Solar Irradiation Potential Coverage—Façades and Roofs (kWh/year) | Solar Energy Potential Coverage—Windows (kWh/year) | Energy Coverage Estimation by PV |
|---|---|---|---|---|---|---|
| Office | 32—tower | 27,000 | 2,430,000 | 262,038 | 39,468 | 12% |
| 119—tower | 52,900 | 4,761,000 | 332,219 | 53,143 | 8% | |
| 117—block | 7215 | 649,350 | 276,562 | 11,967 | 44% | |
| Residential | 118—courtyard | 37,307 | 3,171,095 | 484,735 | 20,150 | 16% |
| 116—L-shape | 16,034 | 1,362,890 | 146,989 | 6199 | 11% | |
| 115—L-shape | 11,810 | 1,003,808 | 138,636 | 4927 | 14% |
© 2019 by the authors. Licensee MDPI, Basel, Switzerland. This article is an open access article distributed under the terms and conditions of the Creative Commons Attribution (CC BY) license (http://creativecommons.org/licenses/by/4.0/).
Share and Cite
Lobaccaro, G.; Lisowska, M.M.; Saretta, E.; Bonomo, P.; Frontini, F. A Methodological Analysis Approach to Assess Solar Energy Potential at the Neighborhood Scale. Energies 2019, 12, 3554. https://doi.org/10.3390/en12183554
Lobaccaro G, Lisowska MM, Saretta E, Bonomo P, Frontini F. A Methodological Analysis Approach to Assess Solar Energy Potential at the Neighborhood Scale. Energies. 2019; 12(18):3554. https://doi.org/10.3390/en12183554
Chicago/Turabian StyleLobaccaro, Gabriele, Malgorzata Maria Lisowska, Erika Saretta, Pierluigi Bonomo, and Francesco Frontini. 2019. "A Methodological Analysis Approach to Assess Solar Energy Potential at the Neighborhood Scale" Energies 12, no. 18: 3554. https://doi.org/10.3390/en12183554
APA StyleLobaccaro, G., Lisowska, M. M., Saretta, E., Bonomo, P., & Frontini, F. (2019). A Methodological Analysis Approach to Assess Solar Energy Potential at the Neighborhood Scale. Energies, 12(18), 3554. https://doi.org/10.3390/en12183554