Article

Influence of Measurement Aggregation Algorithms on Power Quality Assessment and Correlation Analysis in Electrical Power Network with PV Power Plant

1
Department of Electrical Engineering Fundamentals, Faculty of Electrical Engineering, Wroclaw University of Science and Technology, 50-370 Wrocław, Poland
2
TAURON Ekoenergia Ltd., 58-500 Jelenia Góra, Poland
3
Center of Energy Technology, 58-100 Świdnica, Poland
4
Association of Polish Power Engineers—Branch in Lubin, 59-300 Lubin, Poland
*
Authors to whom correspondence should be addressed.
Energies 2019, 12(18), 3547; https://doi.org/10.3390/en12183547
Submission received: 21 August 2019 / Revised: 10 September 2019 / Accepted: 10 September 2019 / Published: 16 September 2019

Abstract

:
Recently a number of changes were introduced in amendment to standard EN 50160 related to power quality (PQ) including 1 min aggregation intervals and the obligation to consider 100% of measured data taken for the assessment of voltage variation in a low voltage (LV) supply terminal. Classical power quality assessment can be extended using a correlation analysis so that relations between power quality parameters and external indices such as weather conditions or power demand can be revealed. This paper presents the results of a comparative investigation of the application of 1 and 10 min aggregation times in power quality assessment as well as in the correlation analysis of power quality parameters and weather conditions and the energy production of a 100 kW photovoltaic (PV) power plant connected to a LV network. The influence of the 1 min aggregation time on the result of the PQ assessment as well as the correlation matrix in comparison with the 10 min aggregation algorithm is presented and discussed.

1. Introduction

The most often used standards related to power quality (PQ) are EN 50160:2010 [1] with further amendment EN 50160:2015 [2] as well as IEC 61000-4-30 [3] and IEEE 1159 [4]. The classical method of assessing power quality is based on choosing a representative period of time, normally 1 week, which should represent normal operating conditions of the observed electrical power network (EPN). The parameters which are taken into consideration in PQ assessment are as follows: frequency variation (f), voltage variation (U), flicker represented by long-term flicker severity (Plt) and short-term flicker severity (Pst), asymmetry (ku2), total harmonic distortion in voltage (THDu), content of harmonic from 2nd to 50th. In the methodology of power quality assessment, the measurement time interval and aggregation time interval have to be distinguished. The basic measurement time interval for the parameter magnitudes (supply voltage, harmonics, interharmonics and unbalance) is a 10-cycle time interval for a 50 Hz power system or a 12-cycle time interval for a 60 Hz power system. Then, the measurement time intervals are aggregated over a 150/180-cycle interval (150 cycles for 50 Hz nominal or 180 cycles for 60 Hz nominal), 10 min interval and 2 h interval.
The review of present literature indicates that there is some discussion related to the assessment of power quality in terms of the influence of the aggregation time interval on the effect of the assessment. This issue has a significant meaning in terms of the assessment of power quality at the point of the common coupling (PCC) of the distributed generation (DG), especially when the observed DG is characterized by high variations of the energy production. Common examples are PV installations with their inherent relation of generated energy with cloud effect. The discussed aspect has already been reflected in the amendment to standard EN 50160:2015 where a 1 min aggregation interval is suggested for the assessment of voltage variation in low voltage (LV) power systems. Selected issues related to aggregation interval influence can be found in the below works:
  • Article [5] looks at the time varying nature of the PQ distortion level caused by different working conditions of the load demand as well as energy production delivered to the mining electrical power network by distributed generation.
  • Article [6] presents and discusses the behavior of the voltage in the Algerian Low-Voltage distribution network and the influence of the PV generation. The assessment is based on PQ analysis according to EN 50160 and IEC 61000-2-2 standards. The standard EN 50160:2011 was used.
  • Paper [7] presents a photovoltaic (PV) system with an uninterruptible power supply (UPS), equipped with energy storage (25 kWh) and a system for monitoring and management of energy flow. It contains the analysis of energy quality measurements carried out at a point where the PV system is connected to the power grid. The assessment is based on PQ analysis according to EN 50160 and country regulation—Instructions for Distribution Network Traffic and Exploitation applicable since 1 January, 2014, TAURON Dystrybucja S.A. The standard EN 50160:2011 was used.
  • Article [8] describes possible adverse effects of the source on the power network parameters while meeting the conditions contained in the applicable standards and regulations. The presented documents are EN 50160:2011, VDE-AR-N-4105, EN 61000-2-2, Polish Regulation of the Minister of Economy of 2007-05-01, Polish Instructions of traffic and operation in distribution networks (network code).
  • Article [9] contains the investigation of the effects of a high-power installed photovoltaic on a rural LV grid. Additionally, the paper presents the comparison of different measures from a technical perspective. The article analysis is based on EN 50160:2011.
  • Article [10] describes a study of the rapid voltage change. It is realized by modelling the moving cloud shadow and compares the hosting capacity (HC) from the perspective of both dynamic and static characteristics. The article indicates the requirements for a static characteristic based on 10 min on the basis of EN 50160:2011.
  • Article [11] presents a model of a selected part of a distribution network. The model was created in Matlab/Simulink, based on real data, and the impact of PV power plants on voltage amplitude in accordance with EN 50160:2011. The measurement data are based on 1 week in summer.
  • Article [12] deals with impact of two PV plants with equal characteristics. The first is strongly connected (urban area) and second one is weakly connected (rural area) to the distribution grid at the PCC. The PQ demands are based on EN 50160:2011.
  • Paper [13] contains research on the impact of the aggregation interval (1 min, 10 min, 30 min), aggregation method (mean, max) and assessment quantiles (95%, 99%) on voltage quality parameters. The considered parameters are voltage magnitude, selected harmonics, total harmonic distortion index and unbalance. The research is based on a database of measurements performed in public low voltage grids. The article conclusion indicates that a higher aggregation interval usually results in a less dynamic time series with a smaller variation range, however for the investigated measurement data no significant influence of the calculation parameters on the results could be identified. Some negligible maximum absolute deviation has been observed for different aggregation intervals. Similar analysis of the aggregation impact is presented in paper [14] and the obtained results are similar. However, both papers have recommended a further verification of the results for grids with a significantly different structure. This recommendation was a motivation for the presented paper. That is why this paper is focused on the investigation of the possible impact of the aggregation interval on power quality assessment in a particular case of the point of common coupling of a photovoltaic plant when the variability of the parameters is more expected.
The presented state of the art supports the need for further verification of the influence of the aggregation interval on power quality assessment for power grids with different structures. Nowadays the widely discussed issue is the integration of distributed energy resources with a power system and its impact on power quality. One of the main contributions of this work compared to previous research dedicated to the investigation of the influence of the aggregation interval on power quality assessment is to expand research into a real measurement case of a 100 kW photovoltaic plant directly connected to a low voltage power network. The investigated case is interesting due to the variability of power quality parameters associated with variable nature of energy production affected by weather conditions. Additionally, this work explores an additional aspect of the possible impact of the aggregation interval which is its influence on the correlation analysis between weather conditions and power quality parameters. The presented results highlight some differences between the correlation coefficient obtained using 10 min and 1 min aggregation intervals.
Taking into consideration the effects of the quoted discussion, the aim of this paper is to present a comparative investigation of the application of 1 and 10 min aggregation times in power quality assessment. The selected times are based on the demands of PQ assessment in accordance with the amendment to the standard EN 50160 where both 1 min and 10 min aggregation intervals are considered [1,2]. The observed object is the 100 kW PV power plant connected directly to LV power network. Additionally, the paper extends the discussion of using different aggregation intervals in the context of correlation analysis of the PQ parameters and weather conditions. The obtained results highlight the impact of PV energy production on PQ level at the PCC when different aggregation times are used.

2. Comparative Study of Recent Developments in Power Quality Requirements

The permissible levels of power quality parameters used for the assessment of public distribution networks is based on standard EN 50160. This standard was changed significantly in 2015. The comparison of demand levels for standard EN 50160:2010 [1] and standard EN 50160:2015 [2] were involved in Table 1.
Studying contents of Table 1 it can be noticed that the most significant difference is the extended requirement for the time period when the parameters should preserve the permissible levels. The acceptance level for parameters are similar for both [1] and [2] but the time to maintain the parameter at a given level is required at 100% of the observations in [2] while the previous version of the standard [1] generally uses 95% for the time of observation. This indicates that the trend is toward continuous maintenance of power quality parameters (f, U, Plt, ku2, THDu, harmonic 2nd to 50th) for the acceptance level.
A significant change is noted for frequency. For the systems with a synchronous connection, the requirements for the 50 Hz systems is setup to 50 Hz ± 0.1 Hz for 100% of the time. The acceptance level corresponding to 100% of measurement data was restricted from 47 Hz to 49.9 Hz. The frequency is a grid parameter and local changes generally have no significant influence on frequency but the formulated requirement might be a very restrictive demand for distribution system operators.
The next difference between the documents is the mentioned aggregation time for voltage variations. In [1], the 10 min aggregation was used. In [2], the 1 min aggregation is proposed for a LV power network. The reduction of aggregation time as well as the demand for 100% of the data to be in the permissible range creates a serious question for the sensitivity of the assessment when a single aggregated 1 min value can cause a negative assessment of voltage variation.
The next difference is the introduction of the requirement for short-term flicker severity which uses 10 min aggregation interval. Until 2015, long-term flicker severity was used, where 2 h aggregation is applied. It creates the next question about the sensitivity of the assessment when rapid changes of power demand or power generation might be considered.
Standard [2] introduced the requirement level for harmonic from 26th to 50th. Additionally, the mean value of THDu measured data was defined. It indicates that when the THDu level is high (higher than 5%) for a long period of time it may lead to a negative assessment [15]

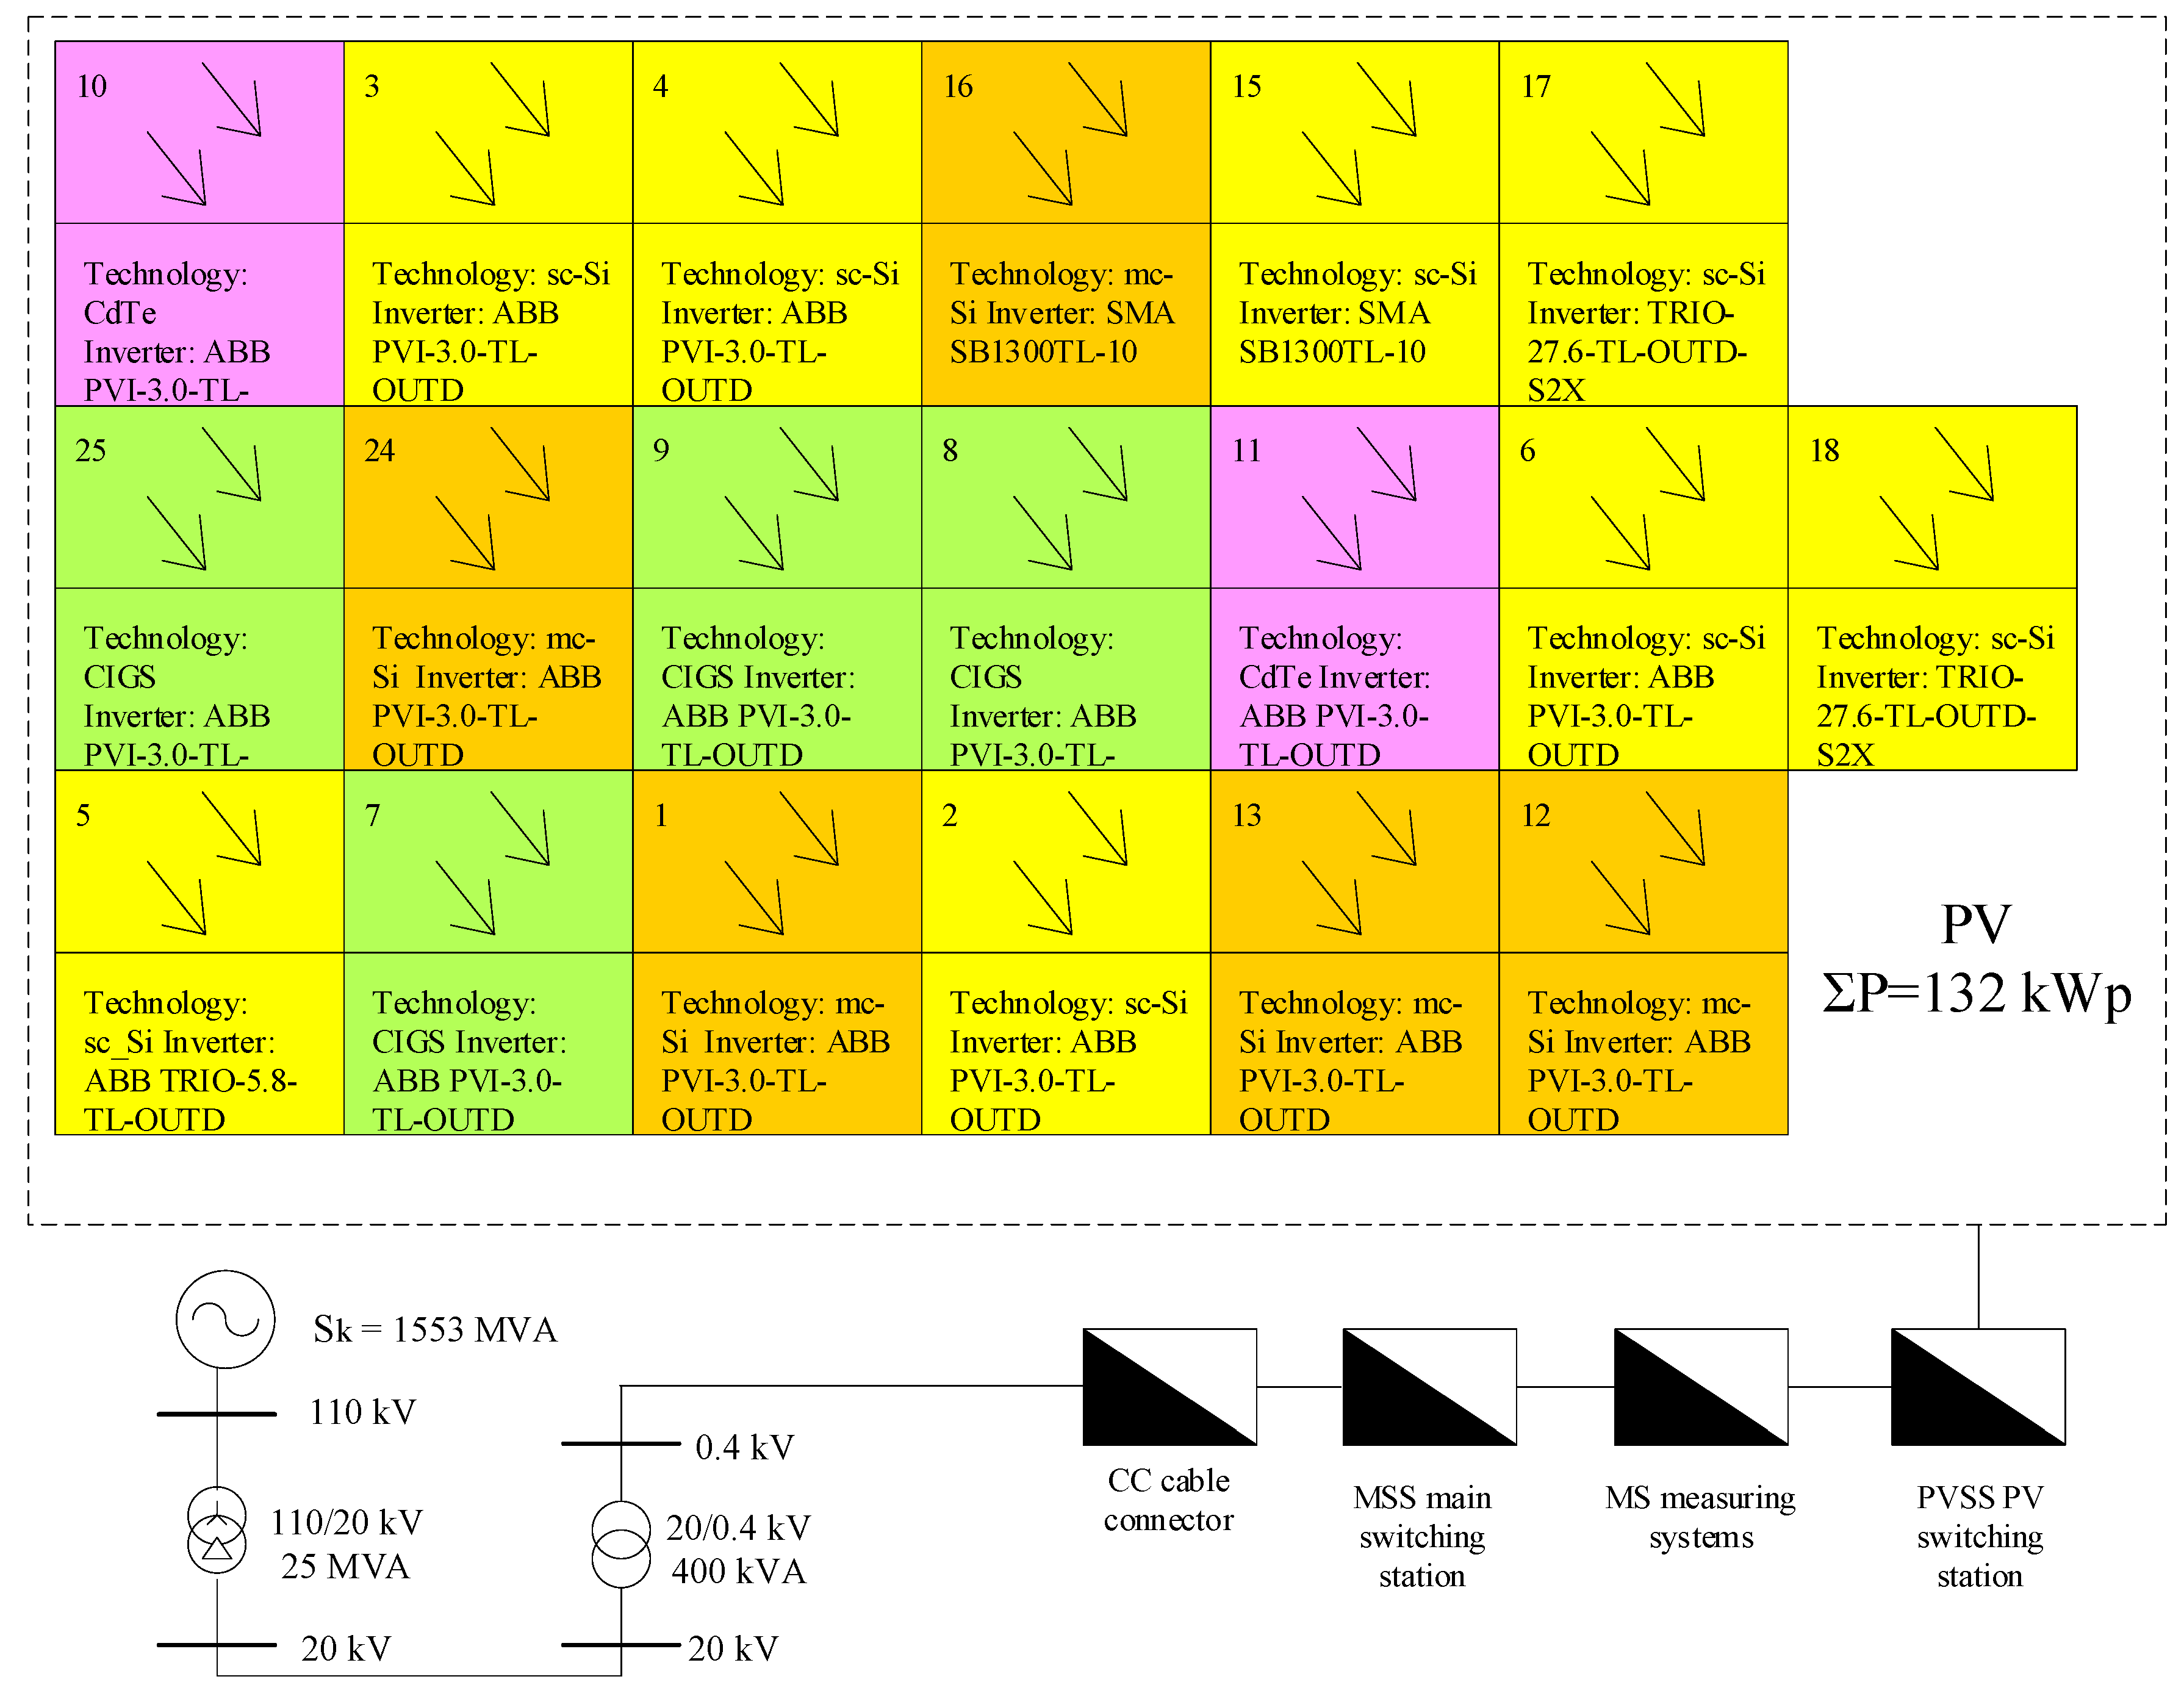
3. Description of Investigated PV Power Plant

The investigated photovoltaic power plant (PVPP) consists of numerous of small photovoltaic systems. The range of installed power of the PV systems are: 3 kWp, 5 kWp, 17 kWp, 25 kWp, 30 kWp with a total power of 132.37 kWp, however referring to an agreement with the local distribution system operator, the generated power is limited to 100 kW. Thus, technically one of the 30 kWp system works in the regulatory mode in order to keep maximum of generated power to 100 kW. The diagram with the assignment of specific PV technologies and range of installed power is shown in Figure 1. PV modules are made on the basis of different technologies which have been marked in in Figure 1 with given colors:
  • First generation—silicon cells, from crystalline silicon:
    Monocrystalline (sc-Si) (yellow),
    Multicrystalline (mc-Si) (orange),
  • Second generation—thin-film cells:
    Cadmium telluride cells (CdTe) (pink),
    Burns from CuInGaSe2 copper-indium selenide (Copper-Indium-Gallium-Diselenide—CIGS) (green).
The PV power plant (PVPP) is located in the south-western part of Poland. The angle of the PV panel position is β = 31°.
The database of measurements consists of electric and non-electrical quantities associated with individual PV installations. The elements of non-electrical quantities are irradiance, temperature of the panels and wind. Electrical quantities come from the particular PV inverters on the AC and DC sides. Additionally, power quality parameters are measured at the point of common coupling of the PV power plant, noted as MS (measuring systems). The energy production is also measured by energy meters.
Additionally, the weather data are collected by a separate weather station including:
  • Air pressure, AtmP
  • Ambient temperature, Ta
  • Relative humidity, RH
  • Wind speed, WS
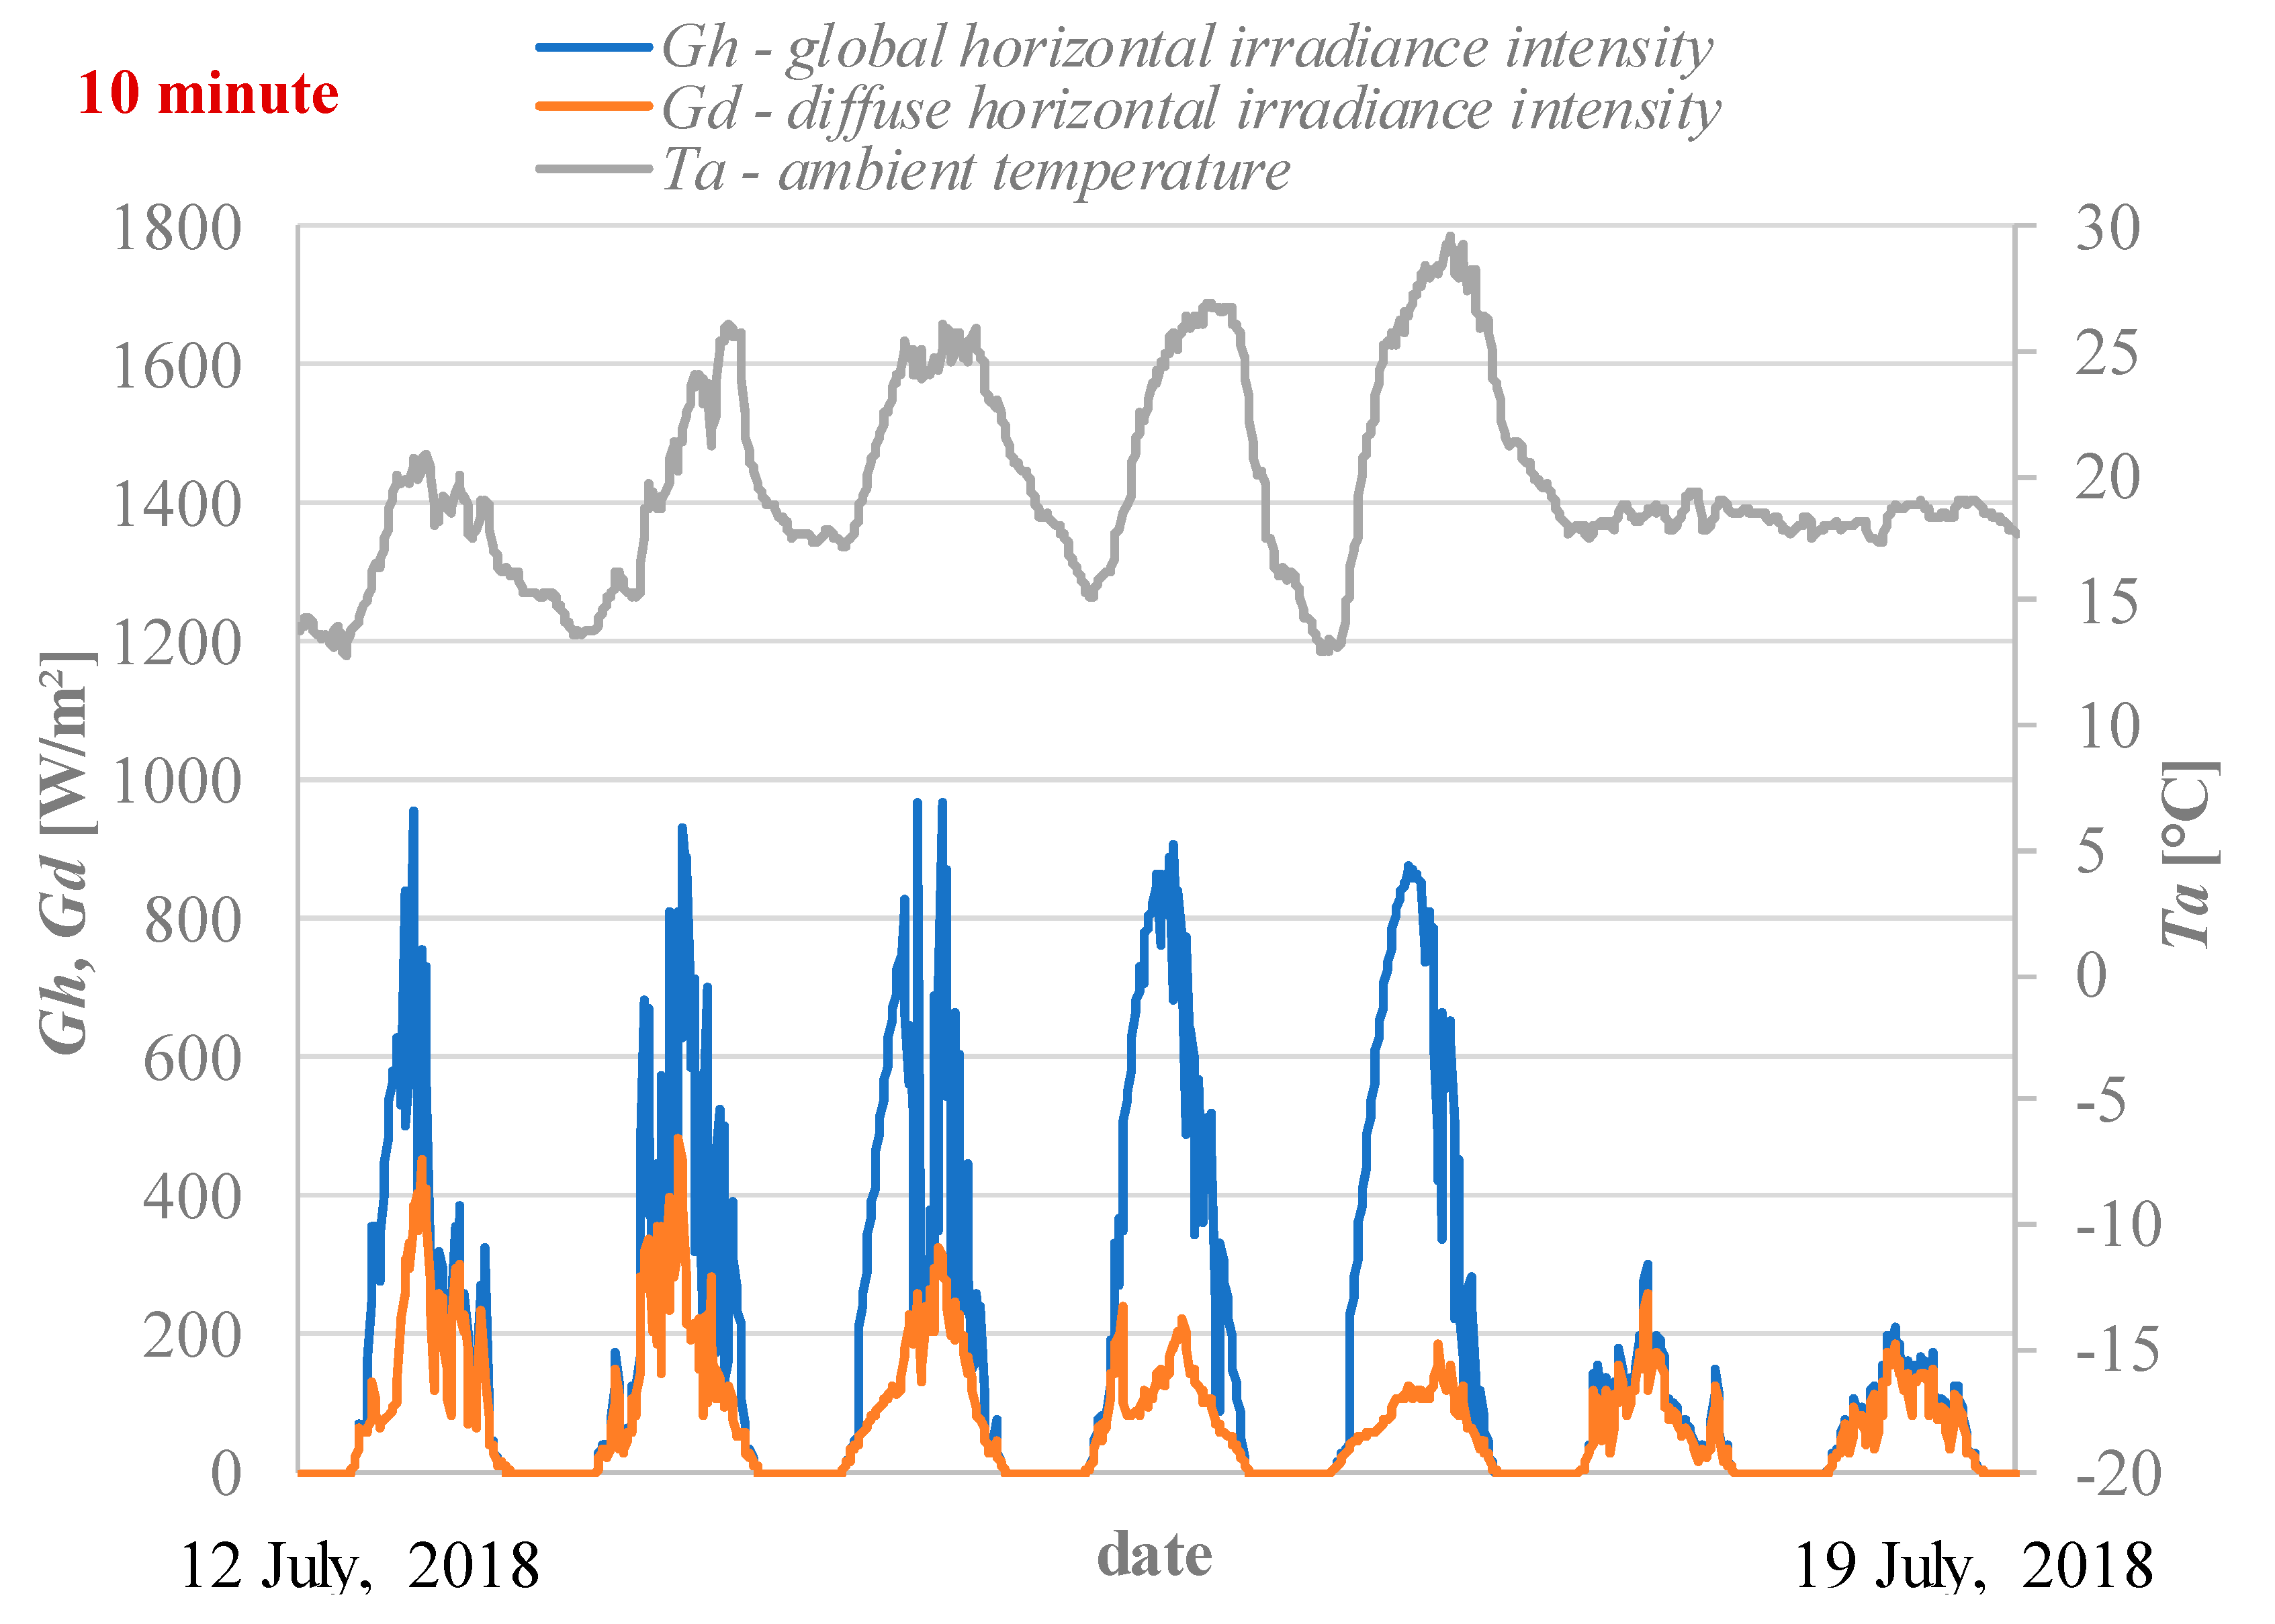
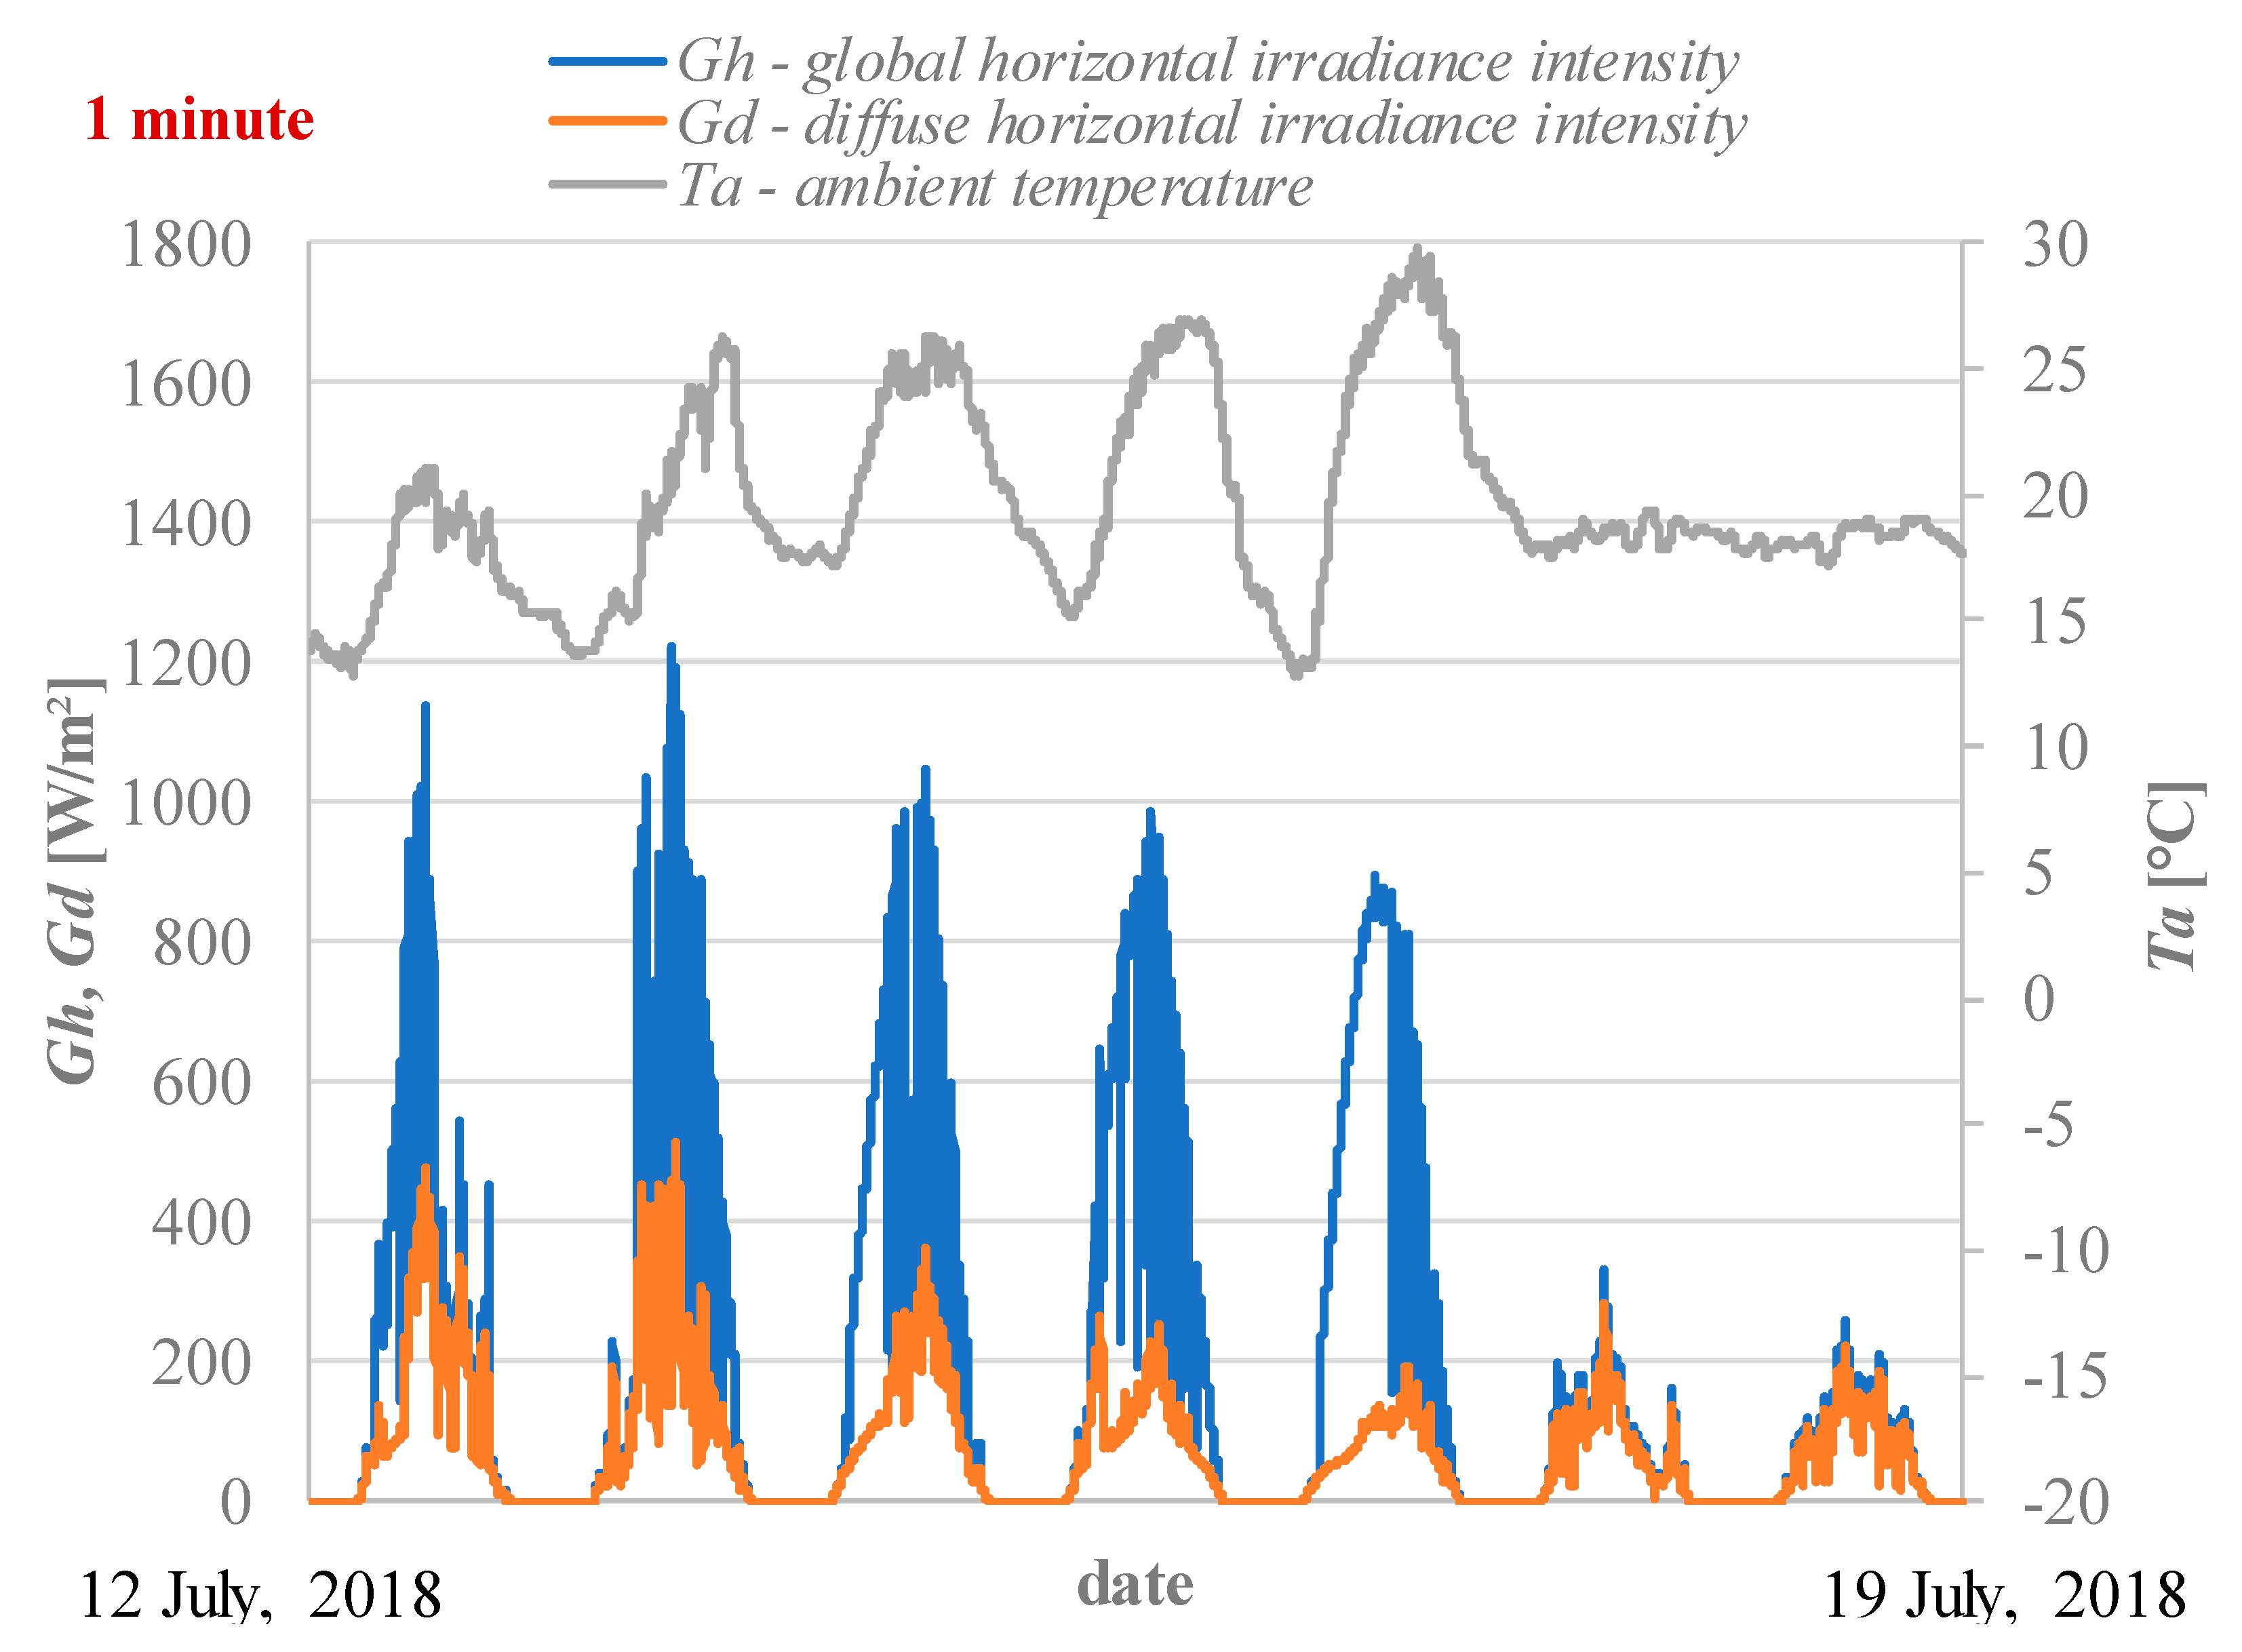
  • Global horizontal irradiance, Gh
  • Diffuse horizontal irradiance, Gd
In order to investigate the influence of the aggregation time interval, PQ parameters and weather condition measurements were conducted from selected period of 12 July, 2018 to 18 July, 2018. This period of observation can be treated as a representative week of measurement data consisting of high and low irradiance levels and different weather conditions. Methods of the measurement and aggregation times were conducted in accordance with class A of standard [3]. The PQ recorder was set up so that the 1 min and 10 min aggregations were collected simultaneously. In order to demonstrate the PV power plant behavior in the selected period of observation in Figure 2, the active power generation in the week for both 1 min and 10 min aggregation is shown. Negative active power during the night is caused by the energy consumption of the plant, mainly related to supplying the database server and cooling the technical container. The application of a 1 min aggregation interval in comparison to a 10 min interval allows the real changeability or power generation to be expressed better, especially in view of extremum values caused by the cloud effect.
To demonstrate the variation of the weather conditions, the changes of ambient temperature, global horizontal irradiance and diffuse horizontal irradiance is presented in Figure 3 using a 10 min aggregation interval and in Figure 4 using a 1 min aggregation interval. Comparison of the application of 1 min and 10 min of data indicates the higher changeability and extremum values of observed measurements.

4. Results of the PQ Assessment and Correlation Analysis for Different Aggregation Time Intervals

4.1. General Comparison of the PQ Assessment Results Using Requirements of EN 50160:2010 and EN 50160:2015

The results of the PQ assessment for both EN 50160:2010 [1] and EN 50160:2015 [2] are presented in Table 2. The analysis indicates that PQ assessment in accordance with [1,2] gives different results of the assessment. The differences appear mainly when the assessment considers 100% of the measurement data set.

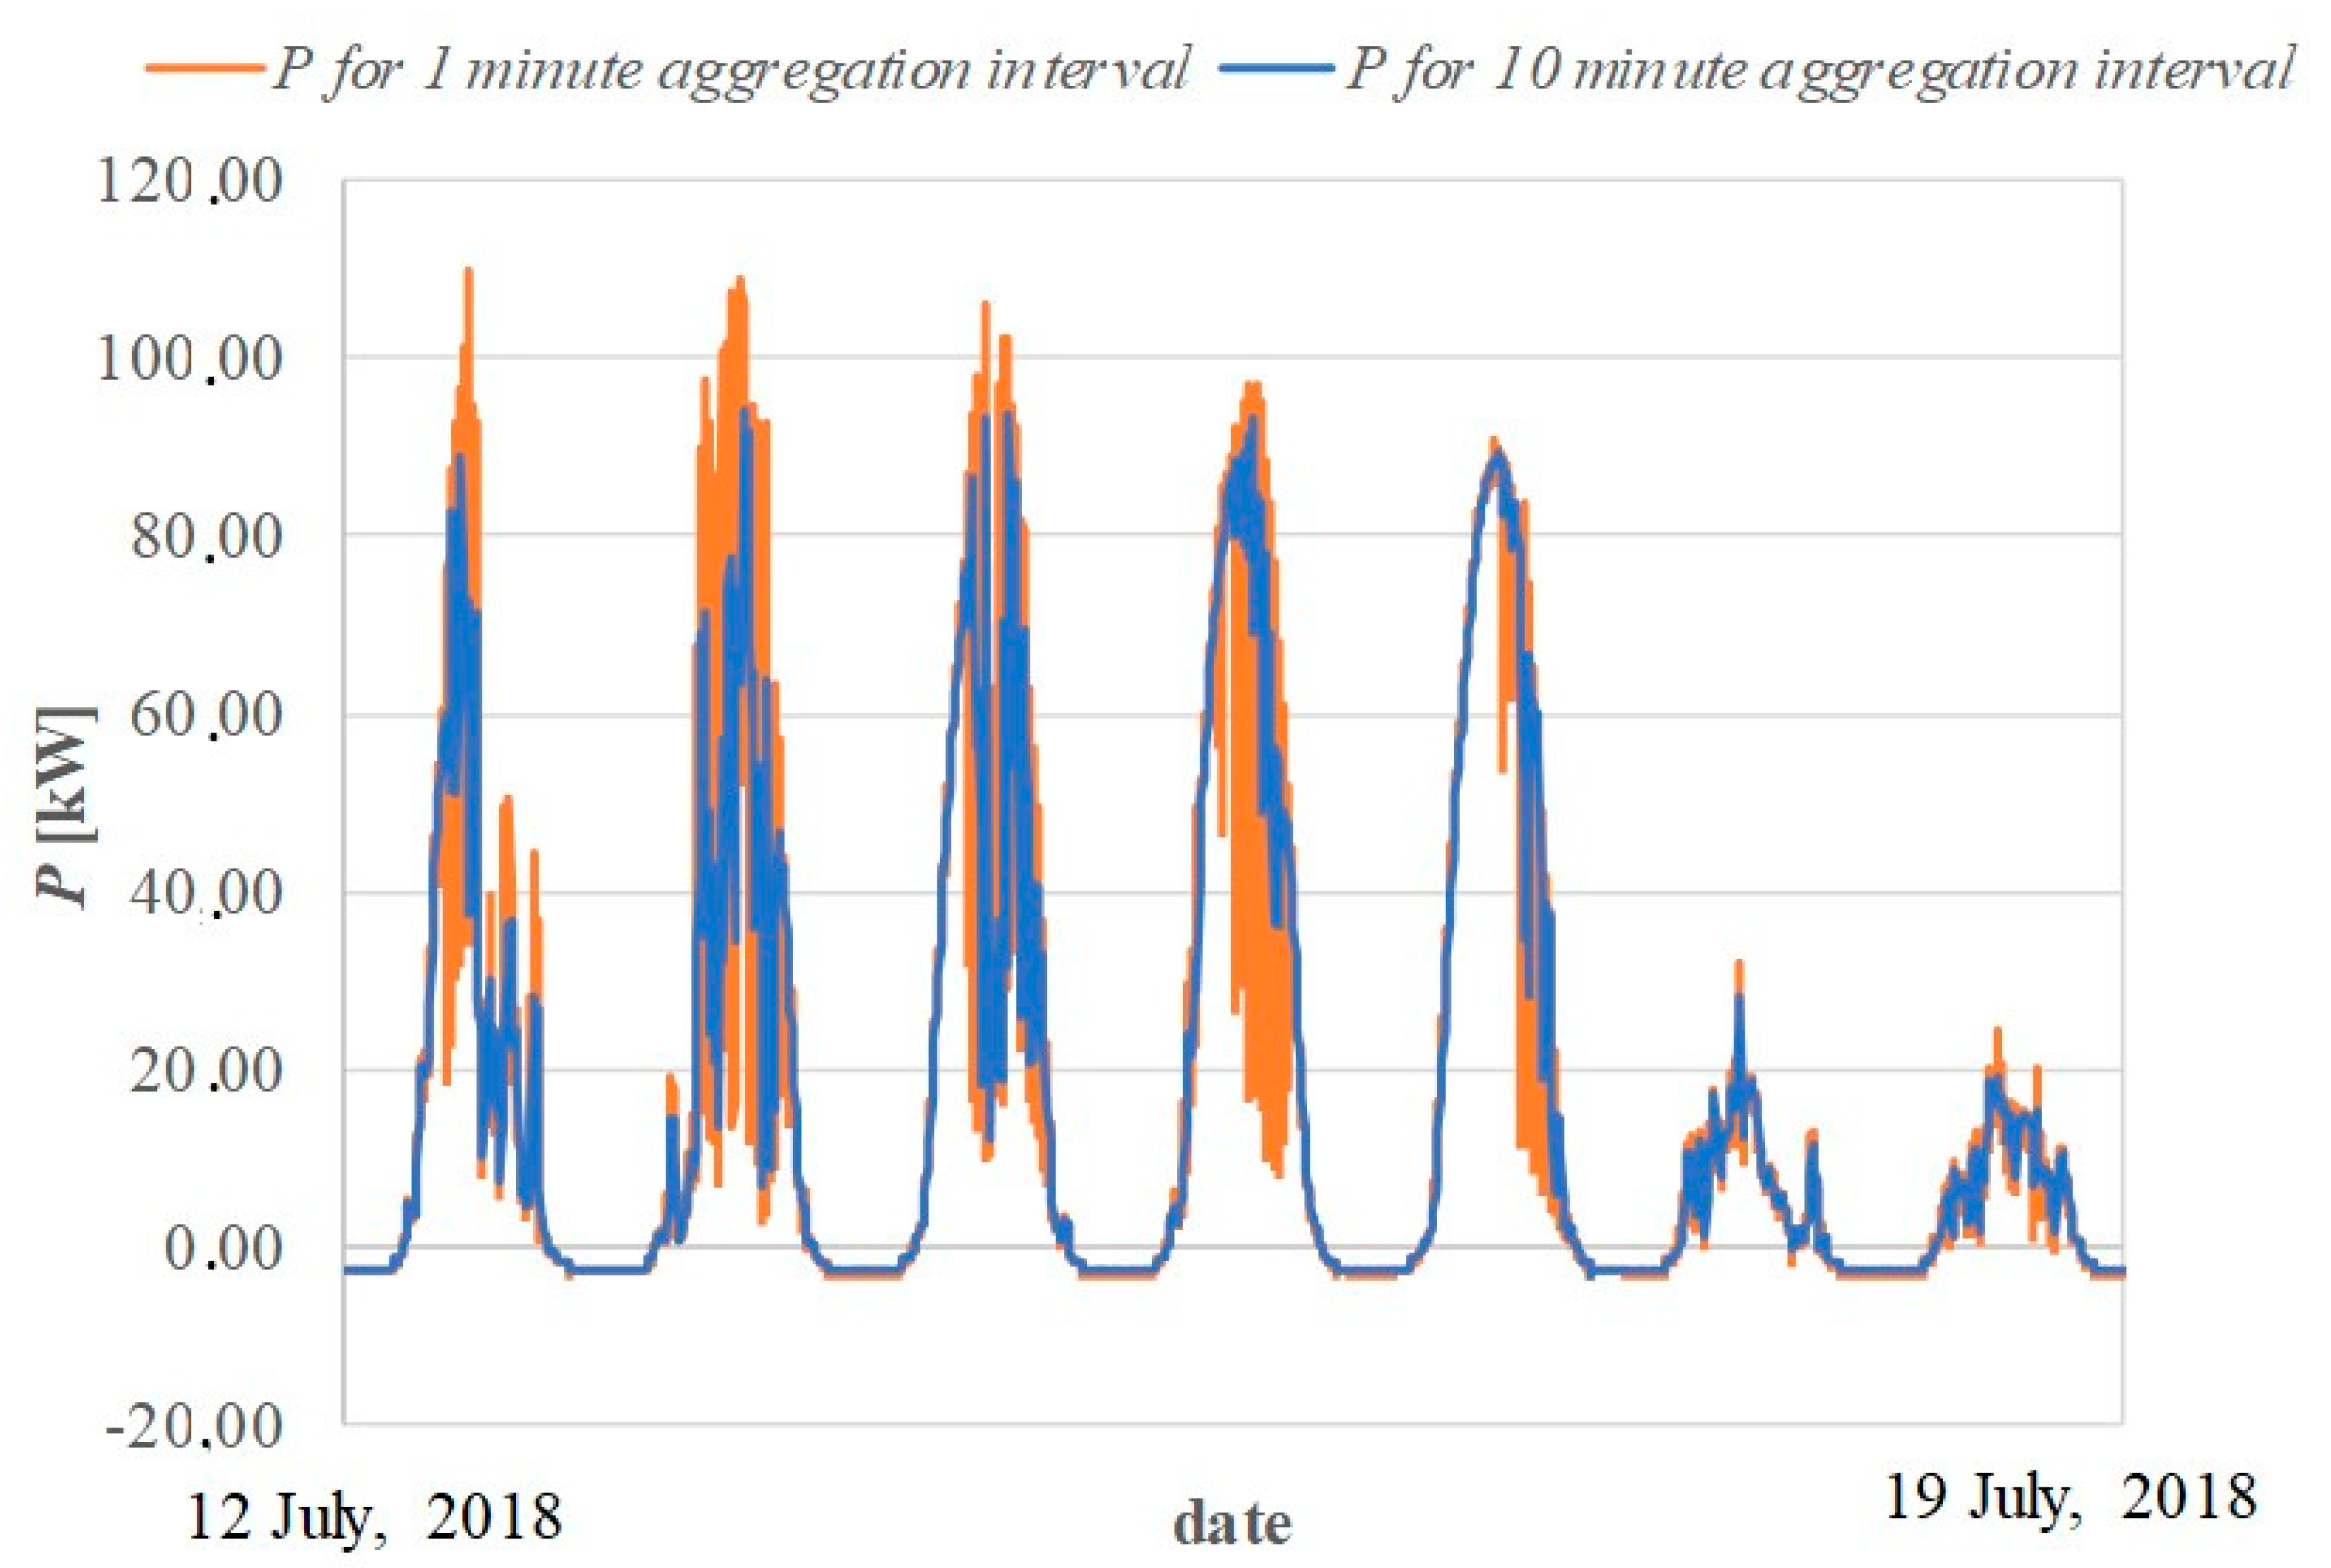
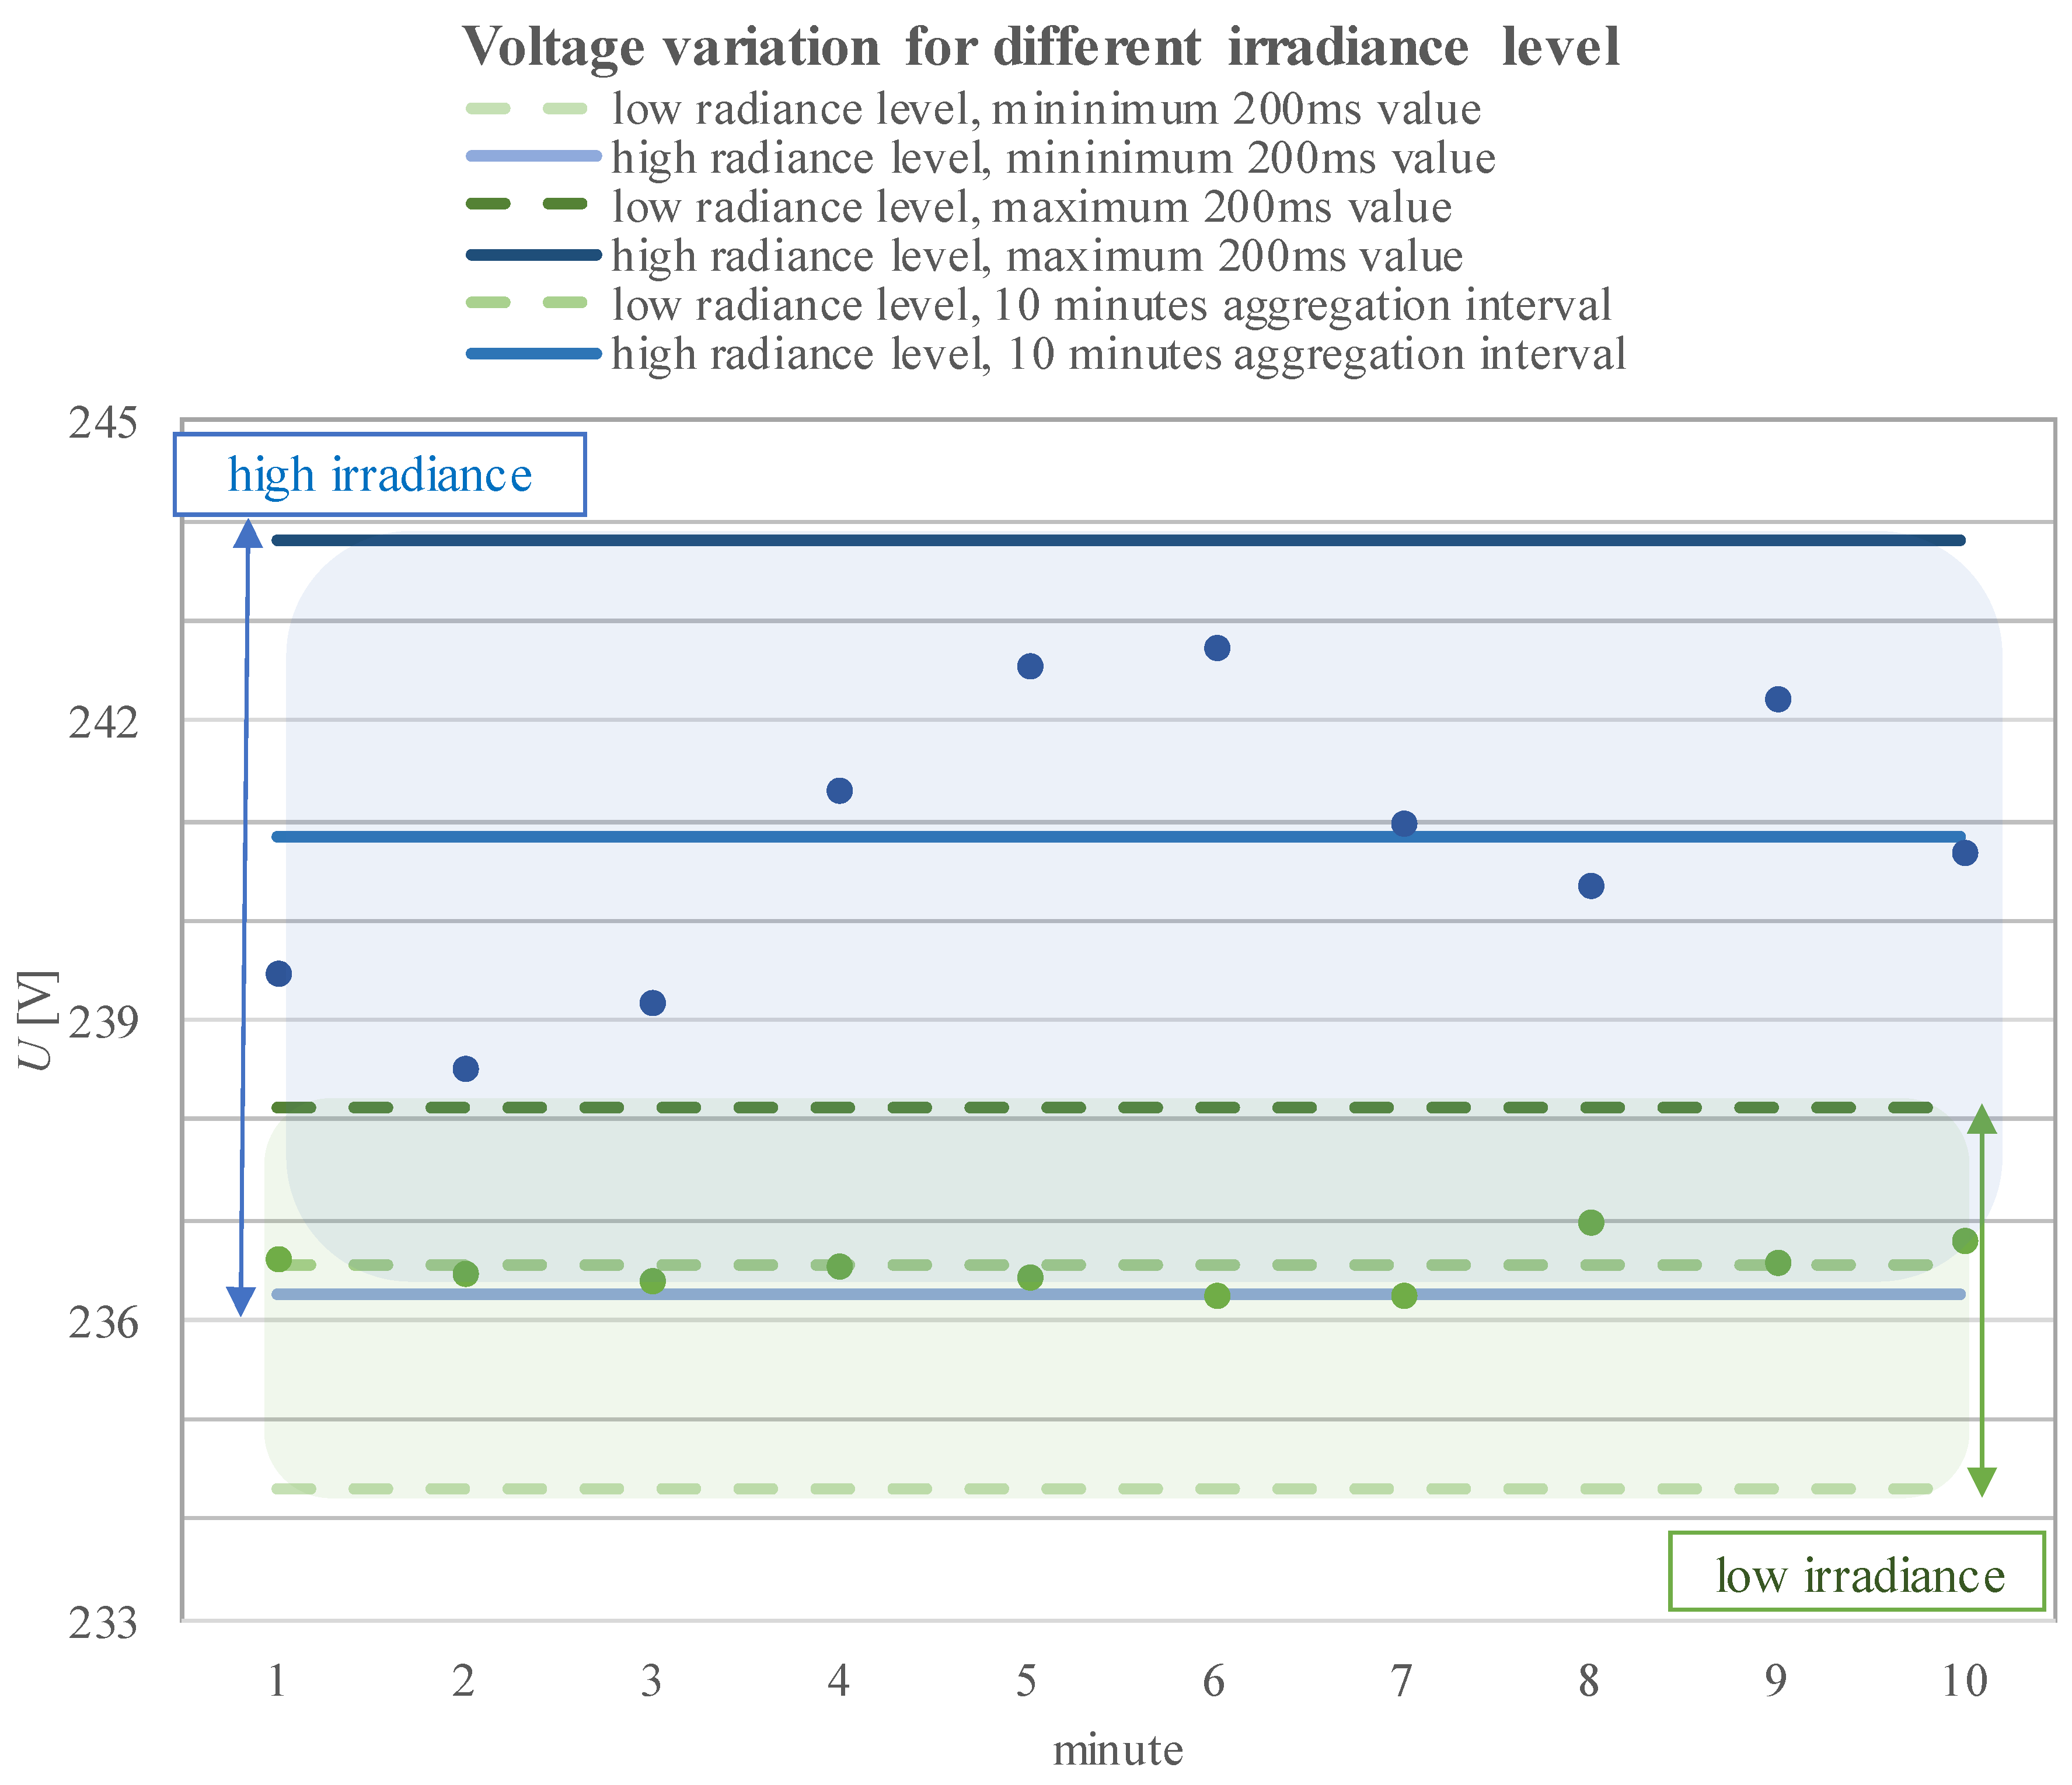
4.2. Voltage Variation Analysis Using 1 Min and 10 Min Aggregation Intervals

The standard EN 50160:2015 [2] has introduced the analysis of voltage variation in 1 min aggregation time. Previously, referring to EN 50160:2010 [1], the analysis was based on a 10 min aggregation interval. Table 3 presents the obtained values of minimal, mean, maximal, variance, standard deviation and median values of voltage variations aggregated in 1 min and 10 min. The analysis indicates that:
  • the mean value is the same for 1 min and 10 min aggregation intervals;
  • extreme values are higher for the 1 min aggregation interval;
  • variation and standard deviation are higher for the 1 min aggregation interval;
  • the median value is very similar for both the 1 min and 10 min aggregation intervals.
Using 1 min or 10 min aggregation intervals has preserved the general character of the investigated connection point. For example, using 1 min and 10 min aggregations indicate some asymmetry in the voltage in the connection point of the observed PV power plant. The differences between values of voltage in particular phases are the effect of the structure of the investigated PV power plant. The PV power plant consists of a number of one-phase PV installations which are connected to different phases and can bring some differences in voltages in particular phases. Generally, it can be concluded that application of a 1 min aggregation interval in comparison to a 10 min interval introduces better observability of variations of voltage that exhibits itself by the higher level of extreme values and standard deviation. Table 3 shows that the voltage variation parameters including minimal and maximal values or standard deviations better express the variability of the observed parameters when 1 min aggregation is used. Generally, it can be concluded that the application of a 1 min aggregation interval in comparison to 10 min introduces better observability of variations of voltage that exhibits itself by a higher level of extreme values and standard deviation.
In order to highlight the impact of the aggregation interval on the assessment of PQ parameters at the point of the connection of the PV power plant, Figure 5 presents the analysis of voltage variations in classic term (10 min), short term (1 min) and very short term (200 ms extreme minimum and maximum values of each 10 min aggregated data) for two opposite weather conditions:
  • high level of irradiance (12 July, 2018 12:00) Gh = 759 W/m2
  • low level of irradiance (17 July, 2018 12:00) Gh = 172 W/m2
The results are presented for one representative phase. In order to minimalize the impact of the network operating condition, the comparison was performed for similar working conditions i.e., working day and working hour (12:00), but the selected days represent different conditions of solar irradiance. Using both 10 min and 1 min aggregation intervals, an expected relationship between solar irradiance and the voltage is represented. The high solar irradiance level directly indicates the higher level of active power generation that naturally increases voltage in the connection point. However, using 1 min aggregation data additional observations and conclusions can be done. From having 1 min data it can be seen that the envelope of voltage variation is wider for the higher irradiance level than for the smaller solar irradiance It can be stated that using a 1 min aggregation interval the cloud effect on voltage variation is better represented than when a 10 min aggregation is applied. It can be concluded generally that a shorter aggregation interval allows the variable nature of observed parameter to be expressed better. Instead of one mean 10 min value, a time series of 1 min values is considered.

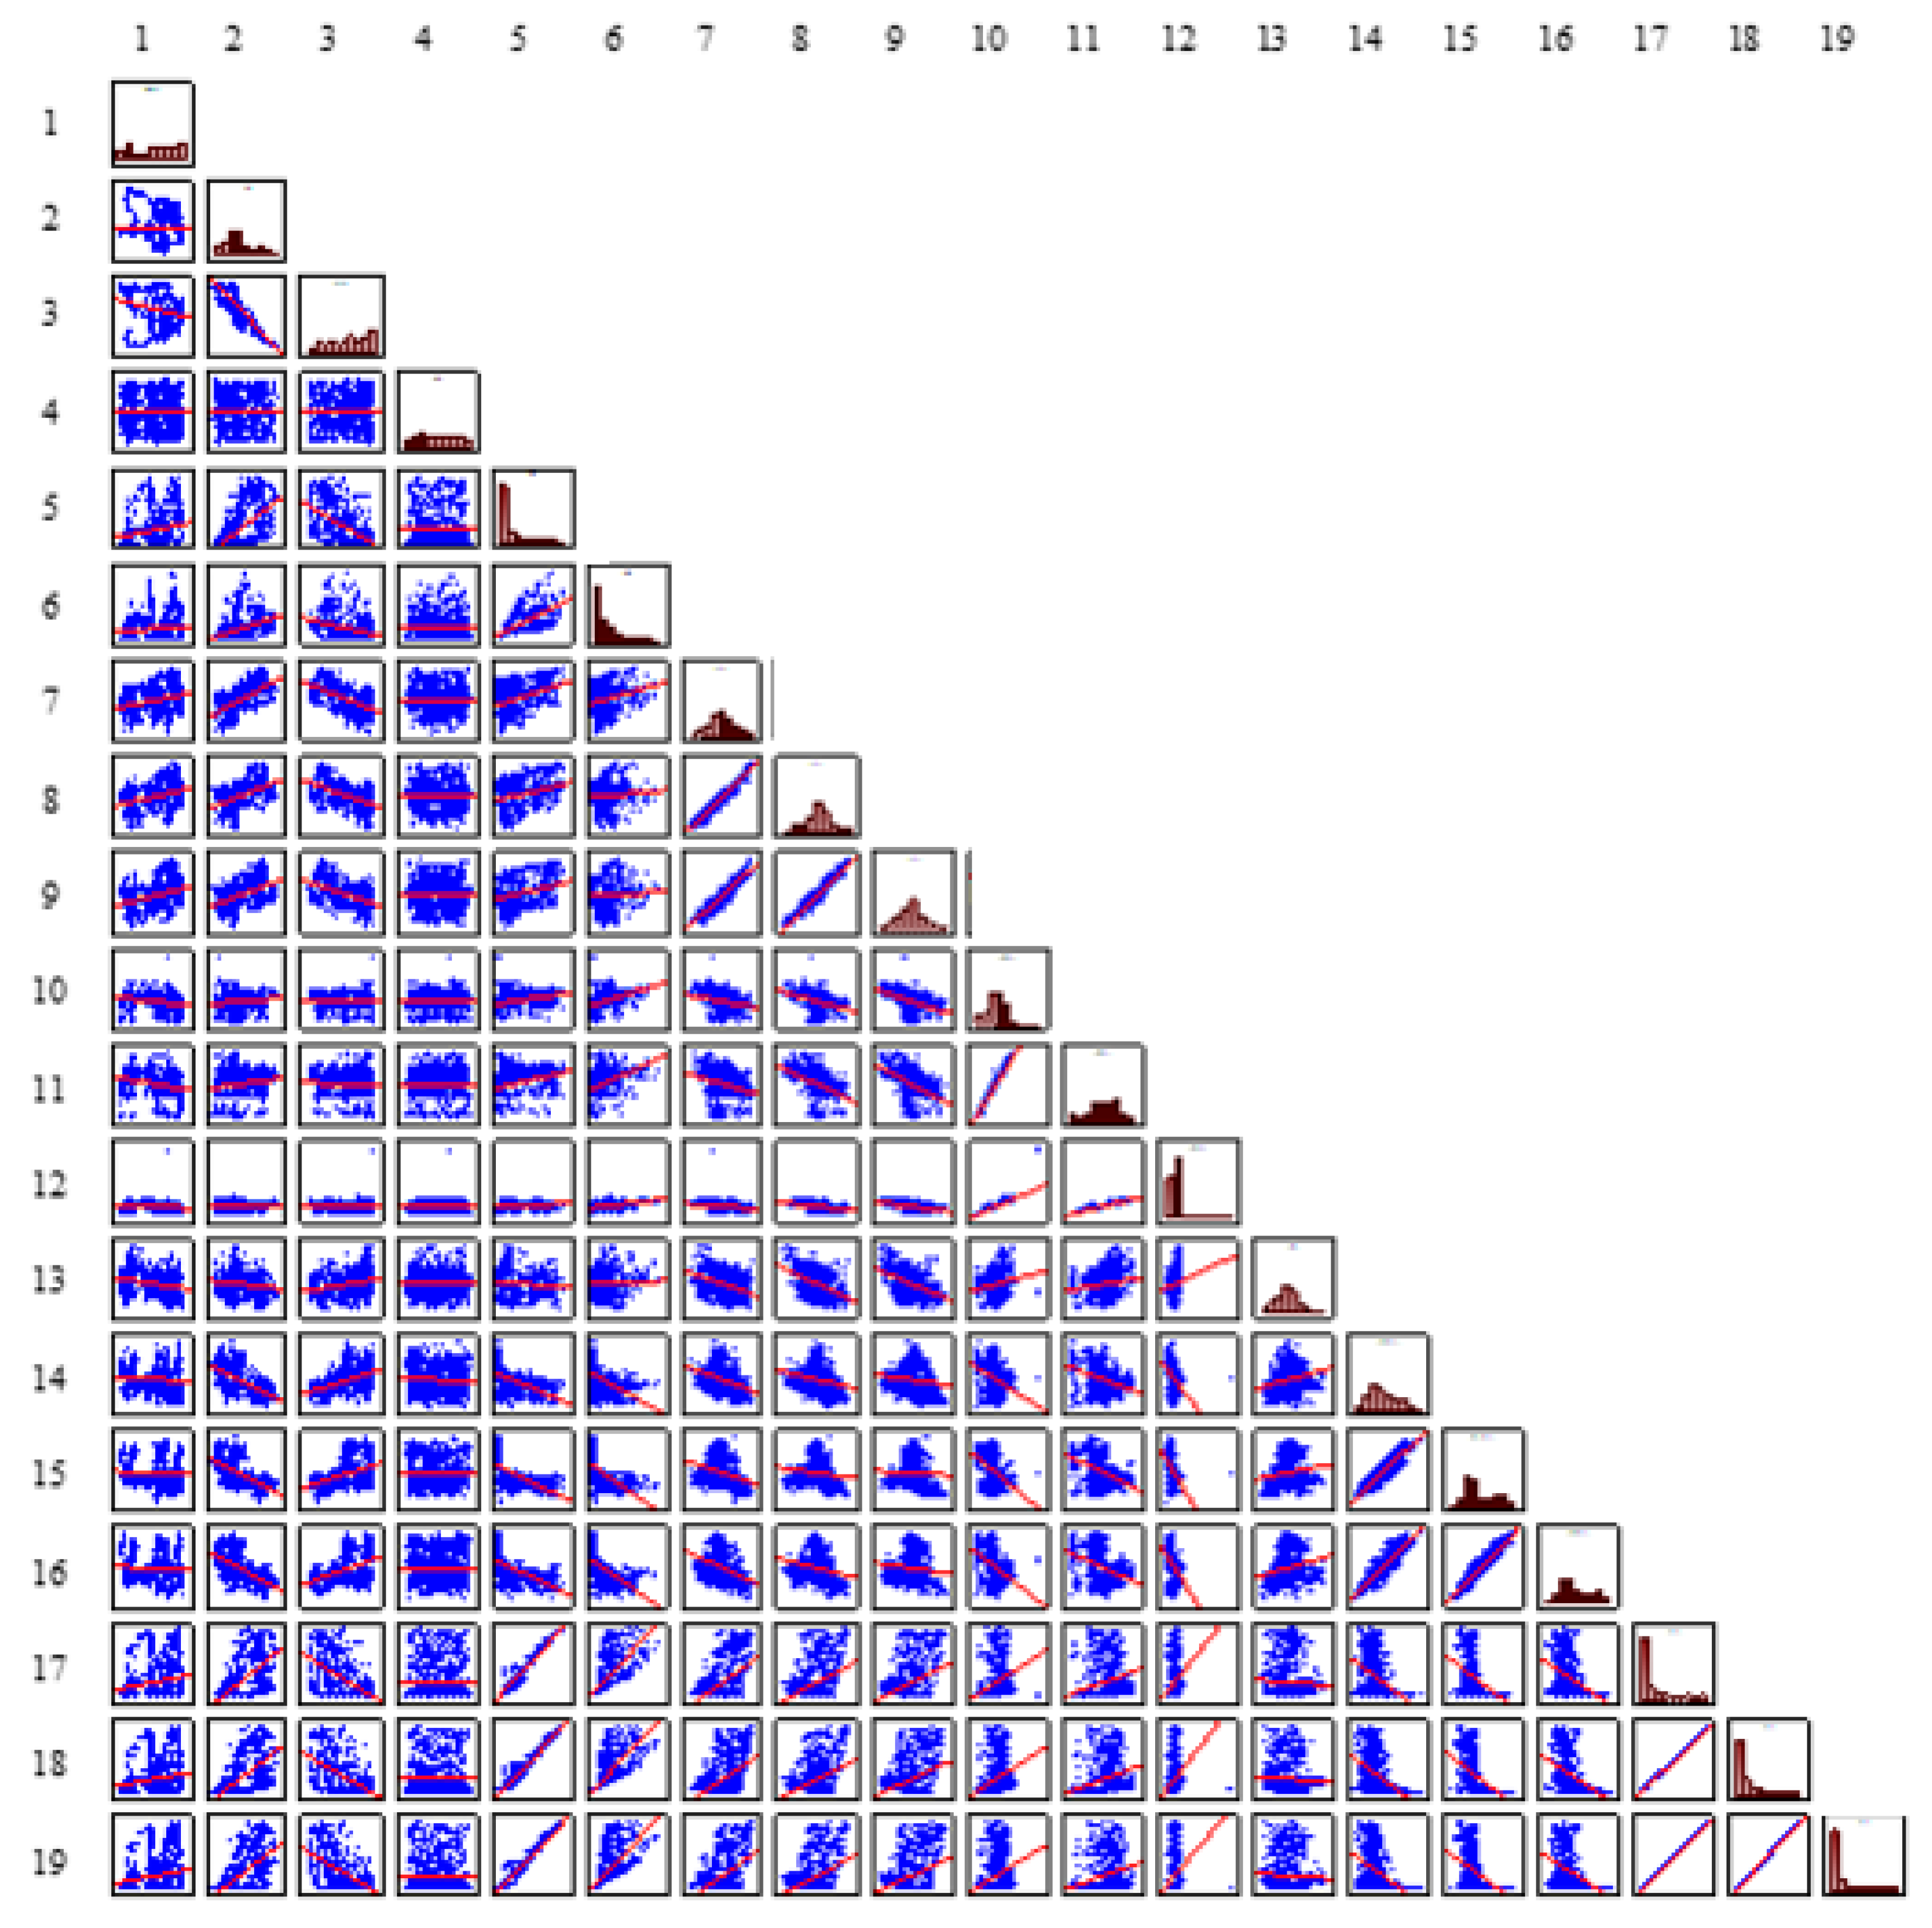
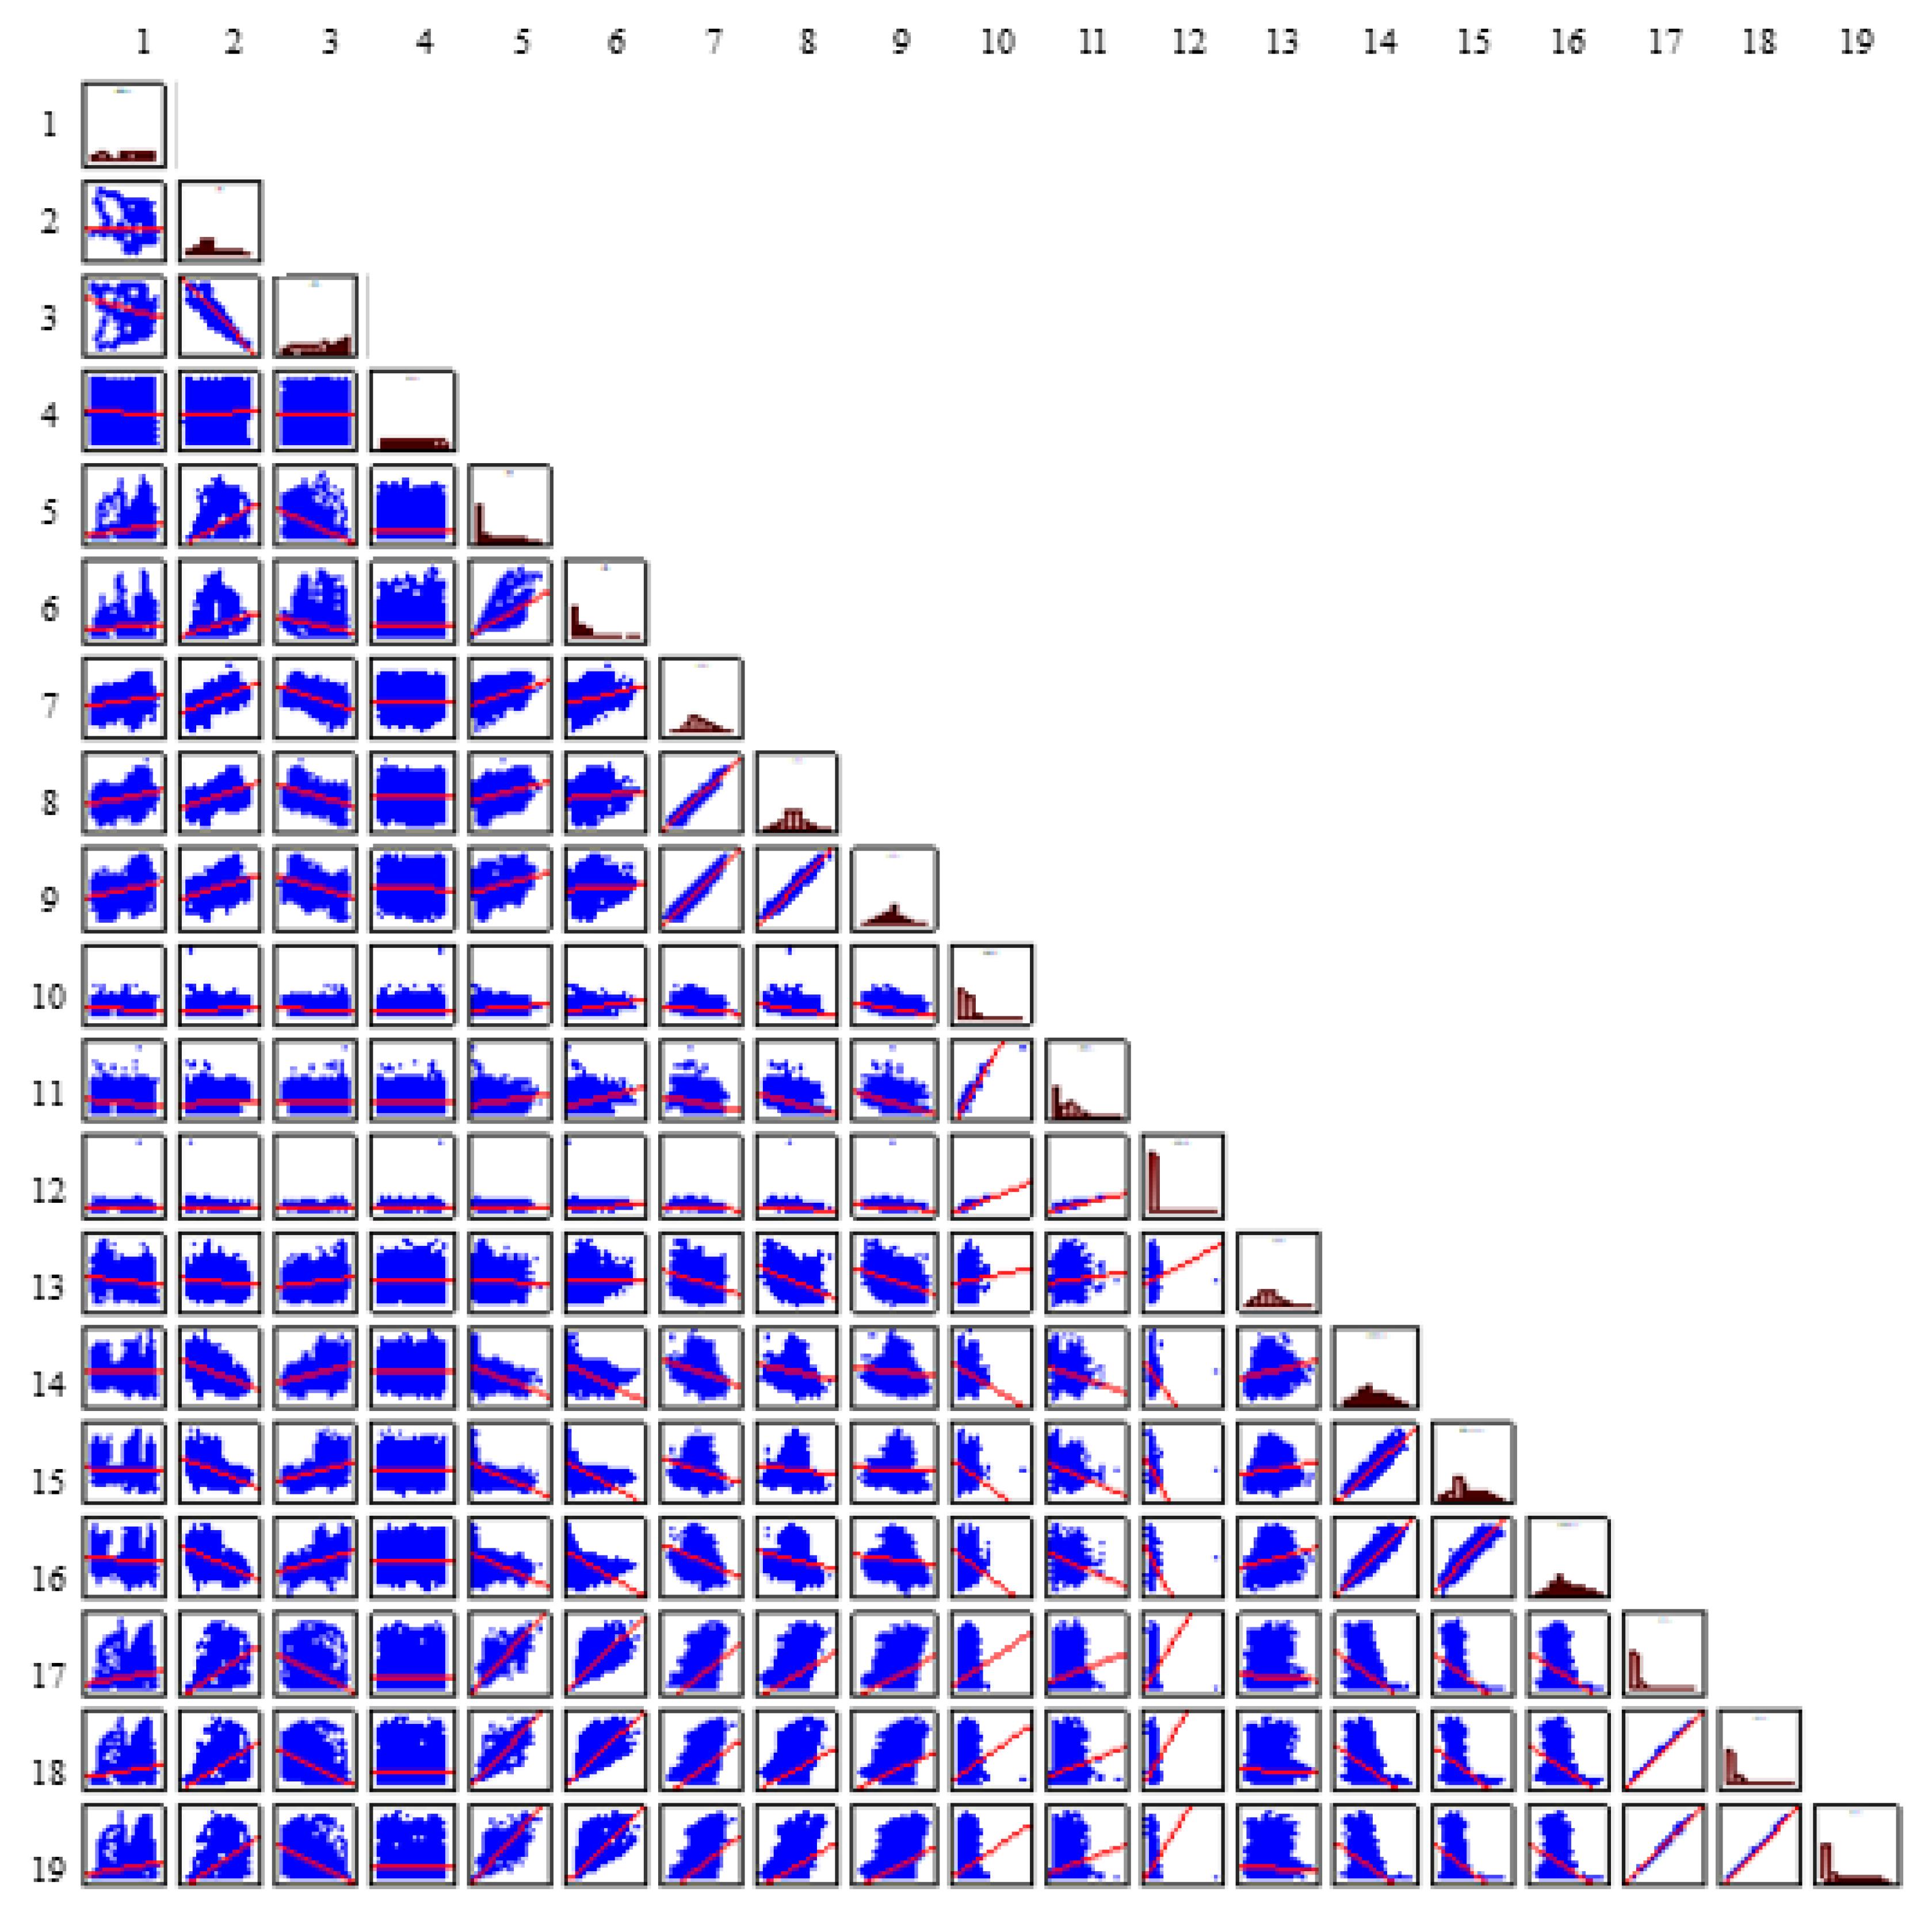
4.3. Correlation Analysis Using 1 Min and 10 Min Aggregation Intervals

The next issue concerns the possible impact of the aggregation interval that can be considered in terms of the effect on the result of the correlation analysis of selected power quality parameters and weather condition. The correlation was calculated for 1 min and 10 min aggregation time respectively. Correlation analysis was performed using the Statistica software. A correlation matrix function was used, which is based on determining the linear correlation of the straight line (r-Pearson). It defines the degree of proportional relations of the values of two variables. Correlation analysis was performed between pairs of parameters representing power quality, weather condition, level of active power production. No preliminary data standardization was performed. Correlation levels were determined on the basis of the rxy correlation coefficient defined as [16]:
r x y =   i = 1 N ( x i x ¯ ) ( y i y ¯ ) i = 1 N ( x i x ¯ ) 2   i = 1 N ( y i y ¯ ) 2 ,
The interpretation of the correlation level based on the determined rxy coefficient is presented in Table 4.
The prepared matrix of correlation is an extended matrix which consists of PQ parameters and weather condition measurements together so that the analysis of the correlation coefficient can be performed simultaneously between particular power quality themselves, for example between voltage level and harmonic contents, as well as between power quality parameters and weather condition, for example between horizontal irradiance and voltage level. The results of the correlation coefficients using 10 min aggregated data is presented in Table 5. Comparative results obtained 1 min aggregated data is collected in Table 6. Additionally, the correlation diagrams of all pairs of parameters is shown in Figure 6 for the 10 min data and in Figure 7 for the 1 min data.
The analysis of the correlation matrix of PQ parameters and weather conditions using a 10 min aggregation interval, presented in Table 4 and Figure 6, indicates that there is:
  • strong correlation between global horizontal irradiance intensity (Gh) and active power (P) with an extremal value equal to 0.99;
  • high correlation between intensity of the diffuse horizontal irradiance component (Gd) and active power (P) with an extremal value equal to 0.72;
  • noticeable correlation between ambient temperature (Ta) and voltage variation (U) with qn extremal value equal to 0.62, total harmonic distortion in voltage (THDu) with an extremal value equal to −0.55 and active power (P) with an extremal value equal to 0.63;
  • noticeable correlation between relative humidity (RH) and voltage variation (U) with an extremal value equal to −0.60, total harmonic distortion in voltage (THDu) with an extremal value equal to 0.45, active power (P) with an extremal value equal to −0.60;
  • noticeable correlation between global horizontal irradiance intensity (Gh) and total harmonic distortion in voltage (THDu) with an extremal value equal to −0.58;
  • noticeable correlation between intensity of the diffuse horizontal irradiance component (Gd) and short-term flicker severity (Pst) with an extremal value equal to 0.44;
  • strong correlation between the line-to-line values of three-phase parameters (U, Pst, THDu, P) with a minimal value equal to 0.90;
  • noticeable correlation between L1 voltage variations (U) and L1, L2, L3 active power (P) with an extremal value equal to 0.48;
  • noticeable correlation between L2 and L3 voltages variations (U) and L2 and L3 short-term flicker severities (Pst) with an extremal value equal to −0.47;
  • noticeable correlation between short-term flicker severities (Pst) and total harmonic distortion in voltage (THDu) with an extremal value equal to −0.49;
  • noticeable correlation between total harmonic distortion in voltage (THDu) and active power (P) with an extremal value equal to −0.59;
  • other correlations are too low to be noticeable.
Using both 10 min and 1 min aggregation intervals, an expected relationship between solar irradiance and the active power production as well as voltage level is represented by the high level of correlation coefficients. The higher solar irradiance level, the higher level of active power generation is observed that naturally has an influence on voltage level in the connection point. The correlation analysis is sensitive enough to show small differences between phases which can be explained by the structure of the investigated PV power plant. The PV power plant consists of many small individual PV installations including one-phase installations thus the active power or voltage level may differ slightly in particular phases. It has resulted in a correlation coefficient related to the phases.
Analyzing the correlation matrix of PQ parameters and weather conditions for the 1 min aggregation interval, presented in Table 6 and Figure 7, confirms generally the same correlation results as for the 10 min interval. However, in order to highlight the impact of the aggregation interval on the results of the correlation analysis, a separate matrix of differences was prepared and presented in Table 7. The matrix consists of differences calculated between the absolute value of adequate correlation coefficients obtained using 10 min and 1 min aggregation intervals. A positive value of the difference denotes that the correlation coefficient calculated using the 10 min aggregation is higher than that calculated using the 1 min aggregation. The obtained result of the investigated differences indicates that the correlation results using 10 min and 1 min aggregation are characterized by comparative level of correlation coefficient for all measured parameters. The comparative means that the maximal difference is slight and less than 0.1. The exception of this result is the correlation between flicker severity (Pst) and voltage level (U) and total harmonic distortion in voltage (THDu). For these parameters, the maximal value of difference is 0.15. Generally, it can be concluded that using a 10 min aggregation interval in comparison to a 1 min aggregation results in a slightly higher level of correlation coefficients. The sign of the coefficients remains the same. In other words, it can be concluded generally that the application of different aggregation time intervals does not change the direction of the correlation but has an influence on the absolute value of the correlation coefficient. Shorter aggregation time intervals assure sharper observability of the process but exhibit a higher level of standard deviation and wider envelope of parameter variation. Compared to the 1 min time series, the 10 min data are more “monotonous” than the 1 min data due to the averaging process over the 10 min interval. Thus, the correlation analysis performed using 10 min data, which are more smoothed, results in higher values of correlation coefficient.

5. Discussions

The investigations presented in this paper correspond to the recent amendment to the PQ standard EN 50160:2015 [2] in comparison to the previous version EN 50160:2010 [1]. The main issues in relation to the development of the mentioned standard are the influence of the requirement for the assessed PQ parameters to preserve the limits 100% of the observed time in comparison to the previous requirement of 95% of the time of observation, as well as influence of the suggestion to use a 1 min aggregation time interval in the case of a LV power system in comparison to the classical 10 min aggregation. Additionally, the issue of the aggregation interval is extended in the paper for the analysis of the influence of the aggregation interval on correlation analysis between PQ parameters and weather conditions. The formulated problems can have a meaning in analysis of the integration of distributed energy resources with a power system in the light of increasing requirements for power quality parameters and increasing concentration of distributed generation in power systems.
In order to highlight mentioned issues, the results of the investigation of a real measurement of a 100 kW photovoltaic power plant directly connected to a LV power system is presented. In relation to the requirement for the assessed PQ parameters to preserve the limits 100% of the observed time, it can be concluded that such requirement can be hard to obtain in selected cases. For example, the investigated 15th harmonic in voltage in the PCC of the investigated 100 kW PV power plant does not preserve the requirement for 100% of the observed time, but has a positive assessment for the requirement of 95% of the observed time. It should be emphasized that the flagging concept was implemented, and the investigated measurement data are free of events which might have affected the assessment by extremal values. A similar conclusion can be formulated in the case of a variation in frequency demand. A more restricted limit for the permissible level of frequency variation and demand for 100% of the observed time causes the assessment to be negative when the requirements related to the amendment to the standard EN 50160:2015 [2] is applied, but would be positive according to requirements of the previous version EN 50160:2010 [1].
Novel power quality analysis is not only concentrated on PQ parameters but also finds a relation between external components and their impact on power quality. In the case of integration of distributed generation with a power system, a prominent example is the influence of weather conditions on power quality. A tool used for the assessment can be a correlation analysis. Thus, an additional aim of the paper is to investigate the influence of the aggregation time interval on the correlation analysis. Generally, it can be concluded that the obtained result of the investigated differences indicates that the correlation analysis using 10 min and 1 min aggregation intervals are characterized by comparative level of correlation coefficient. The application of different aggregation time intervals does not change the direction of the correlation but has an influence on the absolute value of the correlation coefficient. The 10 min data are more smoothed than the 1 min time series due to the averaging process over the 10 min and correlation coefficients obtained using 10 min aggregation are slightly higher. Only in case of flicker severity, expressed by parameter Pst, which is sensitive even for single voltage fluctuations, is the difference of the correlation coefficient noticeable.
The obtained results indicate the need for further investigation of the sensitivity of the assessment when new requirements for power quality limits are created or a shorter aggregation time interval is considered. The advantage of the application of a shorter aggregation time interval is the enhancement of the observability of the investigated objects. However, it has an impact on extended requirements for the measurement devices and increases the time and computational power required for analysis due to the extended size of the power quality database.

6. Conclusions

The presented results indicate that general outcomes of the analysis for both 1 min and 10 min aggregation are similar. However where the requirements for the parameters are forced to be fulfilled during 100% of the observation time, the 1 min aggregation makes the observability of the object more restricted. This allows us to formulate general conclusion that the results of power quality assessment using the 1 min aggregation can be dependent on cooperation of the observed object with the power systems, the used regulation and integration systems, as well as the condition of the power system at the connection point. Furthermore, the obtained results show some potential in using variations of observed power quality parameters in the development of power quality analysis when a 1 min aggregation is used. It was shown that the voltage variation parameters including minimal and maximal values or standard deviations better express the variability of the observed parameters when 1 min aggregation is used. It was also shown that the assessment of power quality parameters at the connection point of a PV power plant, when the cloud effect or variable operating condition of the low voltage network are considered, is characterized by slightly higher values in the variation of the observed power quality parameters when a 1 min aggregation interval is applied than in case of 10 min aggregation. This allows us to conclude that using 1 min aggregation increases the sensitivity of power quality assessment that might be desirable in future when power grids with a high concentration of distributed energy resources, microgrids or grids working in the islanding condition are considered.

Author Contributions

Conceptualization, M.J. and T.S.; methodology, M.J., T.S. and P.K.; software, J.S., M.J. and T.S.; validation, T.S., J.R. and Z.L.; formal analysis, M.J. and T.S.; investigation, M.J., T.S. and P.K.; resources, M.J., T.S., P.K., P.J., D.B., M.R., J.S.; writing—M.J. and T.S.; writing—review and editing, M.J., T.S., E.J., D.K.; visualization, M.J., E.J.; supervision, T.S.; project administration, T.S.; funding acquisition, M.J. and T.S.

Funding

This research was funded by Polish Ministry of Science and Higher Education under the grants for young researchers 049M/0004/19 as well as under the project “Developing a platform for aggregating generation and regulatory potential of dispersed renewable energy sources, power retention devices and selected categories of controllable load” supported by European Union Operational Program Smart Growth 2014-2020, Priority Axis I: Supporting R&D carried out by enterprises, Measure 1.2: Sectoral R&D Programs, POIR.01.02.00-00-0221/16, performed by TAURON Ekoenergia Ltd. under Polish Sectoral Program PBSE coordinated by The National Centre of Research and Development in Poland.

Acknowledgments

This work uses weather condition data provided by the Center of Energy Technology in Świdnica, Poland.

Conflicts of Interest

The authors declare no conflict of interest.

Abbreviations

ACalternative current
AtmPair pressure
CCconnector cable
CdTeCadmium telluride cells
CIGSCopper-Indium-Gallium-Diselenide
DCdirect current
ENEuropean Standard
ffrequency variation
Gdintensity of the scattered radiation component
Ghtotal horizontal radiation intensity
HChost capacity
IECInternational Electrotechnical Commission
IEEEInstitute of Electrical and Electronics Engineers
ku2asymmetry
mc-Simulticrystalline
MSmeasuring system
MSSmain switching station
Pactive power change
Pltlong-term flicker severity
Pstshort-term flicker severity
PVFSPV Solar Farm
PVSSphotovoltaic switching station
RESrenewable energy sources
RHrelative humidity
sc-Simonocrystalline
Taambient temperature
THDtotal harmonic distortion
Uvoltage variation
VDEVerband der Elektrotechnik, Elektronik und Informationstechnik
WSwind speed

References

  1. EN 50160: Voltage Characteristics of Electricity Supplied by Public Distribution Network; PKN: Warszawa, Polska, 2010.
  2. EN 50160: Voltage Characteristics of Electricity Supplied by Public Distribution Network; PKN: Warszawa, Polska, 2015.
  3. IEC 61000 4–30 Electromagnetic Compatibility (EMC)—Part 4–30: Testing and Measurement Techniques—Power Quality Measurement Methods; PKN: Warszawa, Polska, 2015.
  4. IEEE. Monitoring and Definition of Electric Power Quality; IEEE: Piscataway Township, NJ, USA, 2009. [Google Scholar]
  5. Jasiński, M.; Sikorski, T.; Borkowski, K. Clustering as a tool to support the assessment of power quality in electrical power networks with distributed generation in the mining industry. Electr. Power Syst. Res. 2019, 166, 52–60. [Google Scholar] [CrossRef]
  6. Bouchakour, S.; Arab, A.H.; Abdeladim, K.; Amrouche, S.O.; Semaoui, S.; Taghezouit, B.; Boulahchiche, S.; Razagui, A. Investigation of the voltage quality at PCC of grid connected PV system. Energy Procedia 2017, 141, 66–70. [Google Scholar] [CrossRef]
  7. Gała, M.; Jąderko, A. Assessment of the impact of photovoltaic system on the power quality in the distribution network. Prz. Elektrotech. 2018, 94, 162–165. [Google Scholar] [CrossRef]
  8. Grycan, W.; Brusilowicz, B.; Kupaj, M. Photovoltaic farm impact on parameters of power quality and the current legislation. Sol. Energy 2018, 165, 189–198. [Google Scholar] [CrossRef]
  9. Bogenrieder, J.; Glass, O.; Luchscheider, P.; Stegner, C.; Weller, J. Technical comparison of measures for voltage regulation in low-Voltage grids. In Proceedings of the 24th International Conference on Electricity Distribution, Glasgow, UK, 12–15 June 2017; pp. 1–5. [Google Scholar]
  10. Divshali, P.H.; Soder, L. Improving PV hosting capacity of distribution grids considering dynamic voltage characteristic. In Proceedings of the Power Systems Computation Conference (PSCC), Dublin, Ireland, 11–15 June 2018. [Google Scholar]
  11. Vojtek, M.; Kolcun, M.; Špes, M. Utilization of energy storages in low voltage grids with high penetration of photovoltaics—Addressing voltage issues. In Proceedings of the 2018 19th International Scientific Conference on Electric Power Engineering (EPE), Brno, Czech Republic, 16–18 May 2018. [Google Scholar]
  12. Ramljak, I.; Ramljak, I. PV plant connection in urban and rural LV grid: Comparison of voltage quality results. In Advanced Technologies, Systems, and Applications III; Springer: Berlin, Germany, 2018; pp. 271–278. [Google Scholar]
  13. Meyer, J.; Domagk, M.; Darda, T.; Eberl, G. Influence of aggregation intervals on power quality assessment according to EN 50160. In Proceedings of the 22nd International Conference and Exhibition on Electricity Distribution (CIRED 2013), Institution of Engineering and Technology, Stockholm, Sweden, 10–13 June 2013; p. 1174. [Google Scholar]
  14. Elphick, S.; Gosbell, V.; Perera, S. The effect of data aggregation interval on voltage results. In Proceedings of the 2007 Australasian Universities Power Engineering Conference, Perth, Australia, 9–12 December 2007; pp. 1–7. [Google Scholar]
  15. Jasiński, M.; Rezmer, J.; Sikorski, T.; Szymańda, J. Integration Monitoring of On-Grid Photovoltaic System: Case Study. Period. Polytech. Electr. Eng. Comput. Sci. 2019, 63, 99–105. [Google Scholar] [CrossRef]
  16. Statsoft Polska StatSoft Electronic Statistic Textbook. Available online: http://www.statsoft.pl/textbook/ stathome.html (accessed on 15 February 2019).
  17. Sikorski, T. Monitoring i Ocena Jakości Energii w Sieciach Elektroenergetycznych z Udziałem Generacji Rozproszonej; Oficyna Wydawnicza Politechniki Wrocławskiej: Wroclaw, Poland, 2013. (In Polish) [Google Scholar]
Figure 1. The diagram of investigated photovoltaic power plant with the assignment of rated power and photovoltaic (PV) technologies related to particular PV systems. Note: sc-Si—monocrystalline, mc-Si—multicrystalline, CdTe—Cadmium telluride cells, CIGS—Copper-Indium-Gallium-Diselenide, CC—connector cable, MSS—main switching station, MS—measuring system, PVSS—photovoltaic switching station.
Energies 12 03547 g001
Figure 2. Active power generation of observed PV power plant during selected week using 1 min and 10 min aggregation intervals.
Energies 12 03547 g002
Figure 3. Weather conditions during the selected week of observation using a 10 min aggregation interval.
Energies 12 03547 g003
Figure 4. Weather conditions during the selected week of observation using a 1 min aggregation interval.
Energies 12 03547 g004
Figure 5. Observability of voltage variations of the selected phase for different aggregation intervals at different solar irradiance levels.
Energies 12 03547 g005
Figure 6. Correlation diagrams for all pairs of parameters (PQ and weather) when 10 min aggregation interval is used. Note: 1—AtmP (air pressure), 2—Ta (ambient temperature), 3—RH (relative humidity), 4—WS (wind speed), 5—Gh (global horizontal irradiance), 6—Gd (diffuse horizontal irradiance), 7—UL1 (voltage variation L1), 8—UL2 (voltage variation L2), 9—UL3 (voltage variation L3), 10—PstL1 (short-term flicker severity L1), 11—PstL2 (short-term flicker severity L2), 12—PstL3 (short-term flicker severity L3), 13—ku2 (asymmetry), 14—THDuL1 (total harmonic distortion L1), 15—THDuL2 (total harmonic distortion L2), 16—THDuL3 (total harmonic distortion L3), 17—PL1 (active power change L1), 18—PL2 (active power change L2), 19—PL3 (active power change L3).
Energies 12 03547 g006
Figure 7. Correlation diagrams for all pairs of parameters (PQ and weather) when 1 min aggregation interval is used. Note: 1—AtmP (air pressure), 2—Ta (ambient temperature), 3—RH (relative humidity), 4—WS (wind speed), 5—Gh (global horizontal irradiance), 6—Gd (diffuse horizontal irradiance), 7—UL1 (voltage variation L1), 8—UL2 (voltage variation L2), 9—UL3 (voltage variation L3), 10—PstL1 (short-term flicker severity L1), 11—PstL2 (short-term flicker severity L2), 12—PstL3 (short-term flicker severity L3), 13—ku2 (asymmetry), 14—THDuL1 (total harmonic distortion L1), 15—THDuL2 (total harmonic distortion L2), 16—THDuL3 (total harmonic distortion L3), 17—PL1 (active power change L1), 18—PL2 (active power change L2), 19—PL3 (active power change L3).
Energies 12 03547 g007
Table 1. Comparison of permissible levels of power quality parameters in EN 50160:2010 [1] and EN 50160:2015 [2] for a 50 Hz system.
ParameterSymbolResolutionAcceptance Level
Standard EN 50160:2010 [1]Standard EN 50160:2015 [2]
Frequency variationf10 s49.5 to 50.5 Hz for 99.5% of measurement data set, 49.9 to 50.1 Hz for 100% of measurement data set
47 to 52 Hz for 100% of measurement data set
Voltage variationU10 min90 to 110% Uref for 95% of measurement data set,Not defined
85 to 110% Uref for 100% of measurement data set
1 minNot defined90 to 110% Uref for 100% of measurement data set
FlickerPst10 minNot defined1.2 for 95% of measurement data set
Plt2 h1 for 95% of measurement data set1 for 100% of measurement data set
Asymmetryku210 min2% for 95% of measurement data set,2% for 100% of measurement data set
3% in special localization
Total harmonic distortion in voltageTHDu10 min8% for 95% of measurement data set8% for 100% of measurement data set,
Mean value from all period of time lower than 5%
Harmonic h2–h50h2–h5010 minfor 95% of measurement data set:for 100% measurement data set:
6.0% for h5;6.0% for h5;
5.0% for h3, h7;5.0% for h3, h7;
3.5% for h11;3.5% for h11;
3.0% for h13;3.0% for h13;
2.0% for h2, h17;2.0% for h2, h17;
1.5% for h9, h19, h23, h25;1.5% for h9, h19, h23, h25;
1.0% for h4,1.0% for h4, h29, h31, h35, h37, h41, h43, h47, h49;
0.5% for h6, h8, h10, h12, h14, h15, h16, h18, h20, h21, h22, h24.0.5% for h6, h8, h10, h12, h14, h15, h16, h18, h20, h21, h22, h24, h26, h27, h28, h30, h32, h33, h34, h36, h38, h39, h40, h42, h44, h45, h46, h48, h50.
Table 2. Comparison of general results of the power quality assessment obtained using 50160:2010 [1] and 50160:2015 [2].
ParameterEN 50160:2010 [1]EN 50160:2015 [2]Comments
fMaximum frequency value 50.103 Hz
U-
Pst-Single values exceeded but for less than 95% of the time
Plt-
ku2-
THDu-
h2-h14-
h15h15 maximum value for L3 is 0.51 %
h16-h25-
h26-h50--
Table 3. Comparison of voltage variation parameters of 1 min and 10 min aggregation intervals.
Voltage Variations Parameters1 Min Aggregation10 Min Aggregation
L1L2L3L1L2L3
Mean value240.12238.83239.63240.12238.83239.63
Minimal value232.83230.01231.38234.00230.81232.73
Maximal value248.44249.90248.30246.10246.53247.31
Variation5.818.988.105.548.587.67
Standard deviation2.413.002.852.352.932.77
Median value239.86238.88239.60239.85238.85239.61
Table 4. Correlation level description [17].
Positive CorrelationNegative CorrelationCorrelation Level Description
r x y = 0 r x y = 0 No correlation
0 < r x y 0.1 0.1 r x y < 0 Slight correlation
0.1 < r x y 0.4 0.4 r x y < 0.1 Poor correlation
0.4 < r x y 0.7 0.7 r x y < 0.4 Noticeable correlation
0.7 < r x y 0.9 0.9 r x y < 0.7 High correlation
0.9 < r x y r x y < 0.9 Strong correlation
Table 5. Correlation matrix of power quality (PQ) and weather parameters for 10 min aggregated data.
12345678910111213141516171819
11.00
2−0.011.00
3−0.26−0.851.00
4−0.010.010.001.00
50.210.63−0.610.001.00
60.120.40−0.340.000.711.00
70.290.62−0.60−0.010.460.271.00
80.350.48−0.53−0.020.340.100.951.00
90.370.43−0.48−0.020.320.050.900.961.00
10−0.230.14−0.030.010.300.44−0.25−0.41−0.471.00
11−0.240.14−0.030.010.280.41−0.26−0.41−0.470.981.00
12−0.200.11−0.020.030.270.41−0.23−0.37−0.440.930.891.00
13−0.24−0.150.27−0.02−0.060.06−0.39−0.50−0.450.200.210.161.00
14−0.01−0.550.44−0.02−0.54−0.52−0.35−0.22−0.13−0.40−0.39−0.370.241.00
15−0.06−0.520.42−0.03−0.58−0.59−0.29−0.13−0.06−0.49−0.48−0.460.160.931.00
16−0.05−0.530.45−0.01−0.54−0.57−0.37−0.21−0.12−0.44−0.43−0.410.220.910.951.00
170.200.63−0.600.000.990.700.480.350.340.290.270.26−0.04−0.53−0.56−0.521.00
180.200.62−0.590.010.990.720.470.340.320.310.290.28−0.05−0.56−0.59−0.551.001.00
190.200.62−0.600.000.990.700.480.360.340.280.260.25−0.04−0.53−0.56−0.521.001.001.00
Note: 1—AtmP (air pressure), 2—Ta (ambient temperature), 3—RH (relative humidity), 4—WS (wind speed), 5—Gh (global horizontal irradiance), 6—Gd (diffuse horizontal irradiance), 7—UL1 (voltage variation L1), 8—UL2 (voltage variation L2), 9—UL3 (voltage variation L3), 10—PstL1 (short-term flicker severity L1), 11—PstL2 (short-term flicker severity L2), 12—PstL3 (short-term flicker severity L3), 13—ku2 (asymmetry), 14—THDuL1 (total harmonic distortion L1), 15—THDuL2 (total harmonic distortion L2), 16—THDuL3 (total harmonic distortion L3), 17—PL1 (active power change L1), 18—PL2 (active power change L2), 19—PL3 (active power change L3).
Table 6. Correlation matrix of PQ and weather parameters for 1 min aggregated data.
12345678910111213141516171819
11.00
2−0.011.00
3−0.26−0.851.00
4−0.010.010.001.00
50.200.60−0.590.001.00
60.120.39−0.340.000.691.00
70.280.60−0.58−0.010.460.271.00
80.350.47−0.51−0.020.350.110.951.00
90.360.41−0.47−0.020.330.060.900.961.00
10−0.170.10−0.030.020.230.34−0.20−0.31−0.341.00
11−0.180.09−0.010.020.210.32−0.21−0.32−0.360.981.00
12−0.170.09−0.020.020.230.34−0.20−0.31−0.350.950.941.00
13−0.22−0.140.25−0.01−0.050.04−0.32−0.44−0.380.110.130.121.00
14−0.02−0.520.41−0.02−0.50−0.48−0.31−0.19−0.11−0.29−0.28−0.290.211.00
15−0.06−0.500.40−0.02−0.54−0.56−0.27−0.11−0.05−0.35−0.34−0.350.140.911.00
16−0.05−0.520.43−0.01−0.50−0.55−0.35−0.19−0.11−0.32−0.31−0.330.200.880.931.00
170.200.60−0.580.000.970.690.480.370.350.220.210.22−0.04−0.49−0.53−0.491.00
180.190.60−0.570.000.970.700.480.360.340.240.220.23−0.04−0.51−0.56−0.521.001.00
190.200.60−0.580.000.970.690.490.370.360.220.200.22−0.04−0.49−0.52−0.491.001.001.00
Note: 1—AtmP (air pressure), 2—Ta (ambient temperature), 3—RH (relative humidity), 4—WS (wind speed), 5—Gh (global horizontal irradiance), 6—Gd (diffuse horizontal irradiance), 7—UL1 (voltage variation L1), 8—UL2 (voltage variation L2), 9—UL3 (voltage variation L3), 10—PstL1 (short-term flicker severity L1), 11—PstL2 (short-term flicker severity L2), 12—PstL3 (short-term flicker severity L3), 13—ku2 (asymmetry), 14—THDuL1 (total harmonic distortion L1), 15—THDuL2 (total harmonic distortion L2), 16—THDuL3 (total harmonic distortion L3), 17—PL1 (active power change L1), 18—PL2 (active power change L2), 19—PL3 (active power change L3).
Table 7. Matrix of differences between correlation coefficients obtained using 1 and 10 min aggregation intervals.
12345678910111213141516171819
10.00
20.000.00
30.000.000.00
40.000.000.000.00
50.010.020.020.000.00
60.000.000.000.000.020.00
70.010.020.020.000.000.000.00
80.010.010.010.00−0.010.000.000.00
90.010.010.020.00−0.01−0.010.000.010.00
100.060.040.010.000.070.100.050.100.120.00
110.060.050.020.000.070.090.040.090.120.000.00
120.030.020.000.010.040.070.030.060.08−0.02−0.050.00
130.030.010.020.010.000.020.060.060.070.090.080.040.00
140.000.030.020.000.050.030.040.030.020.110.120.090.030.00
150.000.020.010.010.040.030.020.020.010.150.150.110.020.020.00
160.000.010.010.000.040.020.020.010.010.120.120.080.020.030.020.00
170.010.020.020.000.020.02−0.01−0.01−0.020.060.060.040.010.040.030.030.00
180.010.020.020.000.020.02−0.01−0.02−0.020.070.070.050.010.040.040.030.000.00
190.010.020.020.000.020.02−0.01−0.01−0.020.060.060.040.010.040.030.030.000.000.00
Note: 1—AtmP (air pressure), 2—Ta (ambient temperature), 3—RH (relative humidity), 4—WS (wind speed), 5—Gh (global horizontal irradiance), 6—Gd (diffuse horizontal irradiance), 7—UL1 (voltage variation L1), 8—UL2 (voltage variation L2), 9—UL3 (voltage variation L3), 10—PstL1 (short-term flicker severity L1), 11—PstL2 (short-term flicker severity L2), 12—PstL3 (short-term flicker severity L3), 13—ku2 (asymmetry), 14—THDuL1 (total harmonic distortion L1), 15—THDuL2 (total harmonic distortion L2), 16—THDuL3 (total harmonic distortion L3), 17—PL1 (active power change L1), 18—PL2 (active power change L2), 19—PL3 (active power change L3).

