Article

Cooling Performance Enhancement of Air-Cooled Condensers by Guiding Air Flow

1
Key Laboratory of Condition Monitoring and Control for Power Plant Equipment, Ministry of Education, Beijing 102206, China
2
School of Energy Power and Mechanical Engineering, North China Electric Power University, Beijing 102206, China
*
Author to whom correspondence should be addressed.
Energies 2019, 12(18), 3503; https://doi.org/10.3390/en12183503
Submission received: 25 June 2019 / Revised: 5 September 2019 / Accepted: 8 September 2019 / Published: 11 September 2019

Abstract

:
Adverse wind effects on the thermo-flow performances of air-cooled condensers (ACCs) can be effectively restrained by wind-proof devices, such as air deflectors. Based on a 2 × 300 MW coal-fired power generation unit, two types (plane and arc) of air deflectors were installed beneath the peripheral fans to improve the ACC’s cooling performance. With and without air deflectors, the air velocity, temperature, and pressure fields near the ACCs were simulated and analyzed in various windy conditions. The total air mass flow rate and unit back pressure were calculated and compared. The results show that, with the guidance of deflectors, reverse flows are obviously suppressed in the upwind condenser cells under windy conditions, which is conducive to an increased mass flow rate and heat dissipation and, subsequently, introduces a favorable thermo-flow performance of the cooling system. When the wind speed increases, the leading flow effect of the air deflectors improves, and improvements in the ACC’s performance in the wind directions of 45° and −45° are more satisfactory. However, hot plume recirculation may impede performance when the wind direction is 0°. For all cases, air deflectors in an arc shape are recommended to restrain the disadvantageous wind effects.

1. Introduction

As one of the main cooling ends in the thermal power cycle, the direct dry cooling system is of great significance because of its energy-efficient operation of thermal power plants with a lack of water resources, by which the exhaust steam releases heat to ambient air via an air-cooled condenser (ACC). As the ACCs are exposed to the environment, their thermo-flow performances are susceptible to meteorological conditions, especially ambient wind [1].
Over the past decades, cooling performances of ACCs under various ambient conditions have been thoroughly investigated. On the basis of the response surface methodology, Butler et al. [2] numerically studied the unfavorable wind impacts on the cooling performance of a modular ACC, by which the optimal condenser configuration is predicted. By means of a numerical simulation with an actuator disk fan model, Hotchkiss et al. [3] clarified the off-axis airflow effects on the axial flow fan efficiency and power consumption. Yang et al. [4] found that the reverse flow near the upwind fans and hot air recirculation play inauspicious parts in the ACC’s cooling performance. Liu et al. [5] stated that the wind direction and speed both influence the hot air recirculation rate.
Multifarious measures against unfavorable meteorology have been proposed to improve the cooling performance of ACCs. Chen et al. [6] proposed a new V-frame layout of an ACC with an induced axial flow fan to improve the thermo-flow performances because of the weakened, disadvantageous wind effects. By using the grey difference incremental correlation method, Li et al. [7] analyzed the influence of fan rotational speed on the heat rejection distribution of ACCs under windy conditions, and they concluded that the unit back pressure can be lessened by adjusting the corresponding fans speed. Jin et al. [8] recommended a square arrangement of ACCs to restrain both the hot air recirculation and reverse flow in the presence of wind. Chen et al. [9] suggested vertically arranged ACCs to recede the fan inlet flow distortions and reverse flows. Because of the uneven temperature and flow distributions near the ACCs, Zhou et al. [10] proposed truncated cone-shaped ACCs with a lateral air supplement to improve the cooling performance. Darbandi et al. [11] concluded that the cooling performance of ACCs can be improved by tuning the fan blade pitch angles suitably under off-design conditions.
What is more, some auxiliary devices have also attracted wide attention. Zhang and Wu [12] recommended a diffuser orifice plate under the ACC platform to cripple adverse crosswind effects, by which the variable field distribution becomes more uniform, and, subsequently, heat transfer is enhanced. By means of numerical simulations, Gu et al. [13] investigated the roof wind-proof structure effect on ACC performance in windy conditions, finding that hot plume recirculation can be reduced by a windbreak line screen. Gao et al. [14] suggested using deflecting plates in the ACC to introduce more uniform airflow fields. Yang et al. [15] put forward three wind-proof device configurations to reduce unfavorable wind effects, and they suggested using flow leading devices below the fan platform to recover the performance of the peripheral ACCs. Zhang and Chen [16] suggested a wind-proof mesh arranged outside the fan platform bridge to improve ACC performance under windy conditions. Xu et al. [17] suggested spray freezing the phase change materials to improve the performance of ACCs, and they found the net turbine power output increased by 2.2%. Huang et al. [18] investigated the impacts of deflector installation and geometry parameters on the performance improvement of ACCs under windy and windless conditions.
The literature review shows that the performance of ACCs, especially the windward ones, can be improved by using windproof devices, such as air deflectors. However, some issues still remain obscure. Firstly, most of the previous work was carried out under windy conditions in a specific wind direction. But, the wind direction can dramatically affect ACC performance [4]. Although several wind directions were taken into account in the literature [14], the ACCs were isolated from the main buildings, such as the boiler and turbine houses, which is impractical because of the significant influences of main buildings on ACC performance under windy conditions [4,5]. In addition, the variation in hot air recirculation with air deflectors was rarely mentioned in previous work. Therefore, it is of necessity to carry out further research to clarify the impacts of air deflectors on the performance of ACC, including the hot air recirculation, in various wind directions. Moreover, the aforementioned deflectors focused on plate patterns, and few investigations of an arc air deflector were developed. But, compared to the plate air deflectors, the arc ones can provide a larger flow-deviation angle to surpass the off-axial airflow.
To offset the weaknesses of previous work, air deflectors in an arc shape are proposed and installed under the peripheral fan platform. Under windless and windy conditions in various wind directions, the ACC’s thermal-flow characteristics with and without air deflectors are numerically investigated and compared, by using the commercial software Fluent, and are also compared to the results with plate air deflectors. The comparisons of results in different wind directions are developed, and the influences of air deflectors on hot air recirculation are discussed accordingly.

2. Numerical Modeling
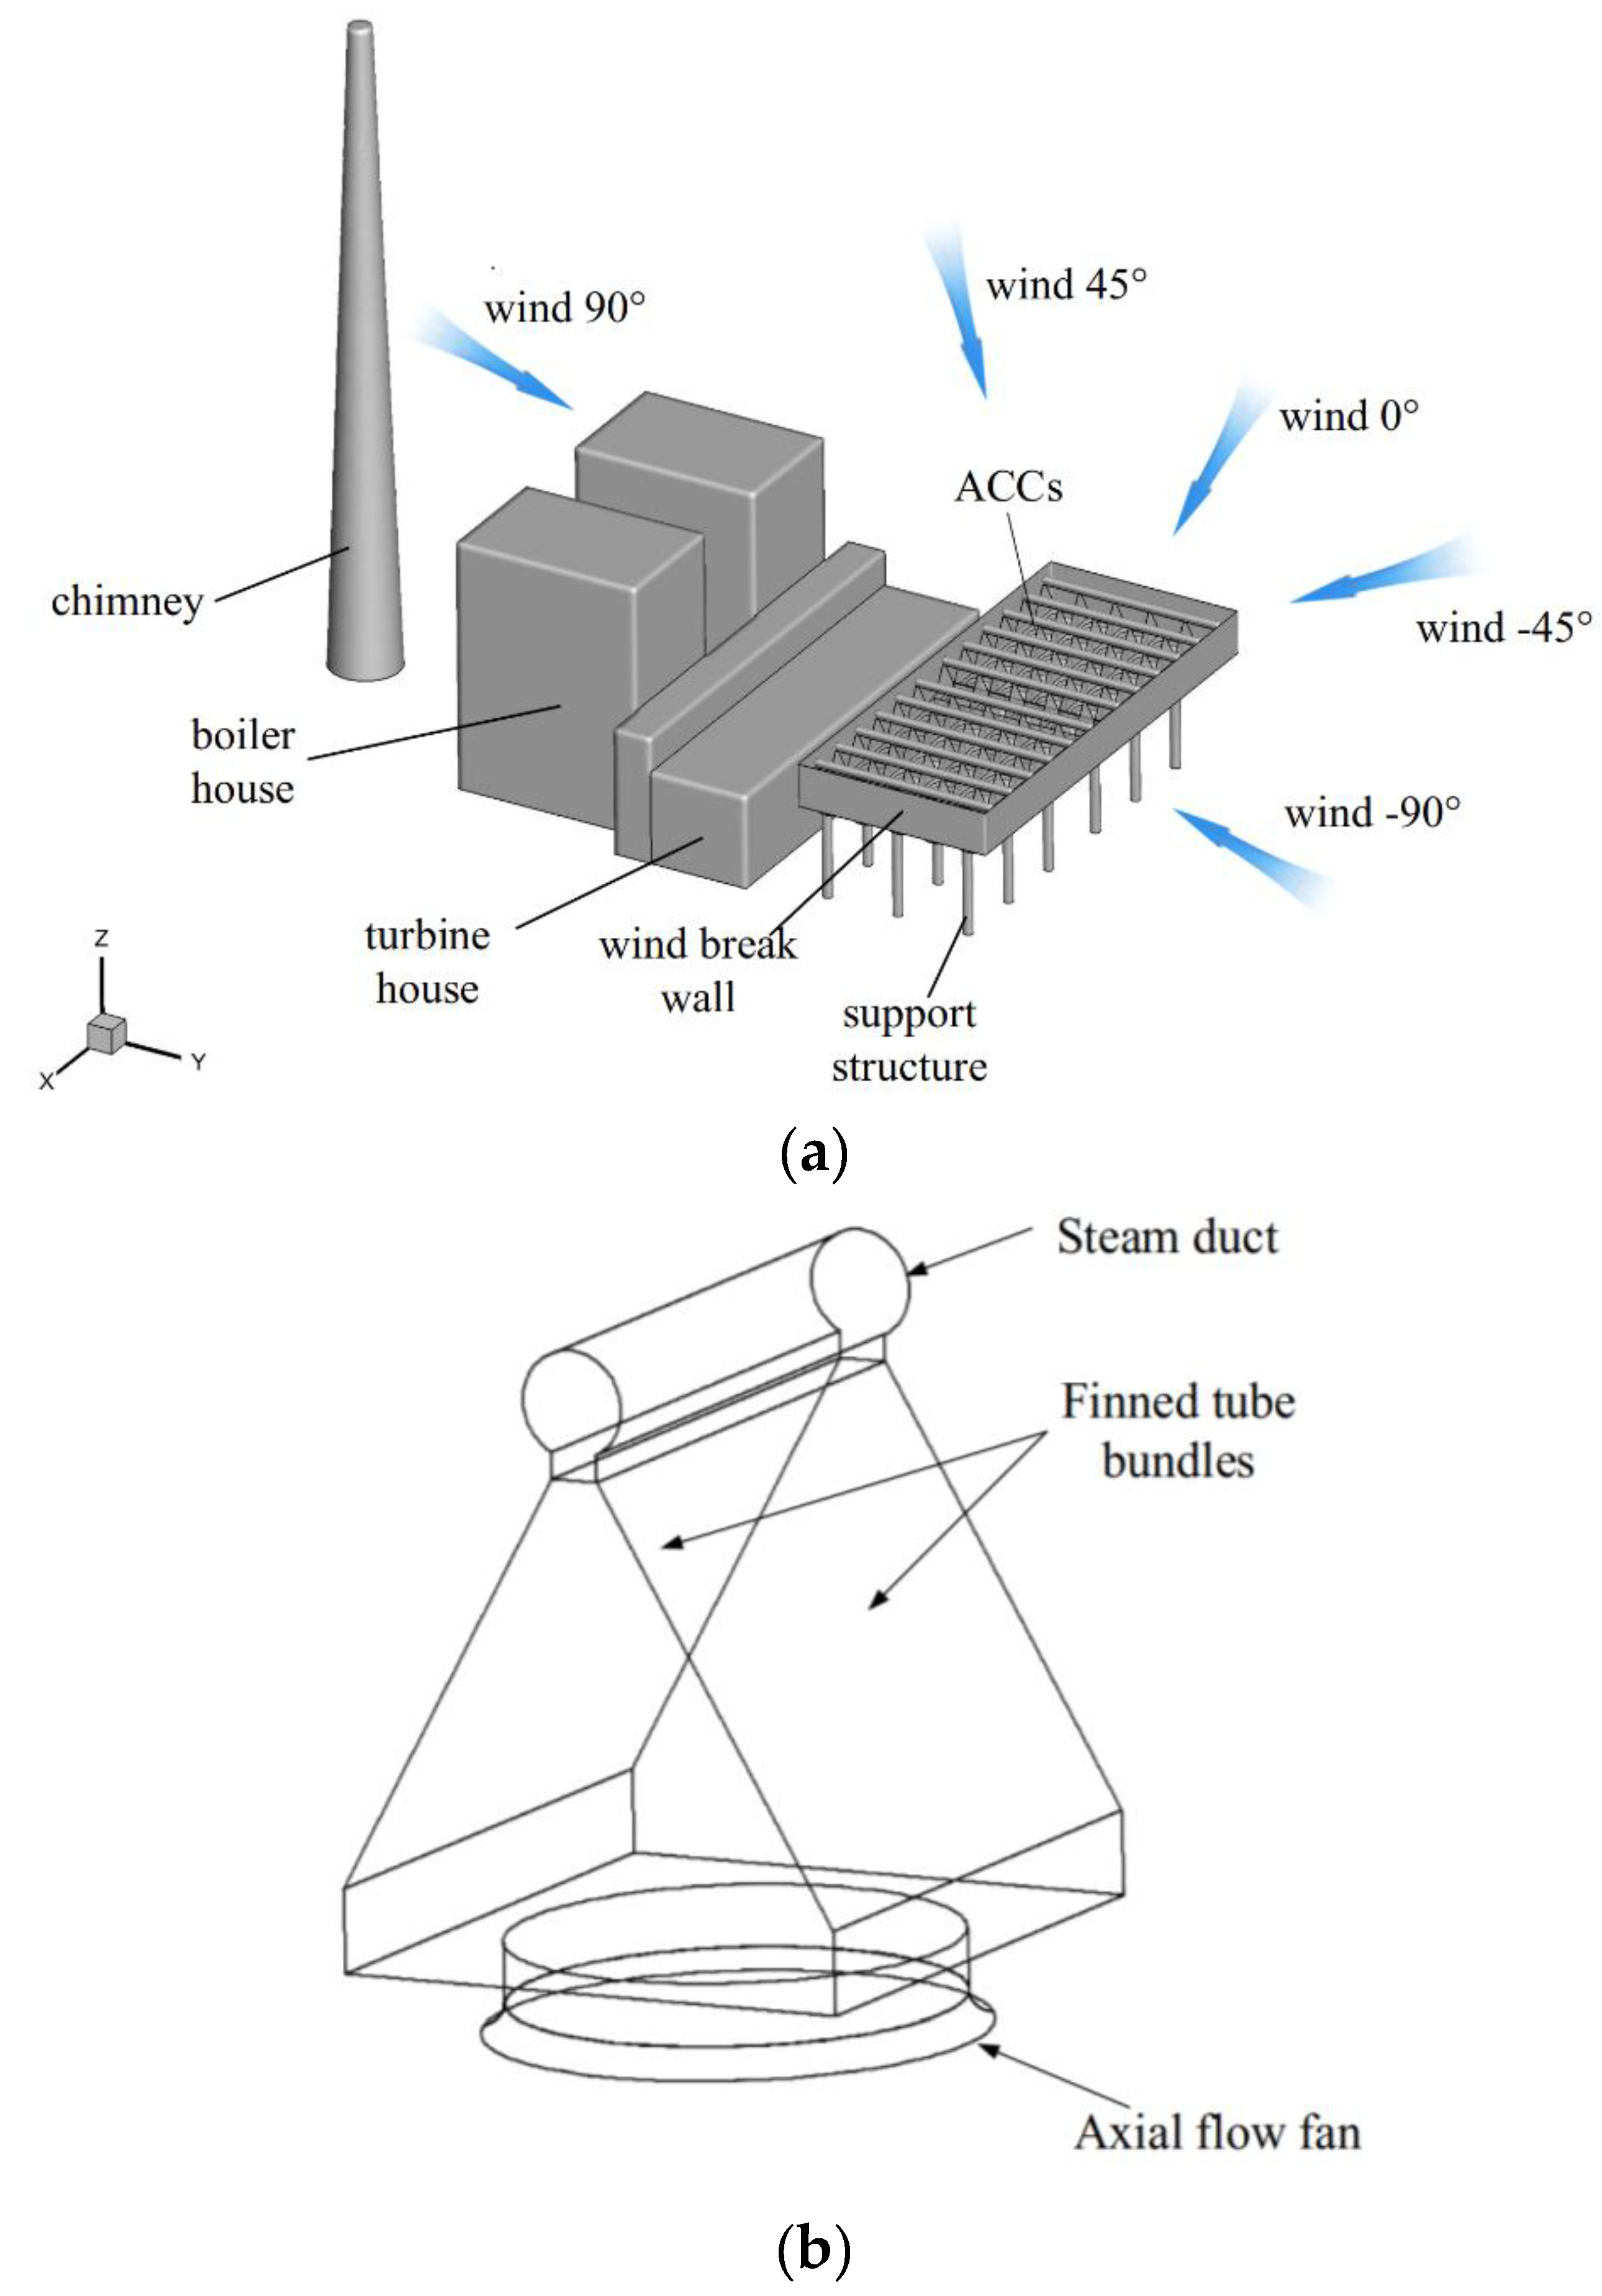
2.1. Physical Model

The direct dry cooling system employed in a typical 2 × 300 MW power generation unit consists of two units of ACCs, and each has 30 (5 × 6) condenser cells with a rectangular layout, as depicted in Figure 1a. Thanks to the symmetric configuration of the power plant, five representative wind directions, ranging from −90° to 90°, are taken into consideration, of which the interval was 45°. The main buildings such as the boiler, turbine houses, and chimney were taken into account, but the other constructions were ignored. Each ACC contained two crossed, wave-finned, flat tube bundles with an axial flow fan below them, as shown in Figure 1b. The arrangement of the ACCs and air deflectors are presented in Figure 2a, where the air deflectors are arranged below the peripheral ACCs. As shown in Figure 2b, the condenser cells are numbered from 1 to 5 in the rows and 1 to 12 in the columns. Figure 2c gives the geometry and location details of air deflectors, shaped in plane or arc patterns, and installed below the steel support of the peripheral ACCs. The arc deflector was in the shape of a quarter-circle, and its chord was just the plane deflector with a width of 5 m and an inclination angle of 45°. To eliminate the unrealistic influence of the domain borders on the airflow fields, it was necessary to develop a large enough computational domain with a size of 2000 × 2000 × 950 m, as displayed in Figure 3.

2.2. Mathematical Model

The steady-state conversation equations for the ACCs are provided in Equation (1) [19,20].
ρ v φ = ( Γ φ φ ) + S φ + S φ
The variable φ takes different values for various equations, such as continuity, energy equations, and so on, with the detailed information listed in Table 1.
The condensation of exhaust steam in the finned tube bundles is regarded as an isobaric and isothermal process. For saving numerical resources, the radiator model was employed to calculate the heat transfer between the air and finned tube bundles. Meanwhile, the air side pressure drop was Δp determined by the following expression [20]:
Δ p = k L 1 2 ρ v f 2
where vf is the radiator surface normal air velocity. kL is the loss coefficient as follows [20]:
k L = n = 1 N r n v f n 1
where N and rn take the same values as in Reference [18].
The heat rejection of the finned tube bundles is formed by the following expression [20]
q = h ( t wall t a )
However, another expression is applied to obtain the heat flux in the radiator model, as follows [7]
q = h ( t wall t a 2 ) = h ( t s t a 2 )
where ta2 is the radiator outlet temperature, and ts is the exhaust steam temperature. For the very small resistance of wall conduction and steam condensation, twall takes the value of ts. The empirical convection heat transfer coefficient h’ is calculated by the following expression [20]:
h = n = 1 N h n v f n 1
where N and hn take the same values as in Reference [18].
The additional source items caused by finned tube bundles are reflected on the energy term Se and momentum sink term Sm [7,8]
S m = Δ p j L j
S e = q j L j ,
where Lj, Δpj, and qj are the finned tube bundles’ thickness, pressure drop, and heat rejection rate in three dimensions, respectively.
The airflow pressure rise caused by the axial flow fan can be obtained by the following expression [20]:
Δ p = n = 1 N f n v f n 1
where vf is the air velocity normal to the fan surface, and fn is the polynomial coefficient with the same value as in Reference [18].
Fan radial velocity played an insignificant part in aerodynamic performance during the 3-D simulation, so it can be neglected. But the tangential velocity ought to be taken into consideration to generate swirl flows, with the following expression [20].
v θ = n = 1 N g n r n
where polynomial coefficient gn takes the same value as in Reference [18].
Figure 3 gives the boundary conditions without and with wind. In the windless condition, as depicted in Figure 3a, the pressure inlet boundary was employed in four side planes, while the top plane was set as the pressure outlet boundary. For the windy condition, as depicted in Figure 3b, where the representative wind direction was set as −45°, the velocity inlet boundary was used to deal with the windward surface, by which the wind speed vz along the z-direction is calculated by Equation (11) [16,21].
v z = v w ( z 10 ) 0.2
The relevant walls of the ground, wind-break, condenser cell, and fan shell were handled by adiabatic and no-slip wall boundaries. For both windy and windless cases, the ambient temperature was set as 306.15 K.
The SIMPLE algorithm was utilized to handle the coupling of airflow velocity and pressure iterations. The central and second-order upwind differencing schemes were employed to discretize the diffusion and convective items in conversation equations, respectively. The divergence-free criteria of scaled residuals for energy and other conservation equations were set as 10−4 and 10−6, respectively. Furthermore, the mass flow rate through the ACCs was additionally adopted to monitor reasonable convergence.
The cooling performance of ACCs, as well as the unit back pressure, varies with the operation conditions; therefore, an iterative procedure was developed to obtain the final unit back pressure under off-design conditions. During the iteration, the mass flow rate of exhaust steam (ms) is regarded as a constant, so that the enthalpy drop of the exhaust steam will be obtained with an assumed initial unit back pressure. Subsequently, the heat Φ released from the exhaust steam in the ACCs can be computed with the following form [10]
Φ = m s ( h s h w a )
where hs and ms are the enthalpy and flow rate of exhaust steam. hwa is the enthalpy of the condensate water. After computational fluid dynamics (CFD) simulation, the simulated heat transfer rate Φ’ of the ACCs is gained. If the relative error between Φ’ and Φ is inferior to 0.1%, the presumptive unit back pressure can be accepted, and the iterations are completed. Otherwise, the procedure should restart with a new assumed unit back pressure.

2.3. Grid System and Independence Check

The whole domain was split into two zones: the central zone and the surrounding zone. The ACCs and main buildings formed the central zone, for which the tetrahedral unstructured meshes were adopted. For the surrounding zone, the hexahedral structured meshes were produced. During the mesh independence check, three grid systems with mesh sizes of 0.25, 0.5, and 1 m were, respectively, applied to the key regions such as the finned tube bundles, fans, and windbreak wall. Without air deflectors, the total grid numbers of 3,052,476, 3,916,851, and 4,854,866 for the whole domain were checked. Table 2 shows the mesh check results when the wind speed and wind direction were equal to 4 m/s and −45°, where mesh 1, 2, and 3 stand for the above three mesh systems, respectively. The air mass flow rate through each fan was monitored. The mesh 2 grid system with a mesh number of 3,916,851 was adopted according to the contrast results. In the mesh 2 grid system, besides the mesh interval size for the key regions, the interval size of 2 m was applied to the other main buildings. In the surrounding zone, a hexahedral structured mesh was adopted with a proper increasing mesh interval from the central zone, so that fewer meshes were generated to balance the requirements both for the computational accuracy and cost. Subsequently, the grid numbers for the systems with the plane and arc deflectors were obtained, respectively, as 4,948,386 and 5,016,868, in which the grid size interval of the air deflector was also set to 0.5 m.

2.4. Experimental Validation

In a real power generation unit with a dry cooling system, the whole ACC is extremely complex with a large-scale structure, so it is hard to achieve the performances of ACCs based on model tests. As an alternative way, field measurements have been used to study the ACC heat transfer and flow features. In our previous works, a spot test for the ACCs in a 4 × 600 MW power generation unit was performed [4,22], by which a typical condenser cell inlet air temperature was measured on the condition of full-power output. According to the geometry configuration of the ACCs and ambient conditions, a 3-D simulation was established and carried out. Figure 4 shows the simulated and experimental inlet air temperatures, both of which exceeded the environment temperature and were very close to each other. Further, another scaled model test of a single condenser cell for a 600 MW power plant was carried out [23]. Table 3 lists the comparison results between the simulation and test results. For the heat transfer rate, the average and maximum values of the relative error were 7.19% and 10.57%, respectively, which can be allowed in actual projects. In this work, the numerical and modeling ways were just the same as those taken by the numerical simulations above, indicating, indirectly, that the simulation approaches can accurately predict the thermal-flow performances of the current ACC.

3. Results

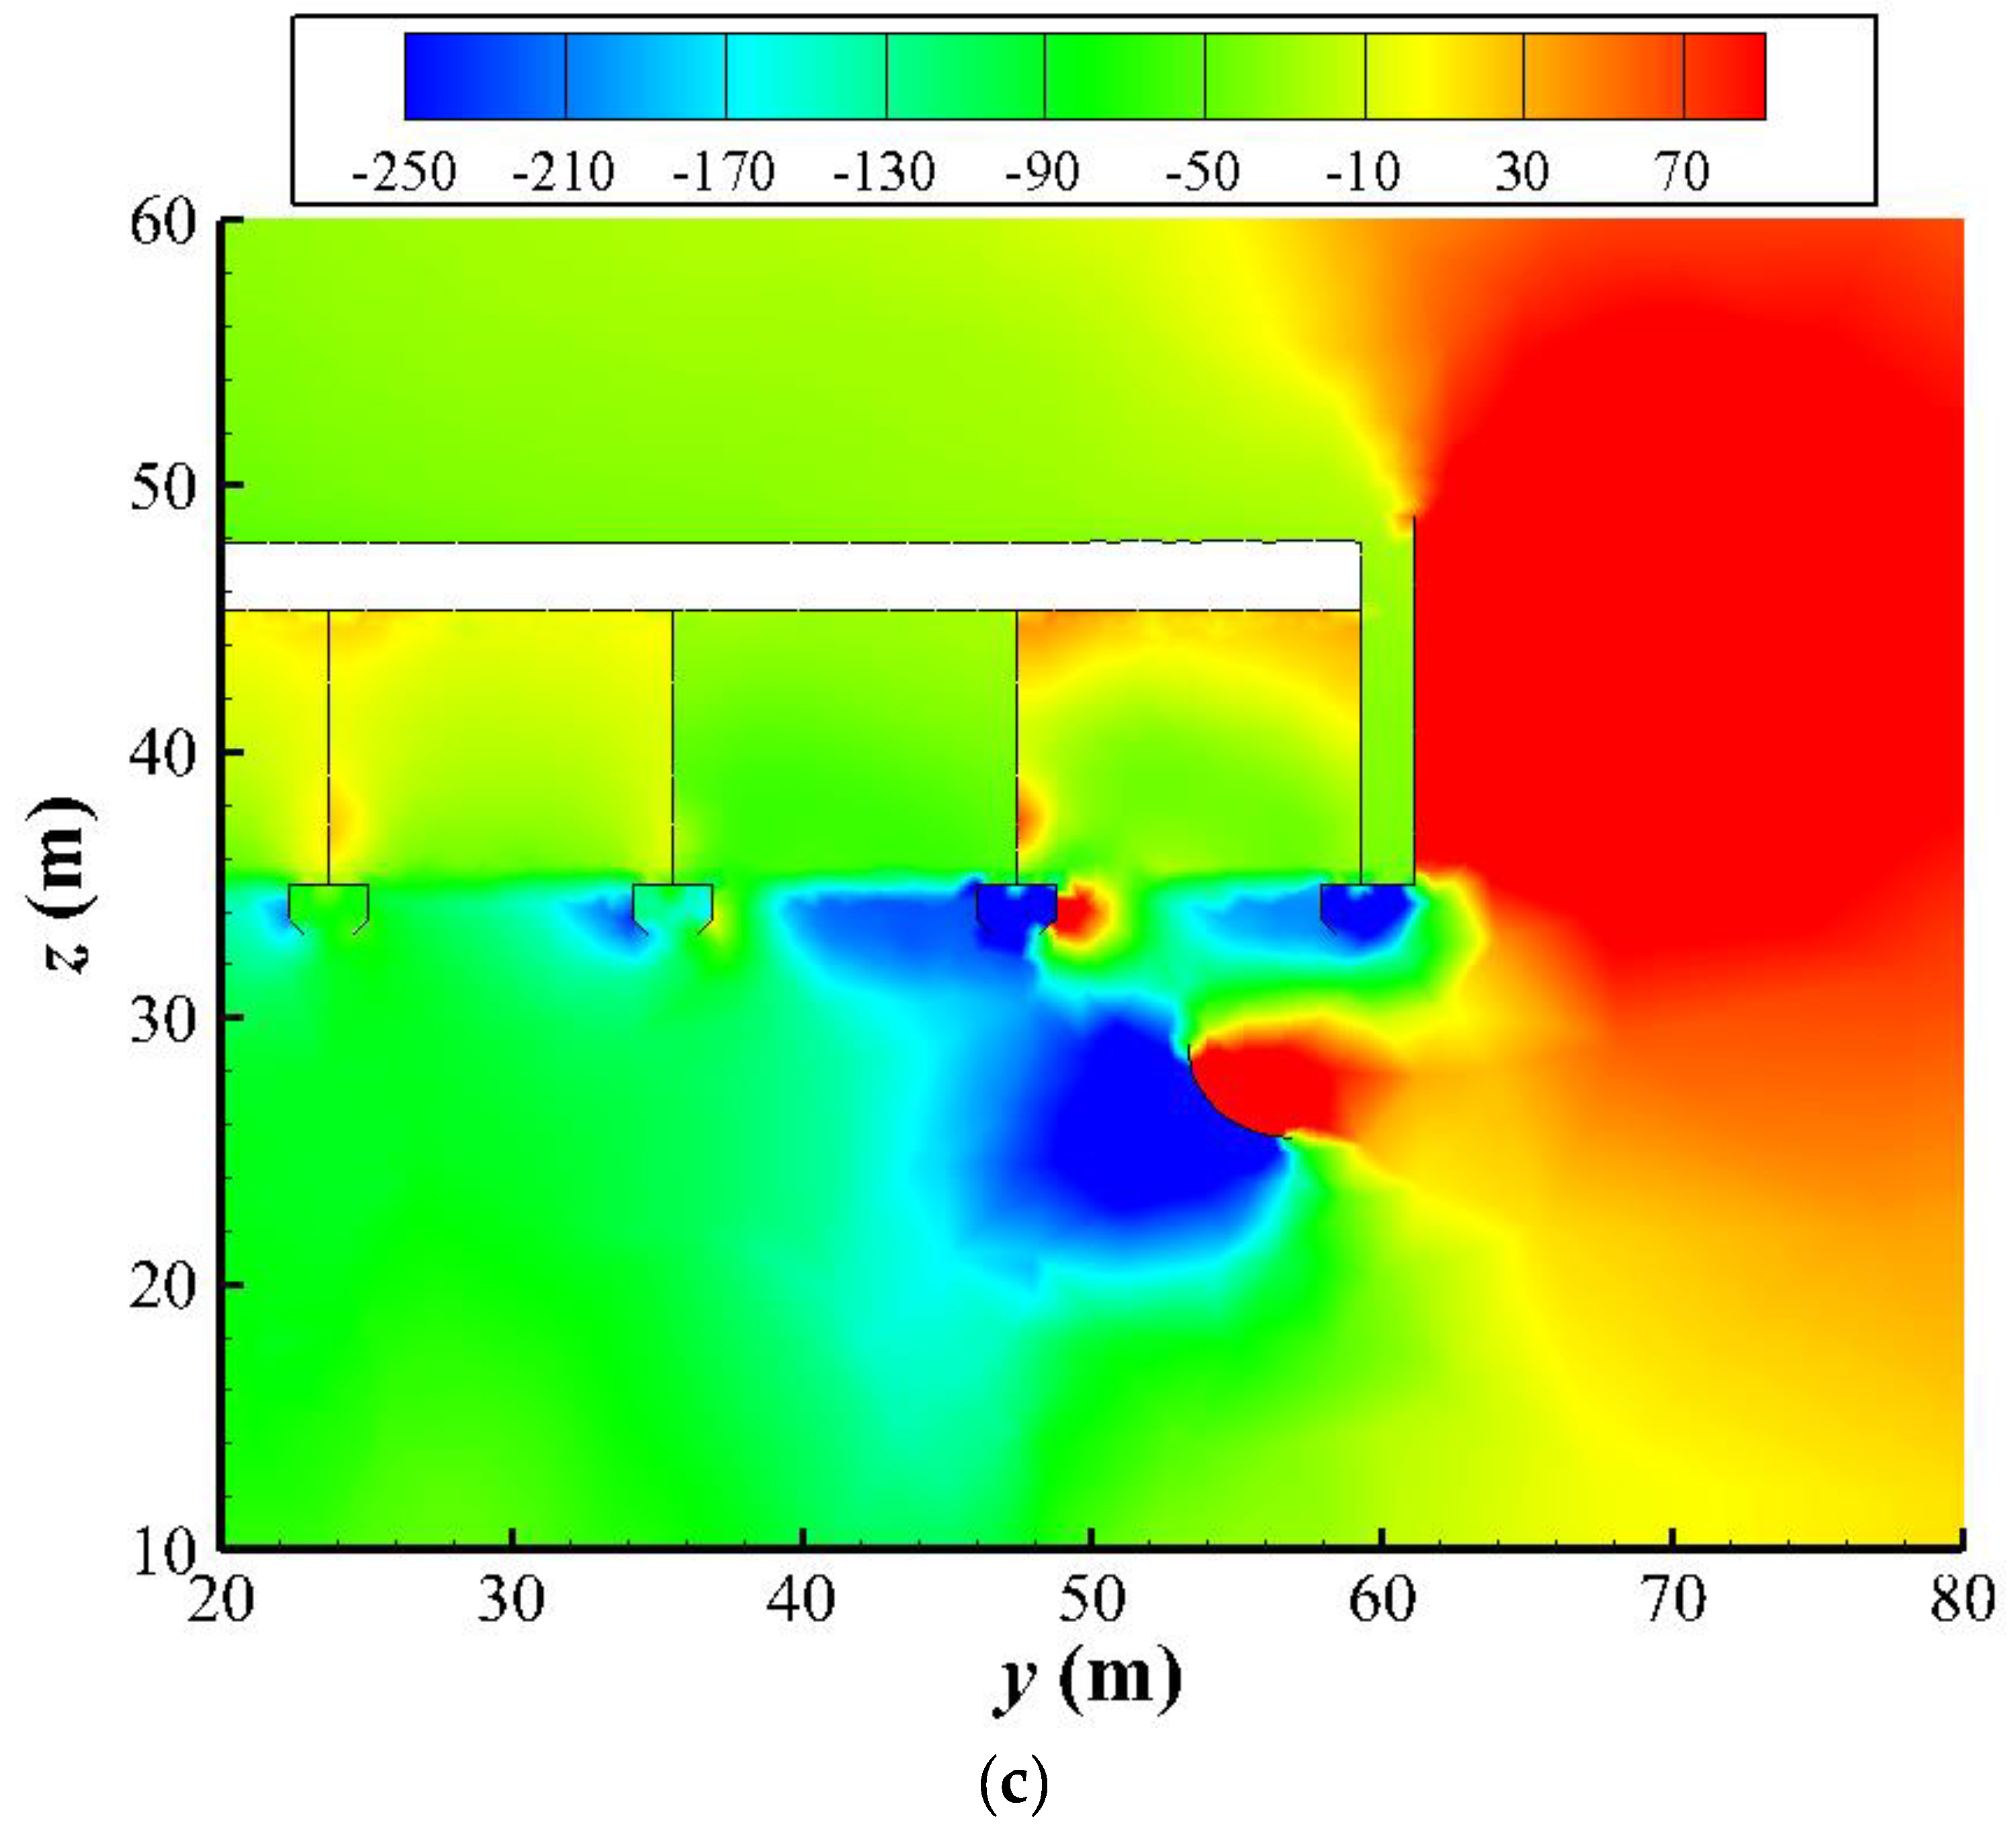
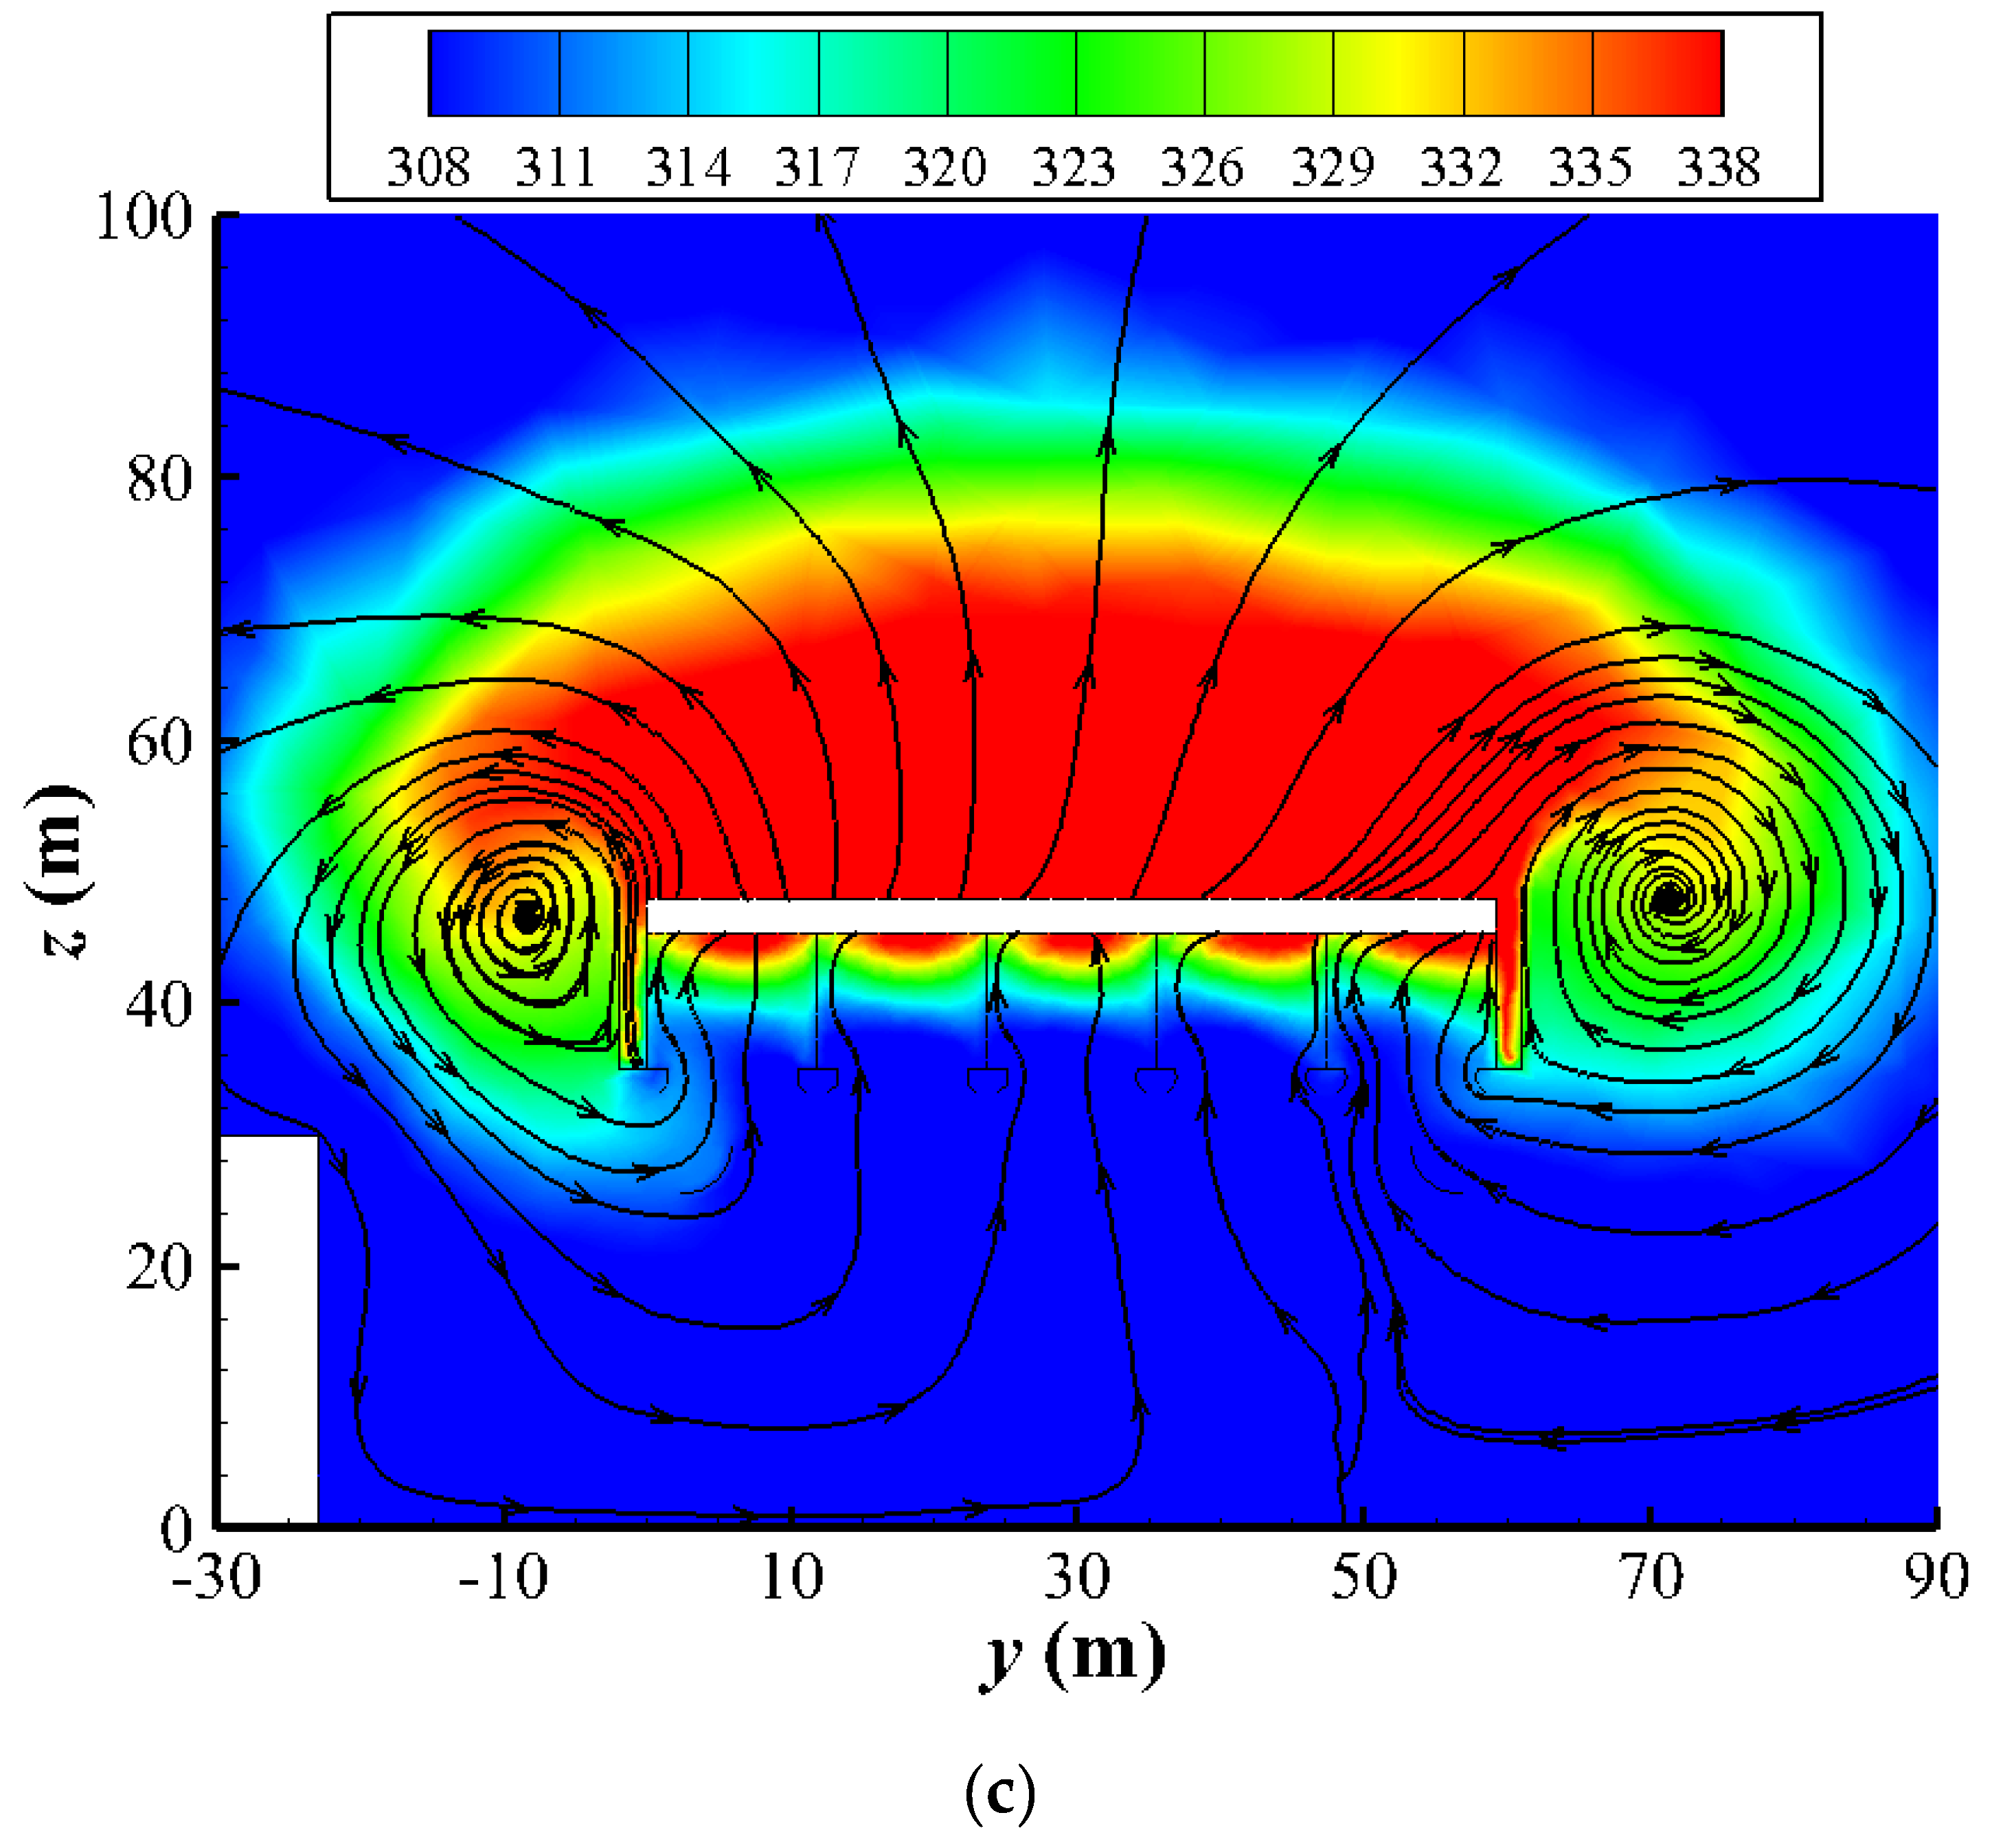
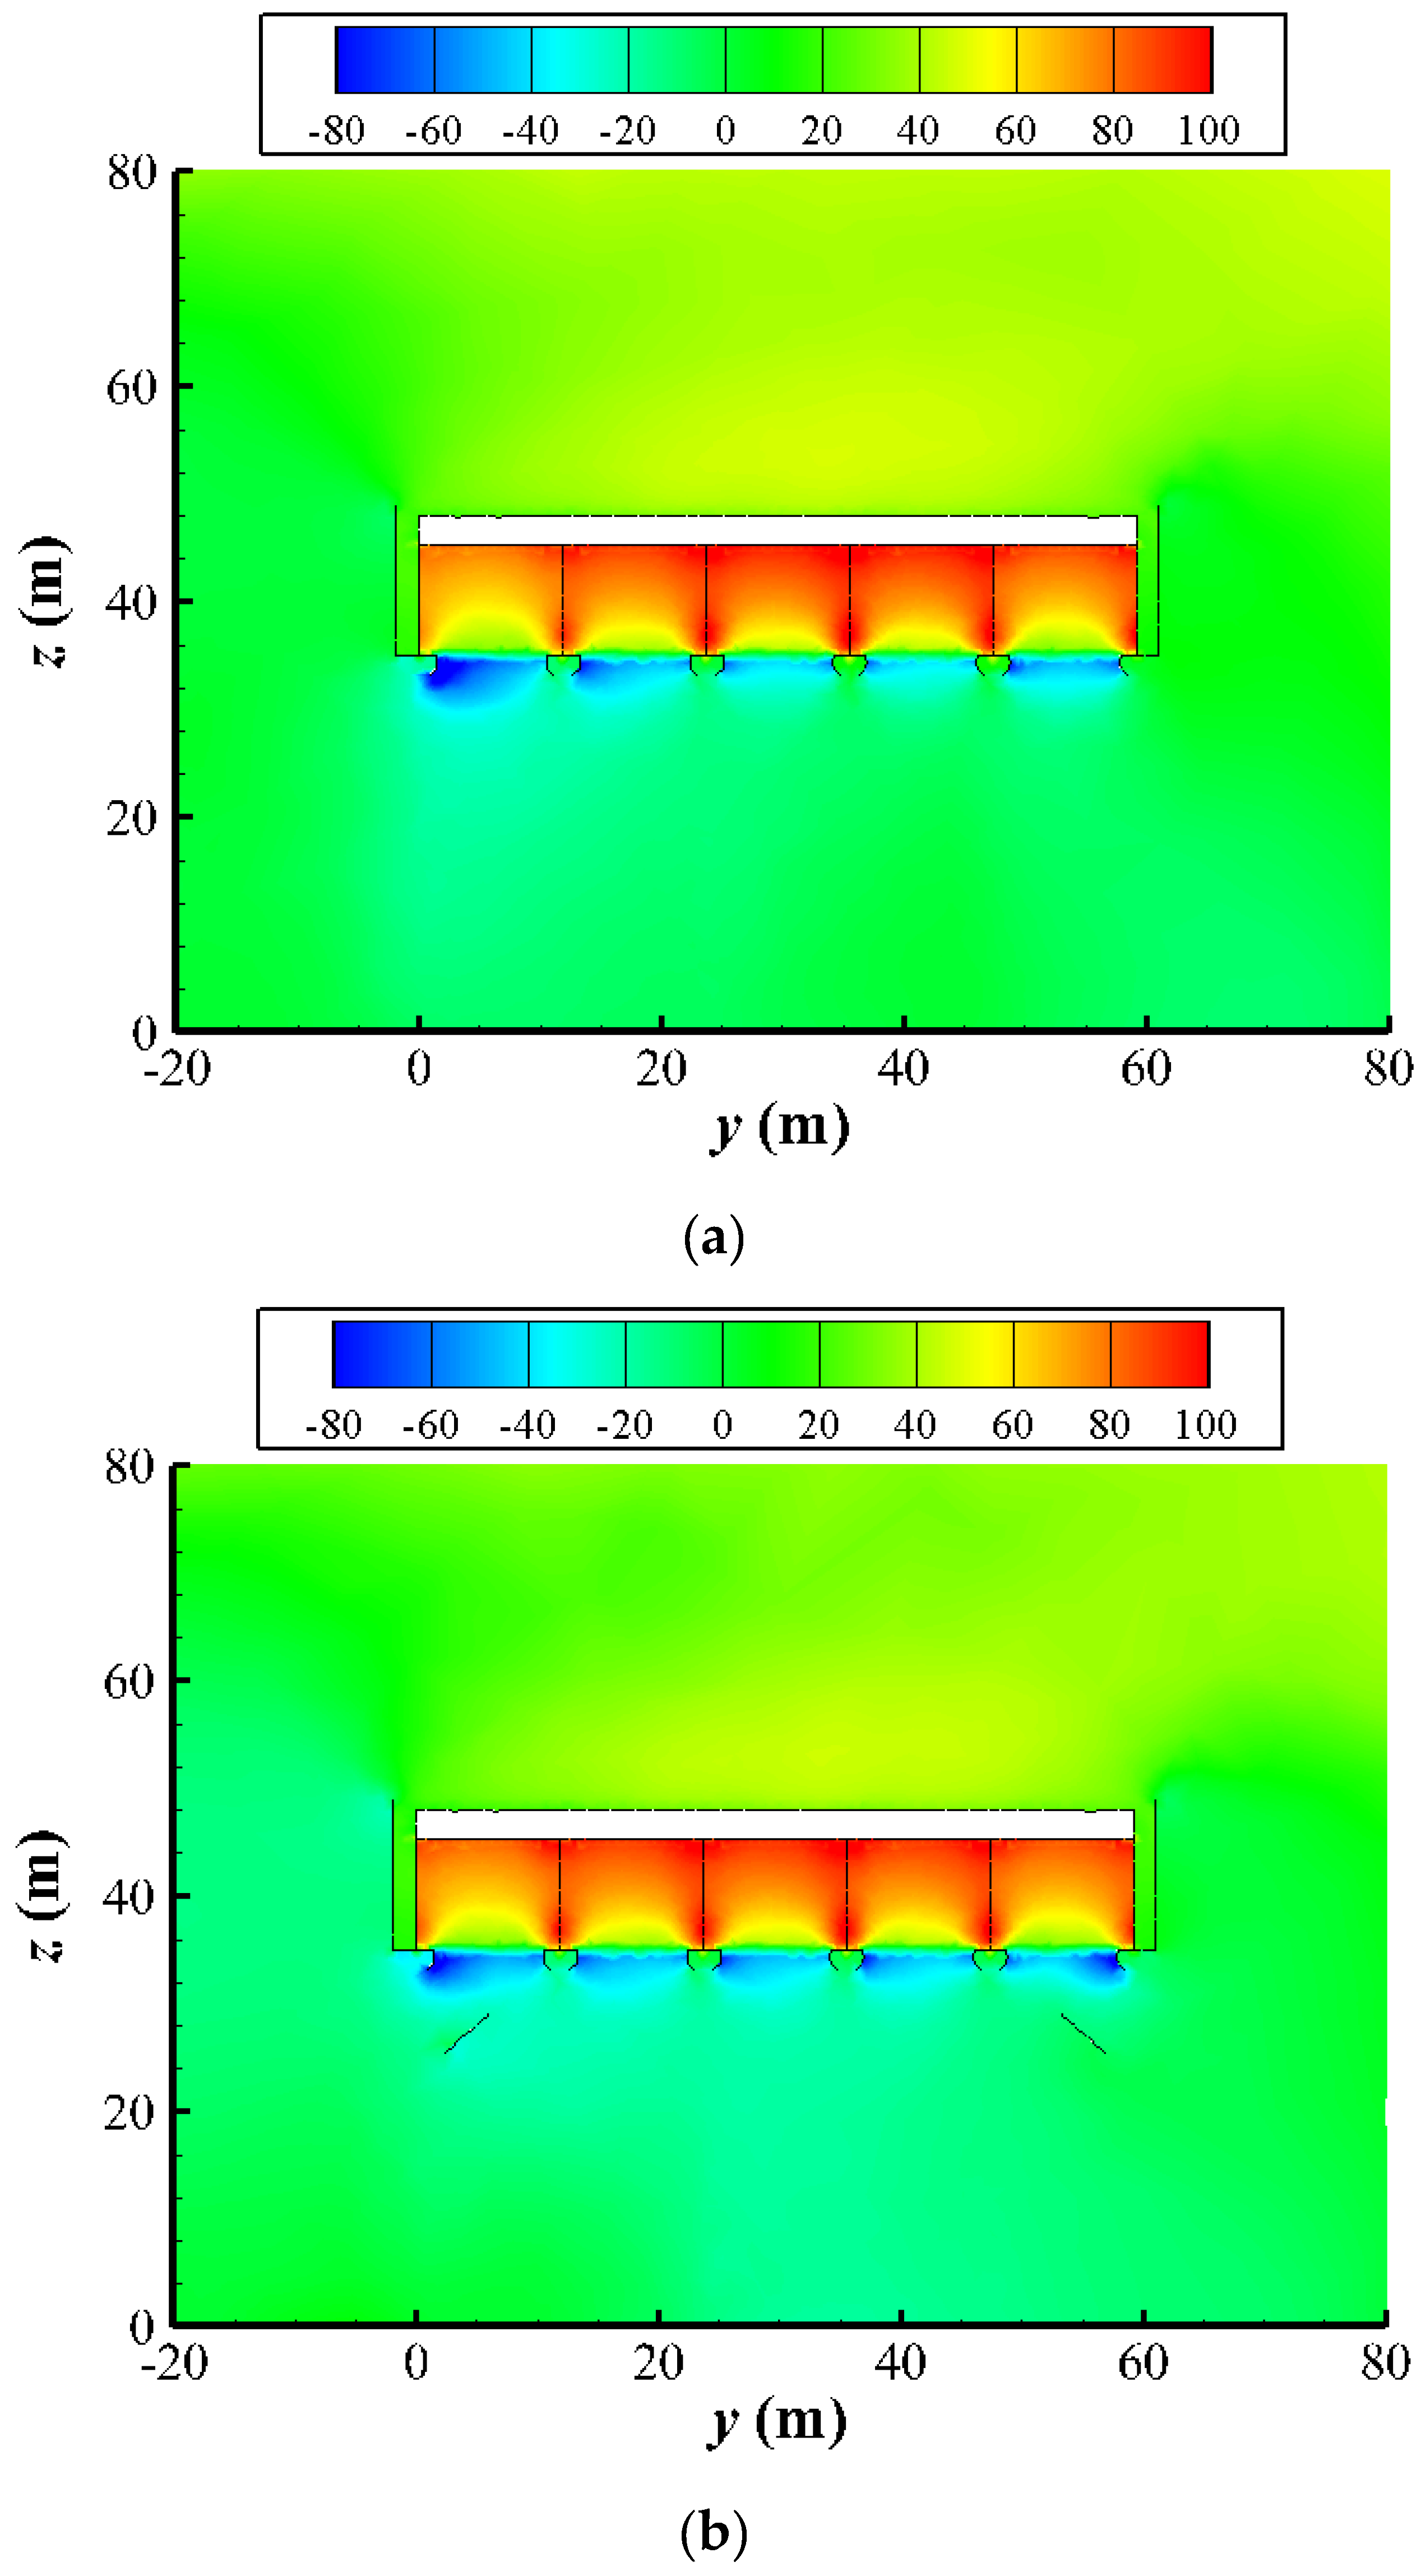
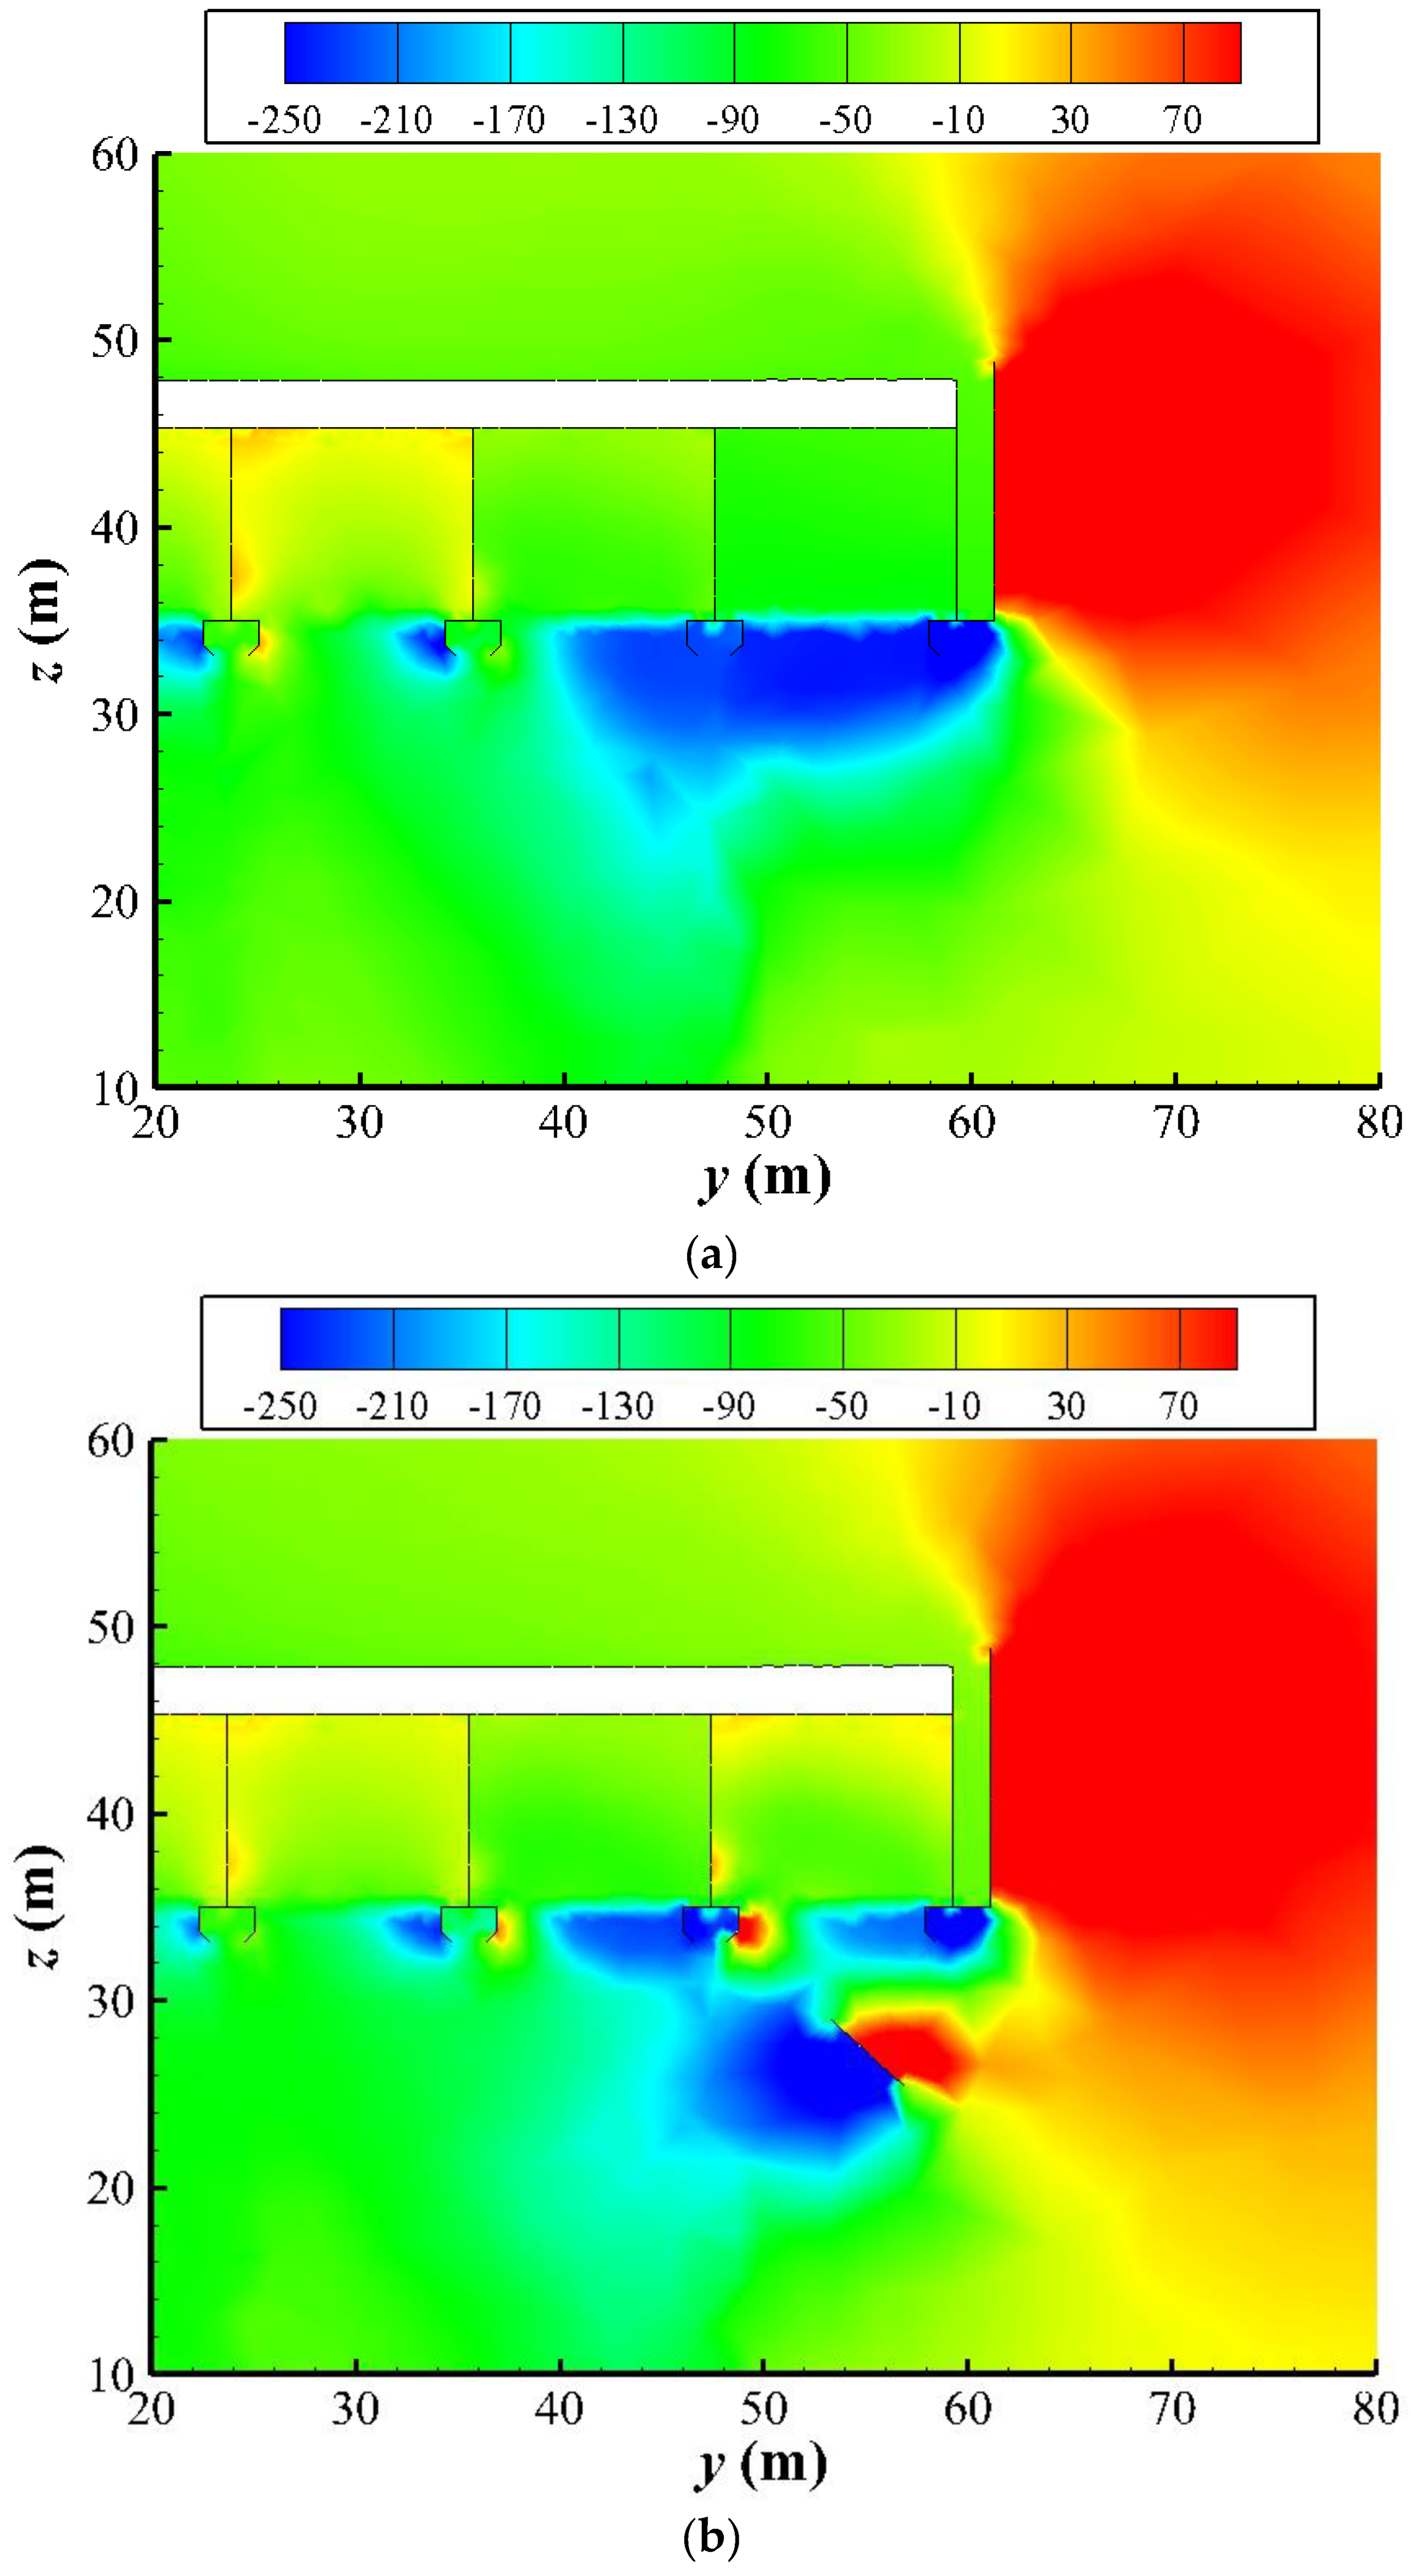
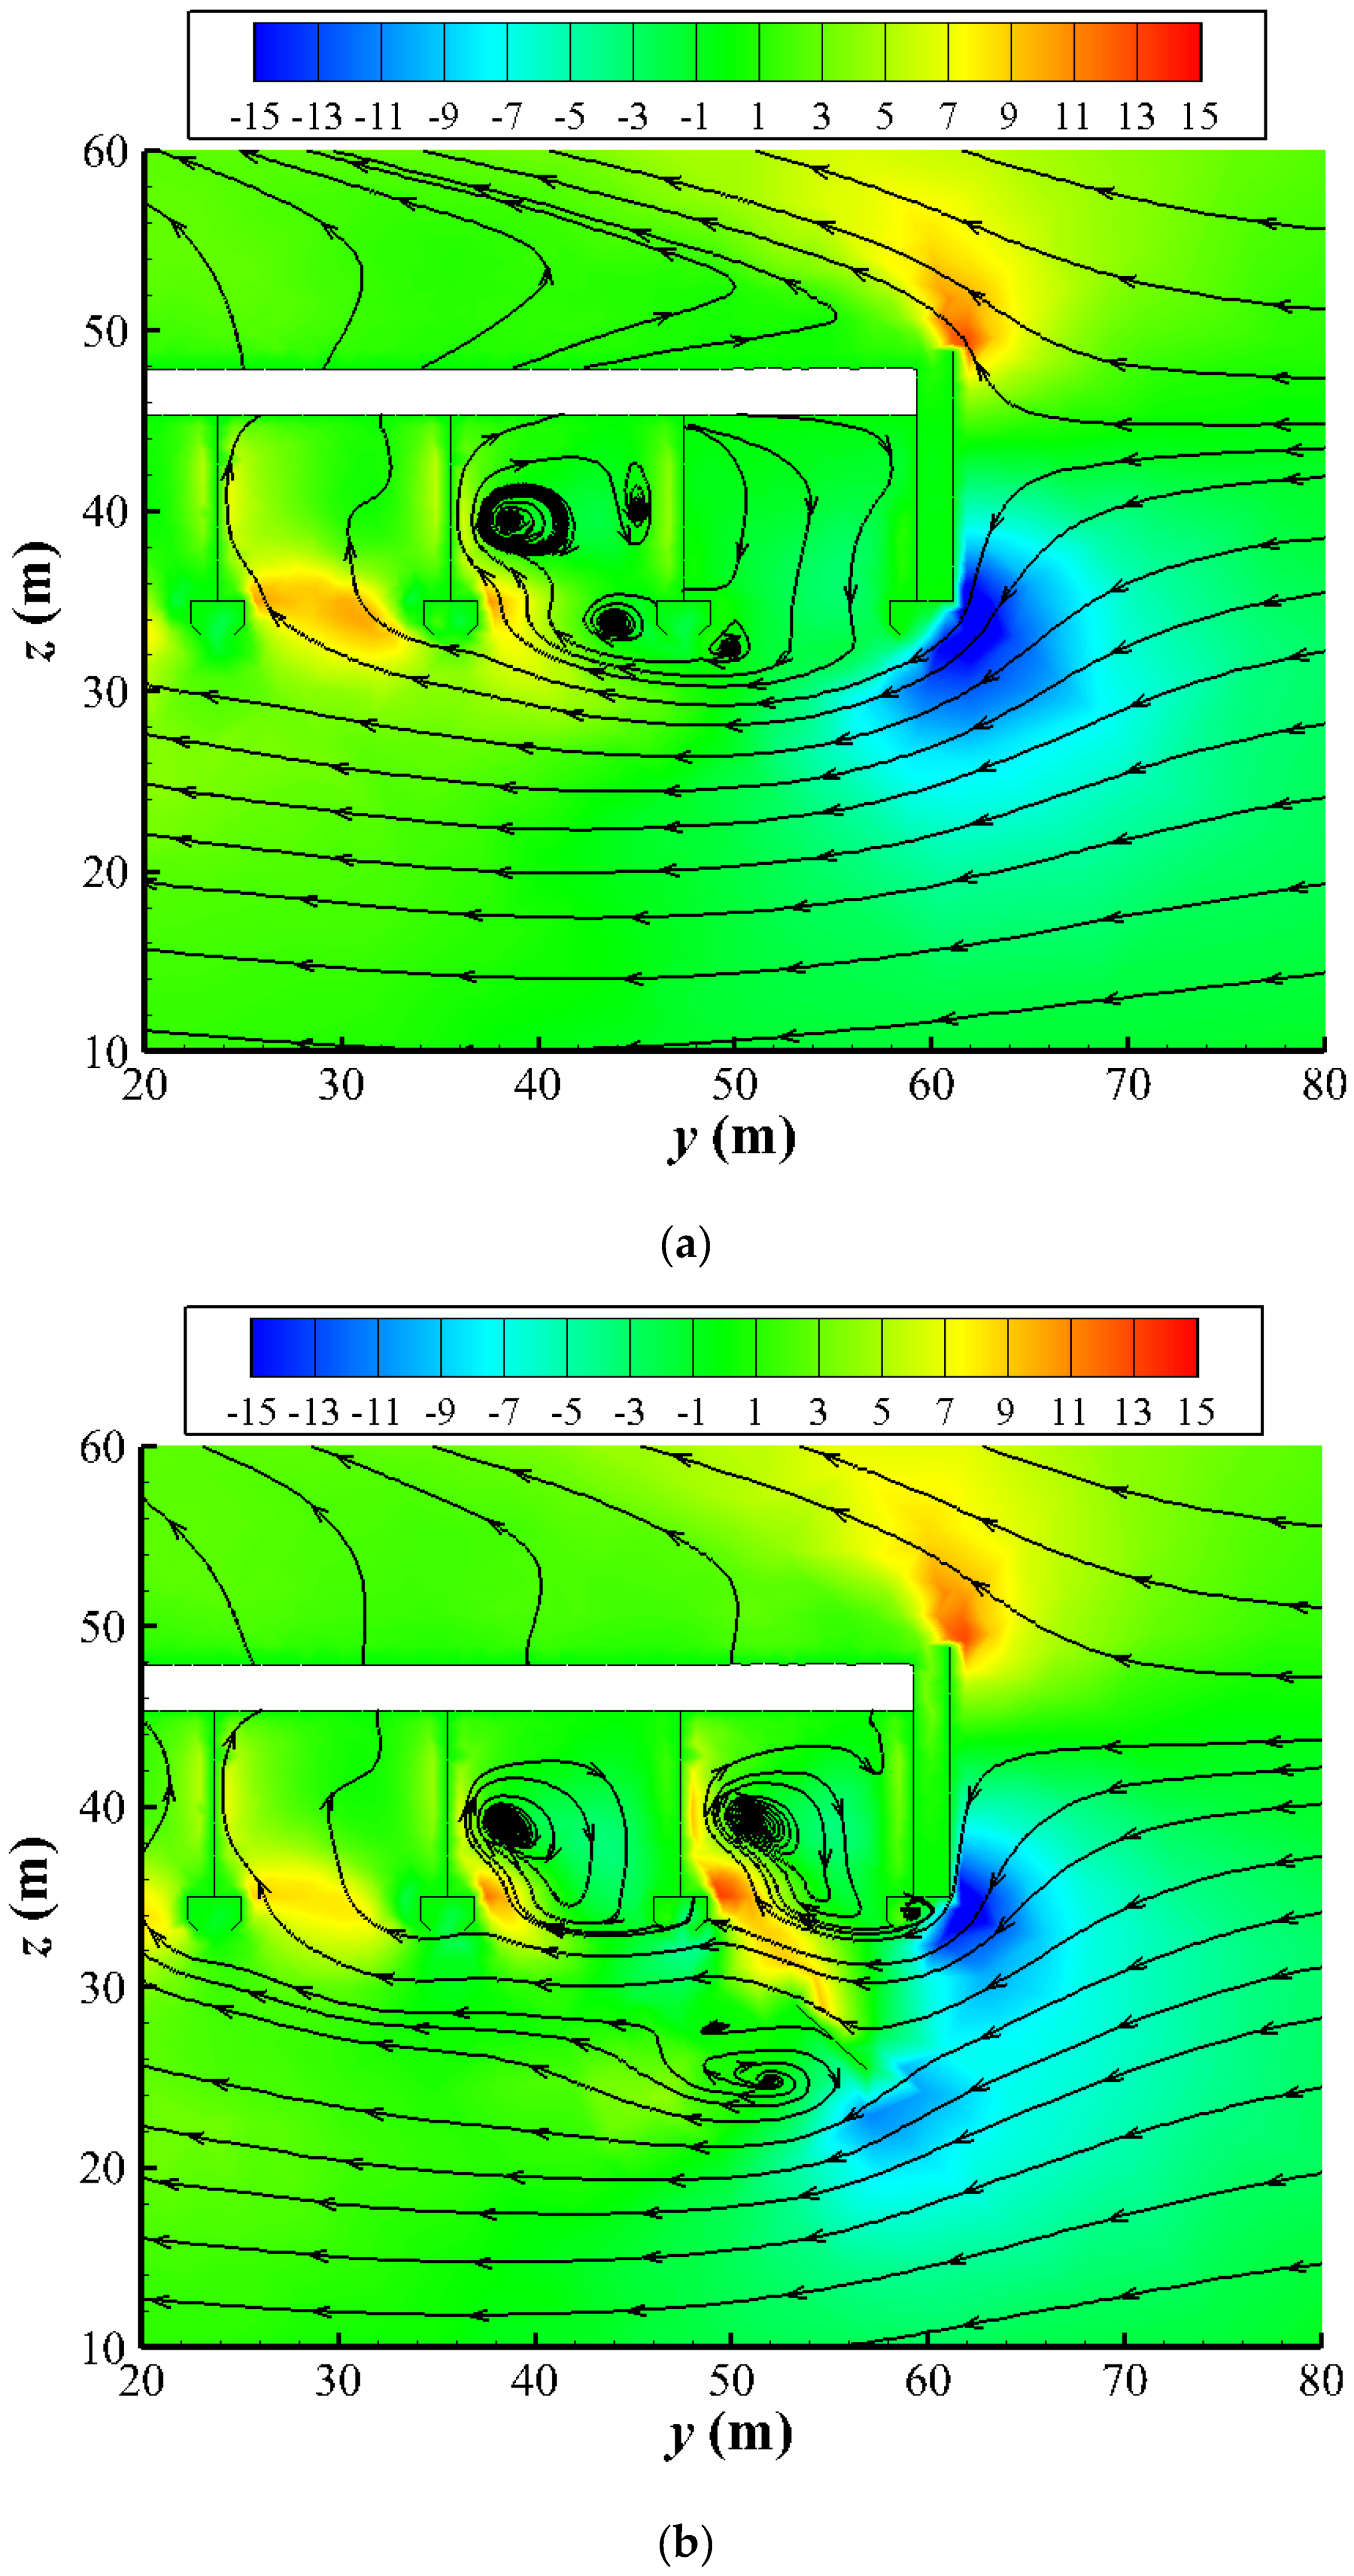
3.1. Variable Fields Analyses

As examples, three wind directions with the values of −90°, 0°, and 90° at a wind speed of 16 m/s were used to present the details of temperature, pressure, and flow fields near the cooling system with and without air deflectors.

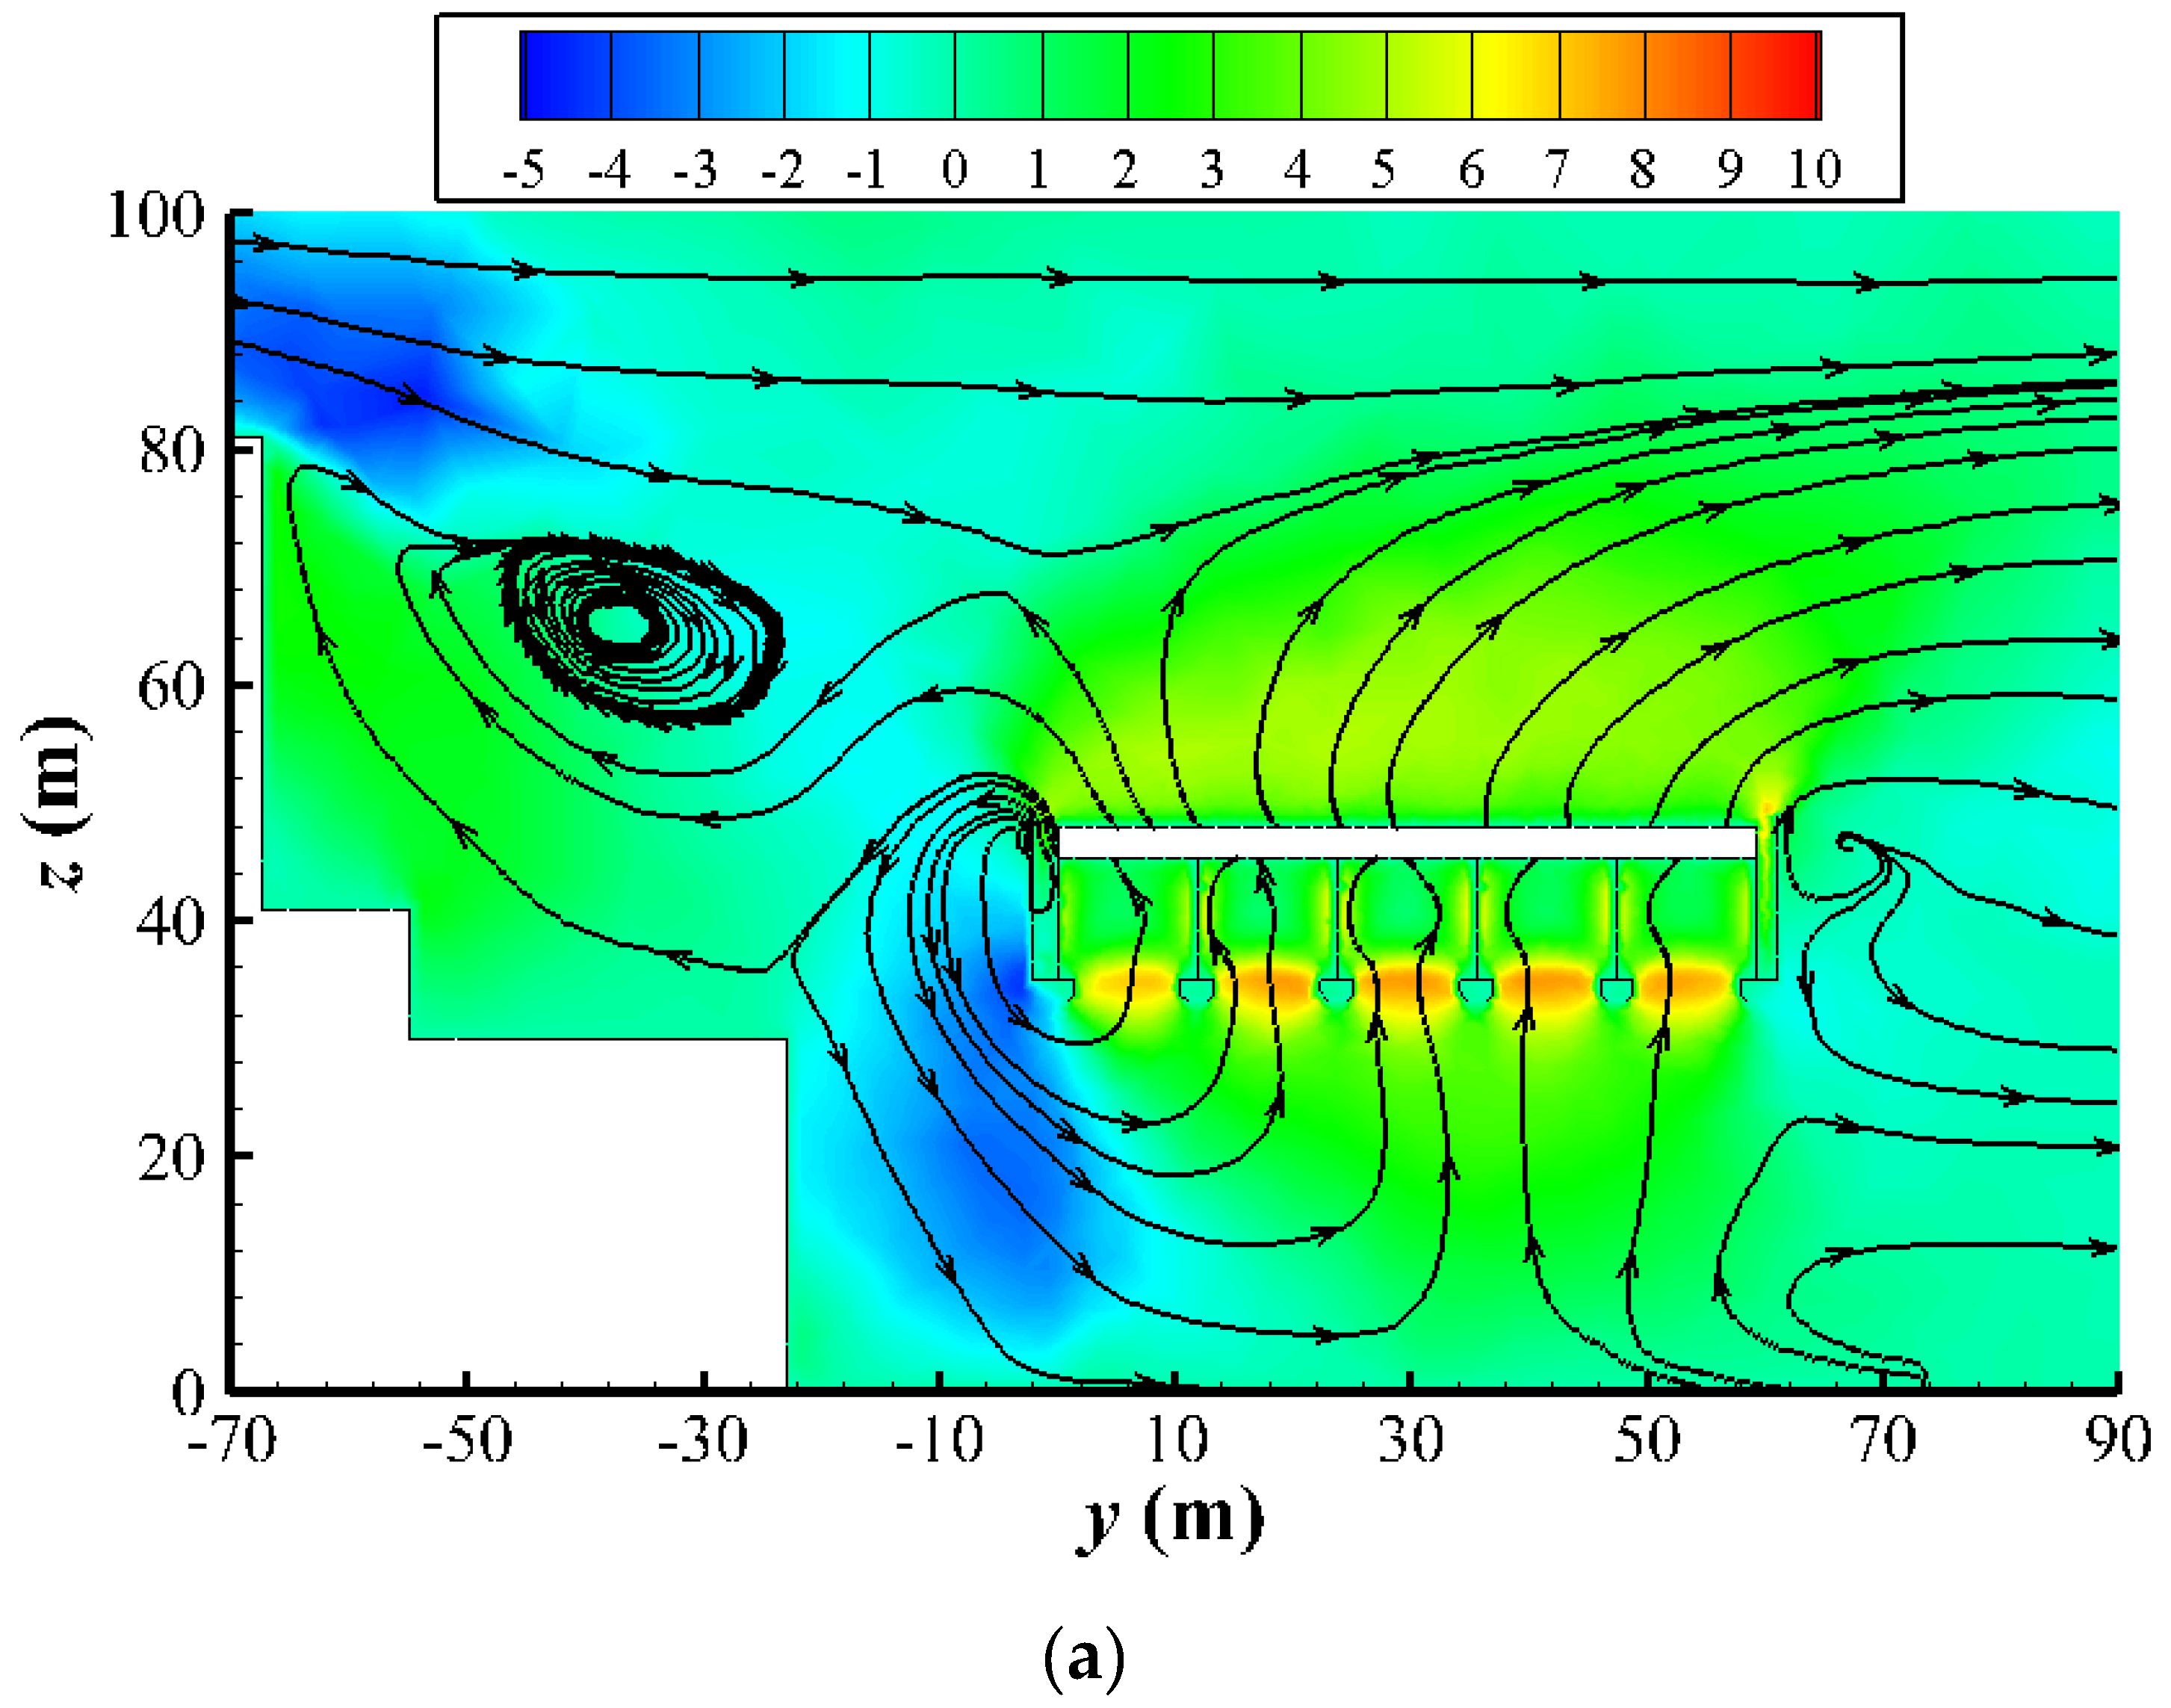
3.1.1. Wind Direction of −90°

Figure 5a shows the fan inlet temperature distribution for the original ACCs without air deflectors. The inlet temperatures for almost half of the fans exceeded the ambient temperature, especially for the fans in row 1 (R1) and row 2 (R2), showing that the performances of R1 and R2 condenser cells were deteriorated.
For ACCs with deflectors, the R1 fan inlet temperatures decreased dramatically, with a minimum value close to the ambient temperature. With plane deflectors, the inlet temperatures for most of the R1 fans were below 324 K, but with arc deflectors they were lower than 316 K, as depicted in Figure 5b,c. The inlet temperatures of R3 fans almost dropped to ambient temperature with air deflectors. However, with air deflectors, it was not difficult to find that the R2 fan inlet temperatures increased a lot.
The local pressures of three windward ACCs in column 9 are shown in Figure 6. Because of the strong crosswinds, a big zone with a low pressure appears below the R1 and R2 fans. With the leading of air deflectors, as depicted in Figure 6b,c, the low-pressure region near the R1 fan inlet clearly narrowed, which was mainly attributed to the high pressure generated on the upwind of the deflectors. The low-pressure region near the R1 fan inlet with arc deflectors was fairly smaller than that with plane deflectors. On the contrary, a low pressure was formed on the downwind of air deflectors, resulting in a reduced pressure near the R2 fan inlet.
The pressure change can affect the airflow. Because of the low pressure near the inlet of the R1 fan, the hot air from the R1 condenser cell flowed into the R2 fan, and a reversed flow was produced, as shown in Figure 7a. Also, near the R2 fan inlet, the reverse flow became weak because of the inhibition from the upwind axial flow fan. The reverse flows resulted in a high temperature of the upwind fan inlet, as shown in Figure 5a. At the R1 fan inlet shown in Figure 7a, the value of the z-velocity was about zero. With the guidance of deflectors, airflow was introduced to the R1 condenser cell. Basically, the reverse flow near the R1 condenser cell was alleviated because of the increased inlet pressure, which was also characterized by the reduced fan inlet temperature depicted in Figure 5b,c. Furthermore, the z-velocity at the R1 fan inlet increased clearly, leading to an increased air mass flow rate through the R1 condenser cell. Moreover, the z-velocity at the R1 fan inlet with arc deflectors was greater than that with plane deflectors. This may be attributed to the large declination angle of the arc deflectors needed to guide the airflow almost vertically to the axial flow fan so more cooling air can pass through the ACCs to improve the cooling performance. Nevertheless, the reverse flow at the R2 fan inlet was aggravated with air deflectors, owing to the reduced z-velocity at the R2 fan inlet as shown in Figure 7b,c. At the leeward side of the air deflectors, a whirlpool was generated because of the low pressure behind the air deflectors.

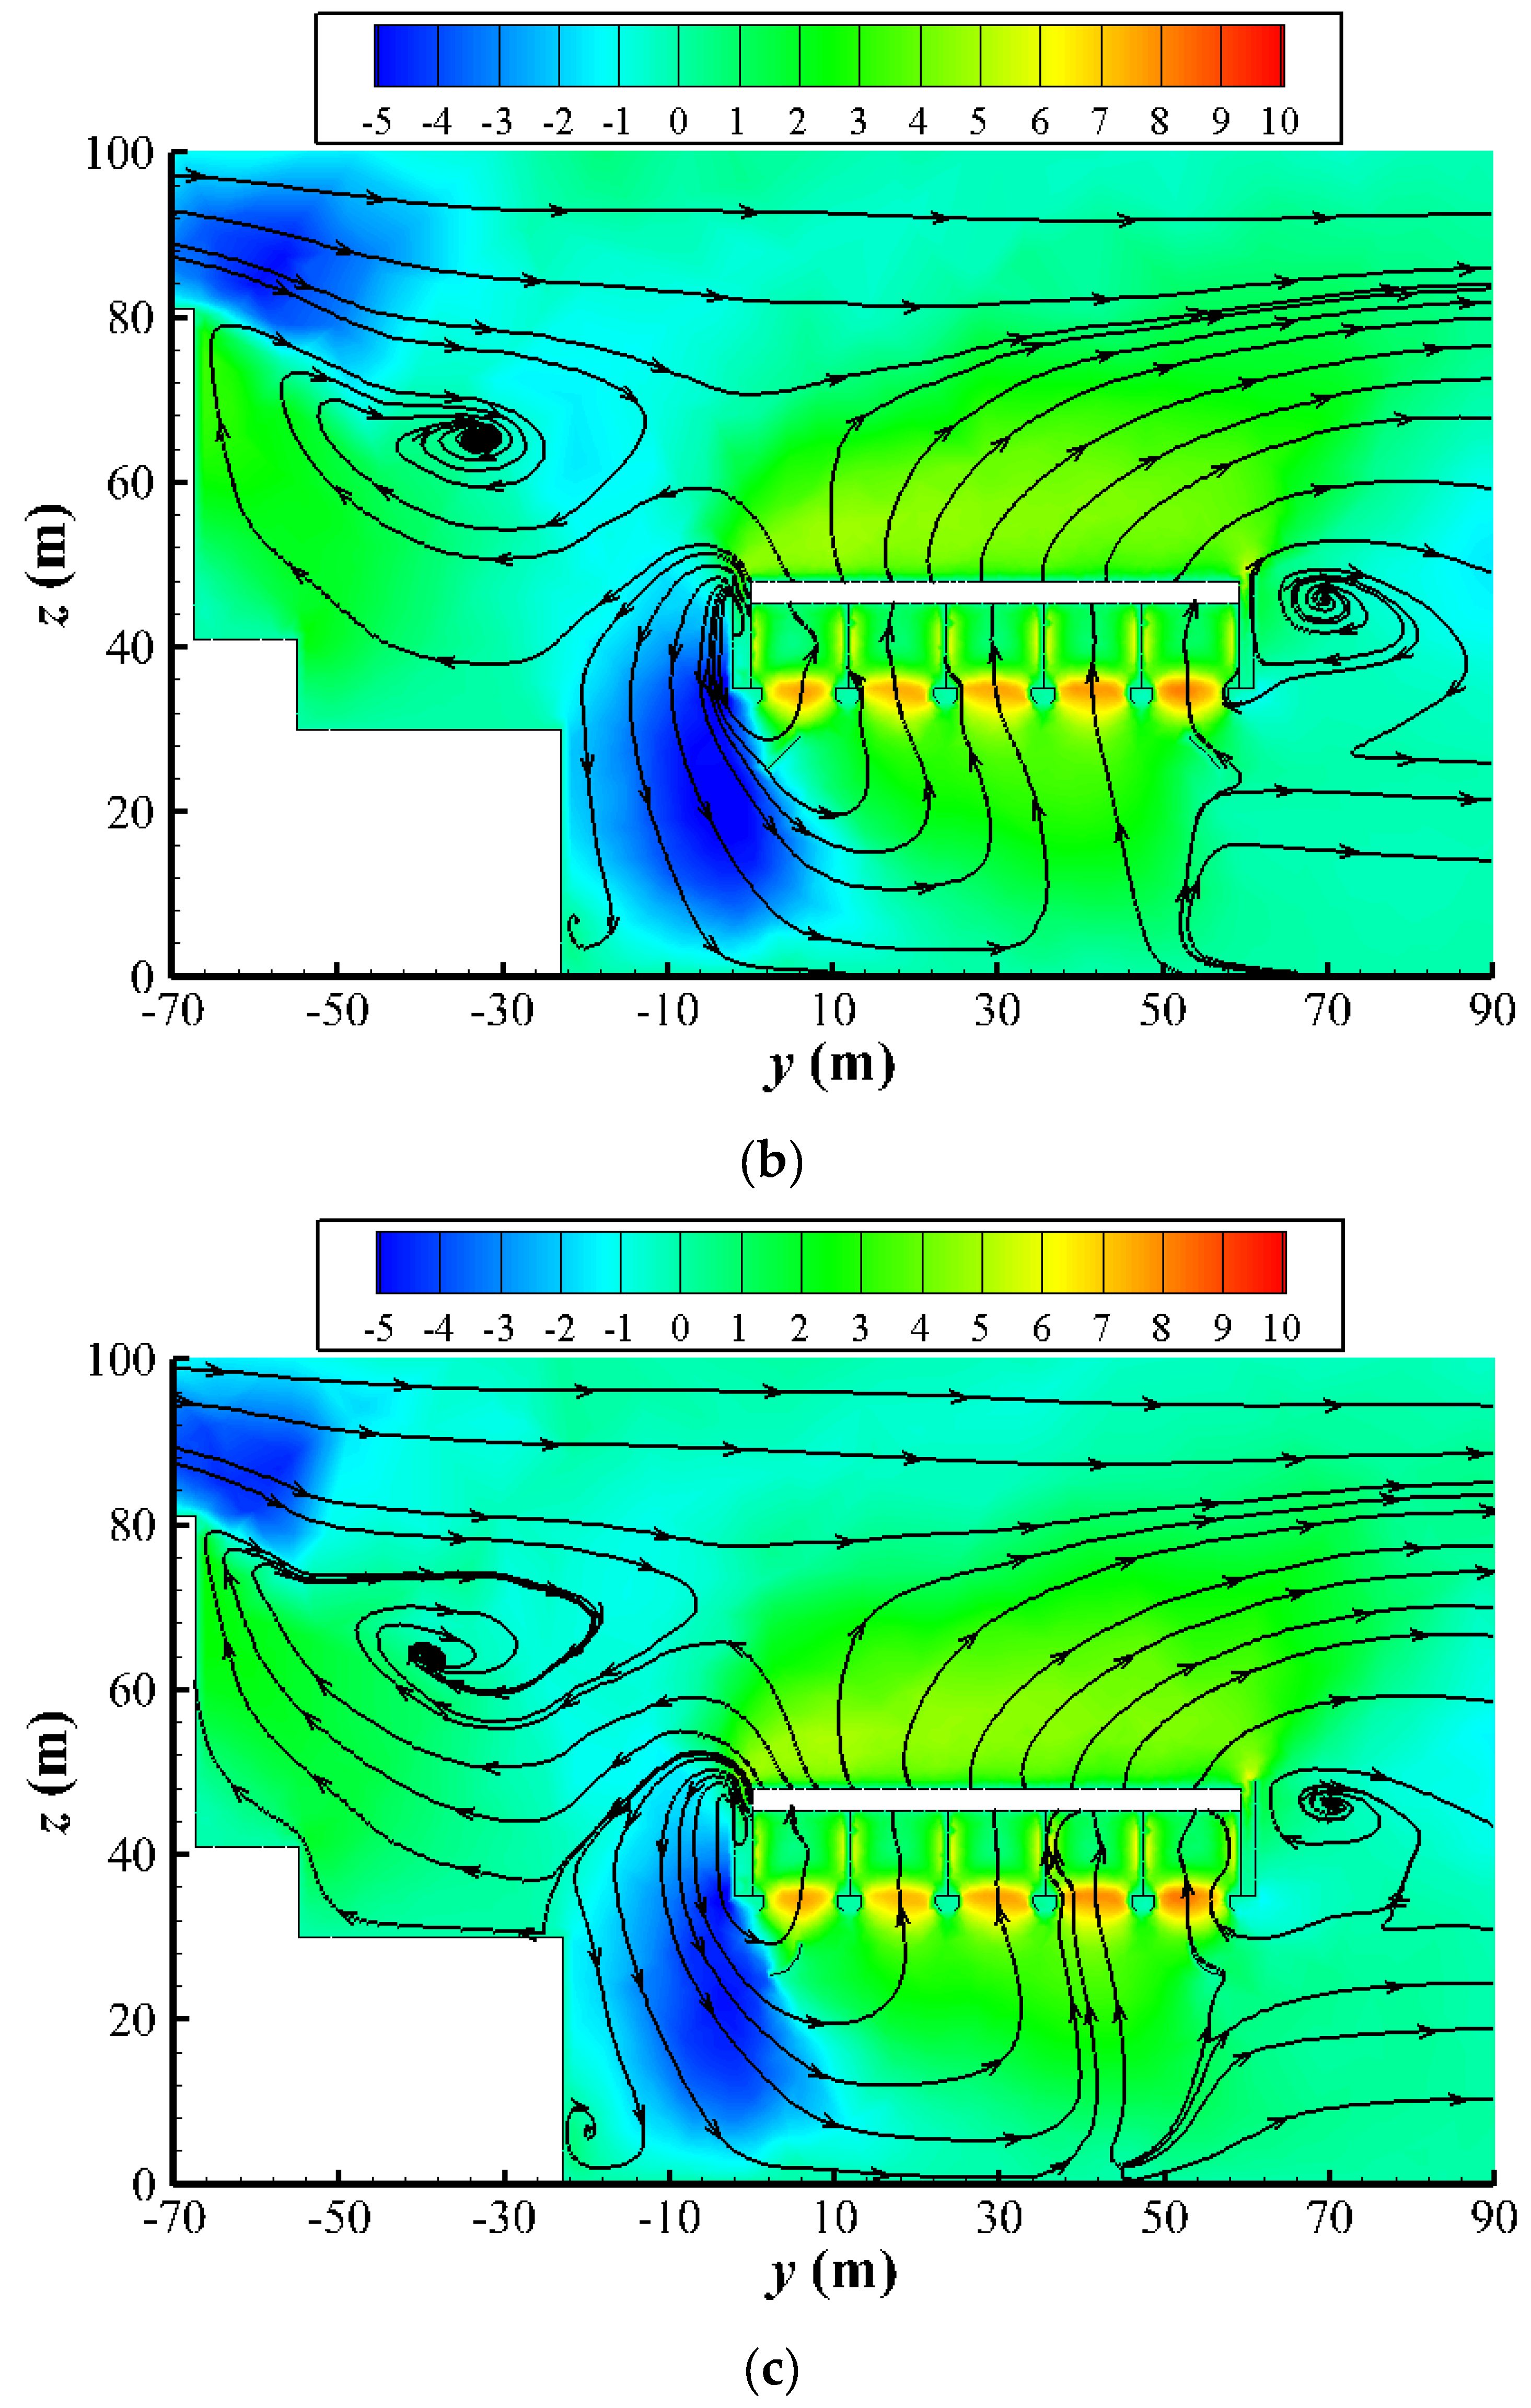
3.1.2. Wind Direction of 0°

The fan inlet temperature distributions with and without air deflectors are shown in Figure 8. Among the column 1 (C1) fans, almost all inlet temperatures were up to about 328 K. From C9 to C11, the inlet air temperatures of bilateral fans exceeded those of the middle fans because of the hot air recirculation near the edge of the condenser cells. After installing air deflectors, the inlet temperatures of C1 fans dropped conspicuously. For C1 fans with plane deflectors, only part of the inlet area suffered from the high temperature with a value of about 327 K. For C1 fans with arc deflectors, the temperatures in most parts of the inlet area were below 321 K. But for the C2 fans, the inlet temperatures tended to increase with air deflectors.
Figure 9 gives the local pressure of the first three upwind condenser cells in row 4. Similar to Figure 6a, the whole C1 fan inlet zone, as well as half of the C2 fan inlet zone, was dominated by low pressure under strong crosswinds. With the generation of high pressure at the windward side of air deflectors, the low pressure near the upwind condenser cell inlet reduced a lot. Same as in Figure 6, the pressure distribution was improved with arc deflectors. As for the C2 fans, however, the low pressure zone expanded at the fan inlet.
The air stream and z-velocity distribution of three upwind R4 condenser cells are shown in Figure 10. Similar to Figure 7, serious reverse flows were produced, and the fan inlet temperature increased. Also, the z-velocity near the C1 fan inlet was always below zero. With the guiding effect of the deflectors, the airflow could favorably enter the C1 condenser cell from the fan inlet. Furthermore, the z-velocity at the C1 fan inlet was higher than zero. Besides, the fan inlet z-velocity with arc deflectors was conspicuously higher than that of the plane deflectors. But for the condenser cell in column 2, the reverse flow became aggravated, and an air eddy formed behind the air deflectors.
Figure 11 shows the air stream and temperature distribution of the condenser cells in column 9. It is clear that serious hot air recirculation took place at both sides of the ACCs, which caused an increased inlet temperature of fans at the edge, as shown in Figure 8. Unfortunately, the recirculating hot air more easily flowed into the side condenser cells with air deflectors. As a result, the inlet temperature of fans at both sides increased a little, as shown in Figure 11 and Figure 8, showing that the side ACCs performances were worse.

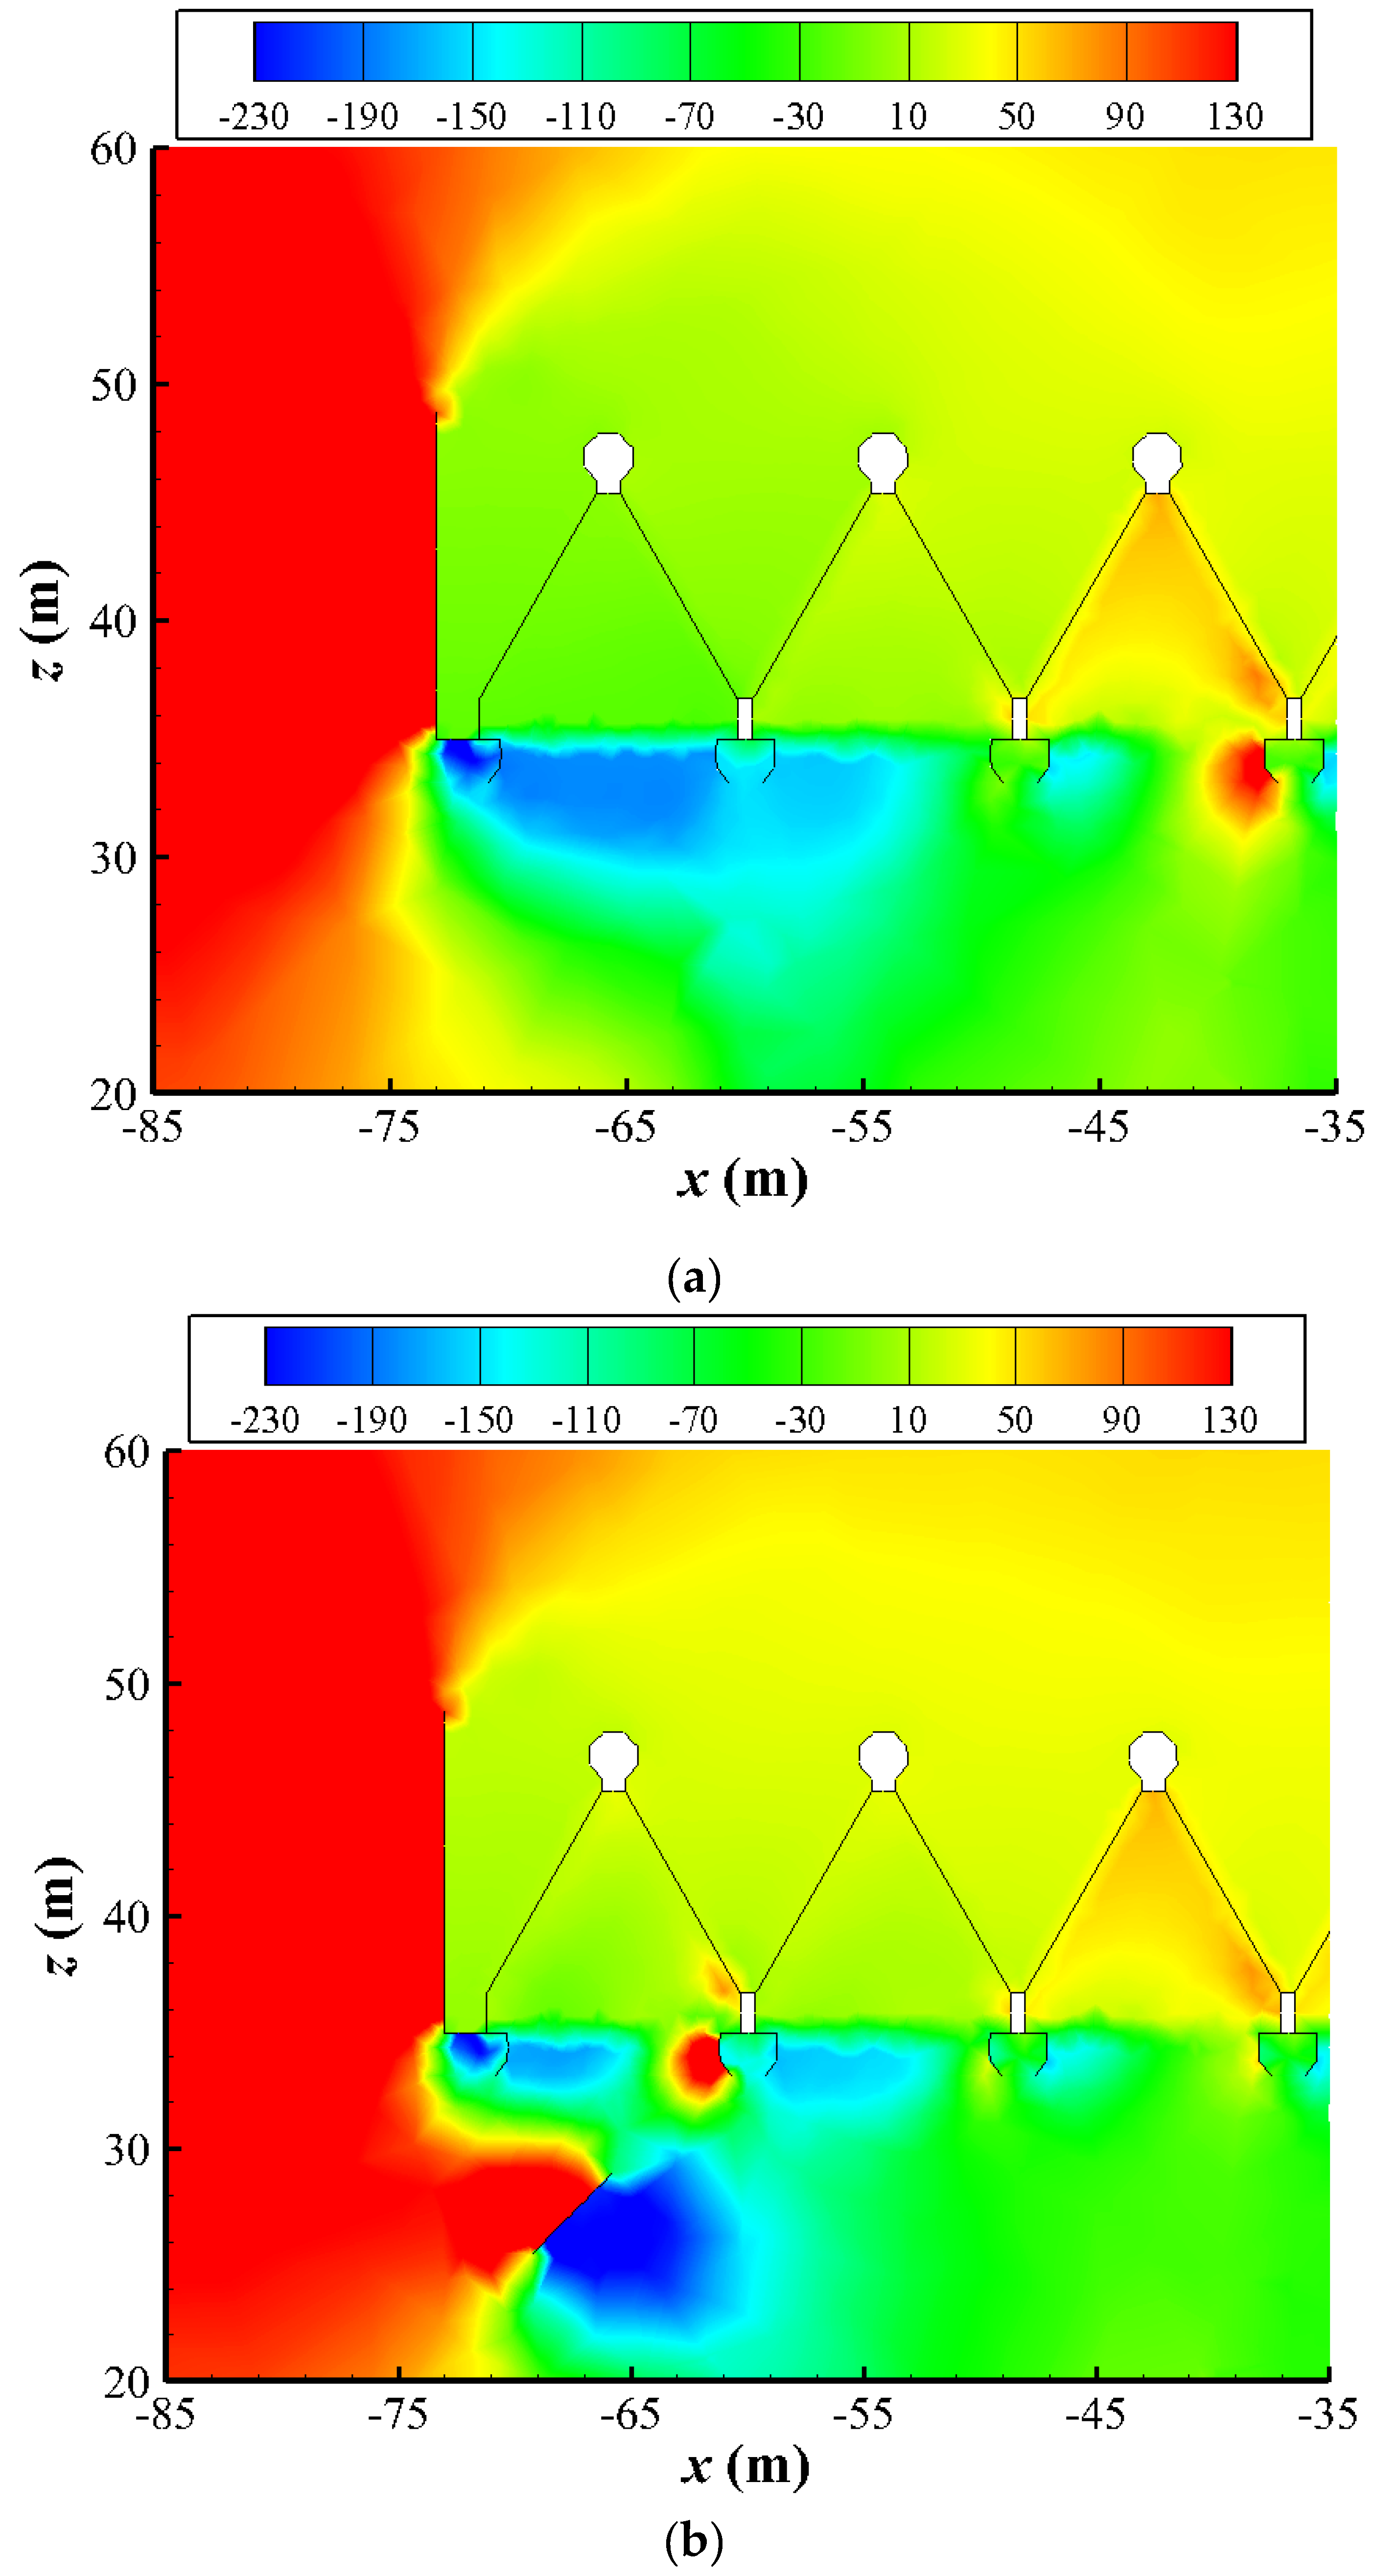
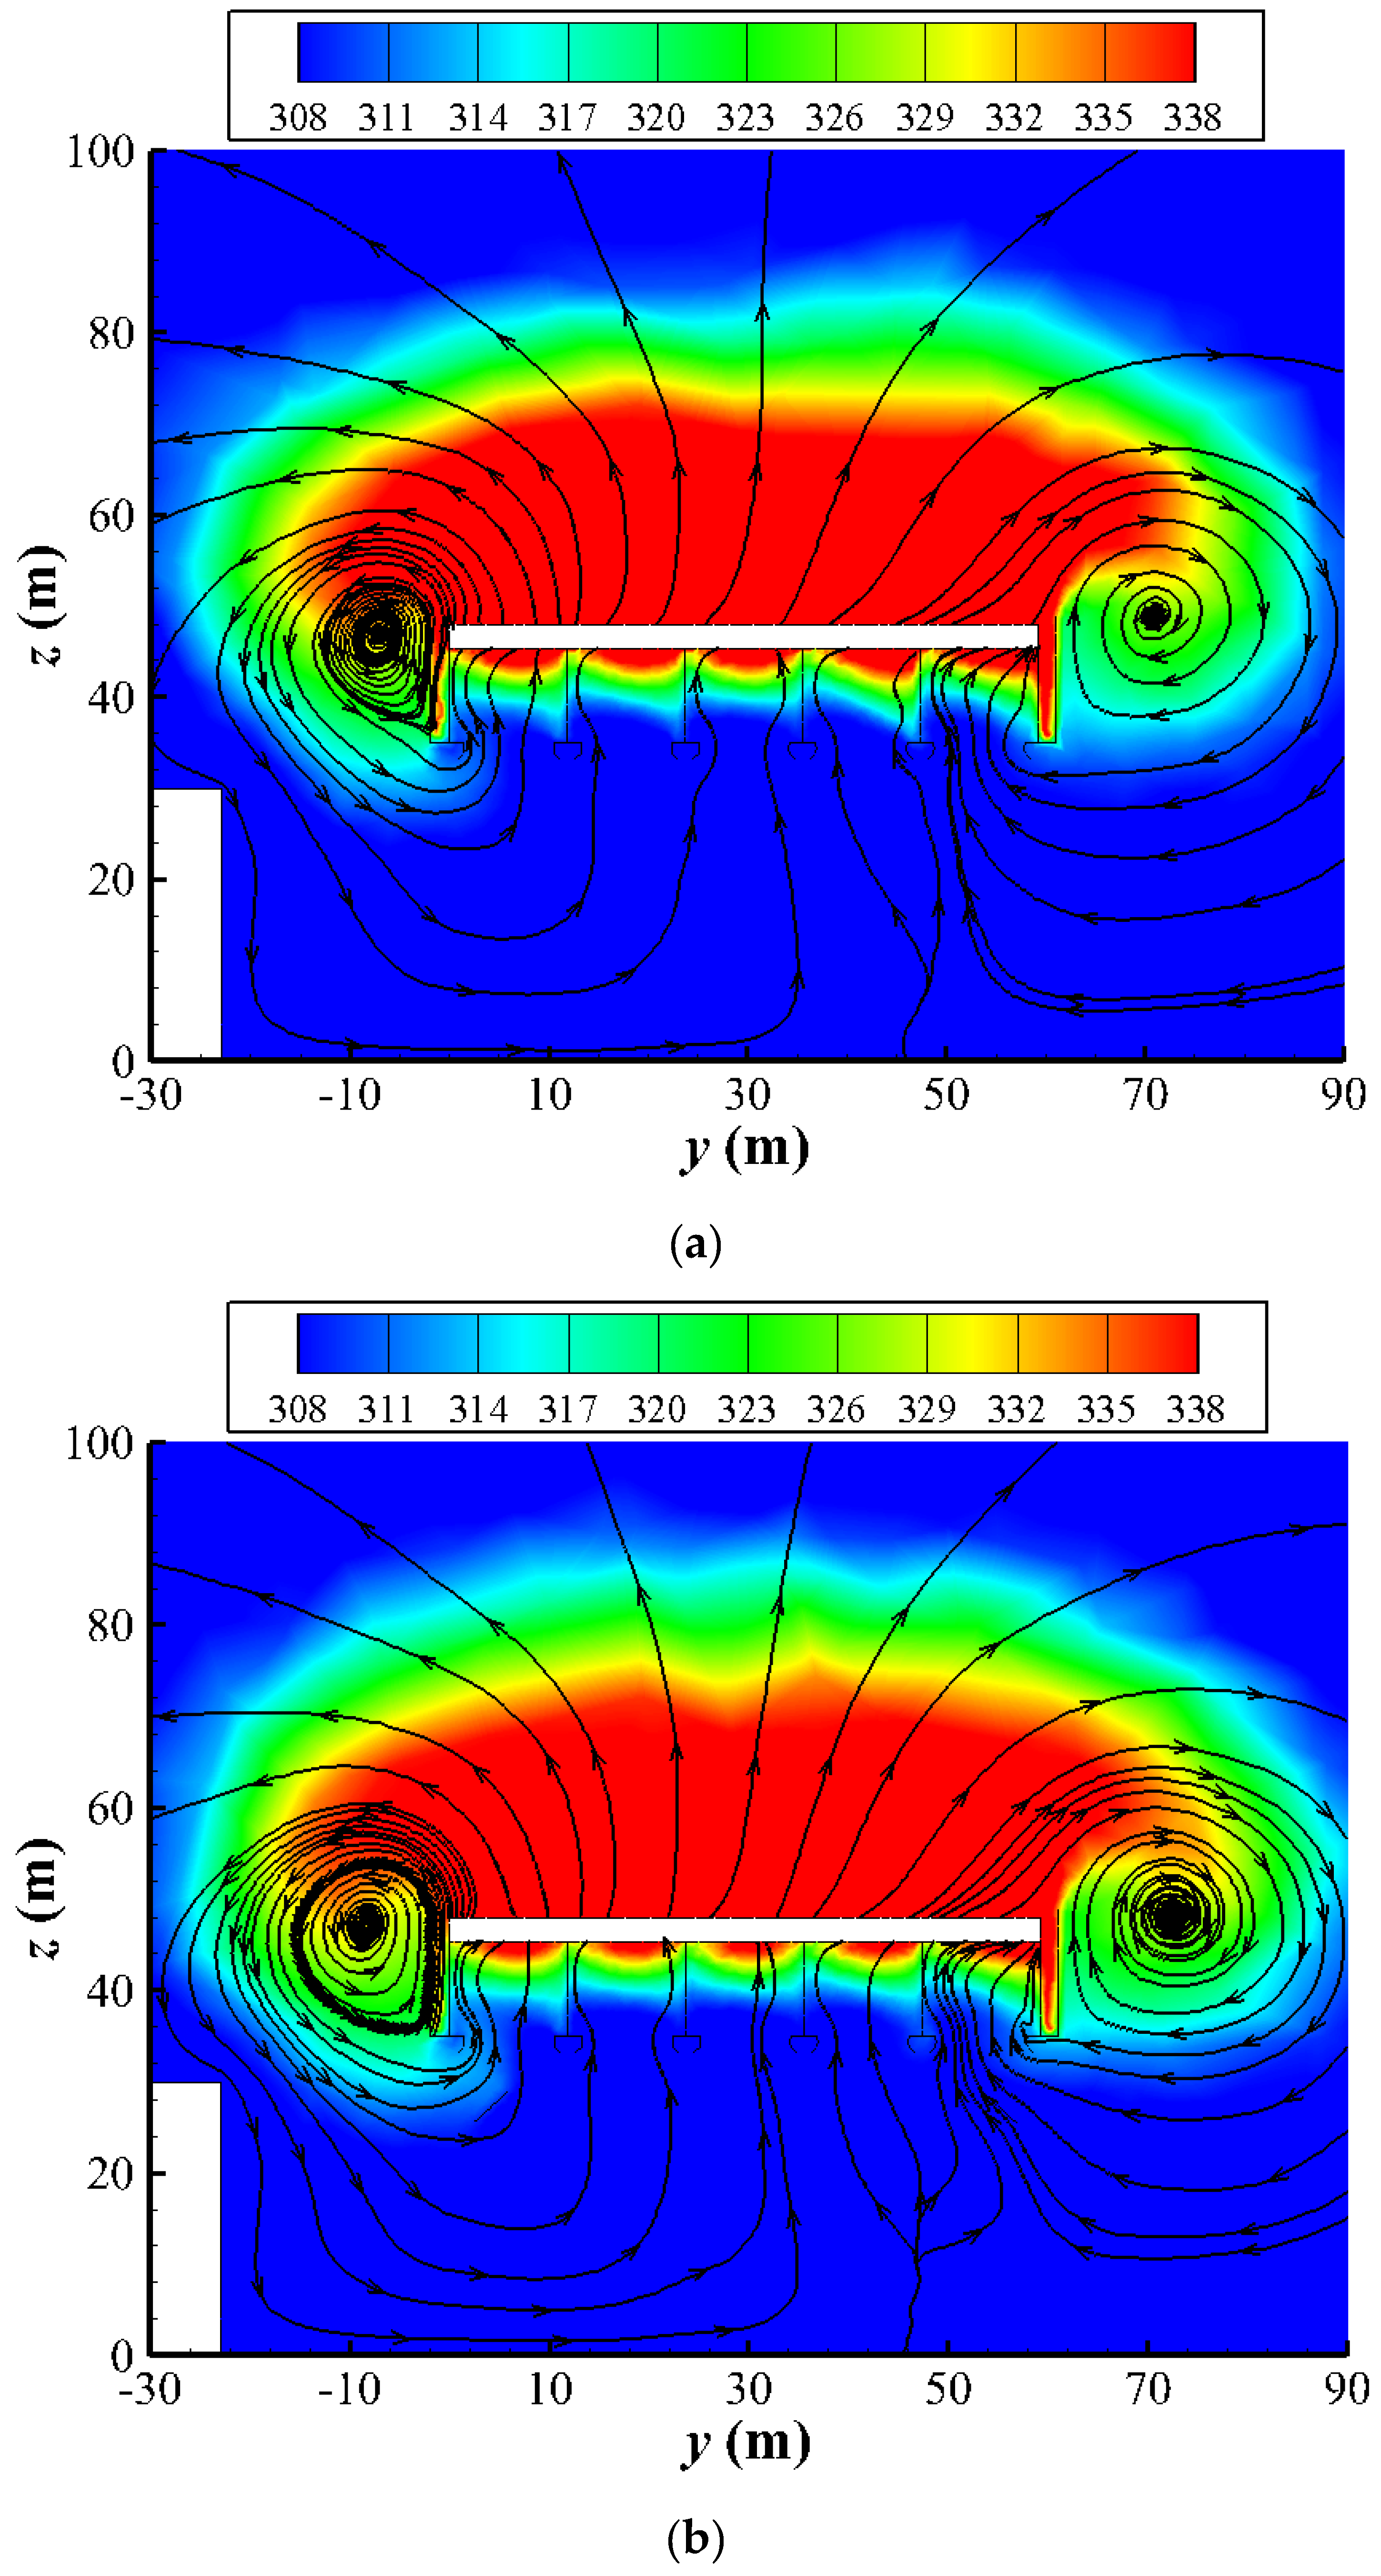
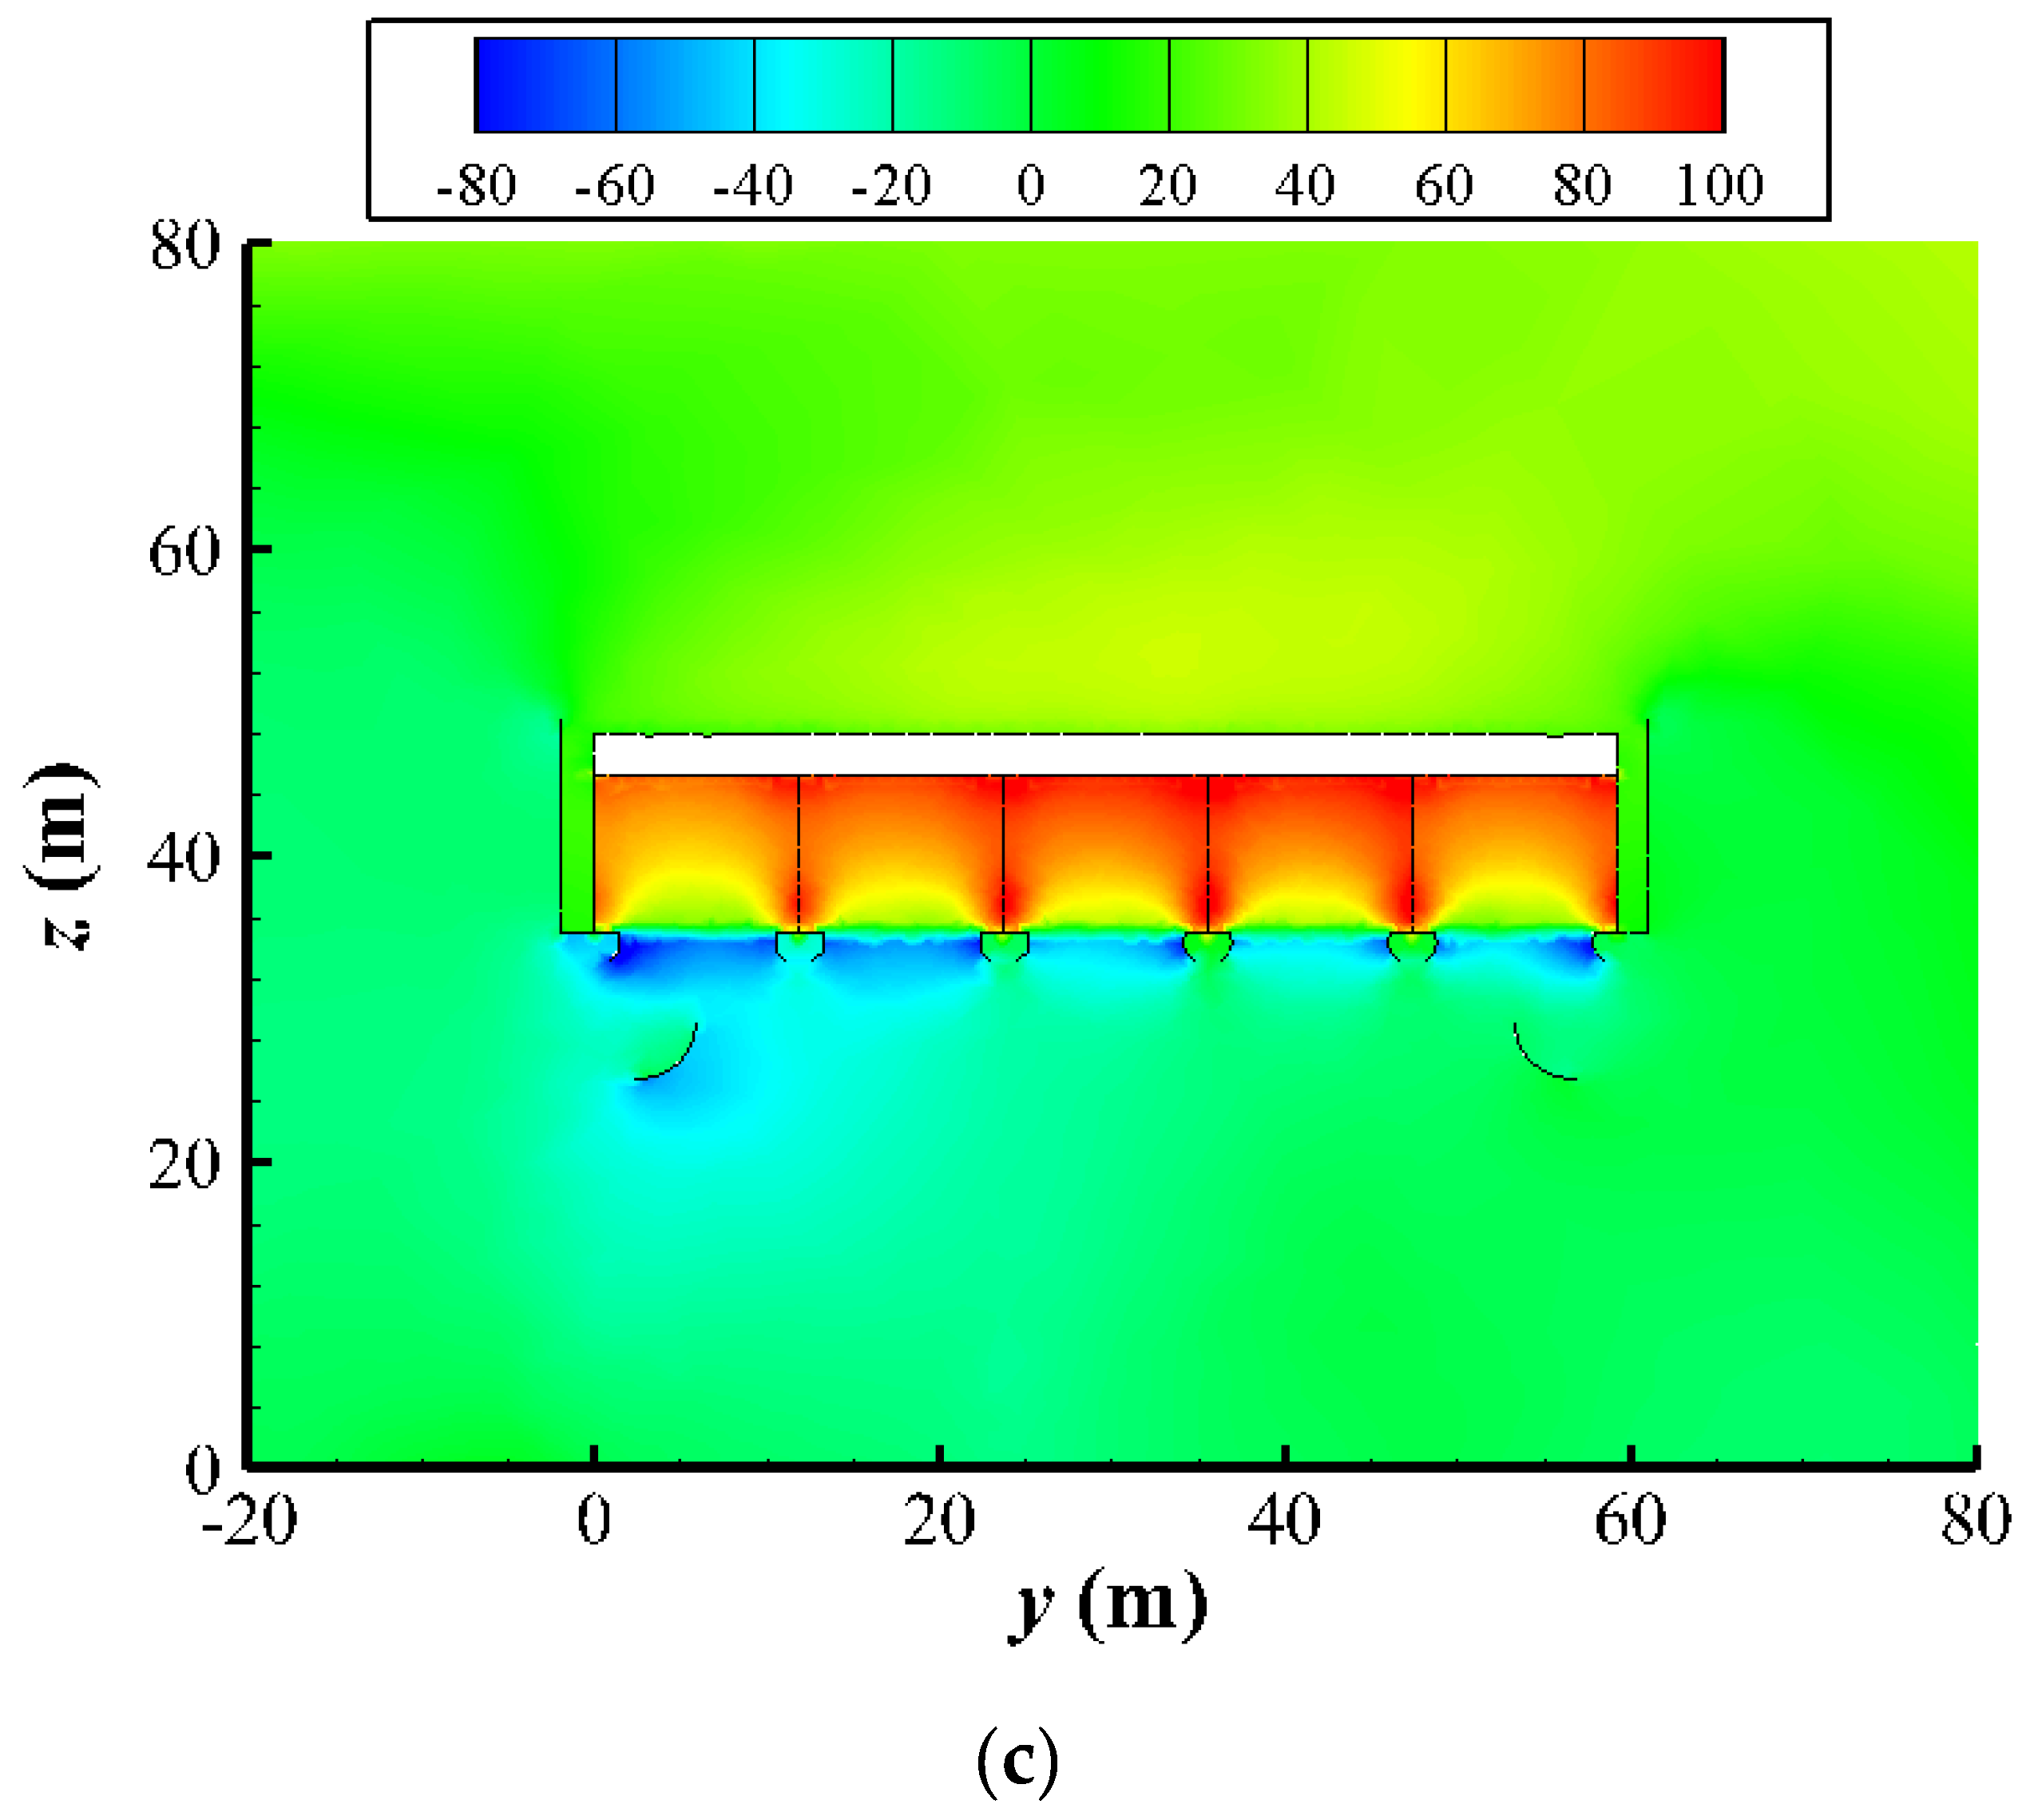
3.1.3. Wind Direction of 90°

Figure 12 shows the inlet temperatures of fans when the wind direction was equal to 90°. Because the main buildings could block airflow, the inlet temperatures of most of upwind (R5) fans increased a little compared to those in the wind directions of −90° and 0°. For the C1 and C12 fans, however, the inlet temperatures arrived at about 330 K, which were not blocked by the main buildings. The inlet temperatures of most fans exceeded the ambient temperature. With air deflectors, the inlet temperatures of R5 fans changed little, except the fans in C1 and C12. As for the backward fans, the inlet temperatures dropped a little. Besides, for both plane and arc deflectors, the inlet temperatures of fans were almost the same. Figure 13 shows the pressure of the C9 condenser cells. Without air deflectors, the pressure beneath the upwind condenser cell was still lower than that below the downstream condenser cell. After installing air deflectors, the pressure at the inlet of the windward fans varied a little.
The air stream and z-velocity distribution of the C9 condenser cells are shown in Figure 14. A large eddy was produced behind the main buildings, which blocked the ambient air flowing into the ACCs. Subsequently, the hot air from the ACC outlet flowed back into the ACCs, resulting in an increased fan inlet temperature, as depicted in Figure 12a. With air deflectors, the hot plume still flowed back into the ACCs, showing that the temperature at the fan inlet may not decrease clearly. But for the R5 fan, the z-velocity at the inlet increased a little.

3.2. Thermo-Flow Performance Analyses

Both the total and local air mass flow rates, as well as heat rejections, were calculated and compared for the ACCs without and with two types of air deflectors. In addition, the back pressure was also predicted.

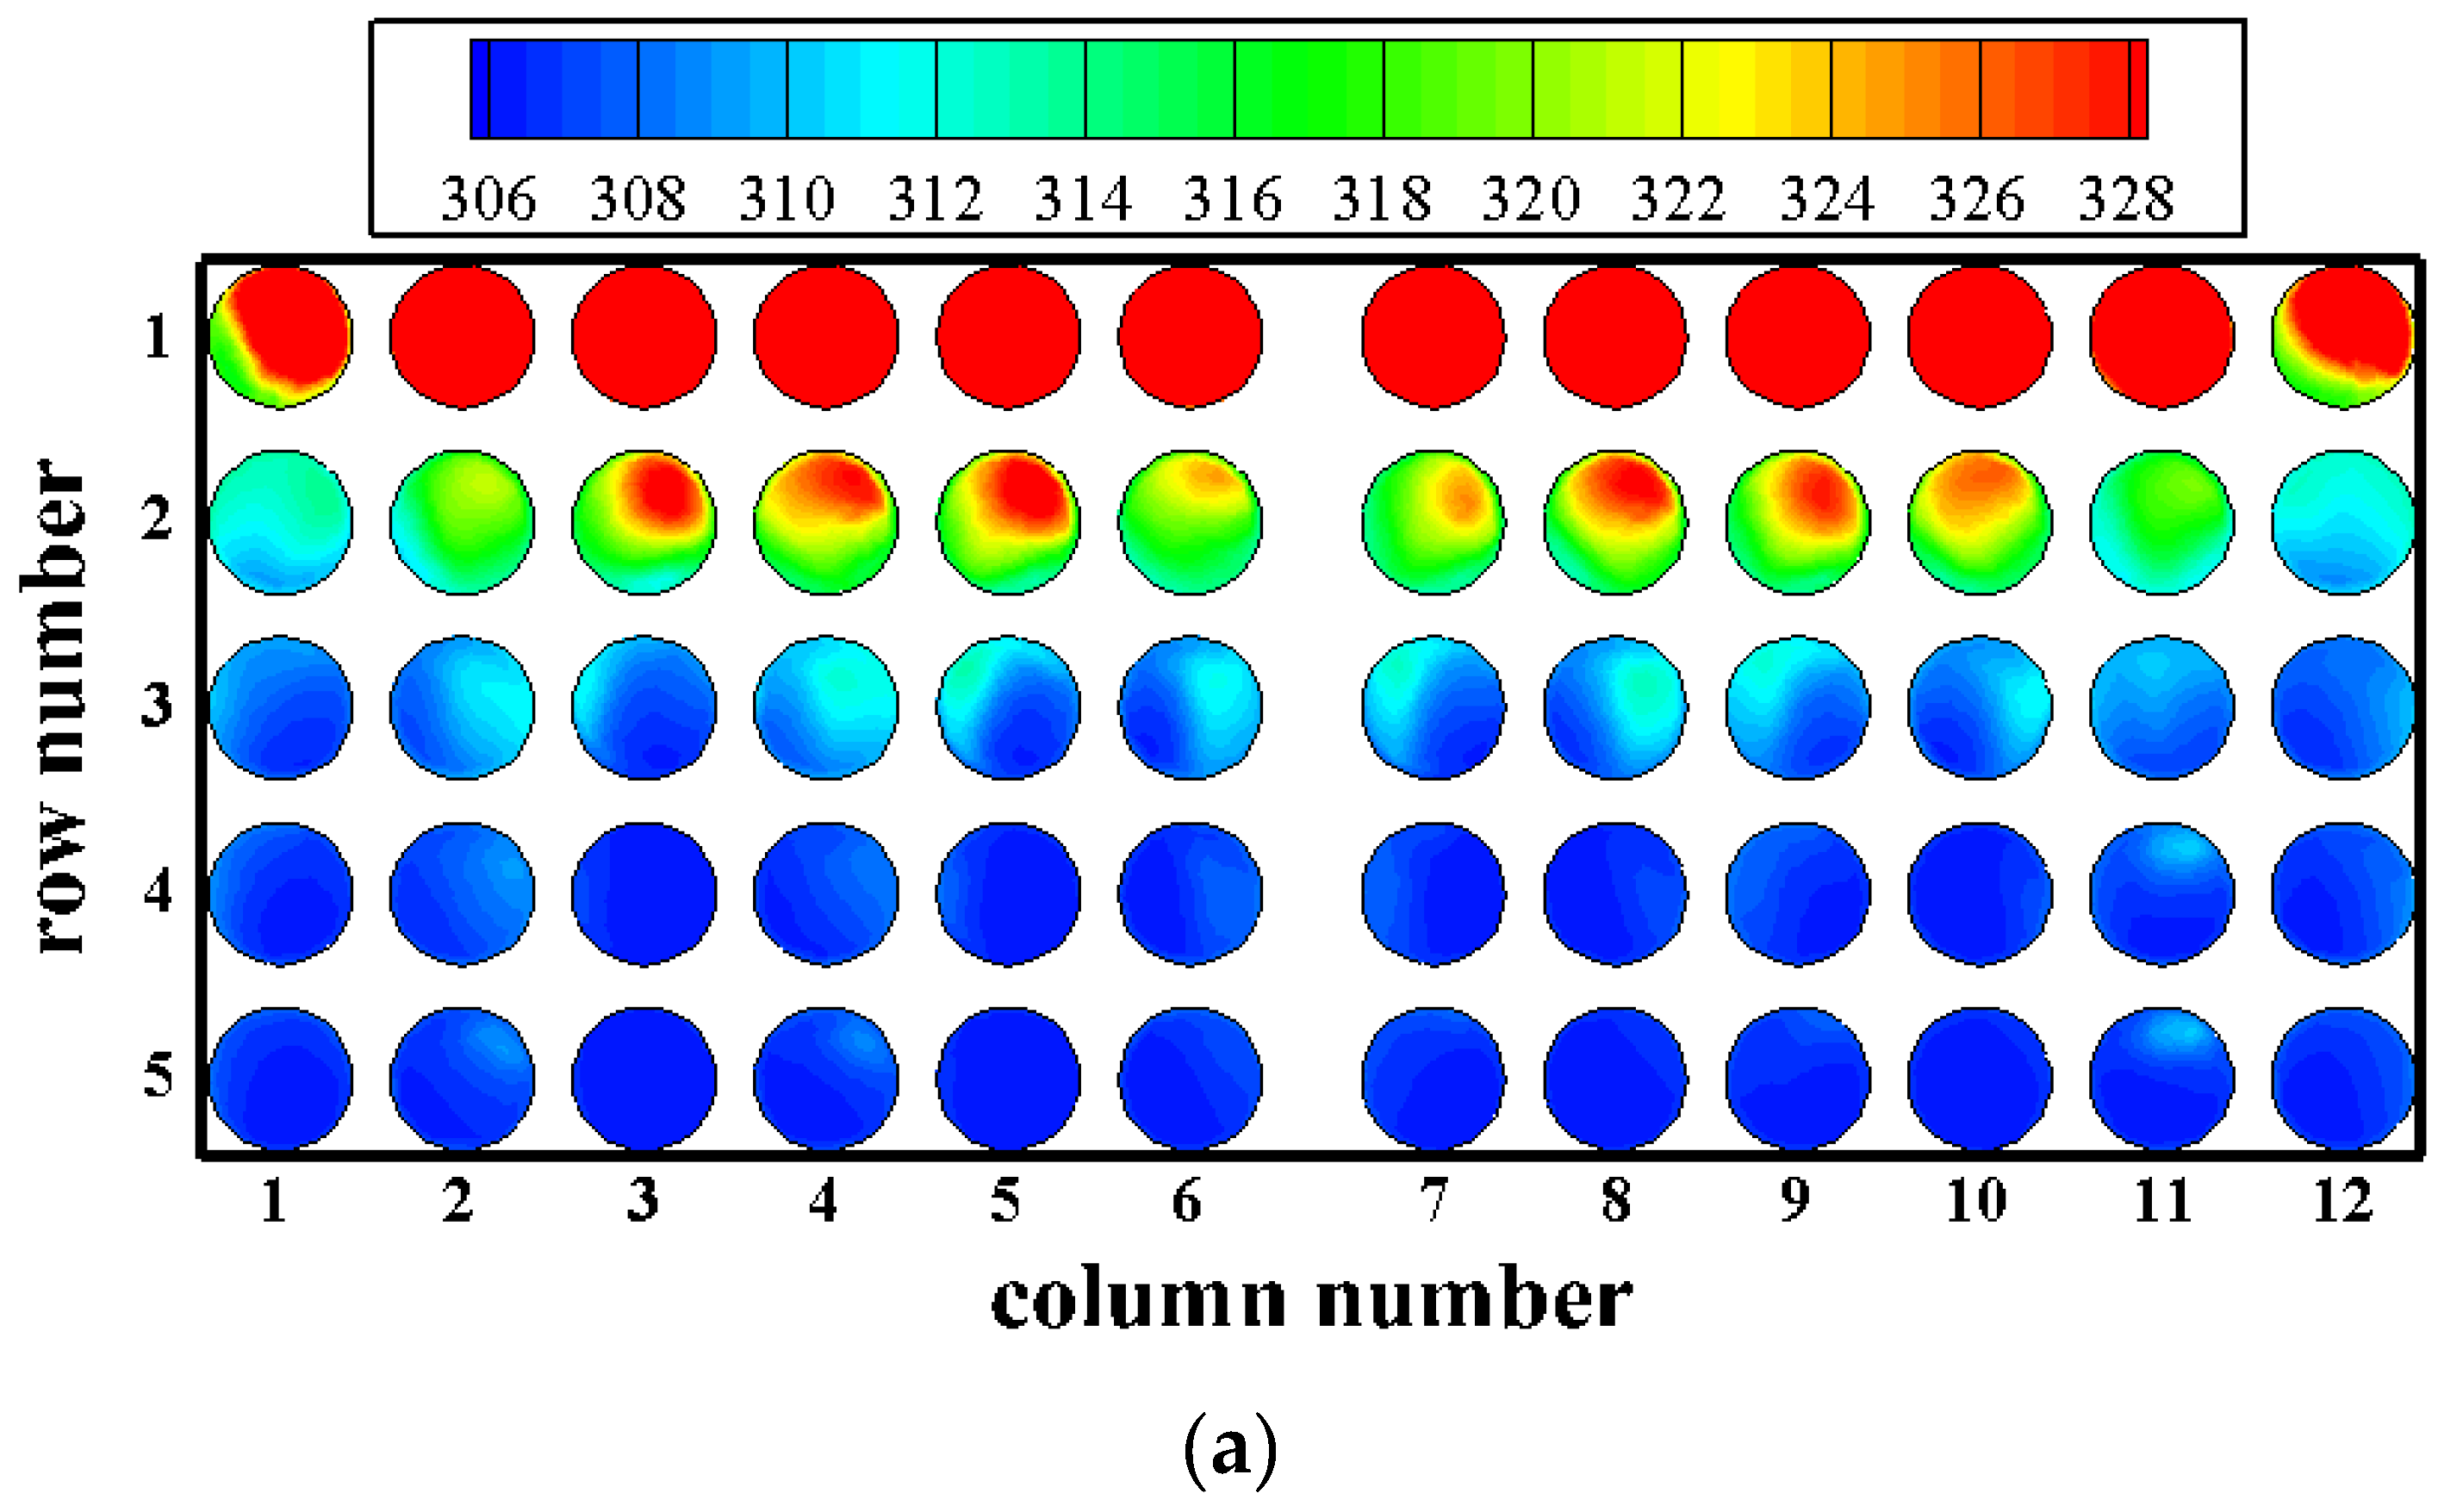
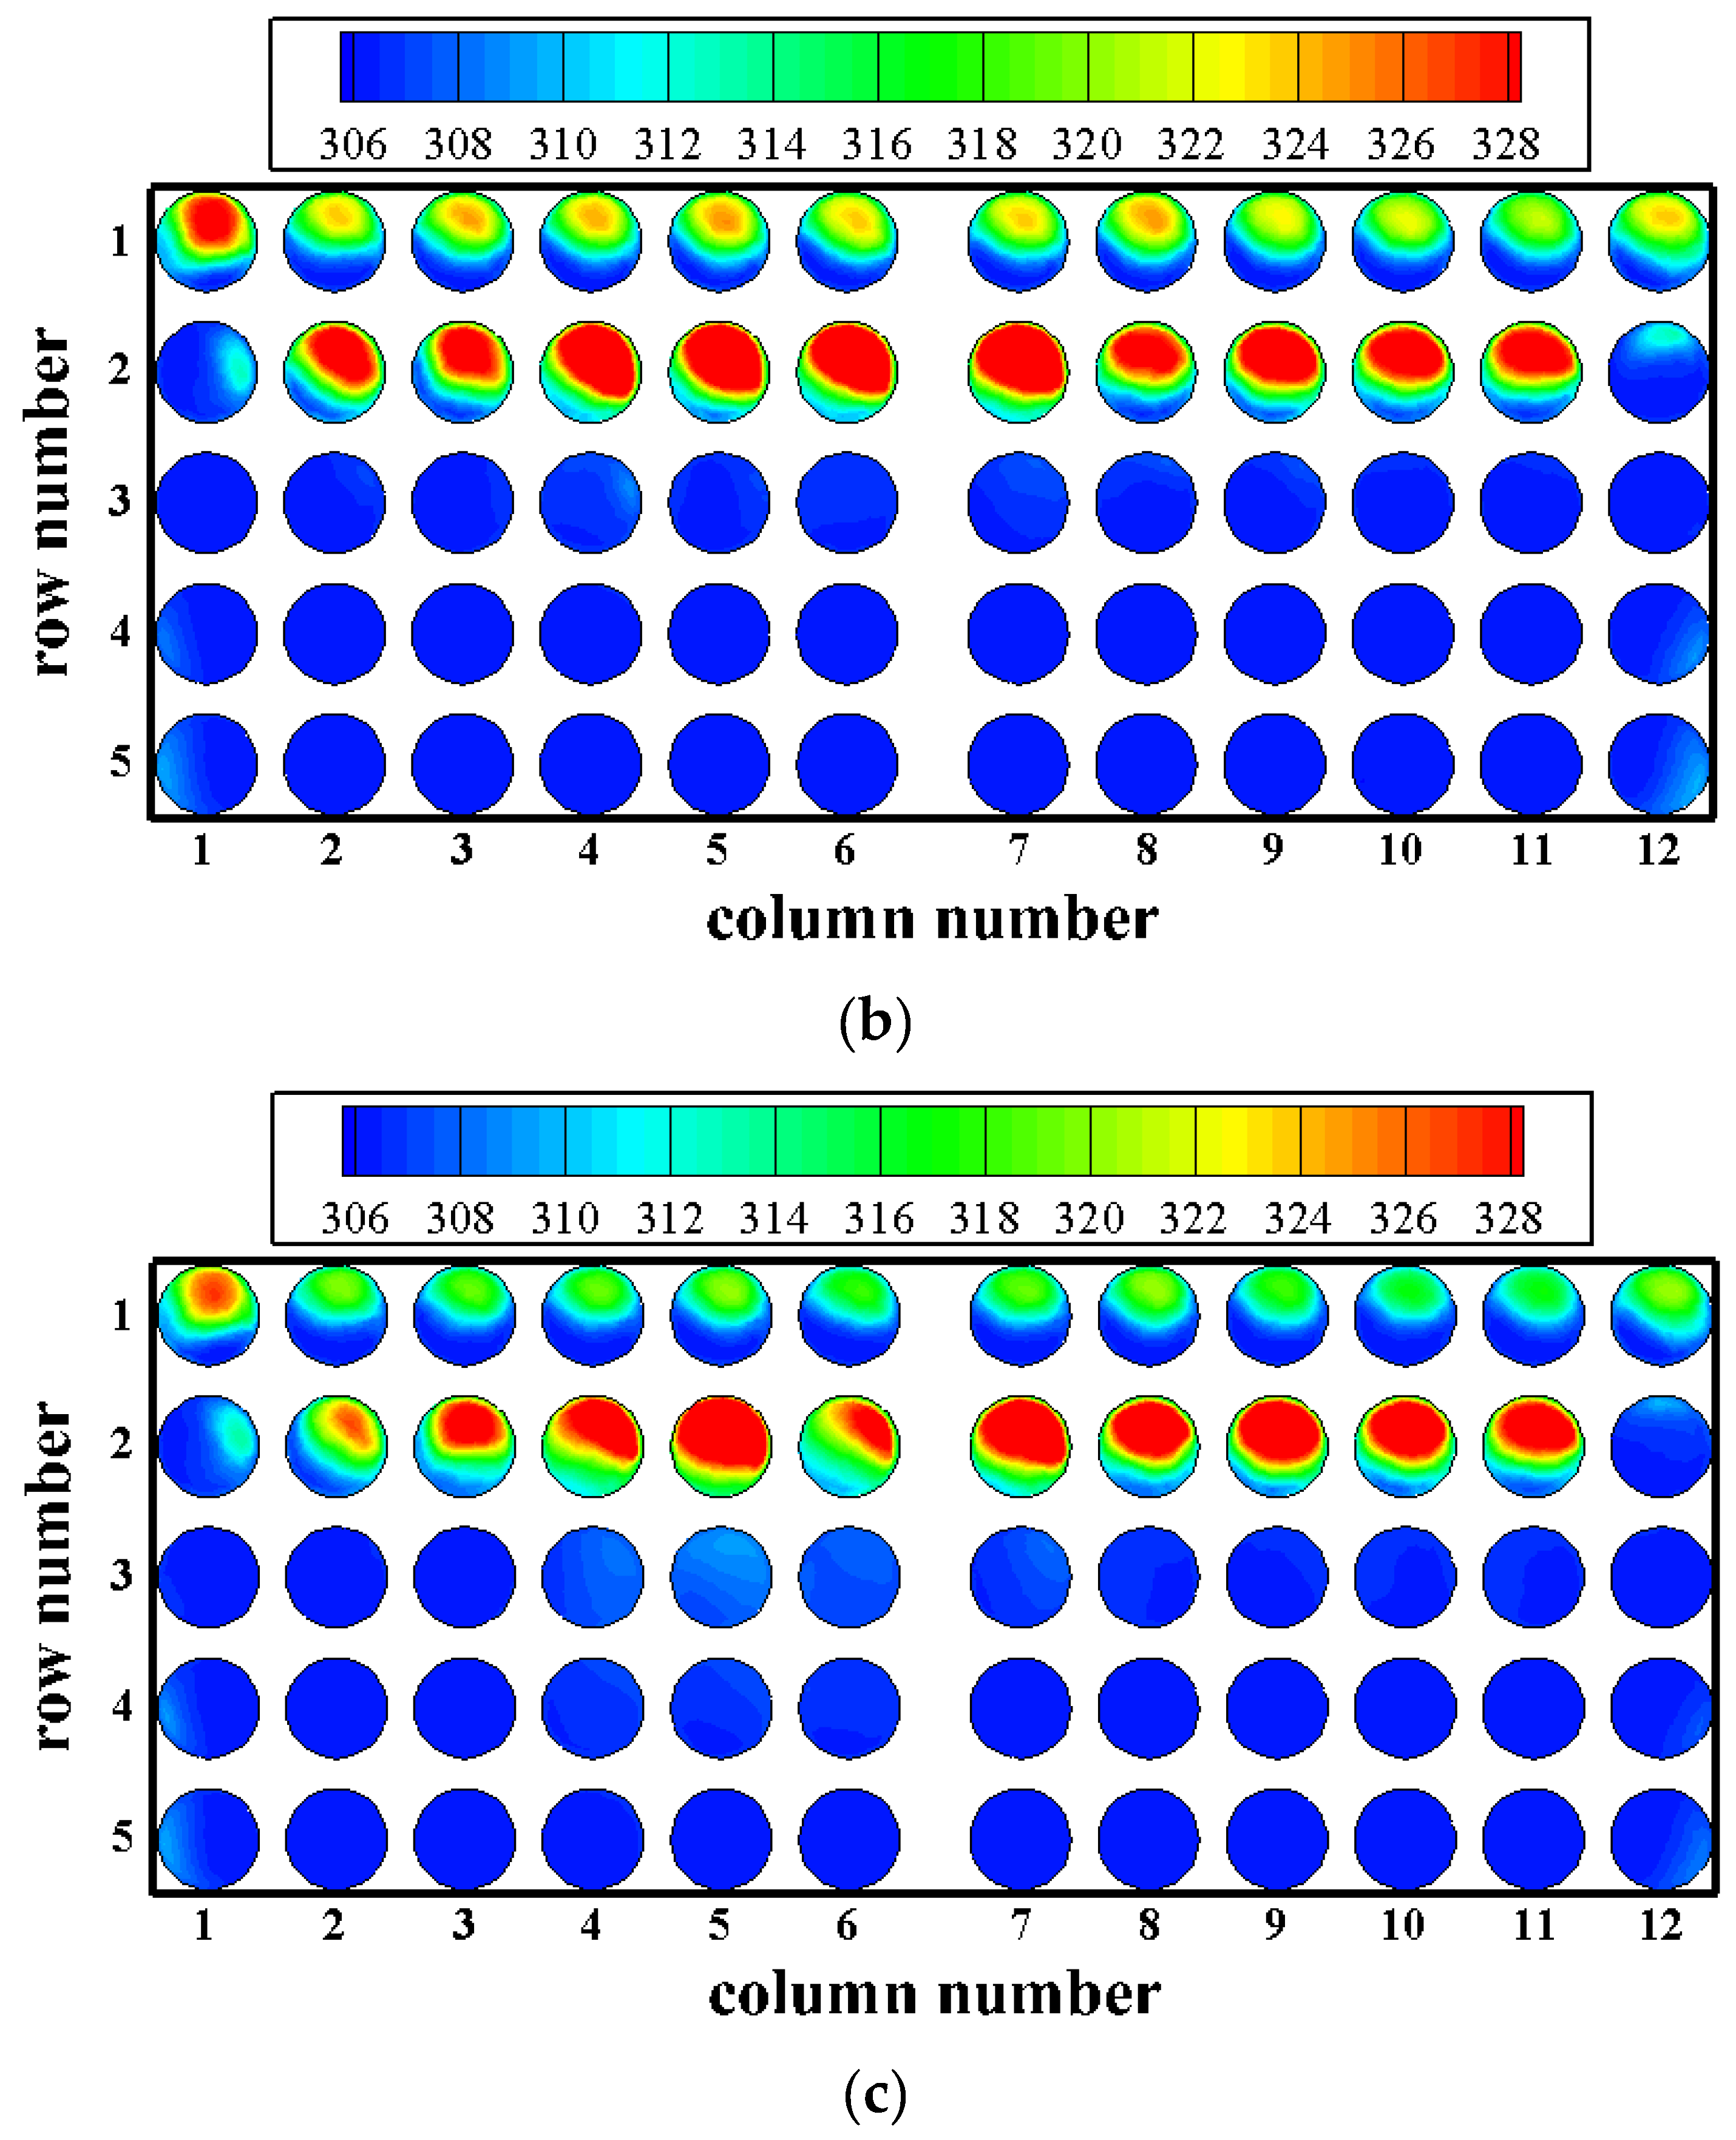
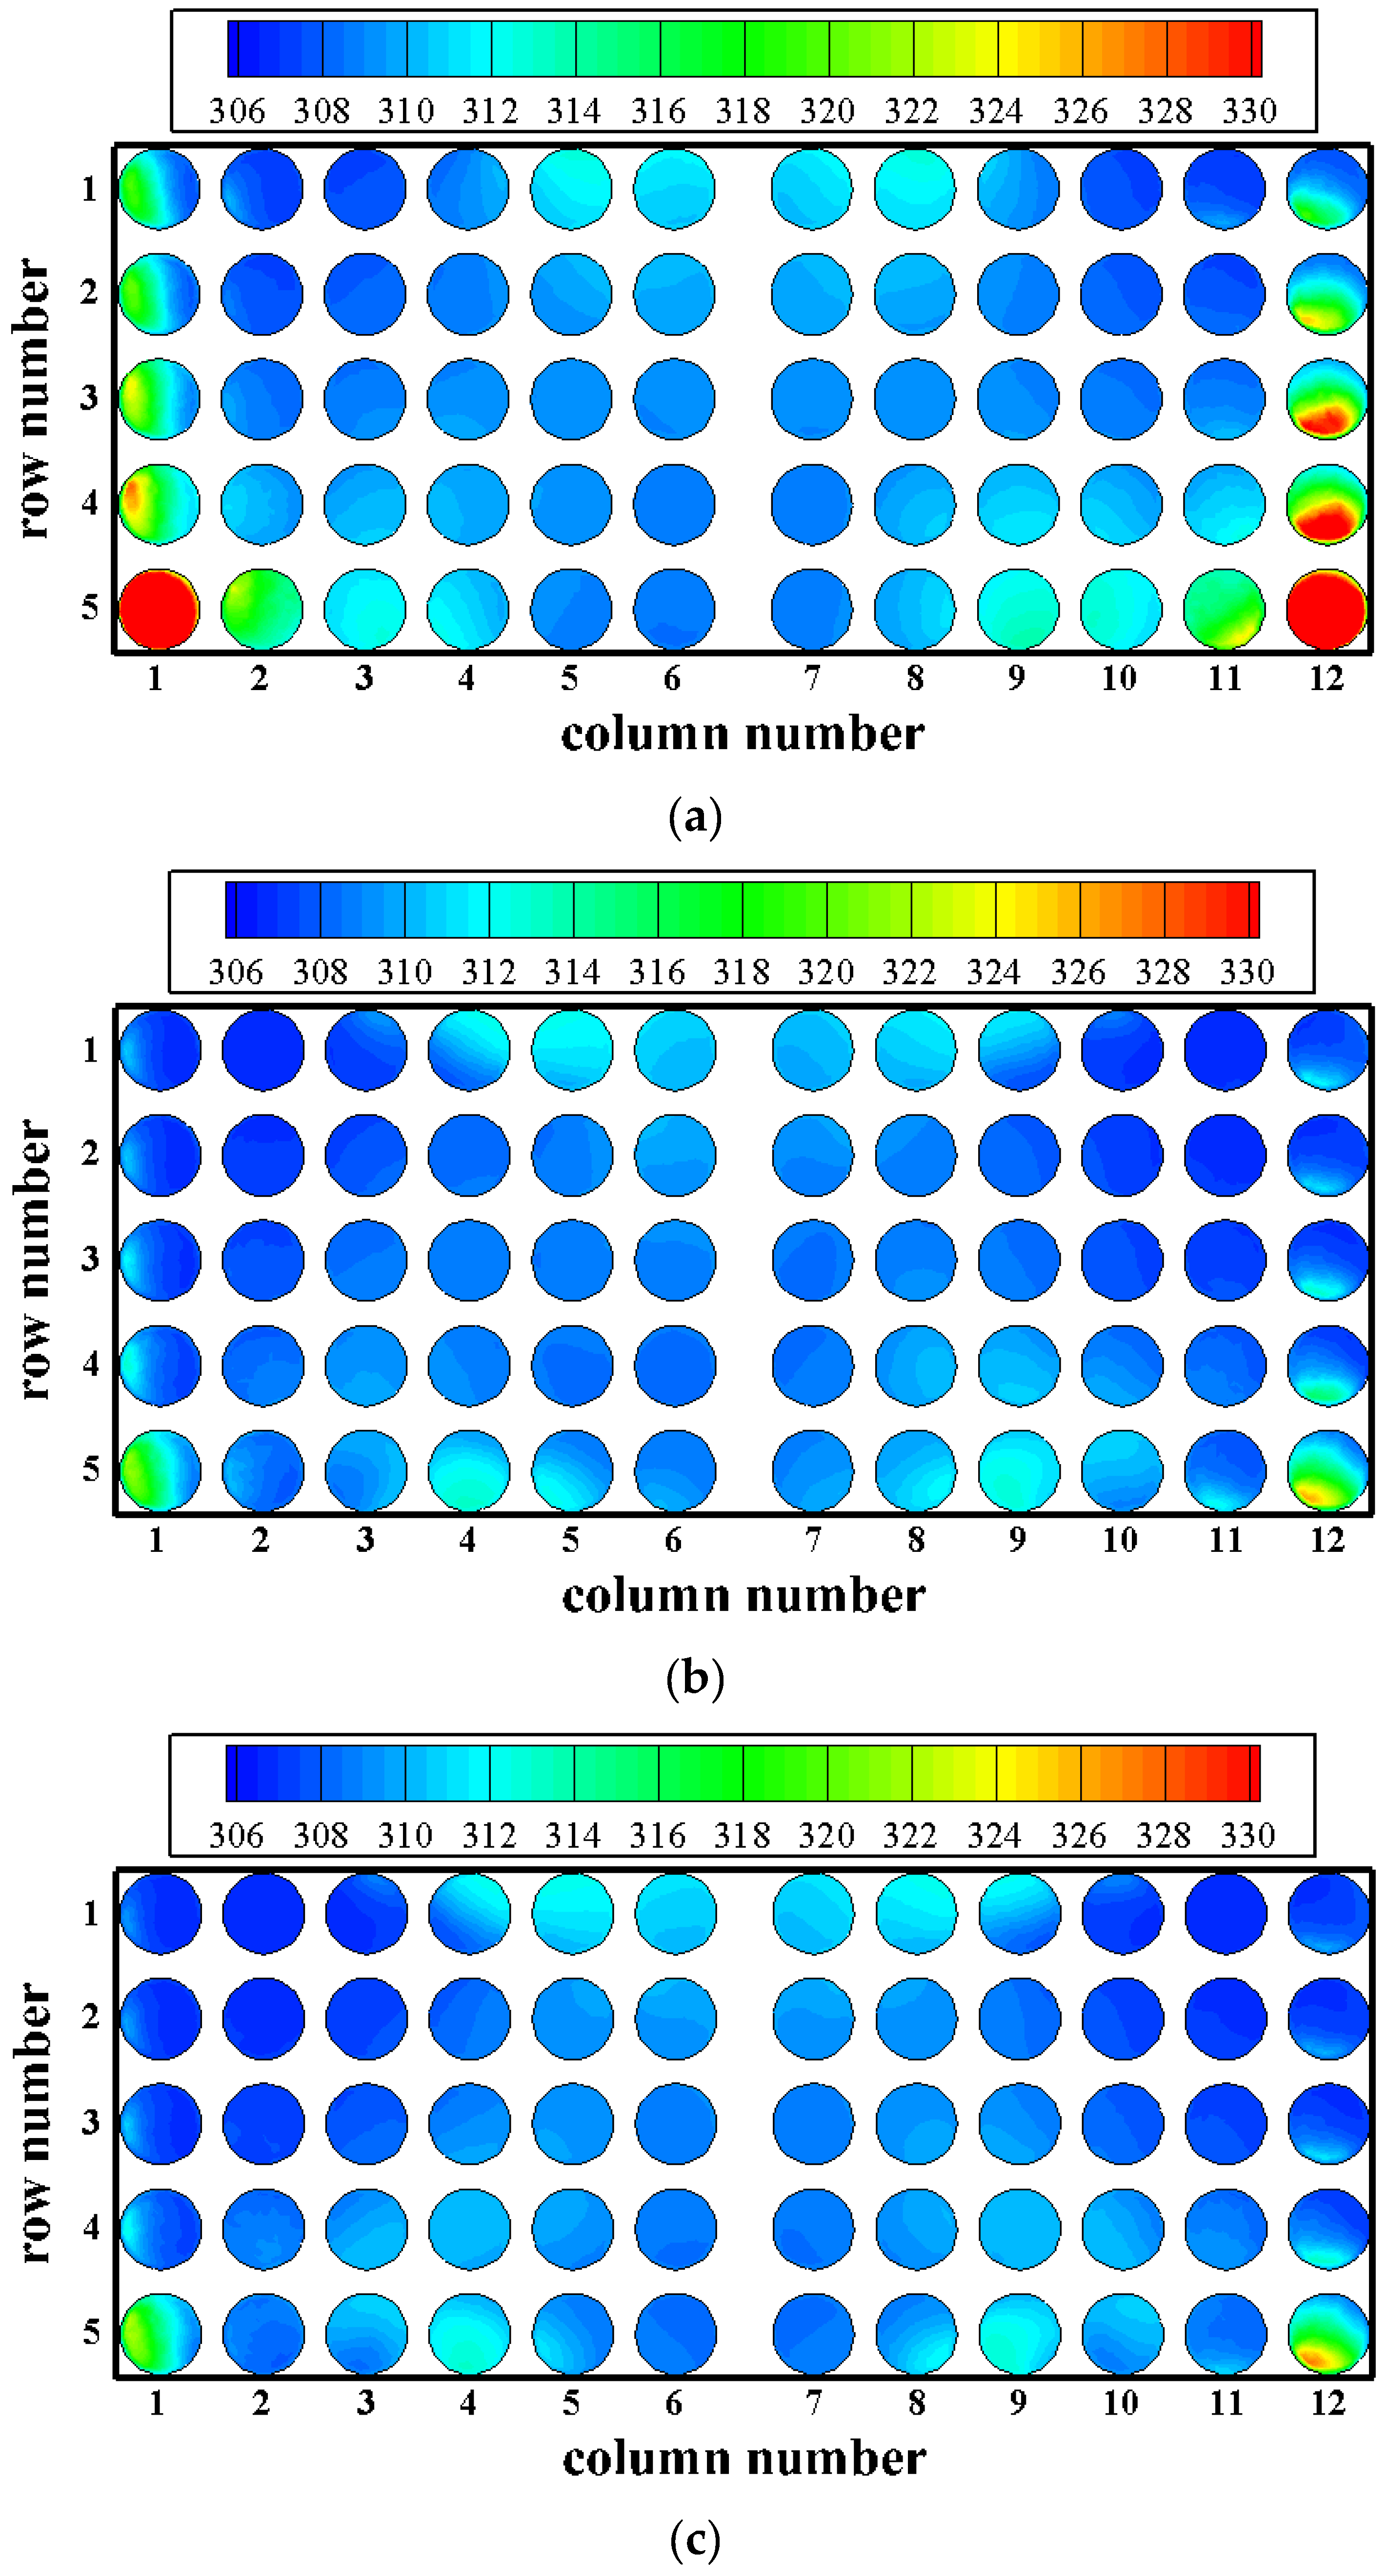
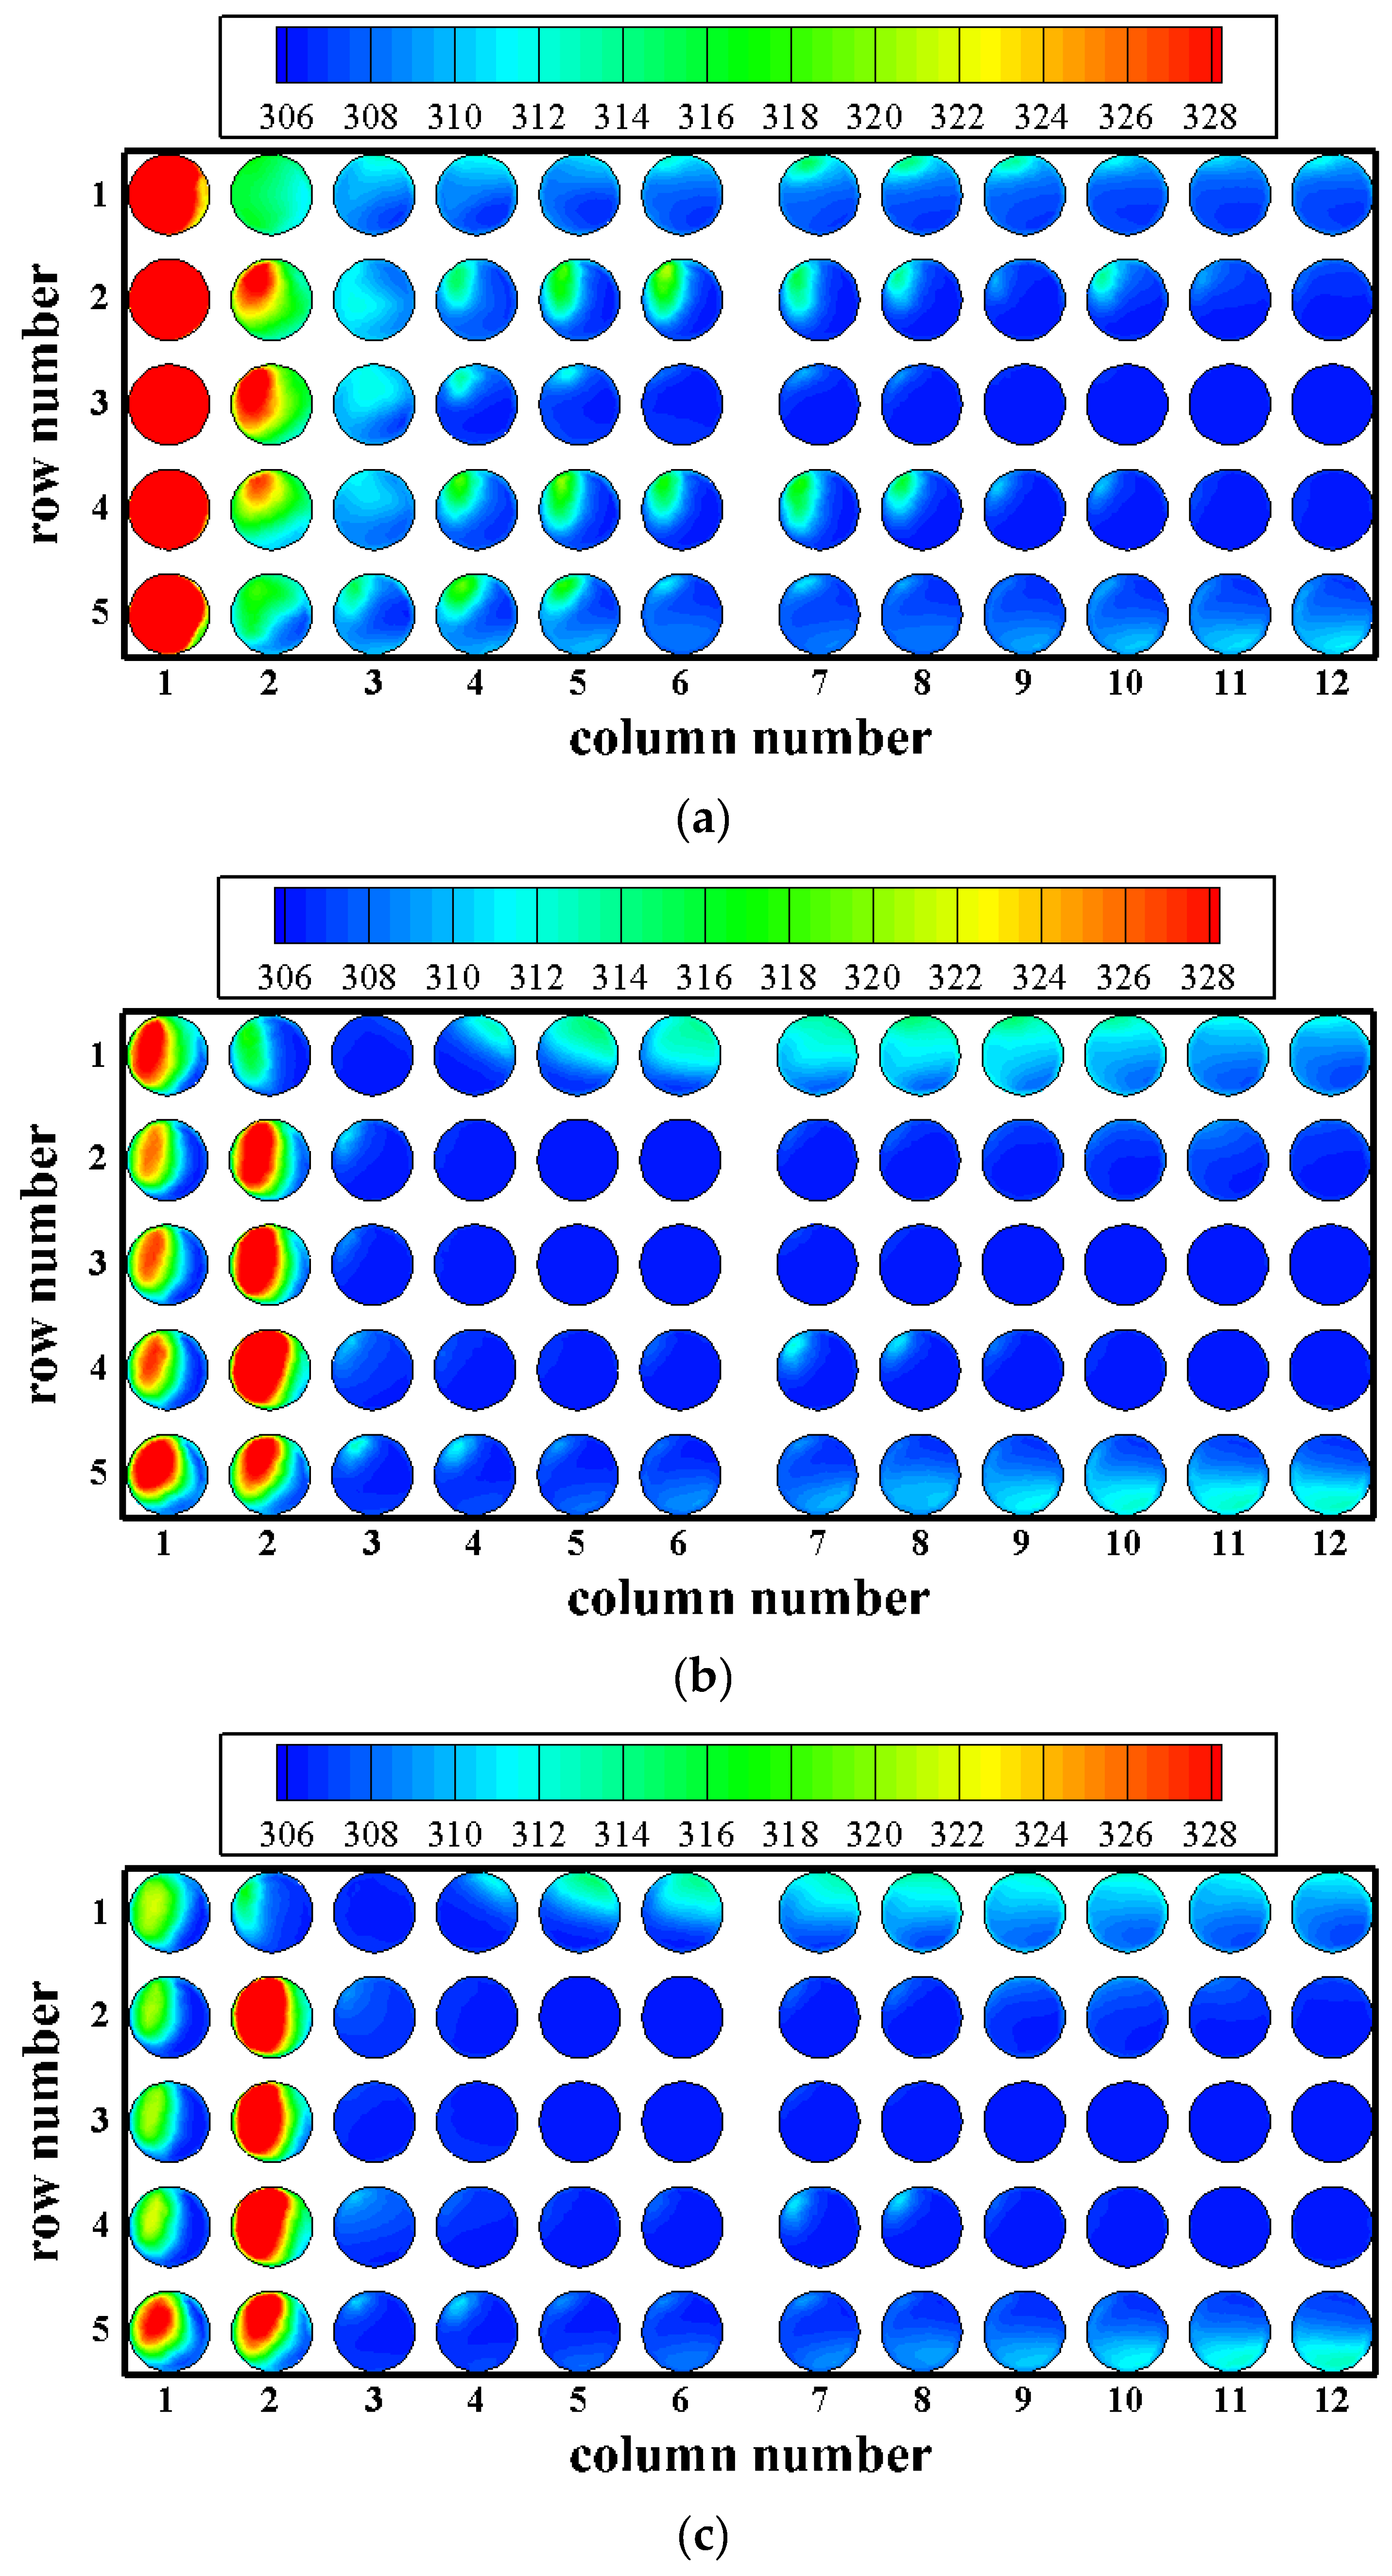
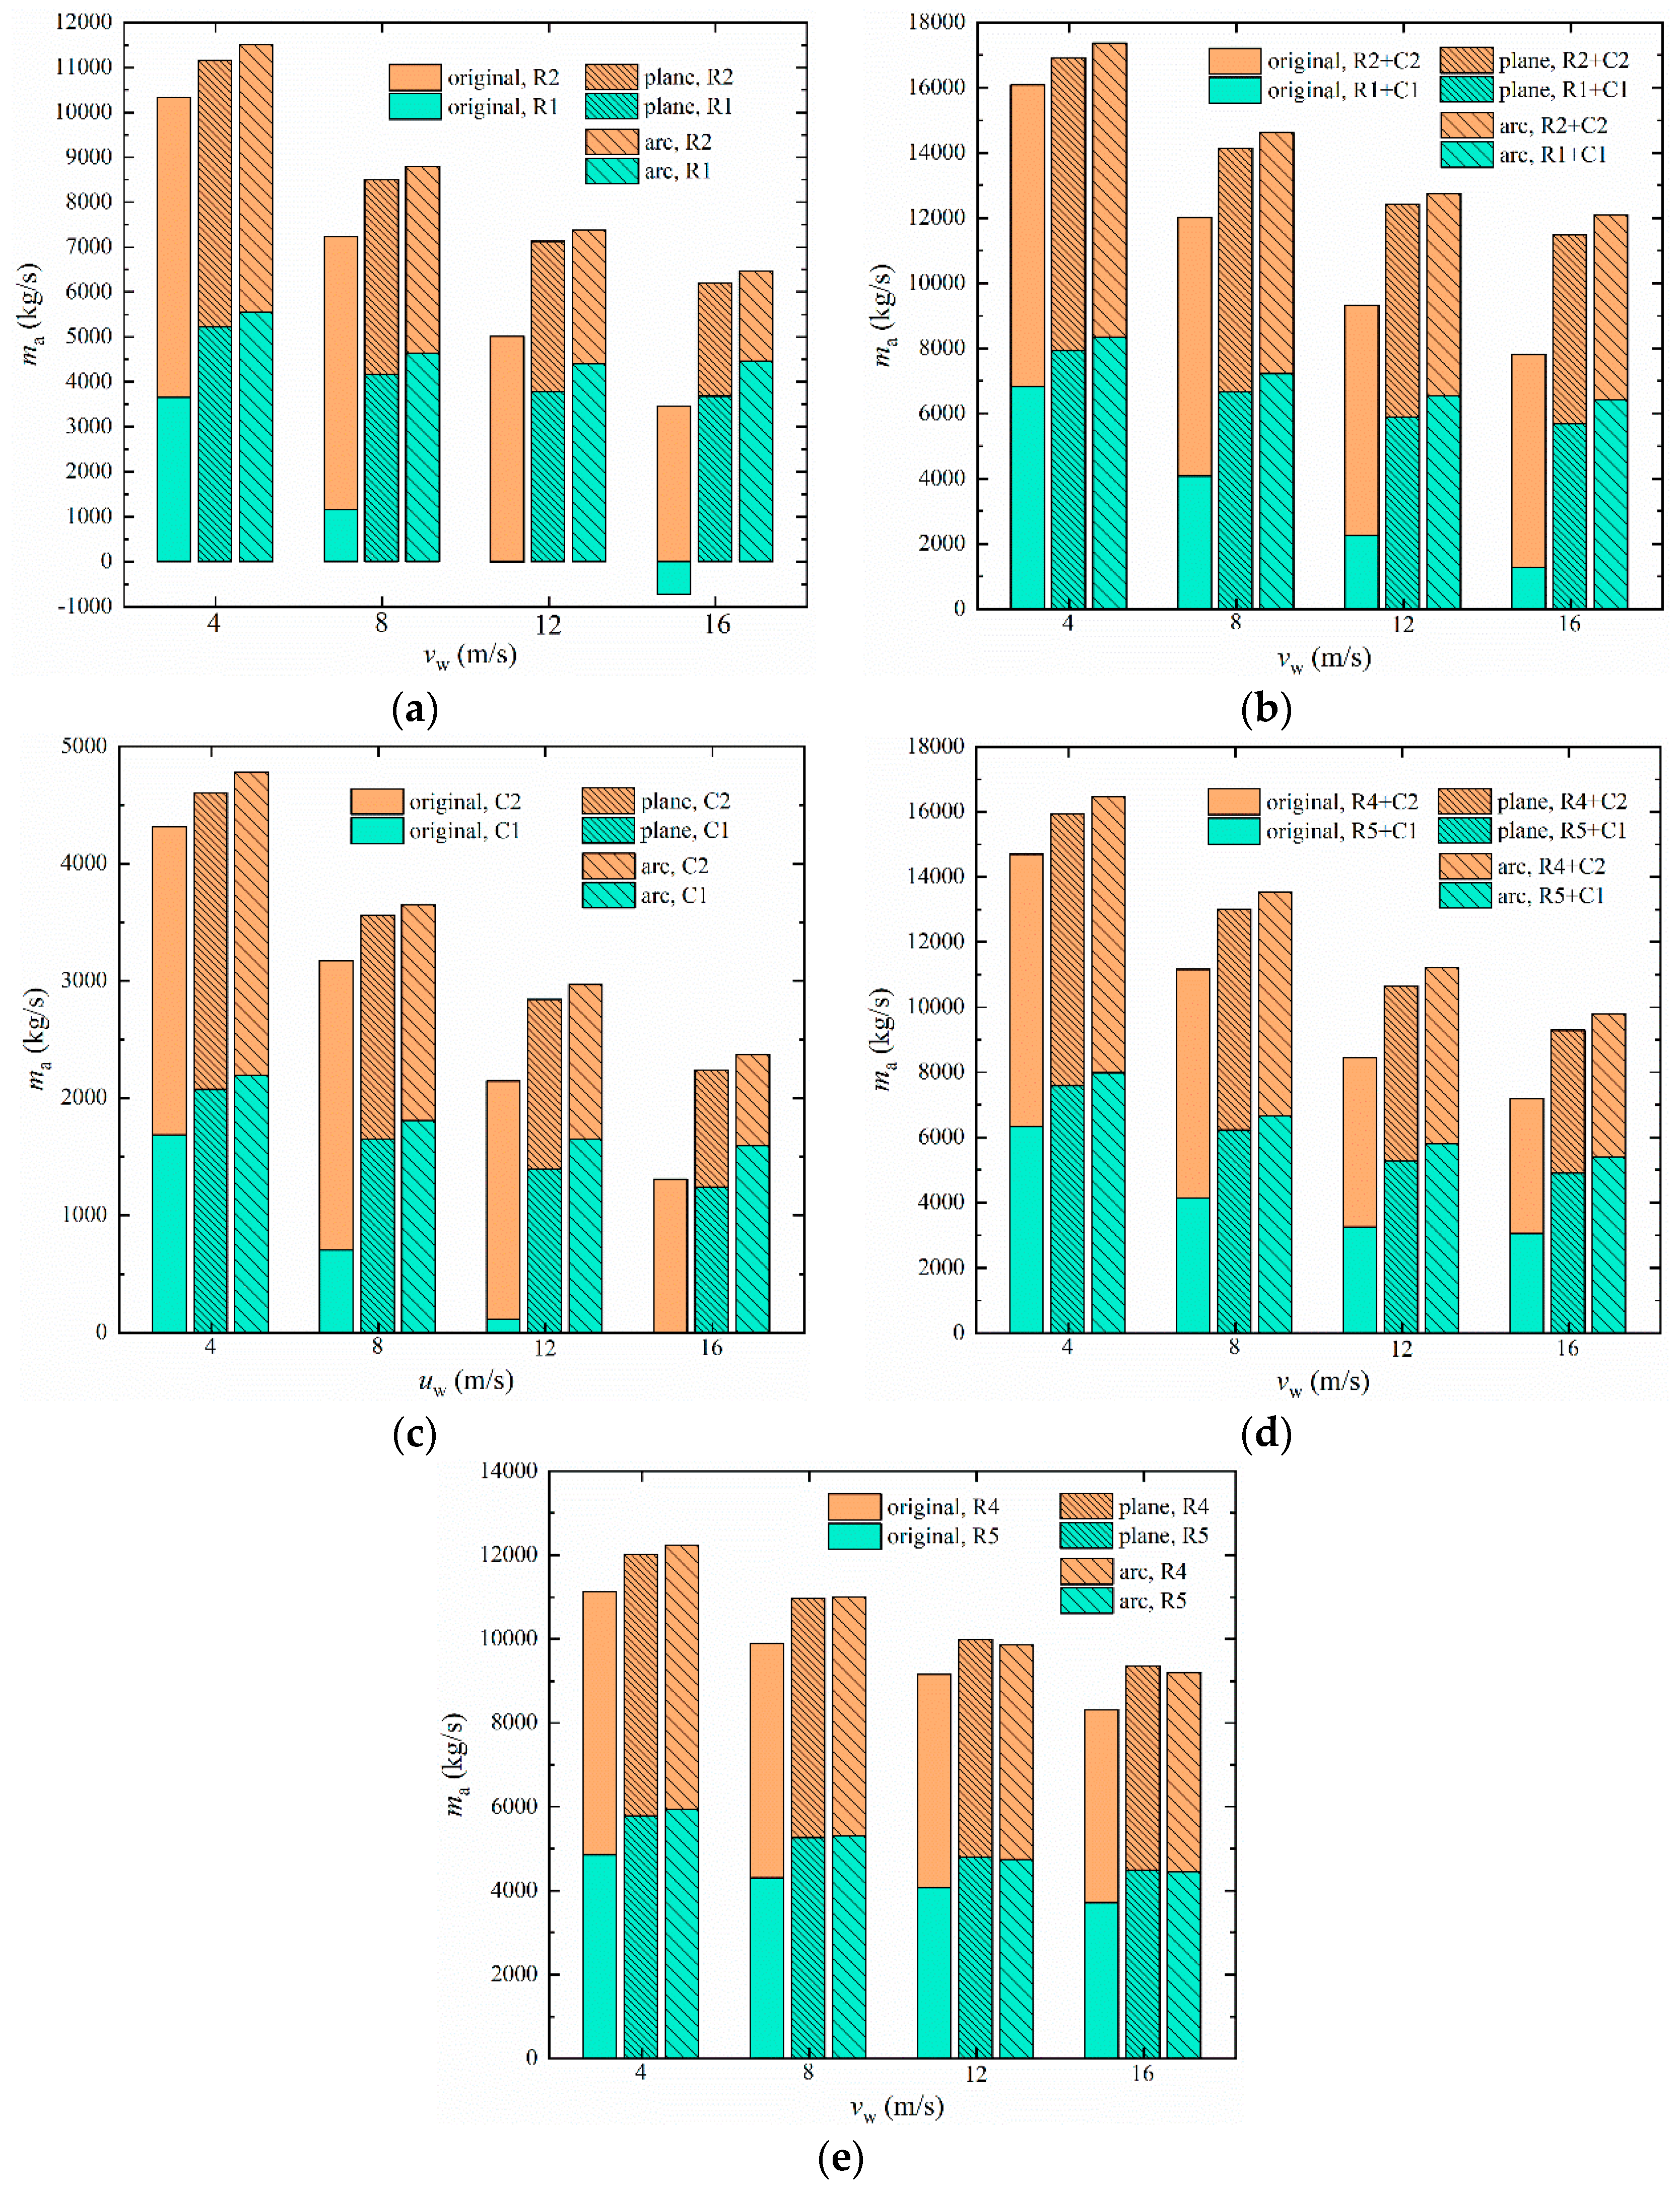
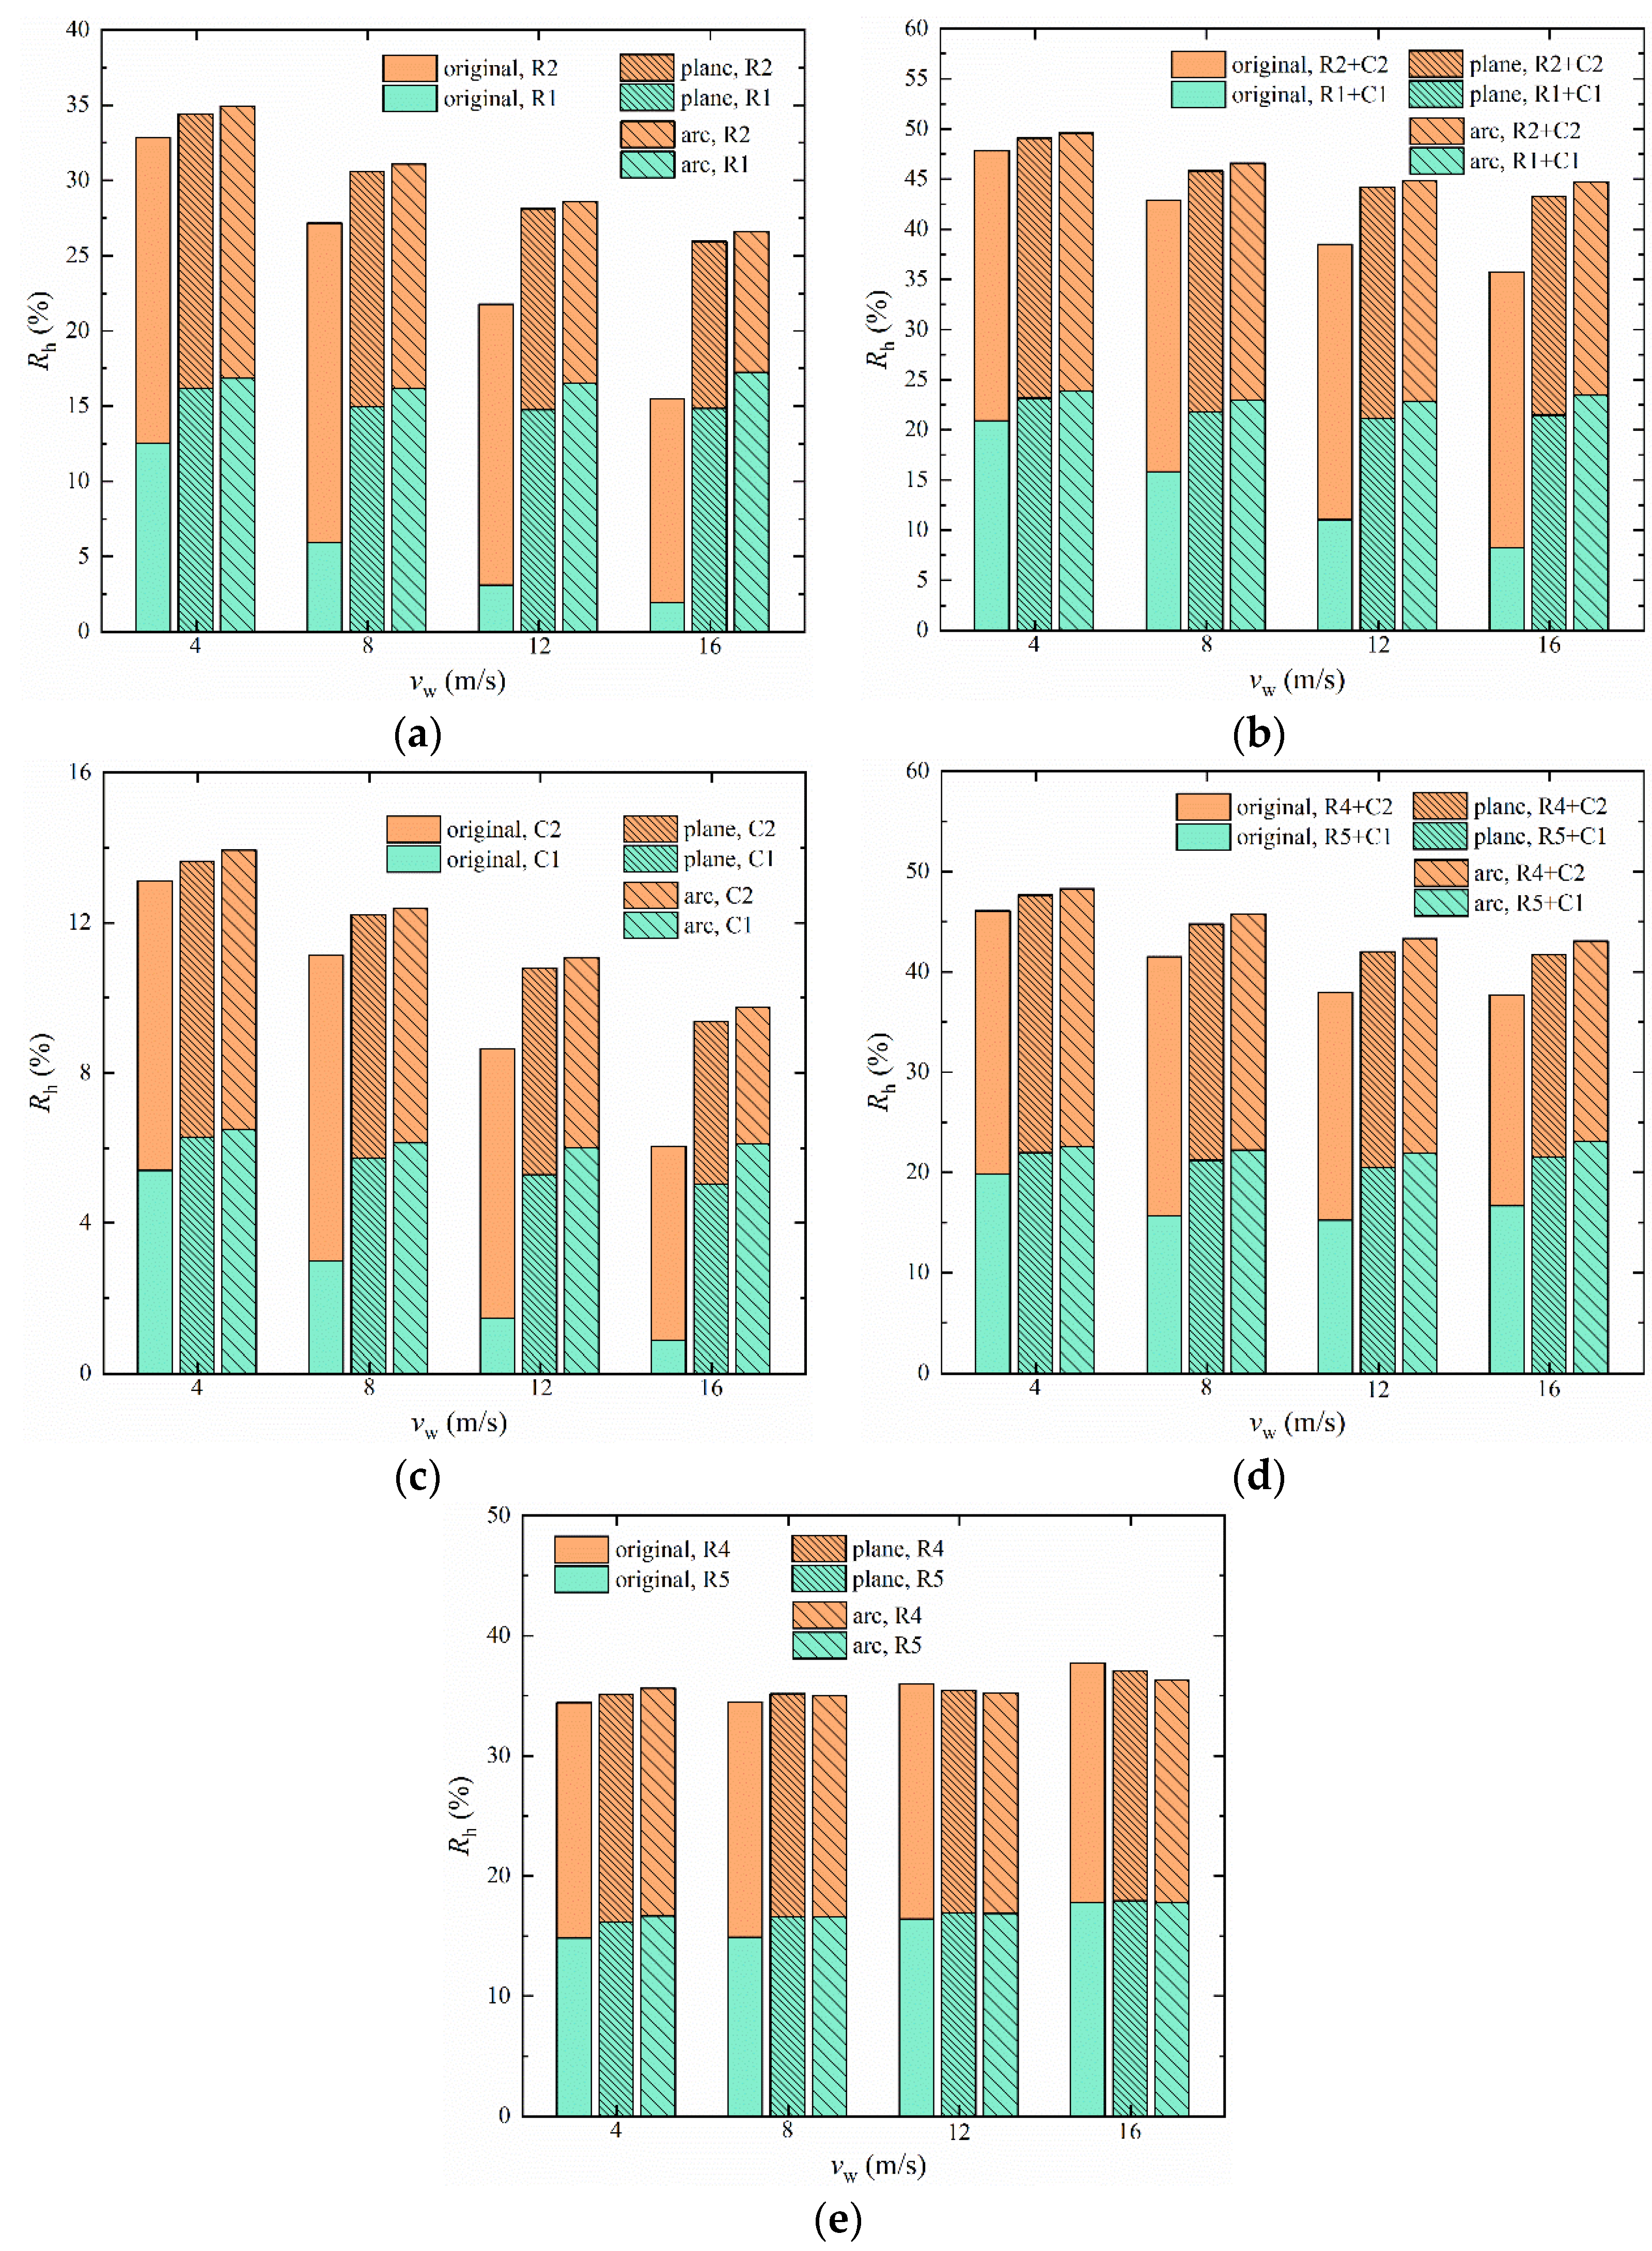
3.2.1. Local Flow Rate and Heat Rejection

Unfavorable effects caused by crosswinds appeared at the first two upwind rows or columns of ACCs, so the heat rejections and air mass flow rates of the R1, R2, C1, and C2 condenser cells were taken into more consideration.
Figure 15 gives the air mass flow rates of the first two columns, rows, or columns and rows in various wind directions and at different wind speeds. The expression “R1+C1” represents the sum of row 1 and column 1 condenser cells, and so do the others. It can be found that the air mass flow rates of upstream condenser cells decreased as the wind speed increased, and even some rates were below zero. A zero or negative air mass flow rate implies that no fresh cooling air passed through the ACCs, which deteriorates the performance of ACCs.
For all cases, the mass flow rate through the first upstream column or row condenser cells with air deflectors was always bigger than that without air deflectors. However, for the second column or row condenser cells, the air flow rate decreased. Even so, the air flow rate sum of R1 and R2 condenser cells with air deflectors always exceeded that without air deflectors, which also happened in other wind directions. Furthermore, when the wind speed increased, the increase of the air mass flow rate sum was larger.
Comparing the results of ACCs with arc and plane deflectors, it is not difficult to find that the air mass flow rate through the first column or row condenser cells with arc deflectors was greater than that with plane deflectors, which is coincident with the results shown in Figure 7, Figure 10, and Figure 14. Moreover, as for the second column or row ACCs along the wind direction, the results were the opposite. Fortunately, the air flow rate sum of upwind columns and rows with arc deflectors was more favorable for most cases.
To evaluate the contributions of the two upwind columns and rows to the whole ACC, a dimensionless parameter, Rh, was introduced to express the ratio of upwind condenser cell heat rejection to the overall heat rejection of ACCs, as follows
R h = Φ up Φ total × 100 %
where Φup represents the heat rejection of upwind condenser cells, namely, different column and row condenser cells in various wind directions. For example, when the wind direction equals −90°, the upwind condenser cells represent the R1 and R2 condenser cells. Φtotal represents the total heat rejection of the whole ACC.
Figure 16 shows the Rh at various wind speeds and in various wind directions. It can be seen that the Rh decreases with an increasing wind speed in most cases, showing that the thermal performance of the upwind condenser cells were weakened as the wind speed increased. For most cases, except when the wind direction was 90°, the Rh of the first upstream column or row condenser cells with air deflectors was always bigger than that without air deflectors. However, for the second column or row condenser cells in the wind direction, the Rh decreased a lot. For example, as shown in Figure 16a, when the wind speed was 16 m/s, the Rh of R1 in the original ACC was about 2%, which is far less than the average level of 20%, and it rose up to about 17% in ACCs with arc deflectors, close to 20%. Nevertheless, for the R2 condenser cells, the Rh was about 14% without air deflectors, but it dropped nearly to 9%. The sum of R1 and R2 Rh values in the ACCs with deflectors was higher than that in the original ACCs in most cases. When the wind direction was 90°, the Rh varied a little and even dropped because of the blocking effects of the main buildings. As mentioned in Figure 12, the backward fan inlet temperature dropped a little, showing that the thermal performance of the backward condenser cells with air deflectors was improved. Subsequently, Rh could decrease. Furthermore, as the wind speed increased, the difference in the Rh sum between the ACCs with and without air deflectors gradually increased. The difference in the Rh sum of R1 and R2 between original ACCs and ACCs with arc deflectors was about 2% at a wind speed of 4 m/s, but it increased to about 11% when the wind speed was 16 m/s.
Comparing the Rh of ACCs with arc and plane deflectors, it can be found that, along the wind direction, the Rh with arc deflectors exceeded that with plane deflectors for most cases. However, in the wind direction of 90°, the Rh with arc deflectors was almost equal to that with plane deflectors. Moreover, as for the second column or row condenser cells along the wind direction, the results were the opposite. Satisfactorily, the Rh sum of upwind condenser cells with arc deflectors was more favorable for most cases.

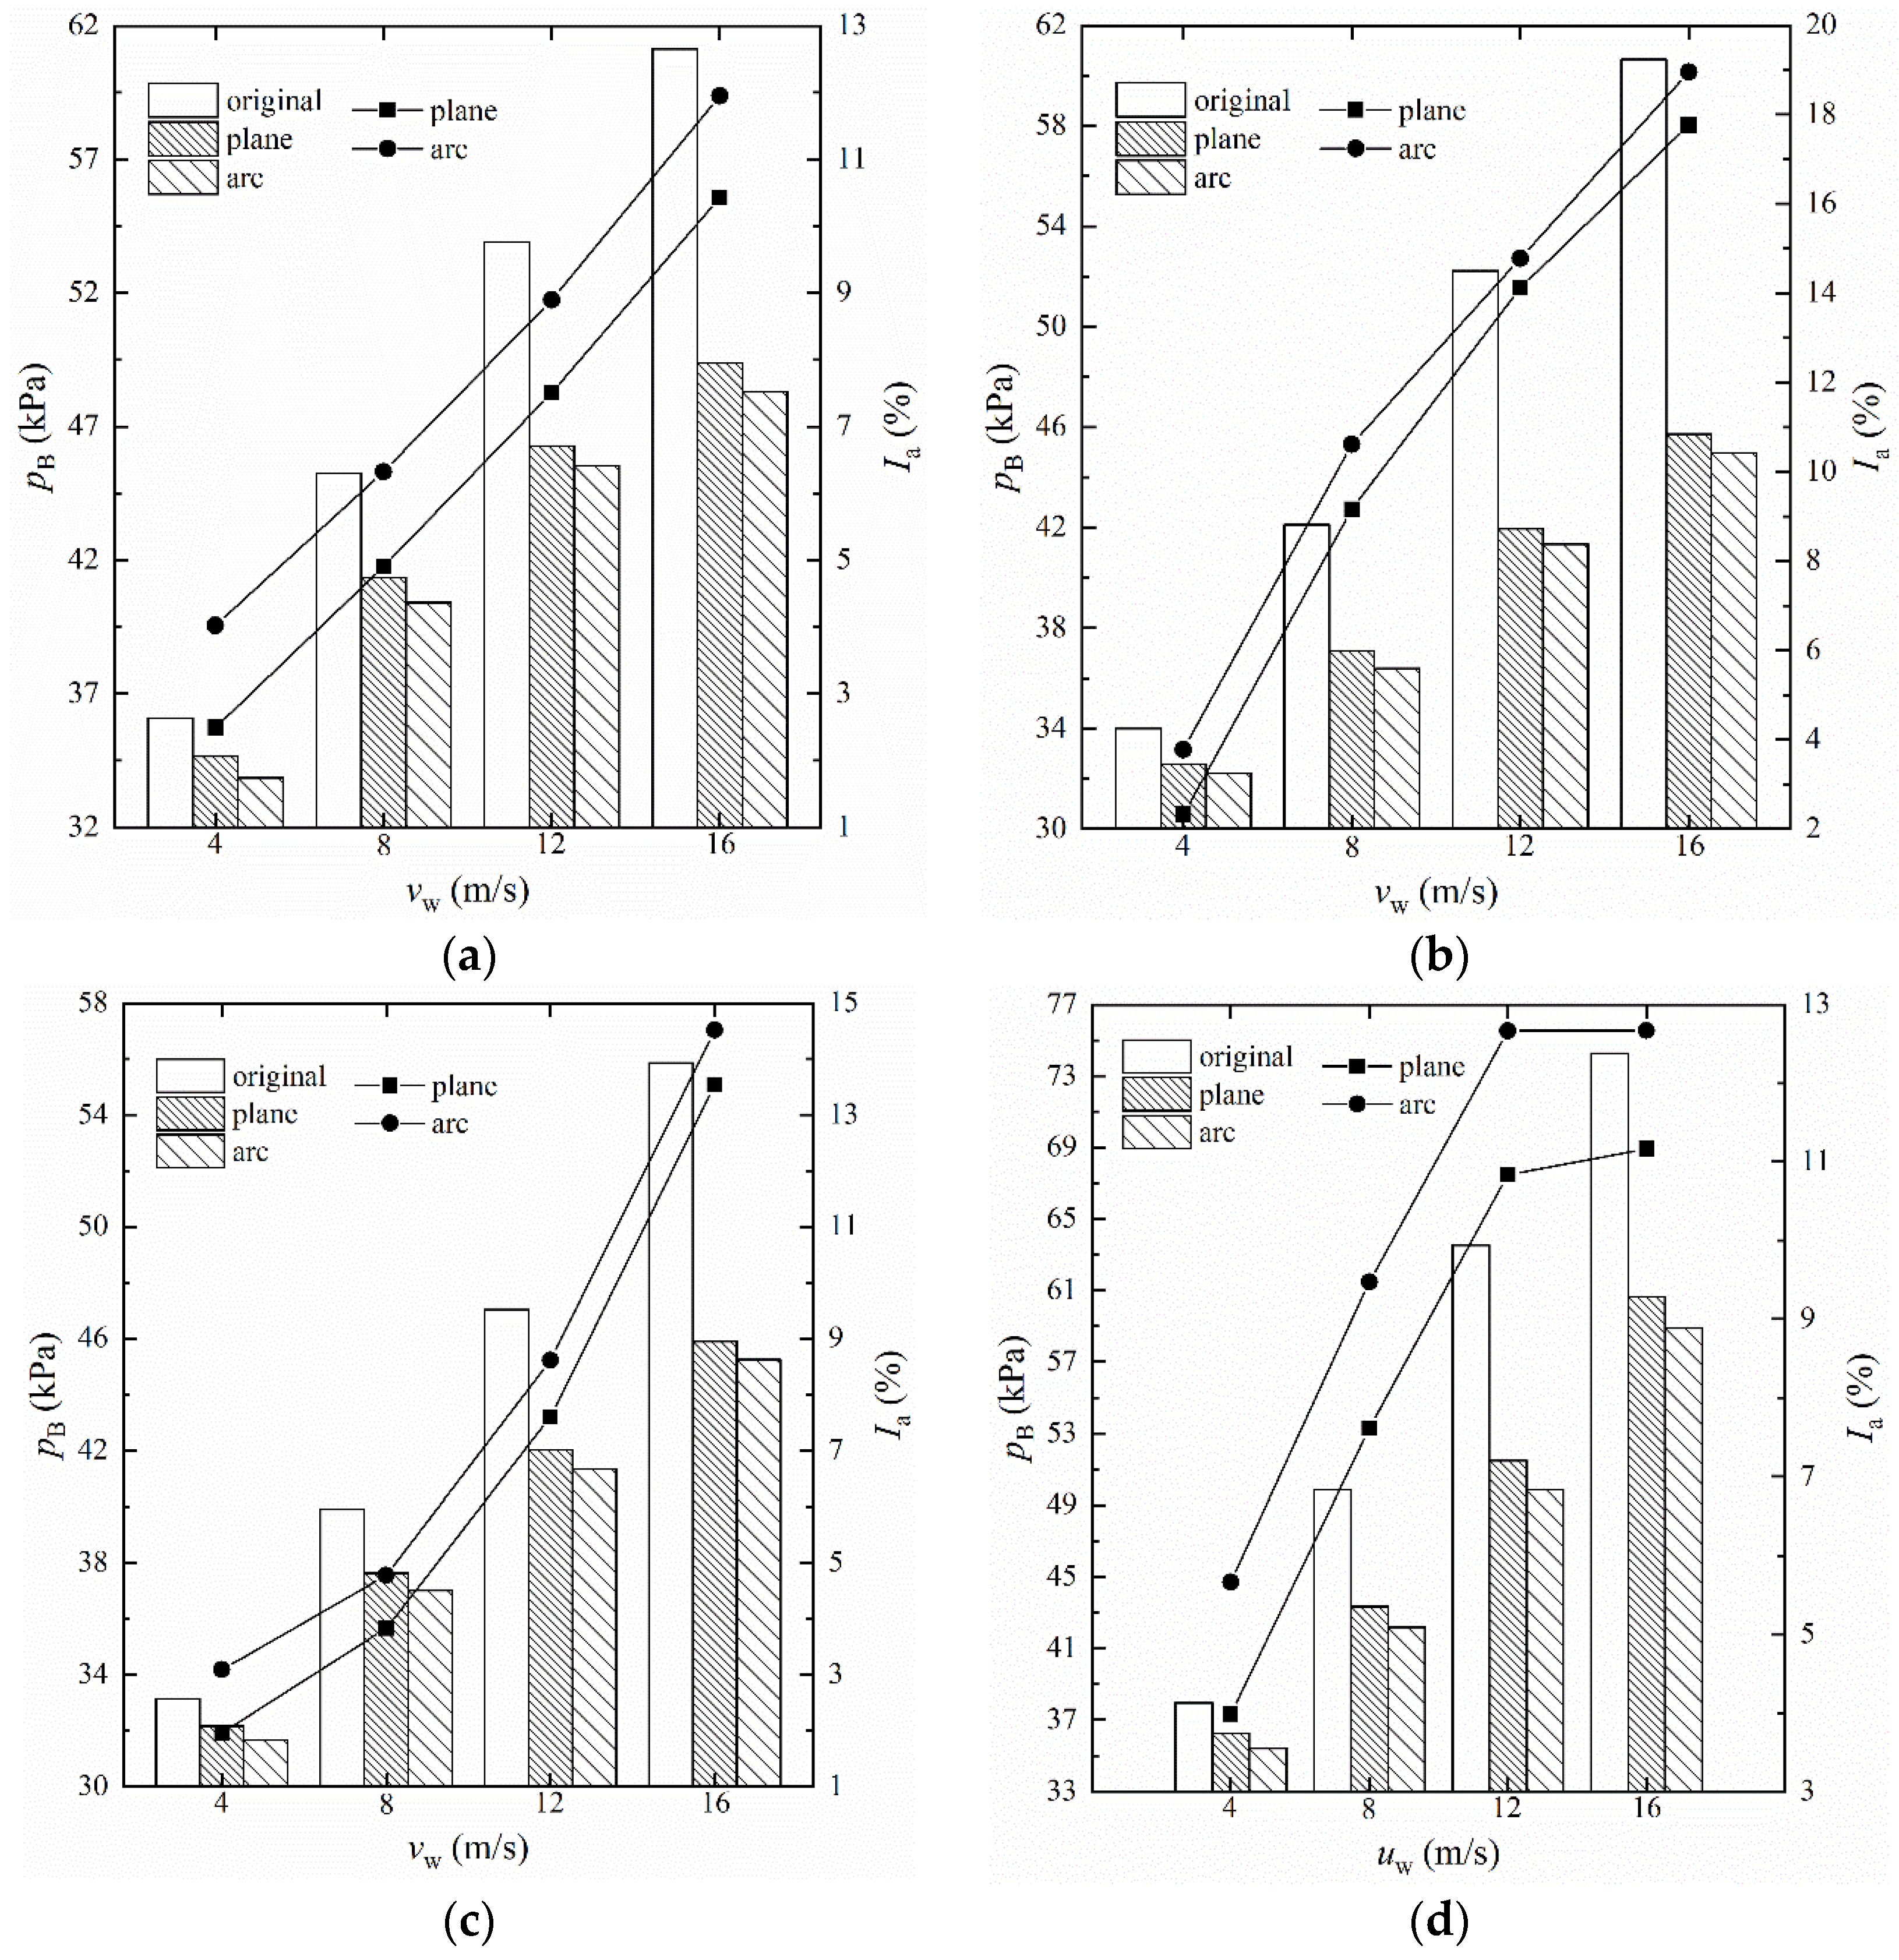
3.2.2. Total Flow Rate and Back Pressure

The thermo-flow performances of upwind condenser cells was improved by the guidance of air deflectors, which affected the cooling performance of the ACCs. A dimensionless parameter, Ia, was introduced to evaluate the increase of air flow rate of the whole ACC, with the following form
I a = m a d m o m o × 100 %
where mo and mad are the total air mass flow rates of ACCs without and with air deflectors, respectively. In addition, the unit back pressure pB was obtained to present the operational efficiency of the power plant.
Figure 17 shows the variations of Ia and pB under various windy conditions, where the bar and curve represent the pB and Ia, respectively. In general, as the wind speed increased, Ia increased, showing that the air deflectors led to an incremental total mass flow rate under strong crosswinds. With arc deflectors as shown in Figure 17a, Ia at the wind speed of 4 m/s was about 4%, and it increased to about 12% at a wind speed of 16 m/s. Furthermore, the Ia of ACCs with arc deflectors was always greater than that with plane deflectors, showing that the arc deflectors could lead more air to flow into the ACCs. For the pB, whether with or without air deflectors, it always increased with increasing the wind speed, indicating that the crosswinds deteriorated the cooling performance of the ACCs. With air deflectors, the pB decreased clearly, and the difference of pB without and with air deflectors expanded as the wind speed rose. For instance, as displayed in Figure 17a, the difference of pB without and with arc deflectors was about 2 kPa when the wind speed was 4 m/s, but it increased to about 13 kPa when the wind speed was 16 m/s. Conclusively, the unit back pressure with arc deflectors was always lower than that with plane deflectors under windy conditions, showing that the arc deflectors can help the power generating unit to operate at a higher energy efficiency.
Table 4 lists the results of Ia and pB, with and without air deflectors, without wind. It can be observed that the performance of ACCs with air deflectors improved a little, showing that the air deflectors were also beneficial to the cooling performance of ACCs without wind.

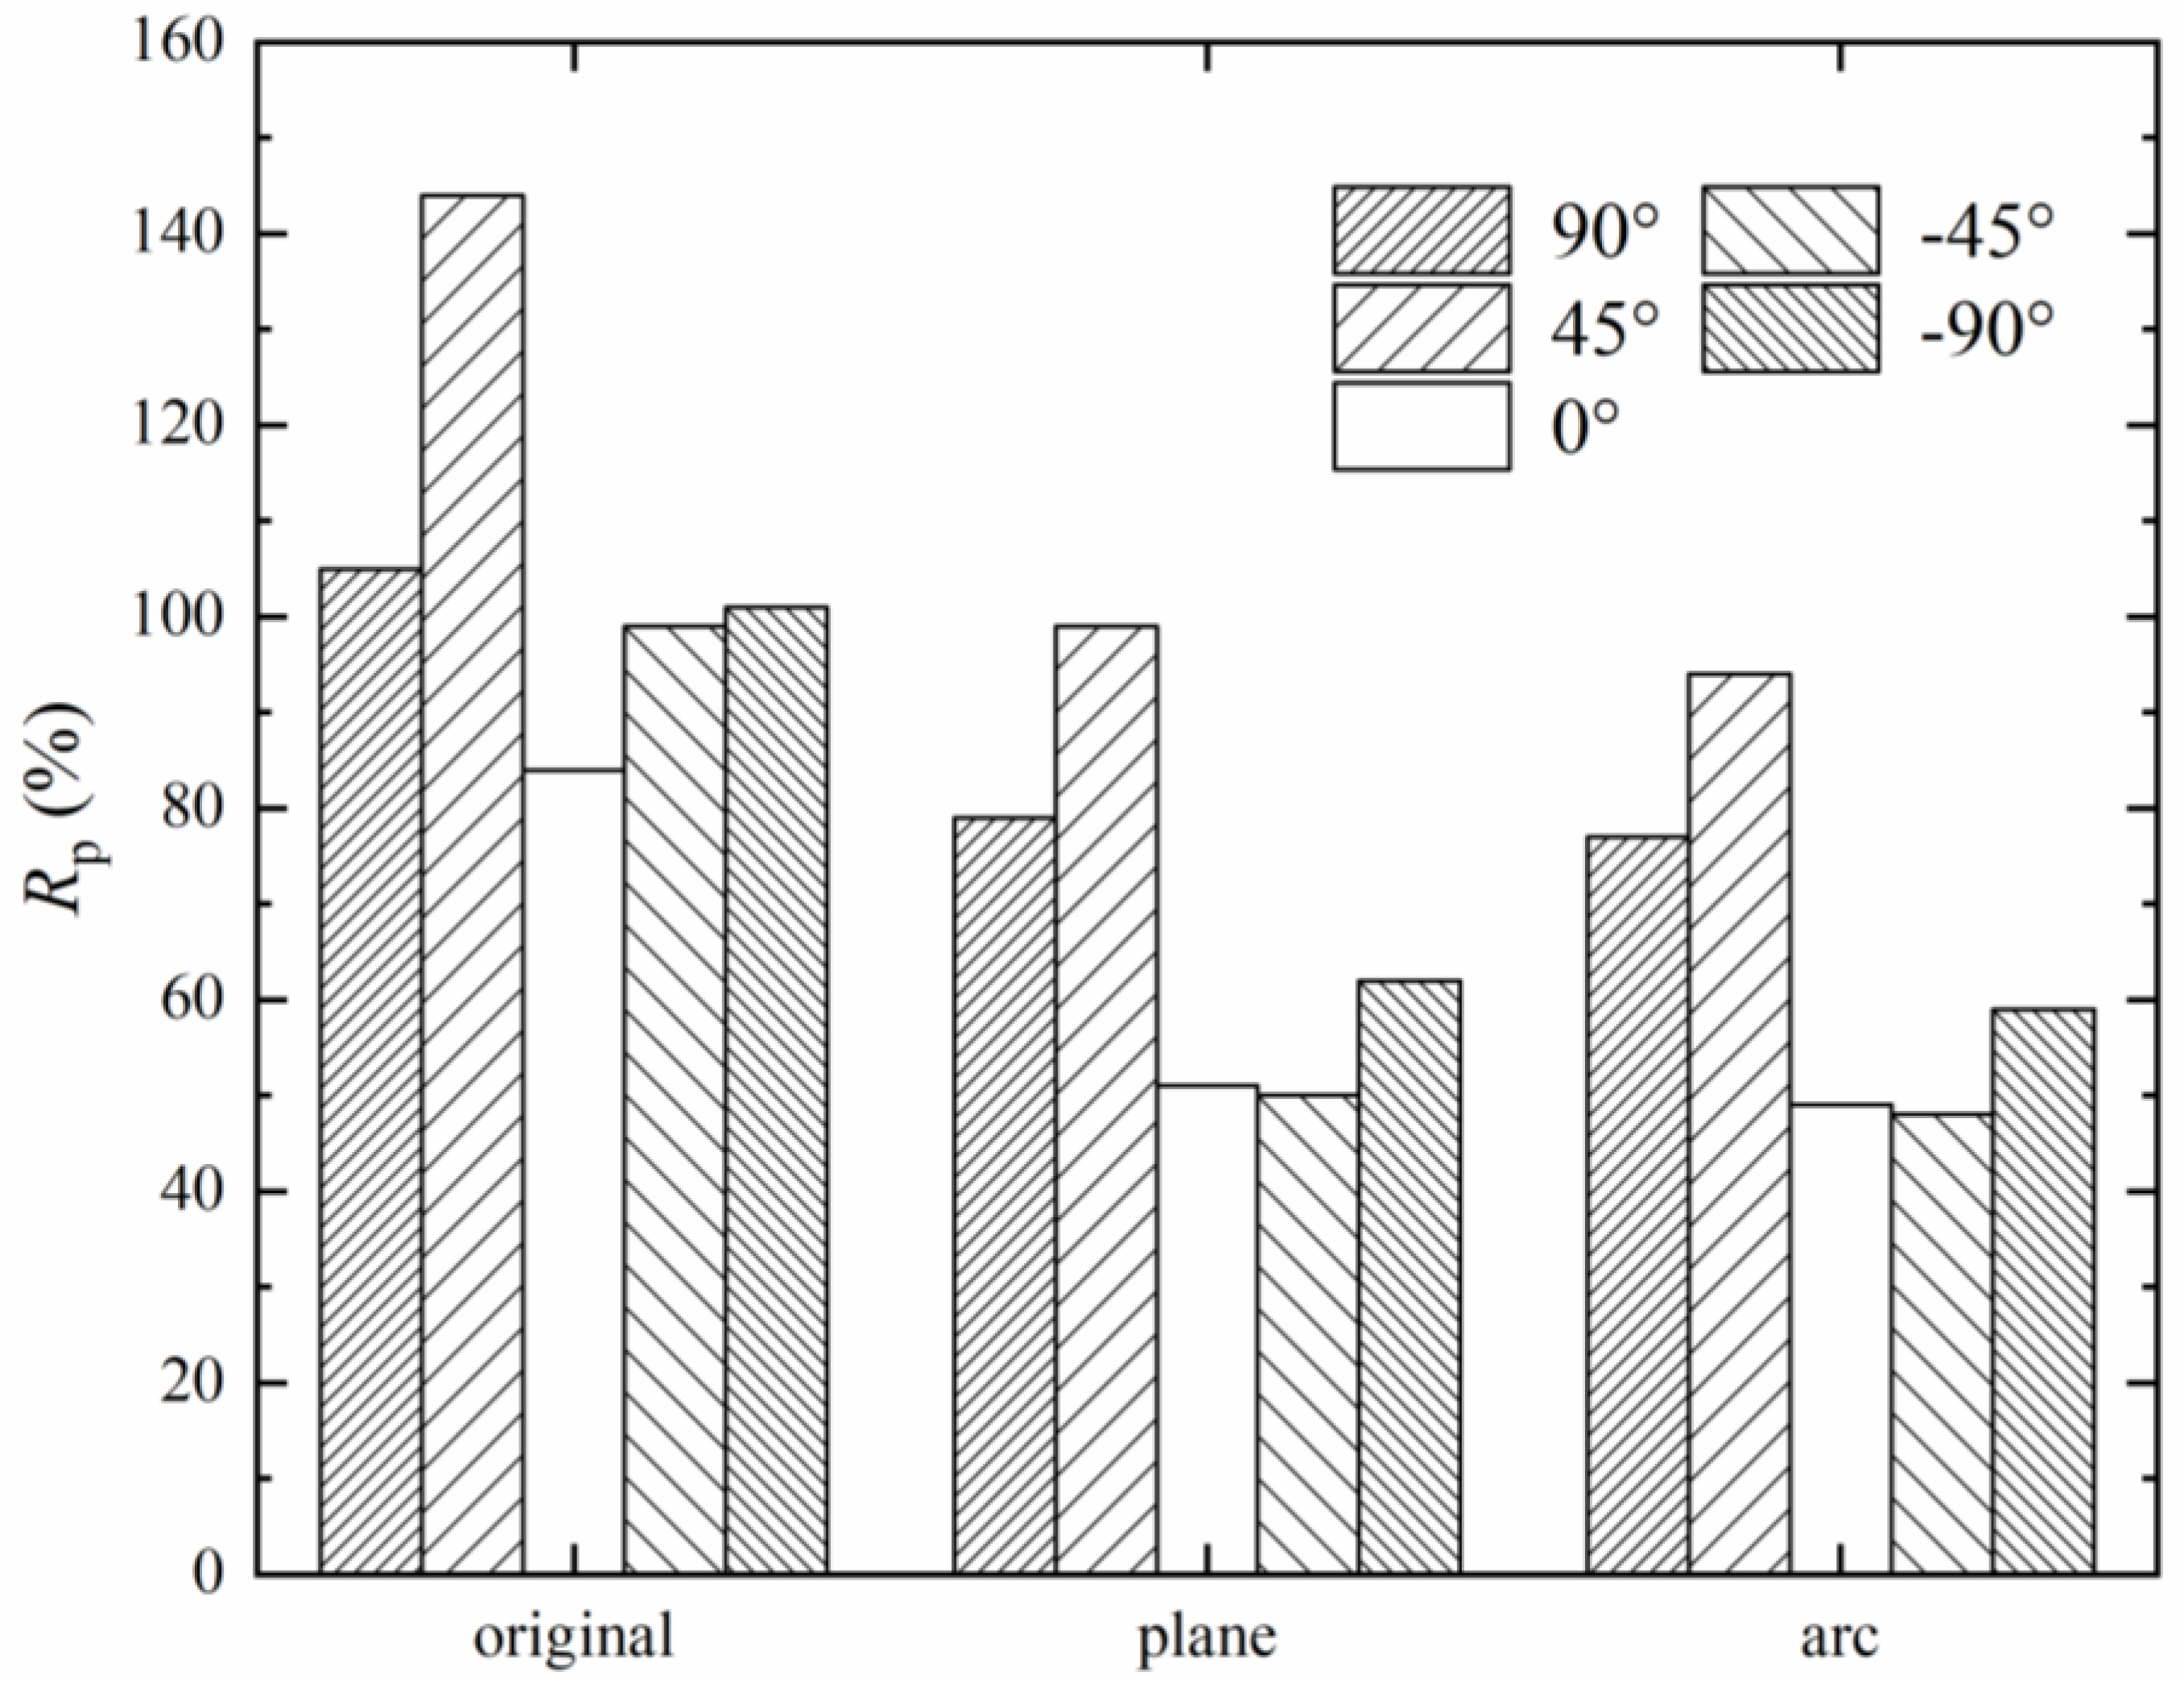
3.2.3. Comparison of Different Wind Directions

As mentioned above, the cooling performance of ACCs with or without air deflectors varied with the wind direction, so a dimensionless parameter for unit back pressure, Rp, was introduced as follows to evaluate the effect of wind direction.
R p = p B , wind p B , nowind p B , nowind × 100 %
where pB,wind and pB,nowind are the unit back pressure under windy and windless conditions, respectively.
Taking the wind speed with a value of 16 m/s as an example, Figure 18 displays the change of Rp with wind direction for ACCs with and without air deflectors. In general, in the wind direction of 45°, the performance of the ACCs was most unfavorable, which was mainly attributed to the combined effects of crosswinds and main buildings. For instance, the back pressure for ACCs without air deflectors in the wind direction of 45° was over 2.4 times than that in the absence of winds, and even with arc deflectors it only dropped to about twice over. Fortunately, with air deflectors, the performance improvements for ACCs were most favorable when the wind directions were equal to 45° and −45°, and the Rp dropped to about 50% with arc deflectors.
Without air deflectors, Rp in the wind directions of 90° and −90° were close to 100%, and the difference between them was only about 5%. However, with arc deflectors, the Rp in the wind direction of 90° clearly surpassed that in the wind direction of −90°, and the difference between them expanded to about 20%. What is more, for the original ACCs, the cooling performance in the wind direction of −45° was inferior to that in the wind direction of 0°, with Rp values of 99% and 84%, respectively. But with air deflectors, the Rp values under these two conditions were almost the same, at about 50%.
The proposed air deflector is simple in structure and low in manufacturing cost. The air deflectors are manufactured with steel and are easily installed. Plane air deflectors have been applied in real thermal power stations in China. The arc air deflector can be installed below the fan platform just like the plane one. The manufacturing cost of the air deflector can be ignored compared to that of the whole ACC. In addition, almost no maintenance cost is needed in the operation of air deflectors.

4. Conclusions

Two types of air deflectors are proposed to install below the windward fans to improve the thermo-flow performances of ACCs. With air deflectors, the reverse flows in the upwind condenser cells were weakened, due to the guiding effect, except in the wind direction of 90°, which decreased the upwind fan inlet temperature and helped more air pass through the upwind condenser cells. Subsequently, the cooling performances of upwind condenser cells improved and were close to the average level of ACCs. However, the hot plume recirculation at both sides of the ACC seemed to be enhanced with air deflectors. Even so, the overall cooling performance of ACCs improved with air deflectors. As wind speed increased, the improvement of cooling performance became better. Moreover, the performance improvement for ACCs with air deflectors also depended on direction. In the absence of winds, the cooling performance of the ACC improved a little with air deflectors. For all cases, the cooling performances of ACCs with arc deflectors were superior to that of plane deflectors, since the former can provide a larger deflection angle to lead the air flow into ACCs successfully.

Author Contributions

Conceptualization, X.H.; methodology, X.H.; validation, X.H.; formal analysis, X.H.; investigation, X.H.; data curation, X.H.; writing—original draft preparation, X.H.; writing—review and editing, L.C. and L.Y.; supervision, L.C. and L.Y.; funding acquisition, L.Y., X.D. and Y.Y.

Funding

This research was funded by National Natural Science Foundation of China, grant numbers 51776067 and 51821004, and National Basic Research Program of China, grant number2015CB251503.

Conflicts of Interest

The authors declare no conflicts of interest.

Nomenclature

C1, C, C2, Cconstants in turbulence equations
eexponent in the wind speed equation
fnpolynomial coefficient for fan pressure rise
Gbturbulent kinetic energy source term due to buoyancy
Gkturbulent kinetic energy source term due to mean velocity gradients
gnpolynomial coefficient for fan tangential velocity
hcoefficient of convection heat transfer (W/m2/K)
h’empirical coefficient of convection heat transfer (W/m2/K)
hnpolynomial coefficient for convection heat transfer coefficient
hsexhaust steam enthalpy (J/kg)
hwacondensate water enthalpy (J/kg)
Idimensionless improvement (%)
kturbulent kinetic energy (m2/s2)
kLflow loss coefficient
Nnumber
Llength of finned tube bundles
mmass flow rate (kg/s)
ppressure (Pa)
Prtturbulent Prandtl number for energy
qheat flux (W/m)
Rhheat rejection share of upwind cells on ACCs
rradial distance from fan center (m)
rnpolynomial coefficient for loss coefficient
Smodulus of the mean rate-of-strain tensor
Sφinherent source term in the conservation equation for scalar φ
Sφadditional source term in the conservation equation for scalar φ
ttemperature (°C)
vvelocity (m/s)
zheight above the ground (m)
Greek symbols
Γdiffusion coefficient (m2/s)
εturbulent kinetic energy dissipation (m2/s3)
μ, μt, μedynamic, turbulent and effective viscosity, respectively (kg/m/s)
σk, σε, σtturbulent Prandtl number for k, ε and t, respectively
Φheat rejection (W)
ρ density (kg/m3)
φ scalar variable
Subscripts
1inlet
2outlet
aair
adair deflector
fface
i, j, kcomponent in x, y, and z direction, respectively
paparallel to the gravitational vector
peperpendicular to the gravitational vector
ooriginal
upupwind
ssteam
wawater
wwind
θtangential

References

  1. Engelbrecht, R.; Meyer, C.J.; van der Spuy, S.J. Modelling Strategy for the Analysis of Forced Draft Air-Cooled Condensers using Rotational Fan Models. J. Therm. Sci. Eng. Appl. 2019, 11, 51011. [Google Scholar] [CrossRef]
  2. Butler, C.; Grimes, R. The effect of wind on the optimal design and performance of a modular air-cooled condenser for a concentrated solar power plant. Energy 2014, 68, 886–895. [Google Scholar] [CrossRef]
  3. Hotchkiss, P.J.; Meyer, C.J.; Von Backström, T.W. Numerical investigation into the effect of cross-flow on the performance of axial flow fans in forced draught air-cooled heat exchangers. Appl. Therm. Eng. 2006, 26, 200–208. [Google Scholar] [CrossRef]
  4. Yang, L.J.; Du, X.Z.; Yang, Y.P. Wind effect on the thermo-flow performances and its decay characteristics for air-cooled condensers in a power plant. Int. J. Therm. Sci. 2012, 53, 175–187. [Google Scholar] [CrossRef]
  5. Liu, P.; Duan, H.; Zhao, W. Numerical investigation of hot air recirculation of air-cooled condensers at a large power plant. Appl. Therm. Eng. 2009, 29, 1927–1934. [Google Scholar] [CrossRef]
  6. Chen, L.; Yang, L.; Du, X.; Yang, Y. Novel air-cooled condenser with V-frame cells and induced axial flow fans. Int. J. Heat Mass Transf. 2018, 117, 167–182. [Google Scholar] [CrossRef]
  7. Li, J.; Bai, Y.; Li, B. Operation of air cooled condensers for optimized back pressure at ambient wind. Appl. Therm. Eng. 2018, 128, 1340–1350. [Google Scholar] [CrossRef]
  8. Jin, R.; Yang, X.; Yang, L.; Du, X.; Yang, Y. Square array of air-cooled condensers to improve thermo-flow performances under windy conditions. Int. J. Heat Mass Transf. 2018, 127, 717–729. [Google Scholar] [CrossRef]
  9. Chen, L.; Yang, L.; Du, X.; Yang, Y. A novel layout of air-cooled condensers to improve thermo-flow performances. Appl. Energy 2016, 165, 244–259. [Google Scholar] [CrossRef]
  10. Zhou, Y.; Cheng, Y.; Zhang, N.; Shi, H. Numerical simulation study of novel air-cooled condenser with lateral air supply. Case Stud. Therm. Eng. 2019, 13, 100354. [Google Scholar] [CrossRef]
  11. Darbandi, M.; Behzadi, H.R.K.; Farhangmehr, V.; Schneider, G.E. Using CFD Simulations to Improve the Air-Cooled Steam Condenser Performance in Severe Windy Conditions via Proper Tuning of Blades Pitch Angles. In Proceedings of the ASME 2018 5th Joint US-European Fluids Engineering Division Summer Meeting, Montreal, QC, Canada, 15–19 July 2018; pp. V2T–V11T. [Google Scholar]
  12. Zhang, X.; Wu, T. Effects of diffuser orifice plate on the performance of air-cooled steam condenser. Appl. Therm. Eng. 2016, 98, 179–188. [Google Scholar] [CrossRef]
  13. Gu, H.; Zhe, Z.; Wang, H.; Qi, C. A numerical study on the effect of roof windbreak structures in an air-cooled system. Appl. Therm. Eng. 2015, 90, 684–693. [Google Scholar] [CrossRef]
  14. Gao, X.F.; Zhang, C.W.; Wei, J.J.; Yu, B. Performance prediction of an improved air-cooled steam condenser with deflector under strong wind. Appl. Therm. Eng. 2010, 30, 2663–2669. [Google Scholar] [CrossRef]
  15. Yang, L.; Du, X.; Yang, Y. Measures against the adverse impact of natural wind on air-cooled condensers in power plant. Sci. China Technol. Sci. 2010, 53, 1320–1327. [Google Scholar] [CrossRef]
  16. Zhang, X.; Chen, H. Effects of windbreak mesh on thermo-flow characteristics of air-cooled steam condenser under windy conditions. Appl. Therm. Eng. 2015, 85, 21–32. [Google Scholar] [CrossRef]
  17. Xu, B.; Bhagwat, S.; Xu, H.; Rokoni, A.; McCarthy, M.; Sun, Y. System-level analysis of a novel air-cooled condenser using spray freezing of phase change materials. Appl. Therm. Eng. 2018, 131, 102–114. [Google Scholar] [CrossRef]
  18. Huang, X.; Chen, L.; Kong, Y.; Yang, L.; Du, X. Effects of geometric structures of air deflectors on thermo-flow performances of air-cooled condenser. Int. J. Heat Mass Transf. 2018, 118, 1022–1039. [Google Scholar] [CrossRef]
  19. Tao, W.Q. Numerical Heat Transfer; Xi’an Jiaotong University Press: Xi’an, China, 2002. [Google Scholar]
  20. Fluent, A. ANSYS Fluent Theory Guide (Release 14.0); ANSYS Inc.: Canonsburg, PA, USA, 2011. [Google Scholar]
  21. Duvenhage, K.; Kroger, D.G. The influence of wind on the performance of forced draught air-cooled heat exchangers. J. Wind Eng. Ind. Aerodyn. 1996, 62, 259–277. [Google Scholar] [CrossRef]
  22. Yang, L.J.; Du, X.Z.; Yang, Y.P. Influences of wind-break wall configurations upon flow and heat transfer characteristics of air-cooled condensers in a power plant. Int. J. Therm. Sci. 2011, 50, 2050–2061. [Google Scholar] [CrossRef]
  23. Kong, Y.; Wang, W.; Huang, X.; Yang, L.; Du, X.; Yang, Y. Circularly arranged air-cooled condensers to restrain adverse wind effects. Appl. Therm. Eng. 2017, 124, 202–223. [Google Scholar] [CrossRef]
Figure 1. Schematics of the dry cooling system (a) air-cooled condensers (ACCs) and main buildings, (b) single condenser cell.
Energies 12 03503 g001
Figure 2. Schematics of the air deflectors and ACCs. (a) 3-D view of ACCs with air deflectors, (b) top view of ACCs with air deflectors, and (c) air deflector geometries.
Energies 12 03503 g002
Figure 3. Computational domain and boundary conditions. (a) Windless condition, (b) windy condition.
Energies 12 03503 g003
Figure 4. Inlet air temperatures of one ACC in simulation and test.
Energies 12 03503 g004
Figure 5. Inlet air temperatures (unit in K) of fans at the wind speed of 16 m/s in the wind direction of −90°. (a) Original, (b) with plane deflectors, and (c) with arc deflectors.
Energies 12 03503 g005aEnergies 12 03503 g005b
Figure 6. Static pressures (unit in Pa) of windward condenser cells in column 9 in the wind direction of −90° at the wind speed of 16 m/s. (a) Original ACCs, (b) ACCs with plane deflectors, and (c) ACCs with arc deflectors.
Energies 12 03503 g006aEnergies 12 03503 g006b
Figure 7. z-velocity (unit in m/s) and path lines of windward ACCs in column 9 at the wind speed of 16 m/s in the wind direction of −0°. (a) Original ACCs, (b) ACCs with plane deflectors, and (c) ACCs with arc deflectors.
Energies 12 03503 g007aEnergies 12 03503 g007b
Figure 8. Fan inlet air temperatures (unit in K) of ACCs in the wind direction of 0° at the wind speed of 16 m/s. (a) Original, (b) with plane deflectors, and (c) with arc deflectors.
Energies 12 03503 g008
Figure 9. Static pressures (unit in Pa) for windward ACCs in row 4 at the wind speed of 16 m/s in the wind direction of 0°. (a) Original ACCs, (b) ACCs with plane deflectors, and (c) ACCs with arc deflectors.
Energies 12 03503 g009aEnergies 12 03503 g009b
Figure 10. z-velocity (unit in m/s) and path lines for windward ACCs in row 4 at the wind speed of 16 m/s in the wind direction of 0°. (a) Original ACCs, (b) ACCs with plane deflectors, and (c) ACCs with arc deflectors.
Energies 12 03503 g010aEnergies 12 03503 g010b
Figure 11. Temperature distribution (unit in K) and path lines of ACCs in column 9 at the wind speed of 16 m/s in the wind direction of 0°. (a) Original ACCs, (b) ACCs with plane deflectors, and (c) ACCs with arc deflectors.
Energies 12 03503 g011aEnergies 12 03503 g011b
Figure 12. Fan inlet air temperatures (unit in K) of ACCs in at wind speed of 16 m/s and wind direction of 90°. (a) Original, (b) with plane deflectors, and (c) with arc deflectors.
Energies 12 03503 g012
Figure 13. Static pressures (unit in Pa) of windward ACCs in column 9 at the wind speed of 16 m/s in the wind direction of 90°. (a) Original ACCs, (b) ACCs with plane deflectors, and (c) ACCs with arc deflectors.
Energies 12 03503 g013aEnergies 12 03503 g013b
Figure 14. z-velocity (unit in m/s) and path lines of windward ACCs in column 9 at the wind speed of 16 m/s in the wind direction of 90°. (a) Original ACCs, (b) ACCs with plane deflectors, and (c) ACCs with arc deflectors.
Energies 12 03503 g014aEnergies 12 03503 g014b
Figure 15. Air mass flow rate of upwind condenser cells at various wind speeds. (a) In the wind direction of −90°, (b) in the wind direction of −45°, (c) in the wind direction of 0°, (d) in the wind direction of 45°, and (e) in the wind direction of 90°.
Energies 12 03503 g015
Figure 16. Heat rejection share of windward condenser cells at various wind speeds. (a) In the wind direction of −90°, (b) in the wind direction of −45°, (c) in the wind direction of 0°, (d) in the wind direction of 45°, and (e) in the wind direction of 90°.
Energies 12 03503 g016
Figure 17. Dimensionless increased air mass flow rate of ACCs and unit back pressure at different wind speeds. (a) In the wind direction of −90°, (b) in the wind direction of −45°, (c) in the wind direction of 0°, (d) in the wind direction of 45°, and (e) in the wind direction of 90°.
Energies 12 03503 g017aEnergies 12 03503 g017b
Figure 18. Dimensionless increased unit back pressure in various wind directions.
Energies 12 03503 g018
Table 1. Summary of generic governing equations [19,20].
Equations φ Γ φ S φ
Continuity100
x-Momentumvi μ e p x i + x i ( μ e v i x i ) + x j ( μ e v j x i ) + x k ( μ e v k x i ) + ρ g i
y-Momentumvj μ e p x j + x i ( μ e v i x j ) + x j ( μ e v j x j ) + x k ( μ e v k x j ) + ρ g j
z-Momentumvk μ e p x k + x i ( μ e v i x k ) + x j ( μ e v j x k ) + x k ( μ e v k x k ) + ρ g k
Energyt μ P r + μ t σ t 0
Turbulence kinetic energyk μ + μ t σ k G k + G b ρ ε
Turbulence dissipation rate ε μ + μ t σ e ρ C 1 S ε ρ C 2 ε 2 k + u ε + C 1 ε ε k C 3 ε G b
where G k = μ t S 2 , G b = g k μ t ρ P r t t x k ( ρ t ) p , C 1 = m a x [ 0.43 , S k ε S k ε + 5 ] , C 1 ε = 1.44 , C 2 = 1.9 , σ k = 1.0 , σ e = 1.2 , C 3 ε = t a n h | v pa v pe | .
Table 2. Mesh independence check.
ItemMesh 1 and Mesh 2Mesh 2 and Mesh 3
The error of the total mass flow rate1.28%0.21%
Maximum error of individual fan mass flow rate2.34%0.32%
Table 3. Numerical and experimental data for the model condenser cell [23].
CaseExperimentSimulation
ma (kg/s)ta1 (°C)ta2 (°C)Φ (kW)ma (kg/s)ta1 (°C)ta2 (°C)Φ (kW)
18.197.8185.8641.938.227.8192.81702.2
29.77.8283.4736.799.547.8290.43792.08
311.217.3177785.1311.087.3184.22856.53
412.737.0772.1831.9712.957.0777.75919.96
514.626.9667.5889.5214.966.9672.12979.71
617.397.9162.7957.5617.987.9165.851047.05
719.96.9657.11002.7721.56.9657.831099.35
822.056.255.91101.3622.096.258.131152.91
924.826.353.91187.3323.586.357.51213.39
1027.725.7451.51274.8127.775.7451.141267.19
Table 4. Unit back pressure and total mass flow rate improvement of ACCs with and without air deflectors in the absence of wind.
CasepB (kPa)Ia (%)
without air deflectors30.4
with plane deflectors30.30.33
with arc deflectors30.20.97

