2.1. Model and Calculation Method
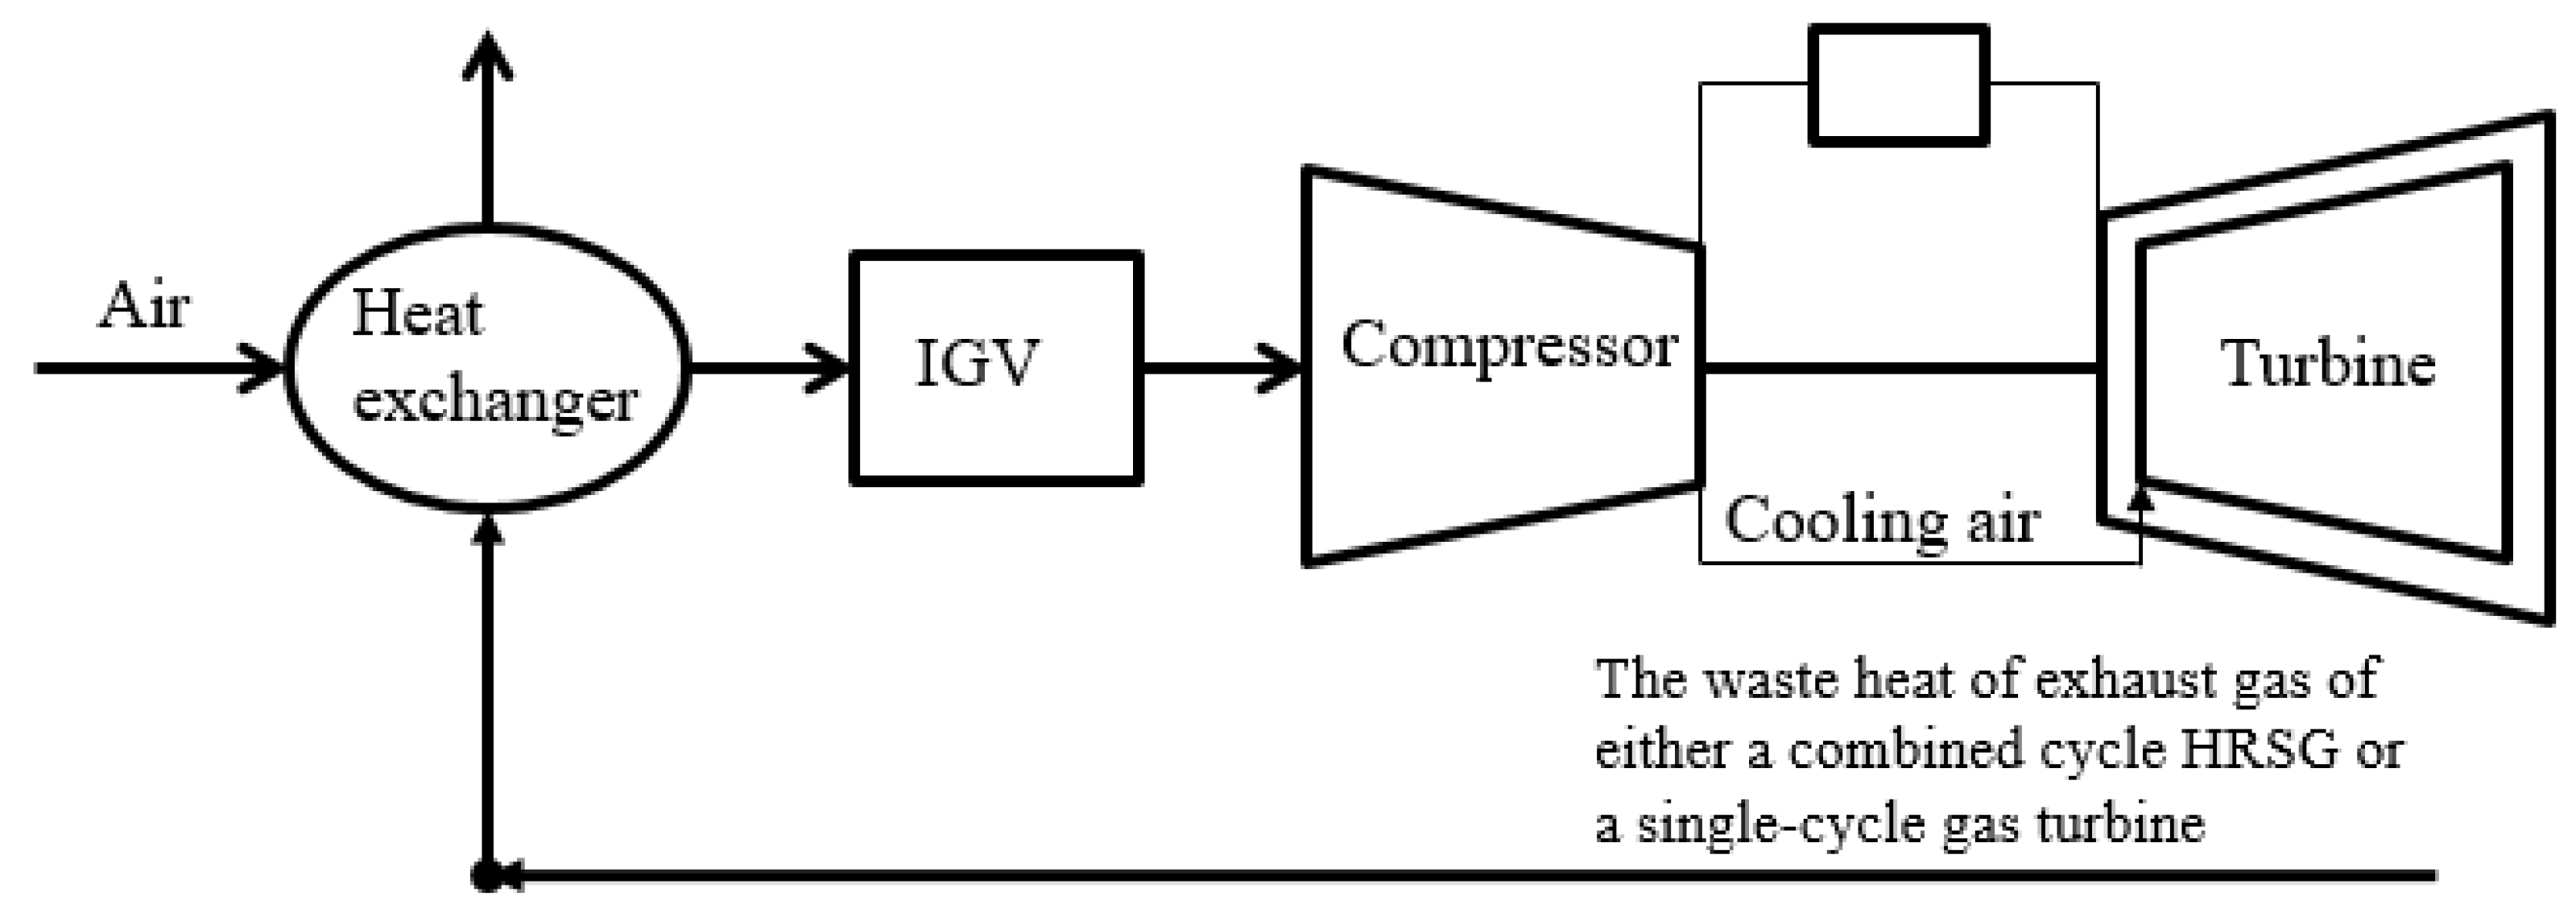
The research object of this study is a heavy-duty gas turbine with a single-shaft structure. The gas turbine comprises a compressor with IGV, a combustion chamber, and a turbine. Modeling and simulation are generally used to analyze gas turbine performance. Flack [
11] calculated the performance of a single-shaft power generation gas turbine using the parameter cycle method based on gas turbine characteristic curves and component-matching conditions. Wang [
12,
13] developed a thermodynamic cycle calculation method of a three-shaft gas turbine with a hybrid cooling model to investigate the characteristics of gas turbines on a wide load range when the power turbine operates at a fixed physical speed. The cycle calculation model, as the basic work of the research, was initially used for the selected gas turbine, and its compressor, combustion chamber, and turbine modules were all considered. Then, the cooling model was invoked through the turbine module, and the mixing of cool air and gas was assumed to affect temperature and pressure in the turbine inlet. The compressible gas hybrid model of Hartsel [
14] is adopted in calculating hybrid pressure loss to compute the time-delay pressure variation of the cooling air and mainstream gas mixture. Horlock [
15] and Jonsson [
16] simplified the model and directly connected pressure loss to relative cooling air mass flow.
Many researchers have also adopted the equilibrium running line in gas turbine research. Qusai [
17] used a single-shaft gas turbine as the research object, established thermodynamic and aerodynamic calculation models for each of its main components, and developed a calculation method for steady-state performance to analyze the distance between the equilibrium running line of the gas generator. Pontus [
18,
19] discussed the influence of fuel composition on gas turbine performance by analyzing changes in equilibrium running lines of gas generators. In the paper, the classical cycle calculation model with the equilibrium running line and a gas hybrid model [
14] are used under specific load conditions to analyze the relational variations in gas turbine efficiency and inlet air temperature.
2.2. Analysis of Compressor Equilibrium Running Line
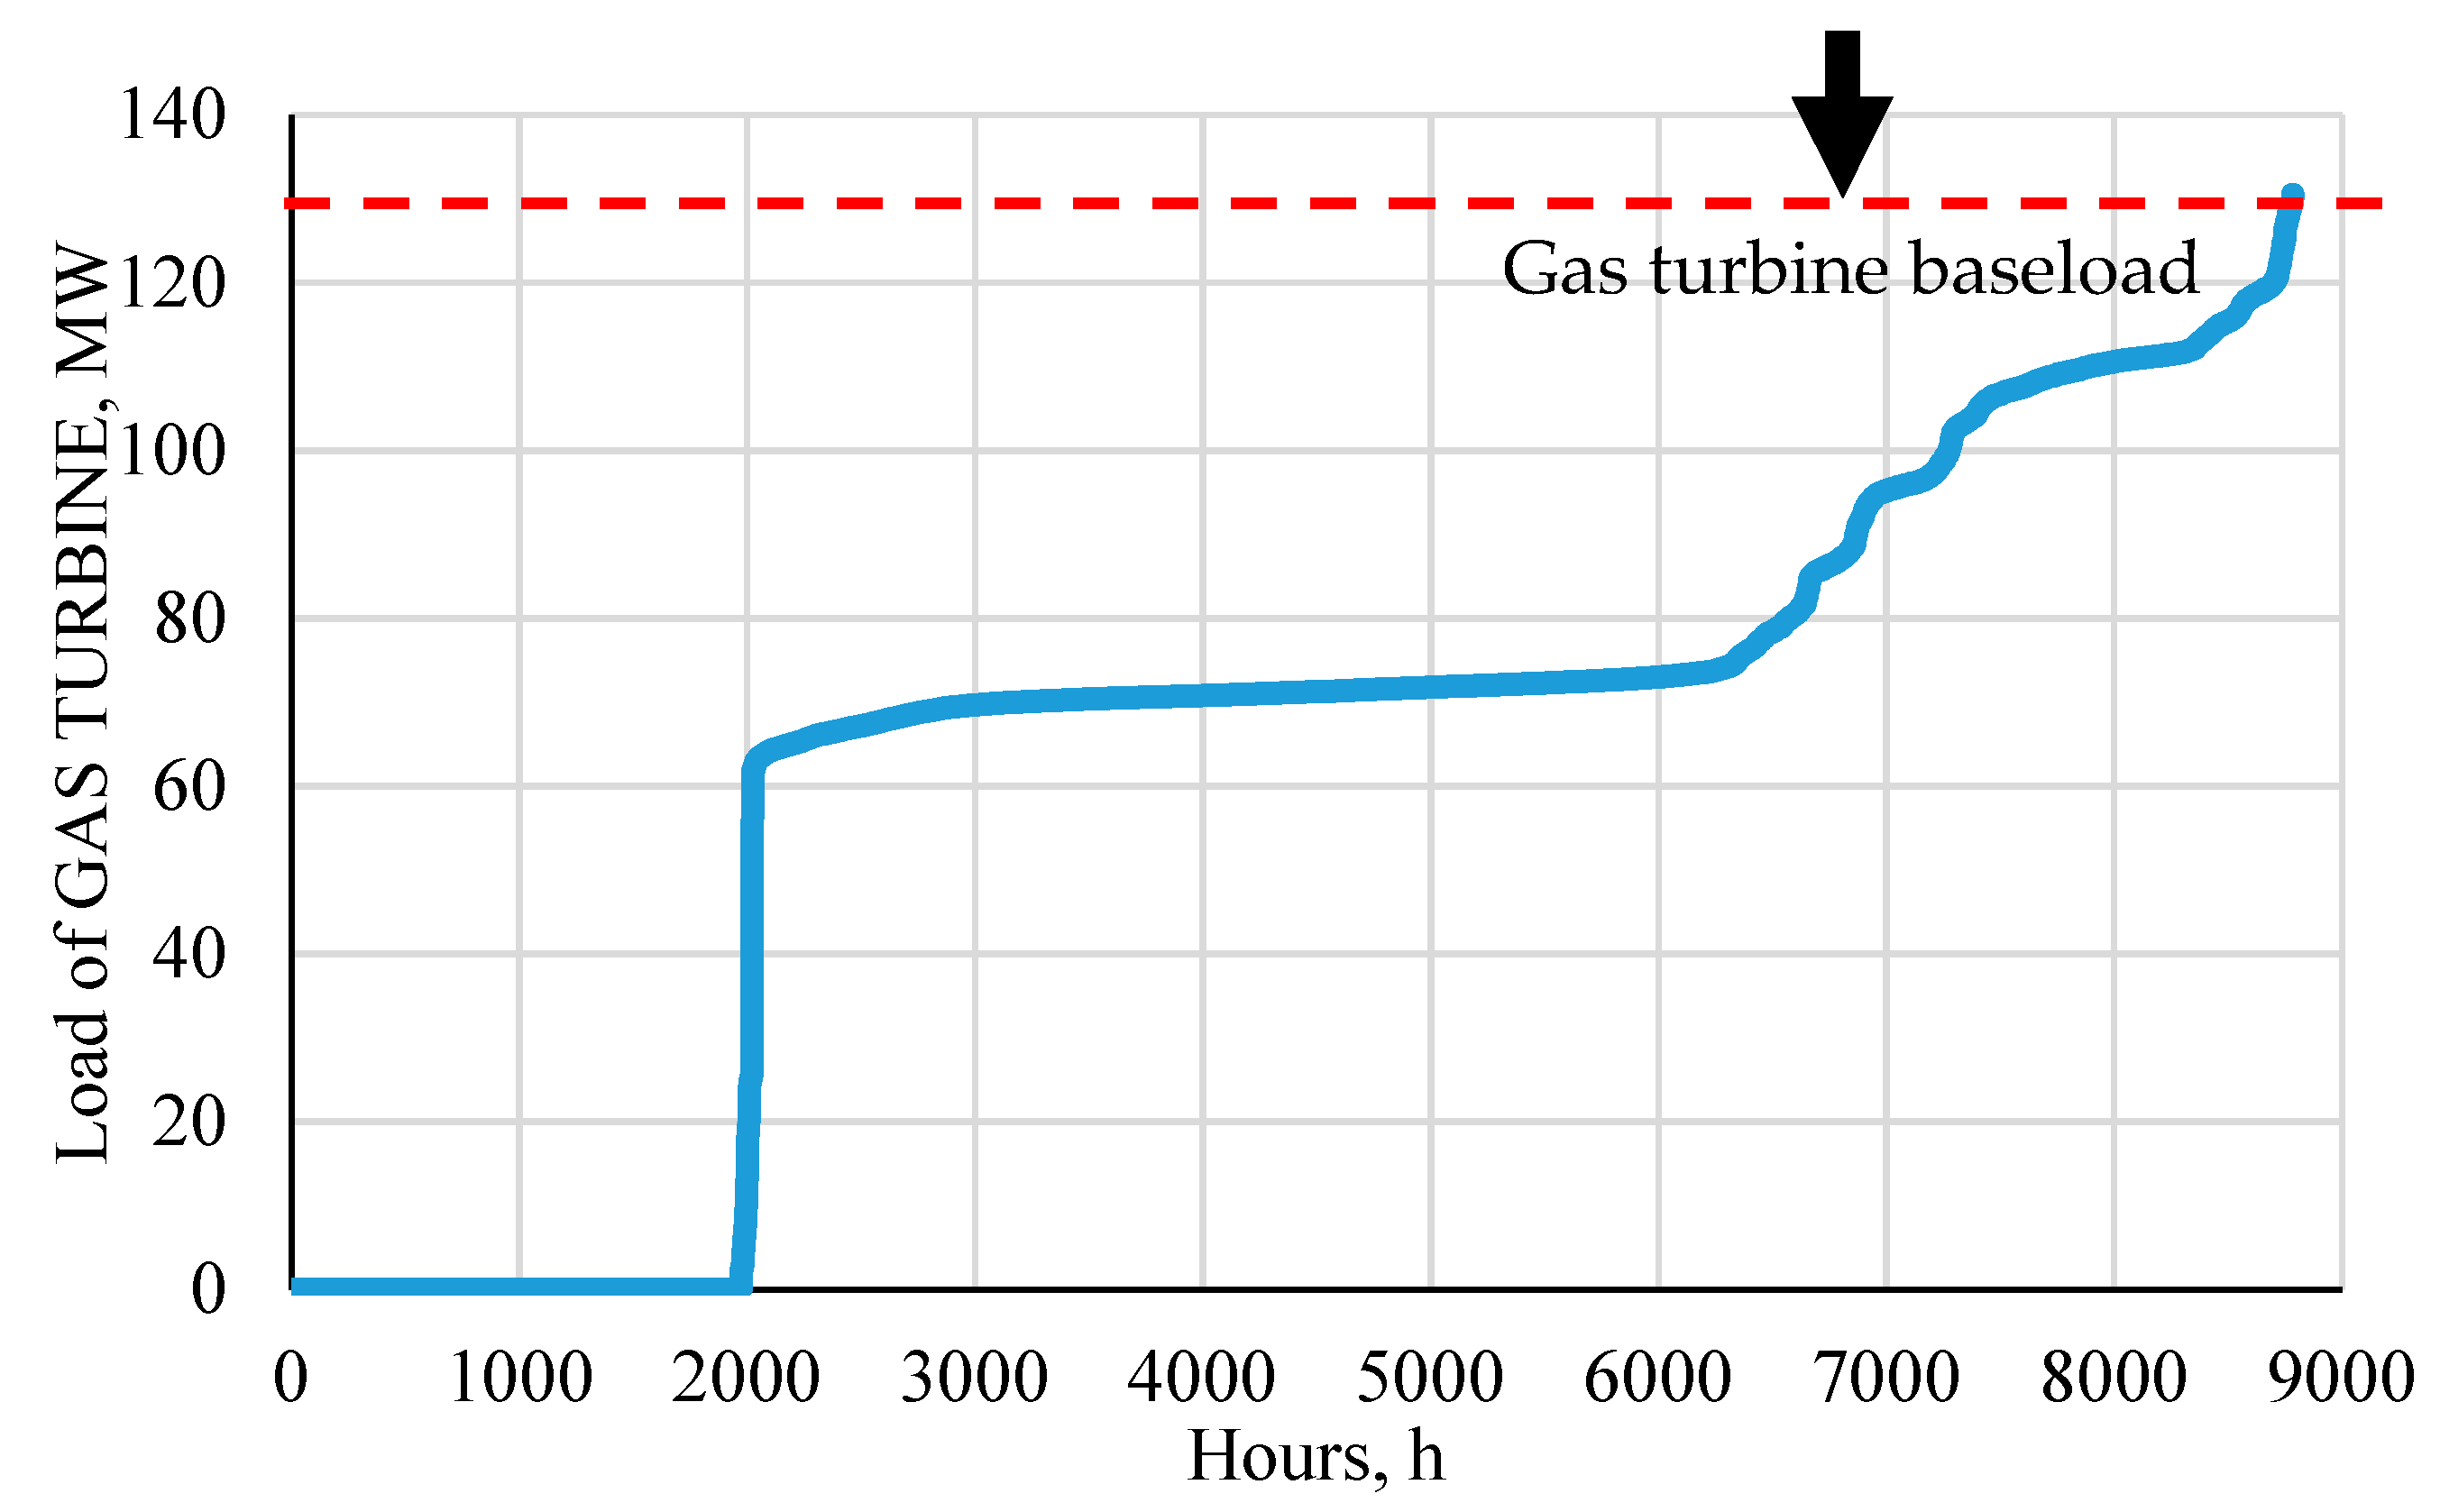
Inlet temperatures from −15 °C to 62 °C under constant load conditions are selected in this study to analyze the effect of compressor inlet temperature on gas turbine performance comprehensively. The corrected speed and compressor efficiency lines of each inlet temperature are obtained on the basis of the compressor characteristic curve. Seven inlet lines corresponding to varying air temperature conditions are then obtained for simulation.
After comparison and analysis of performance changes in certain loads, the multiple equilibrium running lines of these varying loads can be drawn using the calculation method of the equilibrium running line. Thus, the partial loads of 90%, 70%, and 50% are selected for calculation and subsequently for the analysis of changes under partial-load equilibrium running conditions relative to inlet air heating. Then, the calculated equilibrium running points are drawn with the compressor characteristic line under 90%, 70%, and 50% load conditions, as shown in
Figure 4. The designed point (DP) is also presented in
Figure 5. The relative pressure ratio and corrected mass flow rate are both 1.0, and the compressor and turbine efficiency values are 0.88 and 0.92, respectively.
As shown in
Figure 4, the position of the equilibrium running point gradually moves to the left with the increase in inlet air temperature under constant partial-load conditions, indicating a steady decrease in inlet flow. With the temperature increase from −15 °C to 15 °C, relative pressure ratio tends to gradually decrease, but the change is minimal. Relative pressure ratio tends to demonstrate minimal increase as temperature starts to rise at 15 °C. The changes in compressor inlet air temperature have no notable influence on the relative pressure ratio. However, the change trend of the relative pressure ratio differs between low- and high-temperature air conditions. This difference can be attributed to the varying change trends of compressor efficiency relative to inlet air heating. As depicted by the compressor characteristic curve, compressor efficiency increases from −15 °C to 15 °C, but the trend gradually declines as it reaches 15 °C. A theoretical analysis showed that in maintaining a constant load equilibrium running condition, a certain relative pressure ratio must be increased under a high-temperature air condition to compensate for the noticeable decrease in compressor efficiency. Similarly, a certain relative pressure ratio must be reduced under a low-temperature air condition to offset the marked increase in compressor efficiency. Overall, with an increase in inlet air temperature, the following conditions are observed: the inlet flow considerably decreases, the relative pressure ratio minimally changes, the compressor efficiency markedly varies, and the equilibrium running point approaches the surge line under 90%, 70%, and 50% load conditions.
Quantitative analyses are conducted to determine the performance of each equilibrium running point based on
Figure 4.
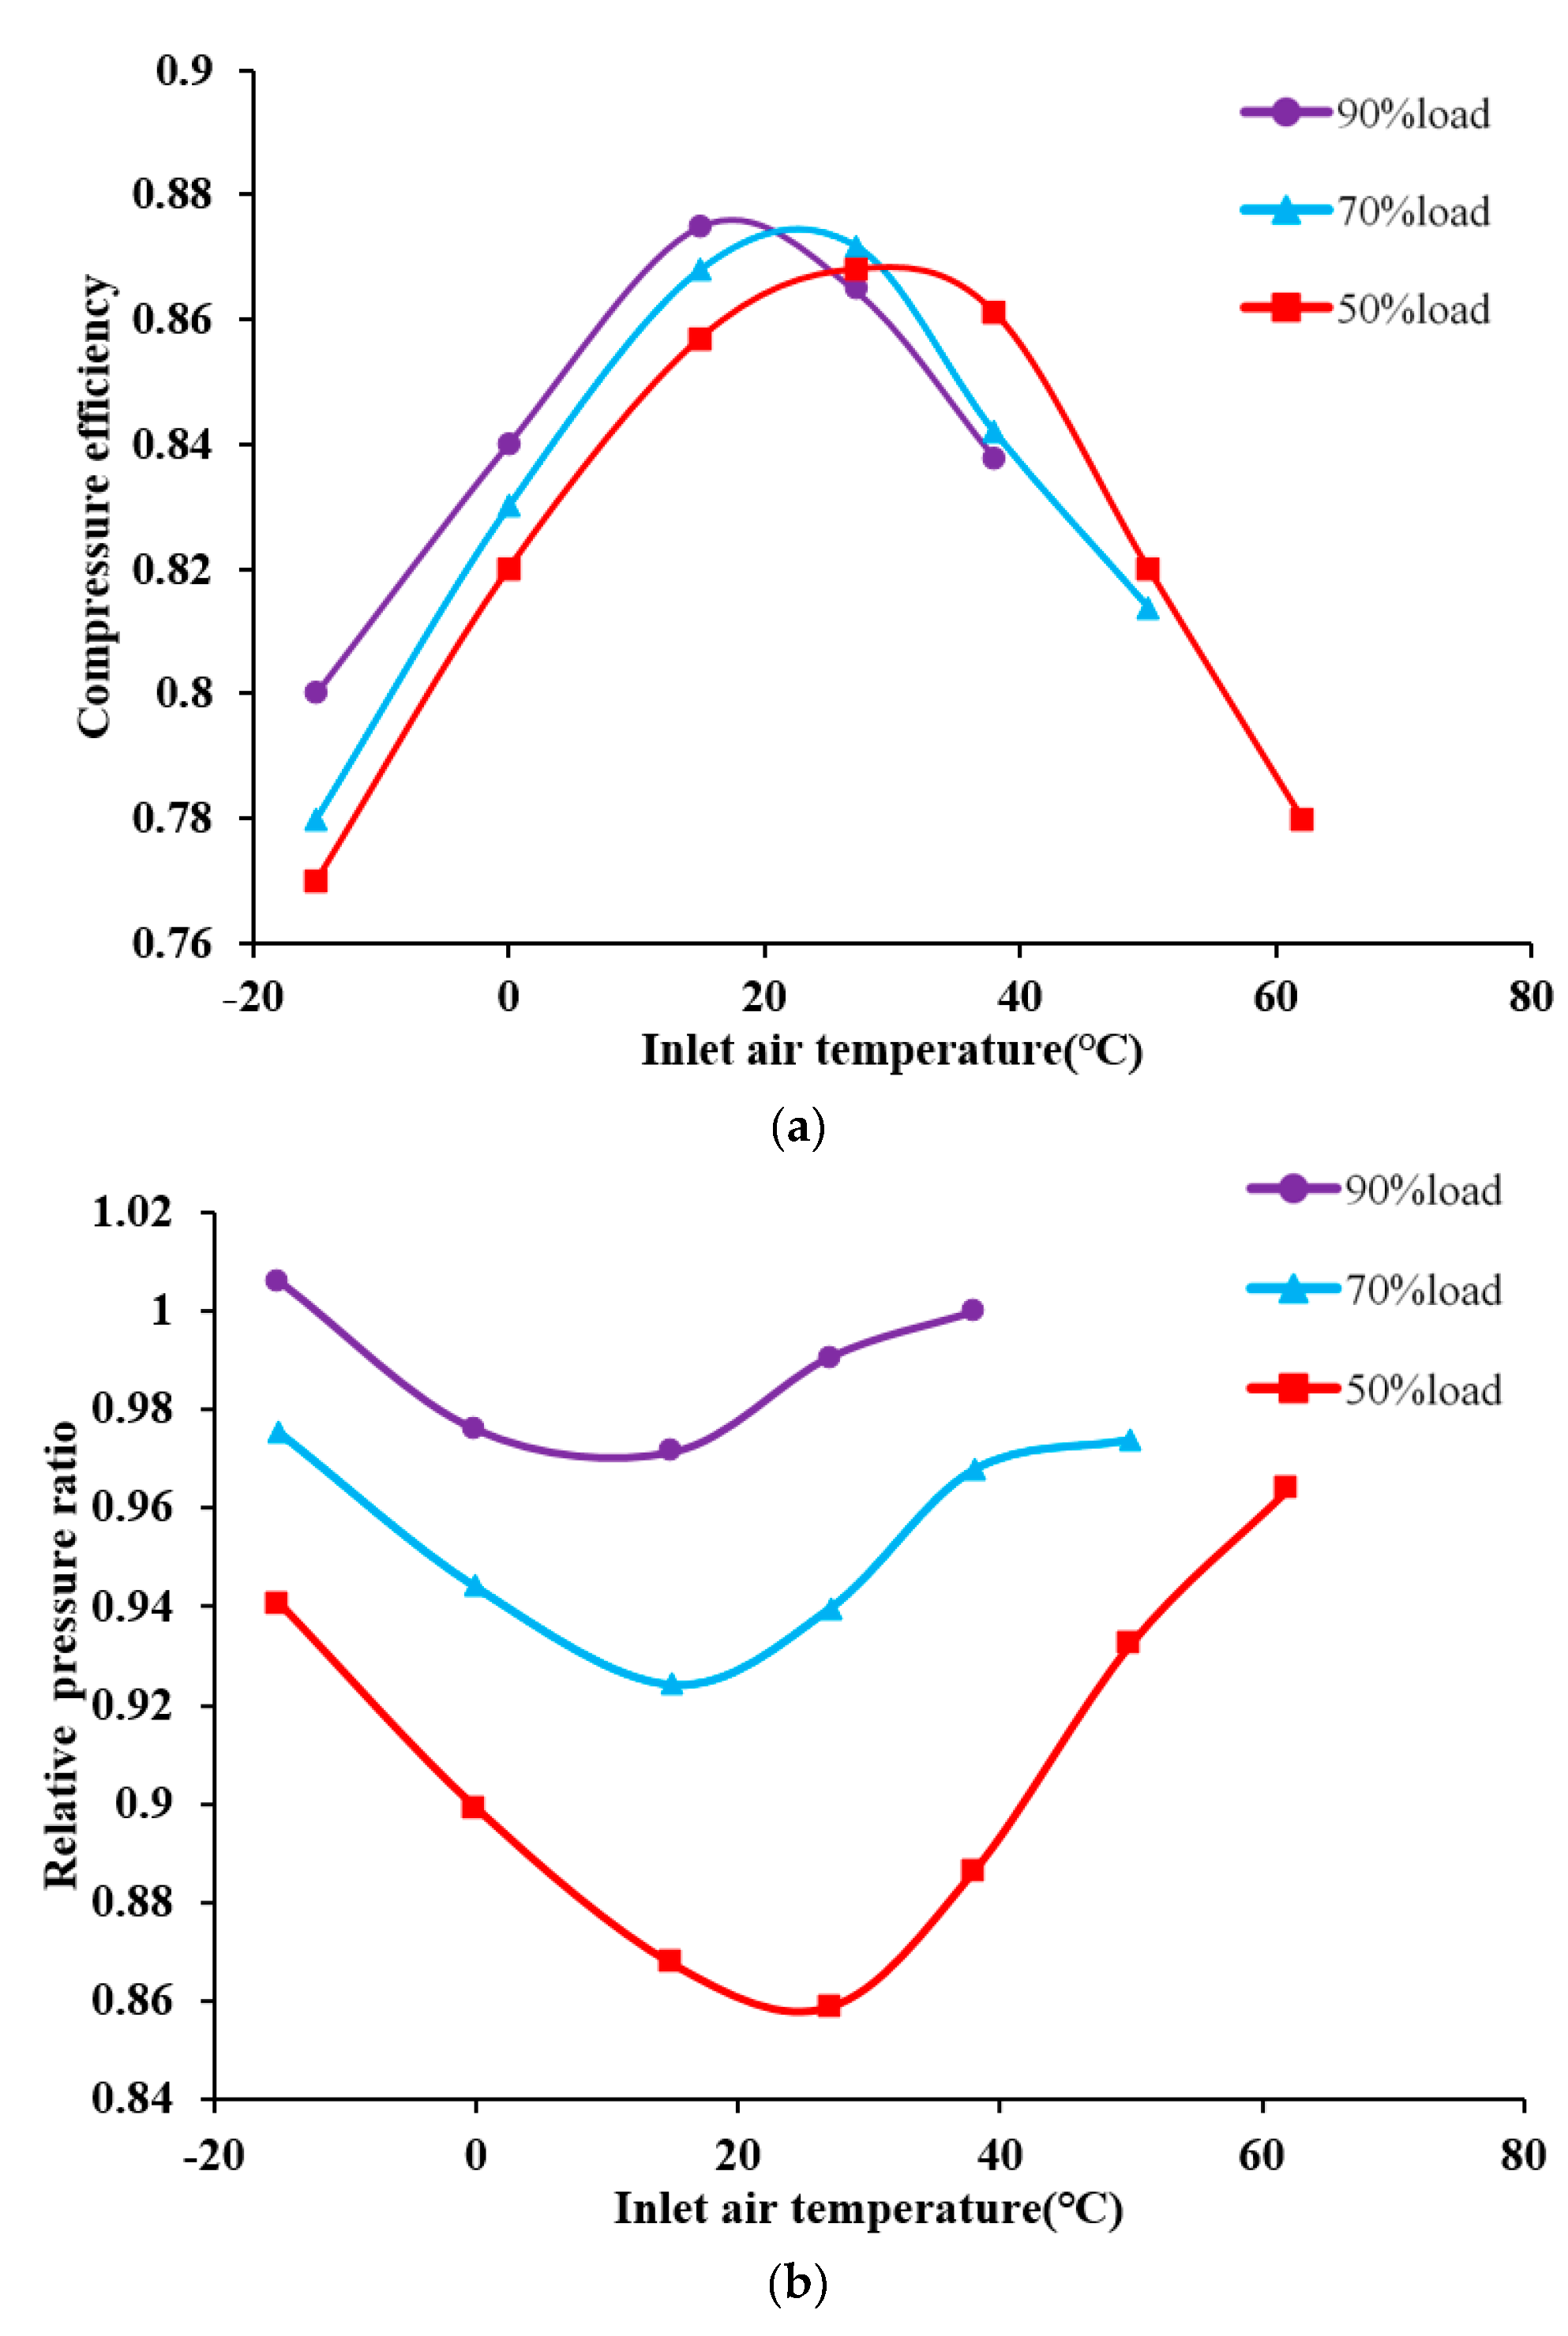
Figure 5a,b show the change curves in compressor efficiency and pressure ratio, respectively, relative to inlet air heating.
Figure 5a illustrates the compressor efficiencies under 90%, 70%, and 50% load conditions, in which efficiency increases and then decreases with the rise in inlet air temperature. For example, compressor efficiency under 50% load is 77% when inlet air temperature is −15 °C, and the highest compressor efficiency is 86.8% at 27 °C. The relative range of change is remarkable, i.e., 11.3%. In addition, given the same inlet air temperature, a high load in the low-temperature zone corresponds to a high compressor efficiency. By contrast, with the increase in inlet air temperature, a low load corresponds to a high compressor efficiency. The highest compressor efficiencies are 87.5%, 87.2%, and 86.8% under 90%, 70%, and 50% loads, respectively. The relative range of change is approximately 0.7%; thus, a low load indicates a small maximum compressor efficiency value. A decrease in load considerably affects compressor efficiency at constant inlet air temperature. Furthermore, the highest compressor efficiency is realized at a distinct inlet air temperature that is higher as the load diminishes.
As shown in
Figure 5b, the relative pressure ratios under 90%, 70%, and 50% load conditions decrease and then increase with the inlet air temperature. For example, the relative pressure ratio under 50% load is 0.94 when inlet air temperature is −15 °C, and the lowest relative pressure ratio is 0.85 at 27 °C. The relative range of change is evident at 9%. Compared with the lowest relative pressure ratio in
Figure 5a, that in
Figure 5b is apparent near the highest compressor efficiency point. The lowest relative pressure ratios are 0.97, 0.92, and 0.85 under 90%, 70%, and 50% loads, respectively. The change range is noticeable at approximately 12.4%; thus, the lower the load, the smaller the relative pressure ratio. Load change also has an evident influence on relative pressure ratio. In summary, a low load corresponds to a small compressor efficiency and relative pressure ratio at low inlet air temperature, while on a hot day, i.e., 30 °C, a reduced load can increase the compressor efficiency. Load change and inlet air heating have evident effects on compressor efficiency and relative pressure ratio, respectively.
2.3. Analysis of Turbine Equilibrium Running Line
The same equilibrium running line calculation method is also adopted to analyze turbine performance. The same partial loads (i.e., 90%, 70%, and 50%) are selected for calculation. The equilibrium running points of the inlet air temperature, which are drawn from the turbine characteristic curve, are used to obtain the equilibrium running lines under 90%, 70%, and 50% load conditions, as shown in
Figure 6.
In
Figure 6, the positions of the equilibrium running points gradually move to the left of the turbine characteristic line with the increase in inlet air temperature under constant load conditions. The corrected speed of the turbine gradually decreases, indicating a steady increase in turbine inlet temperature at a constant load equilibrium running point. The tendency of the relative expansion ratio is identical to that of the relative pressure ratio given the pressure matching relation. However, when inlet air temperature shifts from −15 °C to 15 °C, the changing trend is larger in the relative expansion ratio than in the pressure ratio. The difference can be attributed to the use of the turbine cooling model. When exhaust air cooling is used at relatively low temperatures, exhaust air mass flow is corrected and the hybrid pressure loss increases. These phenomena result in relatively large expansion ratios. The trends are the same under the 90%, 70%, and 50% load conditions. However, with the increase in inlet air temperature, turbine efficiency changes differently for the varying load equilibrium running lines. For example, turbine efficiencies increase gradually with the temperature from −15 °C to 15 °C, but the trends change starting at 15 °C under the 90% and 70% load conditions; in contrast, turbine efficiency increases gradually from 15 °C to 62 °C under a 50% load condition. In summary, with an increase in inlet air temperature, changes in turbine inlet temperature and turbine efficiency become noticeable at a constant load equilibrium running point.
Quantitative analyses are performed on the basis of
Figure 6 to determine the performance change in each equilibrium running point, as demonstrated in
Figure 7a,b. These figures correspond to the variation curves of turbine efficiency and inlet temperature relative to inlet air heating.
Figure 7a illustrates the gradual increase in turbine inlet temperature in which the increasing trend is significant relative to inlet air heating under the 90%, 70%, and 50% load conditions. For example, the turbine inlet temperatures are 950.98 °C at −15 °C and 1260.9 °C at 62 °C under the 50% load condition. An average increase of 5 °C in inlet air temperature requires an increase of 30 °C in the turbine inlet temperature. Turbine inlet temperature reaches the maximum temperature limit under the 90% load when the inlet air temperature is approximately 30 °C. Moreover, the turbine inlet temperature reaches the maximum temperature limit with 70% load when the inlet temperature is approximately 45 °C. In contrast, the maximum temperature limit under the 50% load condition is only realized when the inlet temperature reaches 62 °C. In summary, the turbine inlet temperature will reach its limit when the inlet air temperature rises to a certain temperature. Moreover, the higher the load, the faster the temperature reaches the limit under partial load conditions.
Figure 7b plots the change trends of turbine efficiency relative to inlet air heating under 90%, 70%, and 50% load conditions. Turbine efficiency increases and then declines under the 90% load. When the inlet air temperature is −15 °C, the value is 89.1%. The maximum value is 92.1% at 15 °C with 3% variations. Turbine efficiency also increases and then declines under the 70% load. When the inlet temperature is −15 °C, the value is 87%. The maximum value is 91.2% at 38 °C with 4.2% variations. Moreover, turbine efficiency increases gradually within the calculation range under the 50% load. When the inlet temperature is −15 °C, the value is 83.9%. The maximum value is 90% at 62 °C with 6.1% variations. These findings indicate that the lower the load, the higher the optimal inlet air temperature and the more obvious the influence on turbine efficiency. In addition, within a certain range of inlet air temperature, the turbine efficiency relative to inlet air heating under low-load conditions will exceed that under high-load conditions. In summary, the higher the load, the higher the required turbine inlet temperature and efficiency. However, the turbine inlet temperature will reach the temperature limit rapidly, and the turbine efficiency will decrease after a certain increase given the rise in inlet temperature. Therefore, load change and inlet air heating significantly affect the turbine inlet temperature and efficiency.
2.4. Analysis of Gas Turbine Efficiency
On the basis of the calculation of gas turbine efficiency (the ratio between the output power W and the fuel calorific value) at each equilibrium running point, the gas turbine efficiency on the equilibrium running lines relative to inlet air temperature is comprehensively analyzed under partial-load conditions (i.e., 90%, 70%, and 50%), as exhibited in
Figure 8. Gas turbine efficiency increases and then decreases with inlet air heating under the three partial loads. This finding indicates that inlet air heating within a certain range benefits gas turbine efficiency, and the optimal inlet air temperature can be realized. In accordance with the comparative results, the maximum values of gas turbine efficiency are reached at 15 °C under the 90% load, 27 °C under the 70% load, and 38 °C under the 50% load. These values of maximum gas turbine efficiency for the different partial loads relative to varying inlet air temperatures represent a straight line. The lower the load, the higher the inlet air temperature. Consequently, the highest gas turbine efficiency is achieved and enhanced. Meanwhile, given the same load conditions, the lower the inlet temperature, the lower the gas turbine efficiency if the inlet air temperature is lower than the optimum value (15 °C at 90% load, 27 °C at 70% load, and 38 °C at 50% load). For example, under a 90% load condition, the gas turbine efficiency is 35.57% when the inlet temperature is −15 °C, and the maximum value is 39.21% at 15 °C, thereby indicating an efficiency improvement of 3.64%. Under a 70% load condition, the efficiency is 31.72% when the inlet temperature is −15 °C, and the maximum value is 36.43% at 27 °C, thus implying an efficiency improvement of 4.71%. Under a 50% load condition, the efficiency is 26.2% when inlet temperature is −15 °C, and the maximum value is 31.1% at 38 °C, thereby suggesting an efficiency improvement of nearly 5%. These findings indicate that the lower the inlet air temperature, the lower the gas turbine efficiency. In cases where inlet air heating technologies are used, the higher the inlet air temperature, the more evident the gas turbine efficiency improvement at lower loads.
The influence of inlet air heating on gas turbine efficiency is analyzed on the basis of the combined interpretations of
Figure 5 and
Figure 7. The improvement of gas turbine efficiency at low temperatures from −15 °C to 15 °C can be explained by the increased values of compressor and turbine efficiencies relative to turbine inlet temperature even when the rise in inlet temperature results in the increase in compressor power consumption and decrease in compression ratio under the 90%, 70%, and 50% load conditions.
Under a 70% load condition, gas turbine efficiency is promoted from 15 °C to 27 °C. This observation corresponds to the gradual rise in compressor efficiency. The pressure ratio increases simultaneously, and turbine inlet temperature and efficiency also increase. The decline beyond 27 °C can be attributed to the declining trend of compressor and turbine efficiencies, and the increasing trend of the pressure ratio ultimately flattens.
Under a 50% load condition, the decline in gas turbine efficiency can be attributed to the rise in inlet air temperature to 38 °C. Although the pressure ratio, turbine inlet temperature, and turbine efficiency have increasing trends, they cannot compensate for the negative impact caused by the apparent decrease in compressor efficiency.
In summary, the analysis of the different constant partial-load conditions implies that inlet air heating significantly affects compressor efficiency, pressure ratio, turbine inlet temperature, and turbine efficiency. Given the increase in inlet air temperature, the trends of pressure ratio and gas turbine efficiency differ, but the trends of compressor and turbine efficiencies are consistent with that of gas turbine efficiency. Inlet air temperature rises relative to the maximum efficiency when the load decreases. The trend of turbine efficiency is nearly similar to that of gas turbine efficiency. In addition, the turbine inlet temperature increases gradually. The findings can be explained by the improvements in turbine and compressor efficiencies, the increase in turbine inlet temperature, and most especially by the increase in compressor and turbine efficiencies, which were found to be crucial in this study.


 ,
, 


