Article

Peaking Compensation Mechanism for Thermal Units and Virtual Peaking Plants Union Promoting Curtailed Wind Power Integration

1
School of Electrical Engineering, Zhengzhou University, Zhengzhou 450001, China
2
State Grid Henan Economic Research Institute, Zhengzhou 450052, China
*
Author to whom correspondence should be addressed.
Energies 2019, 12(17), 3299; https://doi.org/10.3390/en12173299
Submission received: 7 July 2019 / Revised: 21 August 2019 / Accepted: 26 August 2019 / Published: 27 August 2019

Abstract

:
As the installed capacity of wind power increases rapidly, how to promote wind power curtailment (WPC) integration has become a concern. The surface and underlying causes of wind power curtailment are insufficient peaking capability of the power system and imperfect peaking compensation mechanisms, respectively. Therefore, this paper proposes a peaking compensation mechanism uniting supply side and demand side to enhance system peaking capability. Firstly, through incentive and fairness analysis, the interest relationship of peaking subjects is researched based on game theory, and the peaking contribution on supply/demand side is quantified by Pearson correlation coefficients. Secondly, based on clustering analysis, the potential of system peaking providers are explored adequately, supply-side thermal units are divided into deep peaking clusters, and demand-side demand response (DR) resources are integrated into virtual peaking plants (VPP). Accordingly, a two-stage wind-thermal-VPP coordination optimization model is built to dispatch peaking providers. Furtherly, a two-layer peaking compensation allocation method considering peaking contribution and peaking enthusiasm is proposed to encourage peaking providers and mitigate “combination explosion”. Simulation results indicate that the proposed mechanism effectively promotes the enthusiasm of union peaking and the integration of WPC.

1. Introduction

By the end of 2018, the cumulative installed capacity of grid-connected wind power in China has reached 164,000 MW, accounting for 9.7% of the total installed power generation capacity, but the annual energy production of wind power accounts for only 5.2% of the total production [1]. Although the curtailment of wind power is decreasing year by year, it is still a serious problem [2,3]. Usually, the decrease of generator output and the increase of load during valley load periods can contribute to decrease wind power curtailment, which can be viewed as system peaking capability. At present, insufficient peaking capability of power system is the main limitation of large-scale wind power integration in China [4]. Under the existing energy structure in China, system peaking capability is guaranteed by peaking ancillary services which are mainly provided by thermal units. In the process of providing peaking service, thermal units have to give up part of electric revenue to decrease their output, and frequent adjustment of output also increases their operating cost. However, under the existing peaking compensation mechanism, system peaking cost is all borne by thermal units. As a consequence, thermal units are unwilling to ramp down as far as possible for their own economic interest when there is a surplus of wind power (therefore, surplus wind power will be curtailed), which leads to the insufficiency of the system peaking capability [5,6]. Therefore, perfecting the compensation mechanism for peaking auxiliary service instead of vigorously developing the installed wind power capacity has been become the focus of attention, which can explore the peaking potential of existing power systems and then promote the WPC integration [7,8].
With the construction of China’s power market, how to establish a reasonable and perfect peaking compensation mechanism to fully ensure the economic interests of peaking providers so as to encourage them to actively participate in wind power integration has become the key research topic. In particular, the research and application of demand response (DR) provide new system peaking approaches [9,10]. Union peaking combining demand side with supply side has become a research focus [11,12].
Presently, there has been lots of research on the peaking compensation mechanism, and the most widely used method in the relevant literatures is cooperative game theory. In [13], based on the theory of cooperative games, a Shapley value was calculated to allocate peaking compensation fees according to the marginal contribution of peaking providers. As the most common method for solving cooperative game problems, there is a “combination explosion” problem when a Shapley value is applied in large-scale systems [14,15,16]. On the basis of analyzing the monotonicity, superadditivity and convexity of the peaking cost allocation, the bilateral Shapley value and unit combination were proposed in [17] to overcome this problem. Obviously, the Shapley value method only considers the marginal contribution of peaking providers, ignoring their individual differences. The difference of energy utilization among peaking units was analyzed, and then the Shapley value was modified by a thermoelectric ratio in [18]. In [19], the peaking compensation model was improved by introducing the realization coefficient of peaking capability. A bilayer peaking compensation mechanism that mitigated “combination explosion” and considered individual differences was proposed in [20]. Under the increasingly severe system peaking situation, some scholars have begun to pay attention to the rational distribution of system economic interests, aiming to improve the incentive and fairness of peaking compensation mechanism. The interest relationship between wind power and thermal power was studied in [21], while the most optimal solution to the allocation of system interests was given. A two-part compensation mechanism and corresponding calculation method combining peaking compensation and excess power generation revenue sharing were proposed in [22].
With the construction of smart grids, flexible loads such as battery energy storage and electric vehicles are increasing substantially, which can participate in system scheduling through demand response [23,24]. Demand response subversively makes the demand side change from passive electricity consumption to active operation optimization, which greatly increases the adjusting capability of power systems [25]. For example, DR resources can provide peaking ancillary services by changing their electricity consumption according to peak and valley periods. At the same time, the system optimization scheduling considering demand response is becoming more and more complex [26,27,28]. Usually, DR resources can realize economic scheduling by building microgrids or virtual power plants with distributed generators [29,30,31]. However, the research on demand response mainly focuses on how to correspond with time-of-use electricity price, policy rewards and punishment mechanism to adjust consumption behaviors, how to plan with other subjects, how to form a reasonable response strategy or how to achieve economical deployment [32,33,34,35]. And DR resources are rarely regarded as the peaking providers that can promote wind power integration.
To summarizing the existing studies, there are three prominent problems as follows:
(1)
The current peaking compensation mechanism is not an incentive, and the benefits of peaking providers are difficult to guarantee;
(2)
There is no corresponding mechanism to encourage DR participation in wind power integration, which has huge peaking potential to provide peaking auxiliary services. What’s more, DR resources are relatively scattered, requiring effective integration methods;
(3)
The combination explosion problem is difficult to solve when a Shapley value is applied in large-scale systems.
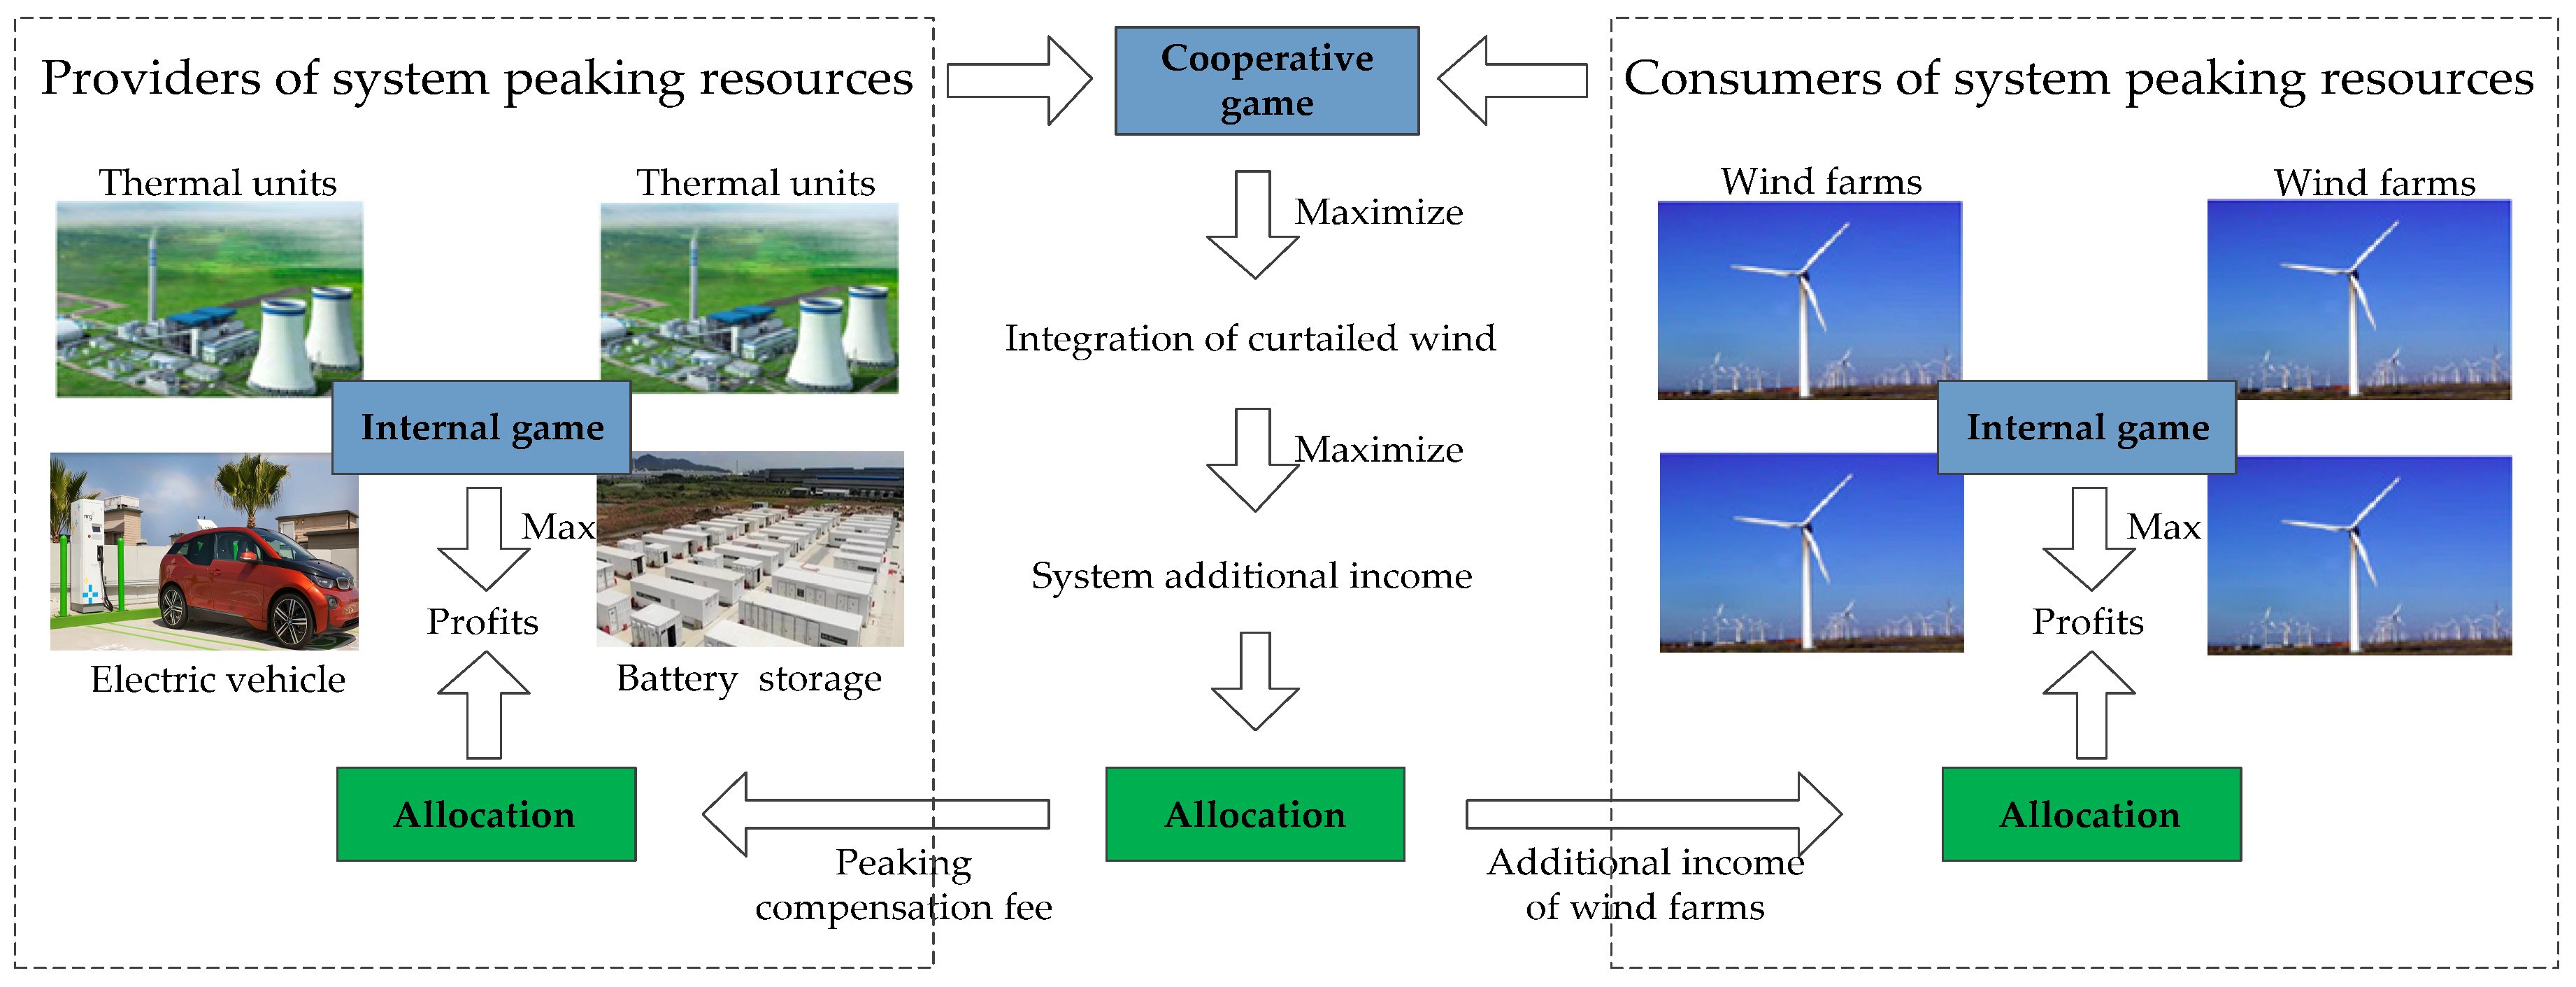
Thus, from the view of supply side and demand side union peaking, a peaking compensation mechanism for promoting wind power integration is proposed with considering virtual peaking plant (VPP). The rest of this paper is organized as follows: 
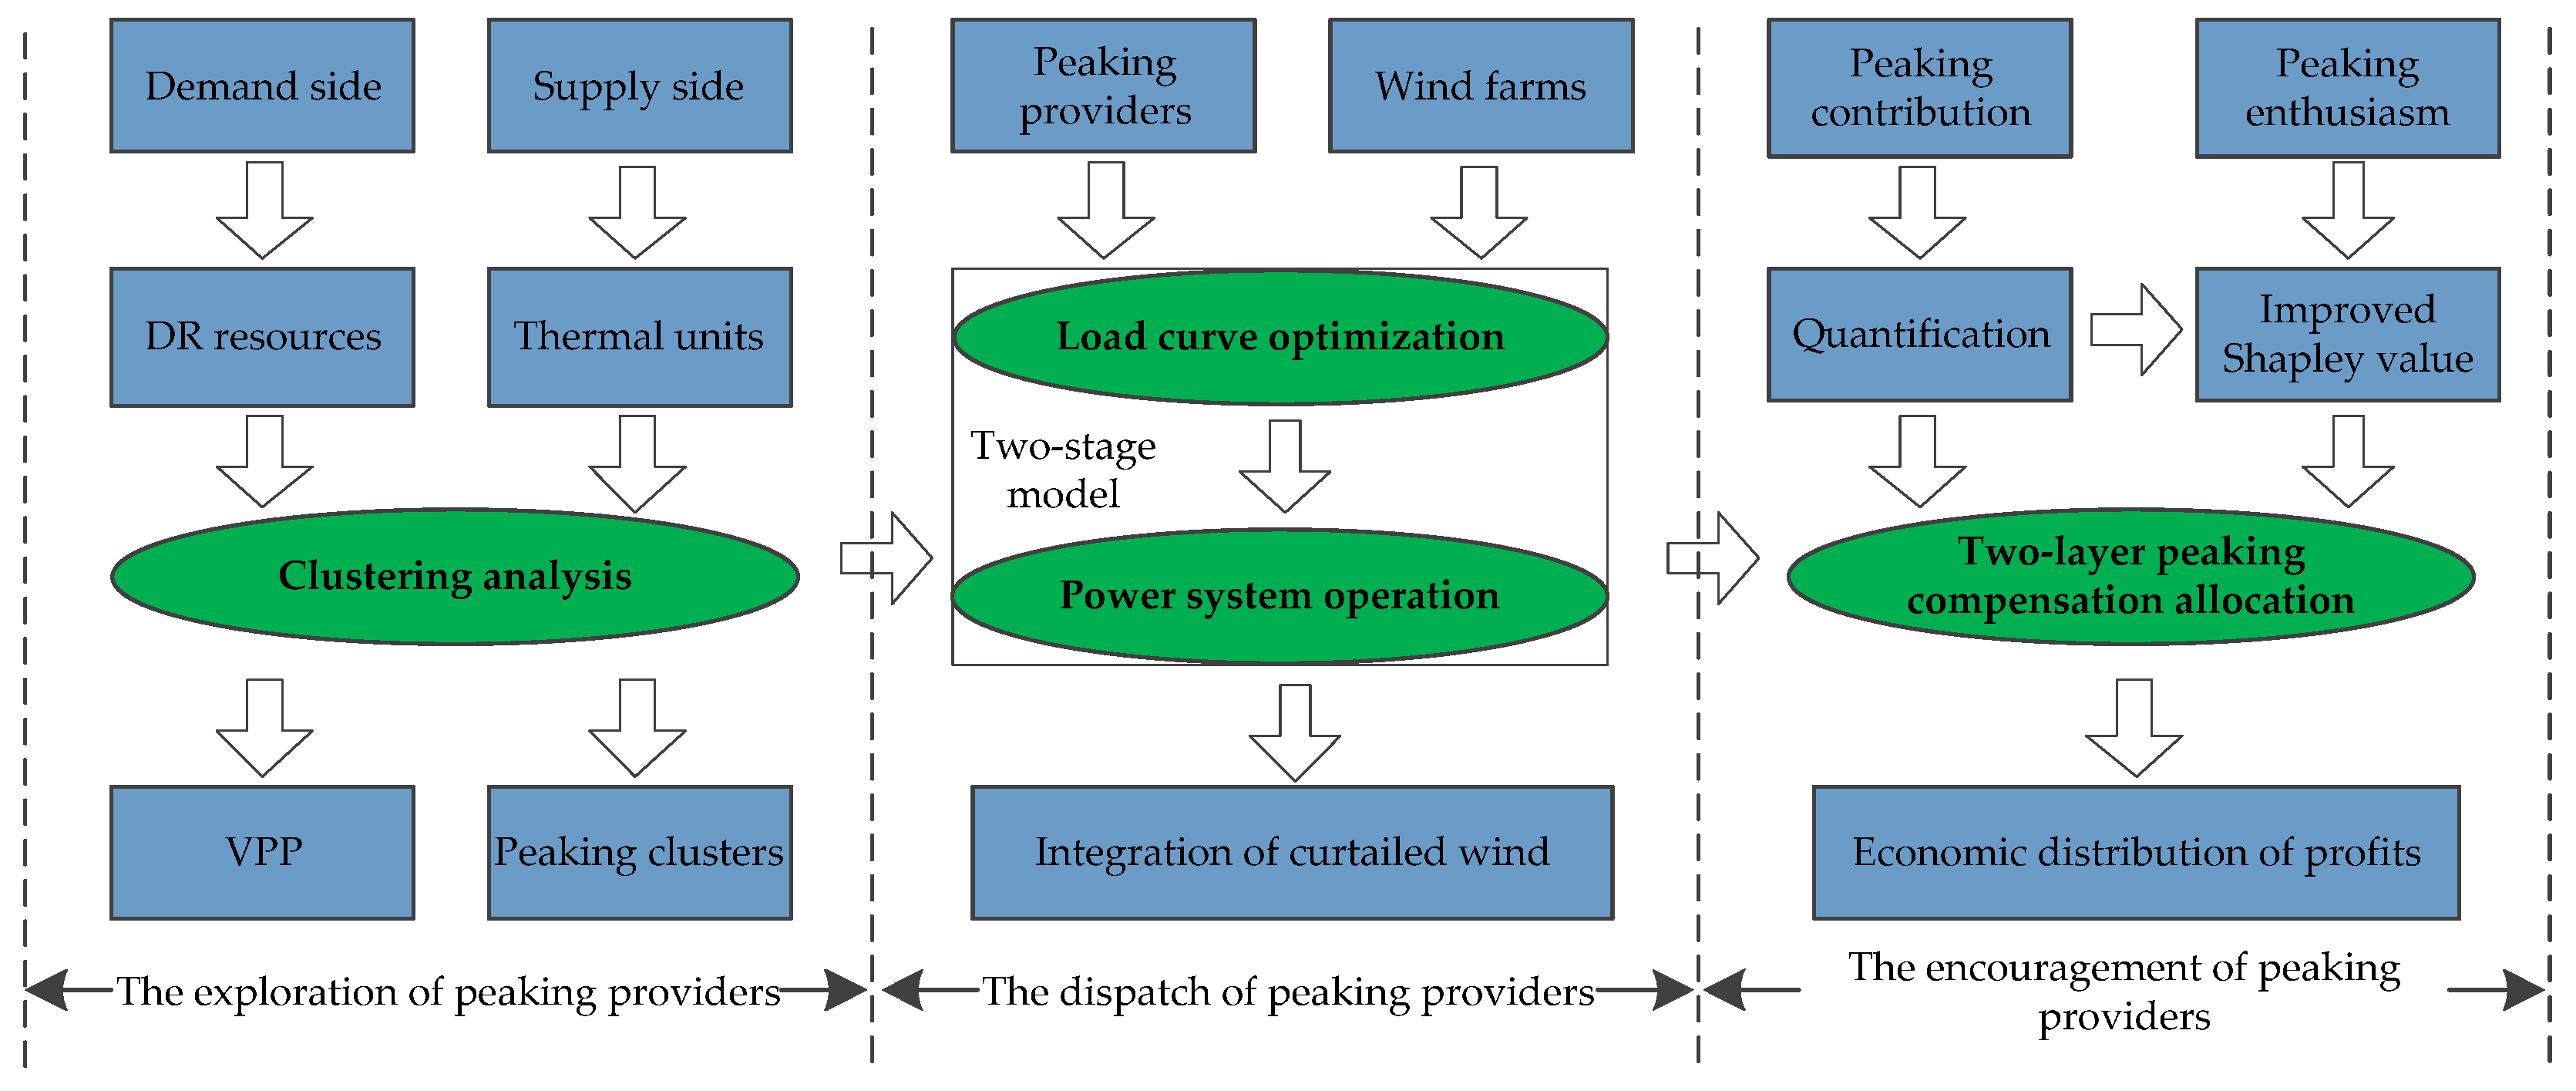
Section 2 describes the methodology of this paper. Section 3 introduces peaking providers both supply side and demand side. Based on K-means clustering, deep peaking units in supply side are divided into three clusters, and DR resources dispersed on the demand side are integrated based on VPP. The two-stage coordinated optimization scheduling model is presented in Section 4. The two-layer peaking compensation method based on peaking contribution is presented in Section 5. Simulation results are discussed in Section 6. The conclusion is summarized in Section 7.

2. Methodology

2.1. Problem Formation

This section provides the formulation of peaking compensation problem. In the practice of the European and American electricity markets, peaking ancillary services is not the standard type of auxiliary service market. The reason is that peaking problem has been solved through the clearing of the main energy market, but there is no mature electricity market in China, and the peaking problem is solved by peaking ancillary services. In order to encourage peaking providers to provide peaking ancillary services, a peaking compensation fee is paid to them. Taking thermal units as the peaking providers for example, peaking ancillary services can be subdivided into basic peaking services and deep peaking services by their output. If their output is less than a certain standard, they will be considered to provide deep peaking service and obtain a peaking compensation fee. Otherwise, they will be considered to provide basic peaking service freely. In China, this certain standard is set by regional dispatch centers. In the process of peaking compensation, the compensation fee is derived from the penalty of unqualified thermal units whose peaking contribution is small, which damages their enthusiasm for peaking.
With the rapid development of wind power, the peaking problem is getting harder to solve, which causes a mass of WPC during valley load periods. On the surface, this is due to insufficient peaking capability. Actually, the unreasonable peaking compensation for peaking providers makes it hard for them to guarantee their economic interests, which leads to their unwillingness to fulfil their peaking potential. Therefore, a new peaking compensation mechanism is needed to solve peaking compensation problems including a reasonable source of compensation fees, the quantification of peaking contributions and the allocation of peaking compensation fees.

2.2. Problem Decomposition

2.2.1. Incentive Analysis of Compensation Mechanism

The compensation mechanism proposed in this paper involves two interest subjects. One is the providers of system peaking resources, such as thermal units and DR resources, which can choose to provide no peaking service, basic peaking service or deep peaking service. The other is wind farms which are usually viewed as the consumers of system peaking resources. Their choices include whether to integrate into the grid actively and reduce the volatility of wind power or not. These two subjects have related interests, and their decisions directly determine their profits, so there is a game between the providers and consumers of peaking resources, which helps them to make the best decisions and obtain maximum profits. However, in China’s power system, peaking providers and wind farms make decisions independently, which leads to a lot of WPC [21,36]. If they can play a cooperative game where peaking providers try their best to provide peaking services on the premise of ensuring system safety and then wind farms take part of the additional income derived from WPC integration as a peaking compensation fee, both subjects benefit while WPC is further integrated. In this way, it is a win-win for both parties.
In a similar way, the providers and consumers also have internal games. Within the providers, the game focuses on how to get peaking compensation through peaking contribution, which may also cause other losses, such as thermal units’ electric revenue. Within the consumers, the game focuses on how to get more integrated income through improving the quality of wind power, which also increases wind farms’ operation cost. Figure 1 shows these three types of games in the system peaking process.
As shown in Figure 1, peaking games involve the allocations of system additional income between peaking providers and wind farms, additional income among wind farms and peaking compensation fee among peaking providers. The incentive of peaking compensation mechanism is to coordinate these allocations, which can not only enhance the enthusiasm for wind power integration, but also encourage peaking providers to actively participate in system scheduling.
(1) Peaking System
Based on the theory of cooperative games, this paper takes part of system additional income resulting from WPC integration as a peaking compensation fee which is paid by wind farms. Figure 2 shows the allocation of system additional income between two interested subjects (taking the wind-thermal system as an example).
P’w and LP’w respectively represent the integrated generation amount of wind farms and thermal units before their cooperation. Pw and LPw represent the integrated generation amount after the cooperation. The feed-in tariff of wind power and thermal power are ρw and ρG. Due to the high price of wind power, the net income of the wind-thermal system increases. The colored part area abfe is the system’s additional income. The area of abcd is the additional income of wind farms, and the area cdef is the additional income of thermal units (the peaking compensation fee paid by wind farms). efPwPw can be regarded as the electric revenue compensation of thermal units paid by wind farms.
The distribution coefficient θ (0 ≤ θ ≤ 1) is related to the enthusiasm of wind farms and peaking providers and can be determined optimally based on cooperative game theory [21], which is described in details in the Appendix A. Based on the optimal distribution coefficient θ, the peaking compensation fee V and additional income of wind farms Vw are calculated by Equation (1) under a specific decrease of wind power curtailment:
{ V = θ × [ ( ρ w g ρ G ) Δ Q w ] V w = ( 1 θ ) × [ ( ρ w g ρ G ) Δ Q w ]
(2) Peaking Providers
Peaking compensation fees can encourage more peaking providers to participate in peaking alliances. In a peaking alliance, peaking providers cooperate with each other to participate in peaking scheduling, so as to maximize the WPC integration and then obtain the maximum peaking compensation fee. This is a typical cooperative game problem. The Shapley value is naturally used to allocate peaking compensation fees among peaking providers, which is described in details in Section 5.
(3) Peaking Consumers
The allocation method among wind farms should be able to enhance their integration enthusiasm and stimulate them to improve the quality of wind power. The volatility of wind power reflects its quality and determines the amount of peaking resources which the system needs to provide. Therefore, this paper takes increased integration of wind power as the indicator to allocate additional income of wind farms and then uses volatility to correct the result. To simplify the analysis, the volatility of wind power is measured by variance:
{ V w i = V w × ( Δ Q w i / i N w Δ Q w i + Δ η i ) Δ η i = 1 / σ ( P w i ) i N w 1 / σ ( P w i ) 1 n w
where Δηi represents the relation between the output volatility of wind farm i and the average output volatility. When Δηi is greater than 0, wind farm i obtains more additional income than before the correction. When Δηi is less than 0, wind farm i obtains less additional income. Since the sum of Δηi is 0, the total additional income is constant.

2.2.2. Fairness Analysis of Compensation Mechanism

The fairness of compensation mechanisms lies in the reasonable allocation of peaking compensation fees among all peaking providers, which mainly involves the quantification of peaking contributions and some method of compensation fee allocation.
In order to introduce more peaking resources extensively and dispatch all kinds of peaking providers together, the quantification of peaking contribution should not be limited to the peaking capacity of generators. In other words, the quantitative method should be more universal. In this paper, the peaking contribution to promote WPC integration is quantified based on the correlation between peaking providers output and wind farms output. The calculation of peaking contribution based on the Pearson correlation coefficient (PCC) is shown below:
C P R = cov ( P R , P w ) σ ( P R ) σ ( P w ) = E [ ( P R μ ( P R ) ) ( P w μ ( P w ) ) ] σ ( P R ) σ ( P w )
where CPR (−1 ≤ CPR ≤ 1) represents the peaking contribution of peaking providers to decrease WPC. On the supply side, the output of peaking providers and wind farms are complementary (negative correlation), which has a peaking effect (decreases WPC). On the demand side, the output of peaking providers and wind farms are synchronous (positive correlation), which has a peaking effect.
In terms of compensation allocation methods, the most frequently-used Shapley value based on marginal contribution ignores the individual differences of peaking providers, which may make it difficult to obtain compensation for small capacity peaking providers which have low peaking capability but high peaking realization degree (the ratio of actual peaking contribution to maximum peaking contribution). This is clearly unfair. In order to reflect fairness, this paper introduces the realization coefficient of peaking capability to improve the Shapley value. However, the improved Shapley method can still cause the problem of "combinatorial explosion" when applied to large-scale systems. In order to solve the problem without sacrificing fairness, this paper proposes a two-layer allocation method of peaking compensation fee combined with the concept of clustering. Firstly, the inner and outer layers are formed by clustering peaking providers. Then outer-layer allocation is based on improved Shapley value and inner-layer allocation is carried out by peaking contribution, which also reflects the fairness.

2.3. Problem Solving Approach

As is shown in Figure 3, the peaking compensation mechanism proposed in this paper aiming to solve the peaking compensation problem is composed of the exploration, dispatch and encouragement of peaking providers. In Section 3, based on clustering analysis, system peaking potential is explored adequately. Supply-side thermal units are divided into deep peaking clusters, and demand-side DR resources are integrated into virtual peaking plants (VPP). In Section 4, peaking providers are coordinated to increase the WPC integration by a two-stage optimization model. In Section 5, based on the incentive and fairness, peaking compensation fee is allocated to single peaking providers by a two-layer allocation method, which realizes the encouragement of peaking providers.

3. Peaking Providers

3.1. Supply Side

In this paper, thermal power units are taken as the research object on the supply side, and the key of cluster analysis is to select reasonable clustering indexes and clustering methods. According to the characteristics of samples, the peaking rates of thermal units given by Equation (4) reflect their peaking capability:
r i , t = P i , max P i , t P i , max
where ri,t reaches the highest when Pi,t equals the minimum technical output.
The deep peaking capability of thermal units is mainly limited by the maximum technical output and the highest peaking rate. The maximum technical output of most units is equal to their rated power. Therefore, the rated power and the highest peaking rate are selected as indicators for cluster analysis. On the other hand, due to K-means clustering method is simple, efficient and easy to program, it is used to divide deep peaking units. After clustering, all thermal units are divided into deep peaking clusters and then participate in system scheduling.
Taking a ten machine regional system as an example, the rated capacity and the highest peaking rate of unit 1~8 (given in Table 1) were input into a MatLab program which realized a K-means cluster. The results are shown in Figure 4. According to the clustering results, units 1~2 were classified as deep peaking cluster A, units 3~5 were classified as cluster B, and units 6~8 were classified as cluster C.

3.2. Demand Side

DR resources have the ability to adjust their consumption behaviour based on electricity price (price-based DR, PDR) or incentive mechanisms (incentive-based DR, IDR) and have the characteristics of strong flexibility and fast response speed [37]. Due to the mismatch between TOU price setting and wind farms output, PDR resources cannot be effectively guided to consume wind power, so IDR resources have more obvious advantages than PDR resources in integrating WPC. Under effective incentive mechanism, some IDR resources can be scheduled to track wind farms’ output by adjusting their consumption sequence. Then they can be regarded as DR peaking providers to make up the insufficient peaking capability of thermal units. In order to schedule peaking providers from both sides better, this paper takes shift loads and transfer loads which both belong to IDR resources as the research object on the demand side.
However, DR peaking providers will increase the difficulty of system scheduling because of their small capacity, large quantity and disperse location. In order to realize economic scheduling, the virtual peaking plant (VPP) based on clustering is constructed to unify DR peaking providers. Moreover, there exists uncertainty in the practical application of DR [38]. Consequently, the VPP improves the peaking capability of power system, which also inevitably increases the reserving burden. Actually, the uncertainty can be reduced by signing contracts that specify penalty criteria caused by response deviations with highly reliable users. This paper mainly considers the peaking capability of DR resources and ignores their uncertainty.

3.2.1. Scheduling Structure with Considering VPP

Figure 5 shows the system scheduling structure considering VPP. On the supply side, thermal units’ parameters Ψ p a r s = {Rampi, Pi,max, Pi,min, M i o n , M i o f f , ai, bi, ci}iNg and wind farms’ predicted output Pw are uploaded to the dispatching center. After the power system operation optimization, thermal units’ control information Ψ c o n s = {Pi, ui, µi}iNg and wind farms’ WPC Ploss are issued for execution.
On the demand side, the VPP externally performs the comprehensive characteristics of DR peaking providers tracking wind farms’ output to optimize the daily load curves. Internally, DR peaking providers are coordinated to make an optimal decision. The VPP determines available DR peaking providers by signing contracts. For shiftable loads, the contract specifies the parameters Ψ s h , p a r a d = {tc, td, Psh, [Shift, Shift+]}. For transferable loads, the contract specifies the parameters Ψ t r , p a r a d = { L t r min , L t r max , Wtr, [Tran, Tran+]}. In order to simplify system scheduling, the VPP aggregates small-capacity DR peaking providers with same parameters into large-capacity DR schedulable units and all schedulable units’ parameter information Ψ p a r a d = { Ψ s h , p a r a d , Ψ t r , p a r a d } is uploaded to the dispatching center. After the load curve optimization, DR schedulable units’ scheduling instructions Ψ c o n d = { Ψ s h , c o n d , Ψ t r , c o n d } are obtained, which can be decomposed for each DR peaking provider through Iunit. Ψ s h 1 , p a r a d represents the parameters of shiftable load 1, and Ψ s h 1 , c o n d is its shift period control instructions. Ψ t r 1 , p a r a d represents the parameters of transferable load 1, and Ψ t r 1 , c o n d is its transfer periods and consumption power control instructions. At the dispatching center, the process of system scheduling is divided into two stages, which are described in details in Section 4.

3.2.2. Control Strategy of VPP

(1) Shiftable Units
With fixed electrical power, the consumption of shiftable loads is strongly continuous [39,40,41]. Therefore, they can only be shifted as a whole. The dispatching center only needs to optimize their shift periods through VPP. Let Lsh represent a shiftable unit whose power consumption sequence Psh is “ P s h 1 , P s h 2 , , P s h t d ”. td is the time of consumption duration. Its initial and optimized starting period of power consumption are tc and tc’, respectively. The acceptable shift interval is [Shift, Shift+]. The starting period set of Lsh is:
S s h i f t = [ S h i f t , S h i f t + t d + 1 ] { t c }
If tc’ ≠ tc and tc Sshift, Lsh is shifted. Then the electrical power sequence distributed on [Shift, Shift+] is:
P s h t = [ 0 , , P s h 1 , , P s h t d , , 0 ]
where P s h 1 corresponds tc’, …, P s h t d corresponds tc’ + td − 1.
Based on the power consumption sequence, the optimized electrical power of Lsh in period t is:
L s h t = { 0 , t [ t c , t c + t d 1 ] P s h t t c + 1 , t [ t c , t c + t d 1 ]
(2) Transferable Units
Compared with shiftable loads, transferable loads have no limitation of consumption continuity and operate more flexibly. The dispatching center needs to optimize their transfer periods and corresponding consumption power through VPP.
Ltr represents a transferable unit whose acceptable transfer interval is [Tran, Tran+]. The consumption power of Ltr in each period within [Tran, Tran+] is L t r t which depends on the maximum power, minimum power and invariable electricity consumption.
{ L t r min L t r t L t r max t = T r a n T r a n + L t r t Δ t = W t r ( 1 + β t r )
where L t r min / L t r max represent the upper and lower consumption power limits allowed by Ltr. The total electricity consumed by Ltr during one day should be invariable under a certain consumption efficiency βtr.

4. Two-Stage Coordinated Optimization of System Scheduling

4.1. First Stage: Load Curve Optimization

The first stage aims at the maximum match between daily load curve and wind farm output curve. That is to say, schedulable DR units within the VPP are dispatched optimally in this stage. Then the reshaped load curve tracking wind farm output is obtained, which is taken as the basis of the next stage. The objective of load curve optimization is shown in Equation (9):
{ min t = 1 24 | L t P w , t | L t = L t f i x + L s h t + L t r t
subjected to the constraints of (5), (7) and (8).
In the objective function (9), the reshaped load Lt is composed of fixed load L t f i x and VPP’s scheduling results Σ L s h t , Σ L t r t . The maximum match will be reached when the two curves are closest to each other. What’s more, in the process of load curve optimization, Pw,t and L t f i x are deterministic. Σ L s h t and Σ L t r t are needed to be optimized.

4.2. Second Stage: Power System Operation Optimization

The second stage representing the optimization of thermal units output and wind power curtailment is given by Equation (10)–(16) below:
min C = i N g t = 1 24 u i , t [ a i ( P i , t ) 2 + b i P i , t + c i ] + u i , t ( 1 u i , ( t 1 ) ) C i , t + μ i , t ( C i , t o i l + C i , t e v )
subject to:
i N g u i , t P i , t + P w , t P l o s s , t = L t
0 P l o s s , t P w , t
P i , min P i , t P i , max
| P i , t P i , t 1 | r a m p i
( u i , t 1 u i , t ) ( T i , t 1 o n M i o n ) 0
( u i , t u i , t 1 ) ( T i , t 1 o f f M i o f f ) 0
The objective function (10) minimizes the system operating cost C, which consists of coal consumption cost a i ( P i , t ) 2 + b i P i , t + c i , start-up cost C i , t , oil cost C i , t o i l and pollution charges C i , t e v [42,43,44]. In the process of power system operation optimization, taking no account of the cost of wind power, the system operating cost is mainly the operating cost of thermal units which is primarily composed of coal consumption costs and start-up costs when thermal units provide basic peaking services [45]. However, the boiler combustion of thermal units is inefficient without firing oil when thermal units are operating in deep peaking status for providing deep peaking service, which will increase oil costs. To make matters worse, deep peaking will reduce the desulfurization efficiency and increase the nitrogen content in emissions, resulting in an increase in pollution charges. Therefore, system operating cost in one day can be expressed as Equation (10).
Constraint (11) enforces the power balance. Constraint (12) enforces meeting the limit of wind power curtailment. Constraint (13) restricts the output level of thermal units. Constraints (14)–(16) limit the ramp and minimum on and off time of thermal units. Due to the main focus on peaking service, we will ignore the transmission network and reserve requirements at this step of our work.

5. Two-Layer Peaking Compensation Allocation

5.1. Outer Allocation Based on Improved Shapley Value

5.1.1. Shapley Value

In 1953, Professor Lloyd Shapley proposed the Shapley value to solve the problem of multi-person cooperative income allocation on the basis of individuals’ marginal contribution [46]. According to the Shapley value method, the compensation fee that a participant i should receive is equal to the average of its marginal contribution to each alliance in which it joins:
Φ i ( V ) = S N \ i s ! ( n s 1 ) ! n ! ( V ( S { i } ) V ( S ) )
In this paper, the peaking alliance is formed by deep peaking clusters and VPP. The actual meaning of Φi(V) is the compensation fee of peaking participant i. N is the set of peaking participants, whose number is n. S represents an alliance composed of some types of peaking providers (excluding participant i) to promote the integration of wind power, and its number is s. V(S) is the compensation fee of peaking alliance S. V(S {i}) is the marginal increase in peaking compensation fee after participant i joins S.

5.1.2. Improved Shapley Value

In order to reflect the individual differences among peaking participants, the realization coefficient of peaking capability is introduced to improve the Shapley value. If the realization coefficient of a peaking participant is high, its compensation fee should be appropriately increased because of its high enthusiasm. The new weight of participant i is calculated by:
R i = ε i / i = 1 n ε i
where εi represent the realization coefficient of peaking participant i, which is used to assess the realization degree of peaking capability. εi is formulated as:
ε i = ( j N i C i j / C i j max ) / n i
where Ni is the set of peaking providers belonging to i, whose number is ni. Cij and Cijmax respectively represent the actual peaking contribution and the maximum peaking contribution of thermal unit j (or schedulable unit j) within participant i. On the supply side, the output of peaking providers in Equation (10) is the output of thermal units. When the output of thermal units and wind farms are completely complementary (their correlation is −1), the peaking effect is best, so Cijmax is equal to −1. On the demand side, the output of peaking providers in Equation (10) is the consumption power of DR resources. When DR resources completely track the wind power output (their correlation is 1), the peaking effect is best, so Cijmax is equal to 1.
Obviously, the sum of new weights is 1. Therefore, the Shapley value can be corrected by:
Δ R i = R i 1 / n
The new allocation of compensation fee can be formulated by:
{ Φ i ( V ) = Φ i ( V ) + Δ Φ i ( V ) Δ Φ i ( V ) = Δ R i × V ( N )
where Φi’(V) is the compensation fee of peaking participant i according to the improved Shapley value. When ΔRi is greater than 0, which indicates that the realization degree of peaking capability of participant i is higher than the average level in regional power system, its compensation fee should be relatively higher. When ΔRi is less than 0, the opposite is true.

5.2. Inner Allocation Based on Peaking Contribution

Ultimately, peaking compensation fees should be allocated to each thermal unit and each schedulable unit. Due to the similar peaking capability within layers, peaking contribution is used as the basis of inner allocation. The calculation method is as follows:
{ Φ i j = Φ i ( V ) × ( C i j / C i ) C i = j N i C i j
where Φij represents the compensation fee of thermal unit j (or schedulable unit j) within participant i. Cij represents the actual peaking contribution of peaking provider j. Ci represents the total peaking contribution of peaking participant i.

6. Simulation Results

6.1. Basic Data

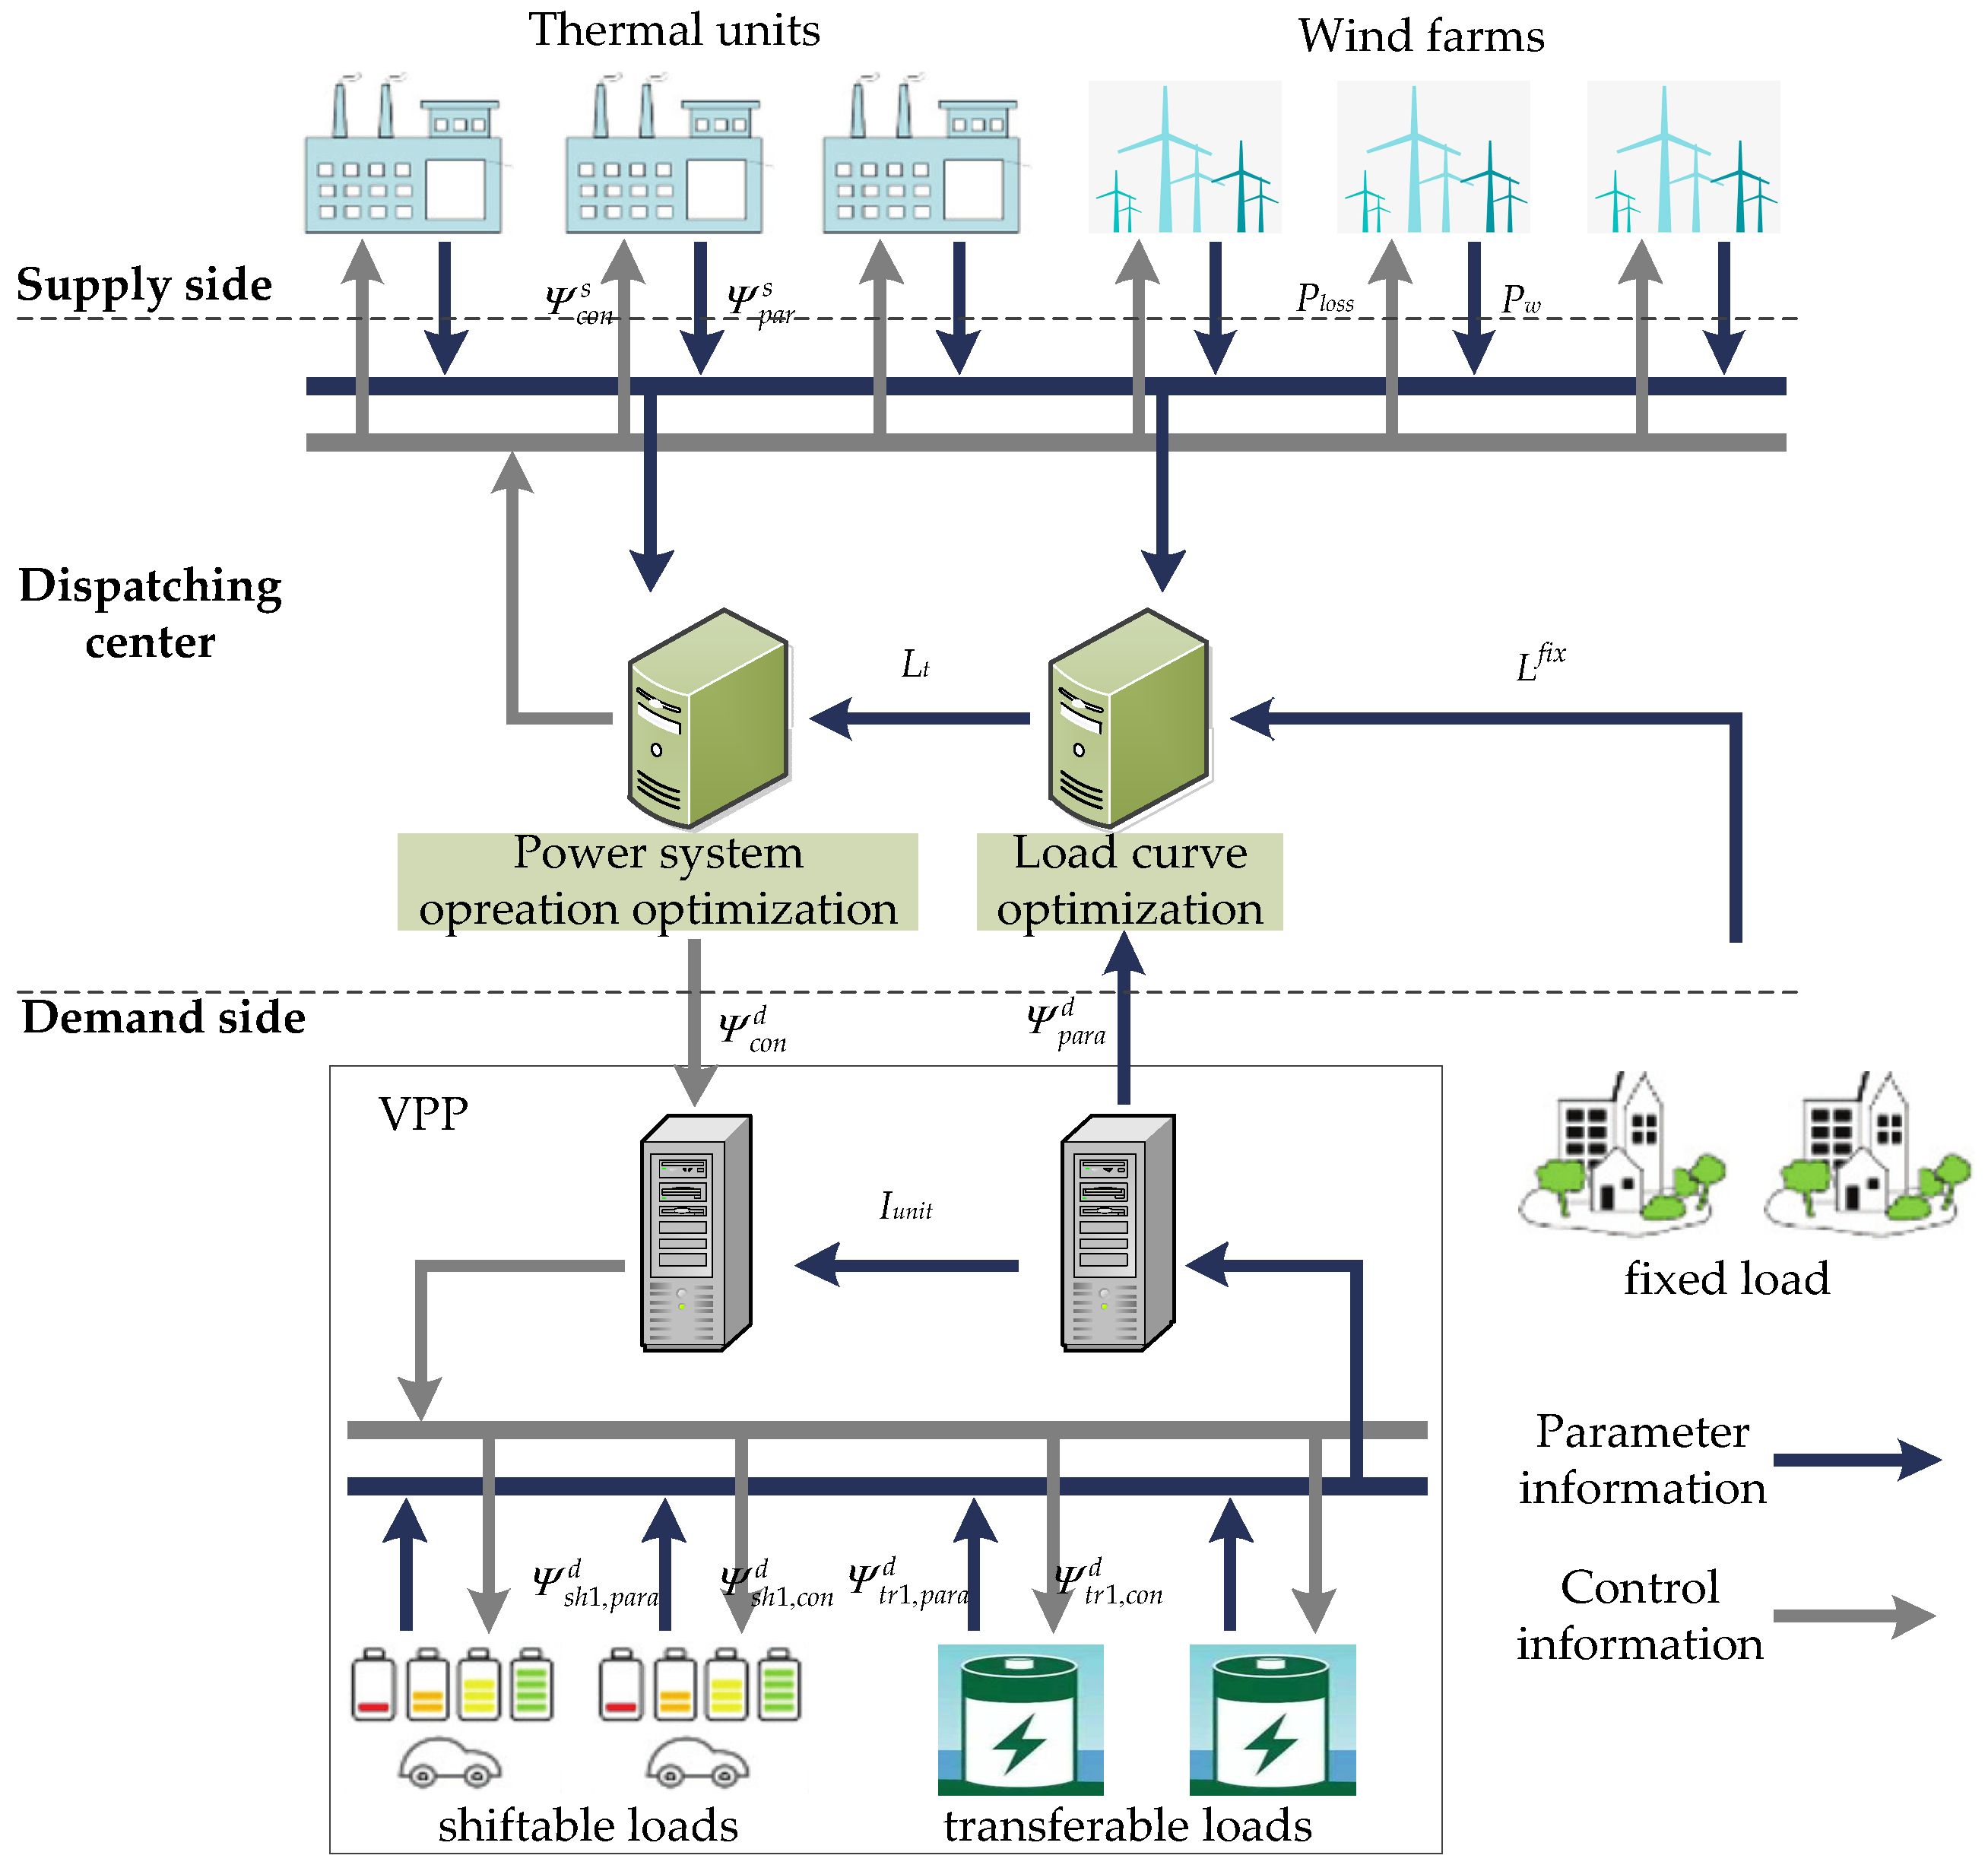
The proposed peaking compensation mechanism was tested on a ten machine synthetic system. In this created system, the loads include fixed loads, shiftable loads and transferable loads. The generators include thermal units and wind farms. Transmission is not considered. On the supply side, units 1~8 provided deep peaking service, and units 9~10 provided on-off peaking services whose compensation fees were not considered in this paper. The specific parameters are listed in Table 1. Among them, Pbasic,min and Pdeep,min are fixed parameters of thermal units, which need to meet the requirement of regional utilities and the limit of minimum output. Pbasic,min reflects the minimum output of thermal units when they provide basic peaking service, depending on some certain standards set by regional utilities. Once a unit’s output decreases below Pbasic,min, this unit will be considered to provide deep peaking service. Pdeep,min reflects the minimum output when thermal units provide deep peaking service, depending on their minimum technical output. On the demand side, the schedulable units of VPP consist of two types of shiftable load and two types of transfer load, whose parameters are shown in Table 2 and Table 3. The 24-hour output of wind farms, fixed load demand and initial consumption information of schedulable units are given in Figure 6. The feed-in tariff of wind power and thermal power were 83.05 $/MWh and 55.06 $/MWh, respectively. The scheduling model was solved by CPLEX.

6.2. Union Peaking

To analyze the impact of union peaking, the following cases were simulated. Among them, Case 0 provided a basis. The simulation results in different cases are shown in Table 4:
Case 0:
without wind farms integration, thermal units provide basic peaking and without VPP.
Case 1:
with wind farms integration, thermal units provide basic peaking and without VPP.
Case 2:
with wind farms integration, thermal units provide deep peaking and without VPP.
Case 3:
with wind farms integration, thermal units provide basic peaking and considering VPP.
Case 4:
with wind farms integration, thermal units provide deep peaking and considering VPP, the proposed method in this paper.
As can be seen from Table 4:
(1) Comparing Case 0 with the others, thermal units are partially replaced by wind farms, which leads to a decrease of operating cost and electric revenue. Therefore, it is necessary to motivate thermal units through reasonable electric revenue compensation.
(2) Comparing Case 1 with Case 2 and Case 4, after receiving the electric revenue compensation, thermal units’ net profits can be guaranteed. If peaking compensation fees are taken into account, the incentive for thermal units is more obvious. The WPC of Case 2~Case 4 is lower than Case 1, which indicates both supply side and demand side can promote the integration of wind power especially in Case 4. The daily load curve optimized by VPP in Case 4, is shown in Figure 7. Compared with the original load curve, the load in the periods of curtailing wind power increases while the peak load decreases. The match between daily load curve and wind farms output is better, which is conducive to the integration of wind power. When wind power is sufficient, thermal units provide deep peaking services by reducing their output while the VPP shift or transfer DR resources to valley periods. At this time, the curtailment of wind power is minimized and the system additional income is maximized.
(3) By comparing Case 2 with Case 3, it can be seen that Case 2 significantly increases the integration of wind power due to the deep peaking of thermal units, which reduces coal consumption costs. However, the additional oil costs and pollution charges also increase system operating costs. In Case 3, the optimized load curve also increases the integration of wind power, thus reducing the output of some generators and decreasing system operating costs. Although the operating costs in Case 2 and Case 3 are not significantly different, the unit generation cost of Case 2 is much higher than that of Case 3.

6.3. Outer Allocation

In the outer layer, clusters A~C were taken as participants A~C, and the VPP was taken as participant D. Based on the method proposed in this paper, the compensation fee of each peaking alliance was calculated. The results are shown in Table 5.
The compensation fee of each peaking participant was calculated according to Equation (18)–(22). The results are shown in Table 6.

6.4. Inner Allocation

The compensation fee of each thermal unit or each schedulable unit is shown in Table 7.
It can be seen from Table 7 that:
(1) In this region, there are 12 peaking participants on both the supply side and demand side. If the traditional Shapley value method is used for compensation allocation, the number of calculations ise 212. Based on the method proposed in this paper, the number of calculations is only 24, which effectively alleviates the problem of “combination explosion”.
(2) As shown in Table 6 and Table 7, the capacity of participant C is small, but its degree of peaking capability realization is high. The compensation mechanism proposed in this paper enables participant C to obtain a relatively higher compensation fee, so the cost allocation is more fair, which is conducive to promoting the peaking enthusiasm of units.
(3) Under the peaking compensation mechanism proposed in this paper, wind farm and peaking participants not only ensure their own benefits, but also obtain some additional income, which is an obvious incentive.

7. Conclusions

In order to promote WPC integration, this paper proposes a peaking compensation mechanism to encourage the union peaking of supply side and demand side. The following conclusions are obtained:
(1)
Based on the notion of clustering, DR peaking providers are integrated into VPP while thermal units are divided into several deep peaking clusters according to the K-means clustering method, which can effectively reduce the number of participants in the process of Shapley allocation and thus mitigate “combination explosion”.
(2)
A two-stage coordinated scheduling model is built, which can take the DR resources into account. In the first stage, load curve is reshaped according to the control strategy of VPP. In the second stage, thermal units output and WPC are optimized.
(3)
A two-layer peaking compensation allocation method based on peaking contribution is proposed to ensure peaking providers’ profits. The quantification of peaking contributions based on PCC unifies both the supply side and demand side.
(4)
Simulation results show that the proposed peaking compensation mechanism has both incentive and fairness while should effectively promote enthusiasm for union peaking and the integration of WPC.

Author Contributions

Conceptualization, X.J. and Y.J.; methodology, X.J.; software, T.W. and M.Y.; validation, D.S. and T.W.; investigation, Y.J. and Q.Z.; data curation, T.W. and Q.Z.; writing—original draft preparation, T.W. and X.J.

Funding

This research was funded by the Science and Technology Research Project in 2019 of Henan Province China, grant number 192102210232; and the National Natural Science Foundation of China, grant number 51807180.

Conflicts of Interest

The authors declare no conflict of interest.

Nomenclature

Abbreviations
WPCwind power curtailmentVPPvirtual peaking plant
DRdemand responsePCCPearson correlation coefficient
Variables
L(Lt)the reshaped load (in period t)ui,tthe start-stop status of unit i during period t, which is 0-1 variables.
Σ L s h t the consumption power shifted to period t of all shiftable units within the VPPPi,tthe output of thermal unit i during period t.
Σ L t r t the consumption power transferred to period t of all transferable units within the VPPµi,tthe deep peaking status of unit i, which is used to judge whether unit i is in the state of deep peaking, and its value is also 0 or 1.
Ploss,tthe overall WPC in period t
Symbols
Pw(Pw,t)the overall predicted output of wind farms (in period t) L f i x / L t f i x the fixed load (in period t)
T i , t 1 o n / o f f Continuous on/off time of thermal unit i by period t V w i additional income of wind farm i
Vpeaking compensation fee Δ Q w i decreased wind power curtailment of wind farm i
Vwadditional income of wind farmsΔηithe correction coefficient used to correct the allocation of wind farms’ additional income
ΔQwdecreased wind power curtailment P w i the predicted output of wind farm i
PRthe output of peaking providersri,tthe peaking rate of thermal unit i during period t
Pi,maxthe maximum technical output of thermal unit i, which is equal to its rated power σ ( P w i ) the variance of wind farm i’s output
Pi,minthe minimum technical output of thermal unit iσ(Pw)the variance of wind farms’ output
Rampithe limit on the increase/decrease of output between adjacent periods for thermal unit iµ(Pw)the average of wind farms’ output
M i o n / o f f the minimum on/off time of thermal unit iσ(PR)the variance of peaking providers’ output
Δtthe temporal length of period t.µ(PR)the average of peaking providers’ output
Wtrthe total electrical energy consumed by Ltr during one dayIunitthe information of DR peaking providers included in DR schedulable units
Csystem operating cost in one dayεithe realization coefficient of peaking participant i
ai, bi, cithe consumption characteristic coefficients of unit i C i , t o i l oil cost during period t
Ci,tthe start-up cost during period t C i , t e v pollution charges during period t
βtrthe efficiency coefficient of consumption
Variable sets
Ψ c o n s the control information of thermal units Ψ s h , c o n d shiftable units’ control instruction of shift periods
Ψ t r 1 , c o n d transferable units’ control instruction of transfer periods and consumption power
Symbols sets
Ψ p a r s the parameters of thermal units Ψ s h , p a r a d the parameters of shiftable loads
Ψ t r , p a r a d the parameters of transferable loads Ψ p a r a d the parameters of VPP’s DR schedulable units
Index sets
Ngthe set of thermal units.Nwthe set of wind farms, whose number is nw

Appendix A. The Determination of θ

More details about the determination of θ can be found in [21].
Hypothesis 1: the participants in this cooperative game are wind farm A and thermal company B. The term a represents the peaking enthusiasm of the thermal company and b represents the enthusiasm of the wind farm. Terms α and β represent the unit value contribution rates of A and B. Terms γ and δ are their cost reduction effort levels. CAx and CBx represent the production cost. CA(γa) and CB(δb) represent the cost of cost reduction activities. a, b, α, β, γ, δ, CAx and CBx are all greater than 0.
Hypothesis 2: the additional income obtained by the cooperation between A and B is R(αa,βb). The distribution coefficient of A and B is 1 − θ and θ. Then, system net profit G, A’s net profit RA and B’s net profit RB are shown as follows:
{ G = R ( α a , β b ) [ C A X + C A ( γ a ) ] [ C B X + C B ( δ b ) ] R A = ( 1 θ ) × R ( α a , β b ) [ C A X + C A ( γ a ) ] T R B = T + θ R ( α a , β b ) [ C B X + C B ( δ b ) ]
where T is electric revenue compensation paid by wind farms.
Hypothesis 3:
{ C A ( γ a ) = C A 0 + 0.5 ( γ a ) 2 C B ( δ b ) = C B 0 + 0.5 ( δ b ) 2 R ( α a , β b ) = R 0 + ( α a , β b ) + 0.5 ( α a , β b ) 2
where CA0, CB0, and R0 are constants. α < γ, which ensure the convergence of G (2G/∂a2 < 0, 2G/∂b2 < 0). Adding a coefficient of 0.5 to the formula is to consider the convenience of operation and does not affect the functional relationship between variables.
It can be obtained from these hypotheses that:
{ G = R 0 + ( α a , β b ) + 0.5 ( α a , β b ) 2 [ C A X + C A 0 + 0.5 ( γ a ) 2 ] [ C B X + C B 0 + 0.5 ( δ b ) 2 ] R A = ( 1 θ ) [ R 0 + ( α a , β b ) + 0.5 ( α a , β b ) 2 ] [ C A X + C A 0 + 0.5 ( γ a ) 2 ] T R B = T + θ [ R 0 + ( α a , β b ) + 0.5 ( α a , β b ) 2 ] [ C B X + C B 0 + 0.5 ( δ b ) 2 ]
The game process is analyzed by an inverse method, which is how A and B choose their own actions when the additional income distribution ratio has been set. The partial derivatives of Ra and Rb can be used to obtain the enthusiasm levels a0 and b0 of A and B in the Nash equilibrium when they pursue the maximum self-interest (non-cooperative):
{ a 0 = ( 1 θ ) α δ 2 / [ γ 2 δ 2 ( 1 θ ) α 2 δ 2 θ β 2 γ 2 ] b 0 = θ β γ 2 / [ γ 2 δ 2 ( 1 θ ) α 2 δ 2 θ β 2 γ 2 ] a 0 / b 0 = [ α ( 1 θ ) / β θ ] × [ δ 2 / γ 2 ]
Therefore, the enthusiasm level is proportional to distribution coefficient and value contribution rate and inversely proportional to cost reduction activities.
Take the partial derivative of G with respect to θ:
G θ = G a 0 × a 0 θ + G b 0 × b 0 θ
Take the partial derivatives of Equation (5), and get a 0 / θ and b 0 / θ . Take the partial derivatives of Equation (4), and get G / a 0 and G / b 0 .
According to Equation (3):
{ ( α a 0 + β b 0 ) α + a = ( 1 / θ ) × γ 2 a 0 ( α a 0 + β b 0 ) β + b = ( β / θ ) × γ 2 a 0
When G / θ = 0 :
{ 1 θ 0 = α 2 ( δ 2 β 2 ) / [ α 2 ( δ 2 β 2 ) + β 2 ( γ 2 α 2 ) ] θ 0 = β 2 ( γ 2 α 2 ) / [ α 2 ( δ 2 β 2 ) + β 2 ( γ 2 α 2 ) ]
According to the hypotheses that α < γ, β < δ, 1 − θ0 and θ0 are both greater than 0. When wind farm A and thermal company B respectively distribute the additional income according to the proportion of 1 − θ0 and θ0, the overall profit of cooperation can be maximized, so θ0 can be called the optimal distribution coefficient.

References

  1. Operation of Wind Power Grid Integration in 2018. Available online: http://www.nea.gov.cn/2019-01/28/c_137780779.htm (accessed on 28 January 2019).
  2. Operation of Wind Power Grid Integration in 2017. Available online: http://www.nea.gov.cn/2018-02/01/c_136942234.htm (accessed on 1 February 2018).
  3. Operation of Wind Power Grid Integration in 2016. Available online: http://www.nea.gov.cn/2017-01/26/c_136014615.htm (accessed on 26 January 2017).
  4. Dong, C.; Qi, Y.; Dong, W.; Lu, X.; Liu, T.; Qian, S. Decomposing driving factors for wind curtailment under economic new normal in China. Appl. Energy 2018, 217, 178–188. [Google Scholar] [CrossRef]
  5. Lin, L.; Zou, L.; Zhou, P.; Tian, X. Multi-angle economic analysis on deep peak regulation of thermal power units with large-scale wind power integration. Autom. Electr. Power Syst. 2017, 41, 21–27. [Google Scholar]
  6. Jian, X.; Zhang, L.; Yang, L.; Han, X.; Wang, M. Deep-peak regulation mechanism based on kaldor improvement under high-penetration wind power. Autom. Electr. Power Syst. 2018, 42, 110–118. [Google Scholar]
  7. Luo, G.; Li, Y.; Tang, W.; Wei, X. Wind curtailment of China’s wind power operation: Evolution, causes and solutions. Renew. Sustain. Energy Rev. 2016, 53, 1190–1201. [Google Scholar] [CrossRef]
  8. He, Y.; Xu, Y.; Pang, Y.; Tian, H.; Wu, R. A regulatory policy to promote renewable energy consumption in China: Review and future evolutionary path. Renew. Energy 2016, 89, 695–705. [Google Scholar] [CrossRef]
  9. Lee, S.; Kim, J. Analytical assessment for system peak reduction by demand responsive resources considering their operational constraints in wholesale electricity market. Energies 2018, 11, 3343. [Google Scholar] [CrossRef]
  10. Jiang, X.; Nan, G.; Liu, H.; Guo, Z.; Zeng, Q.; Jin, Y. Optimization of battery energy storage system capacity for wind farm with considering auxiliary services compensation. Appl. Sci. 2018, 8, 1957. [Google Scholar] [CrossRef]
  11. Craparo, E.M.; Sprague, J.G. Integrated supply- and demand-side energy management for expeditionary environmental control. Appl. Energy 2019, 233, 352–366. [Google Scholar] [CrossRef]
  12. Monyei, C.G.; Adewumi, A.O. Integration of demand side and supply side energy management resources for optimal scheduling of demand response loads—South Africa in focus. Electr. Power Syst. Res. 2018, 158, 92–104. [Google Scholar] [CrossRef]
  13. Xie, J.; Li, Z.; Zhang, M.; Zhang, X.; Wu, F.; Fu, R. Peaking value quantification and cost compensation for generators. Trans. China Electrotech. Soc. 2013, 28, 271–276. [Google Scholar]
  14. Sharma, S.; Abhyankar, A.R. Loss allocation for weakly meshed distribution system using analytical formulation of shapley value. IEEE Trans. Power Syst. 2017, 32, 1369–1377. [Google Scholar] [CrossRef]
  15. Yu, Q.; Xie, J.; Chen, X.; Yu, K.; Gan, L. Loss and emission reduction allocation in distribution networks using MCRS method and Aumann-Shapley value method. IET Gener. Transm. Distrib. 2018, 12, 5975–5981. [Google Scholar] [CrossRef]
  16. Yu, Q.; Xie, J.; Chen, X.; Yu, K.; Gan, L.; Chen, L. Loss allocation for radial distribution networks including DGs using Shapley value sampling estimation. IET Gener. Transm. Distrib. 2019, 13, 1382–1390. [Google Scholar] [CrossRef]
  17. Xie, J.; Zhang, X.; Wu, F.; Fu, R. Peaking cost allocation using cooperative game theory and engineering concept. Power Syst. Prot. Control 2012, 40, 16–23. [Google Scholar]
  18. Hu, J.; Hu, L. Peaking cost allocation for thermoelectric unit via improved shapley value. Proc. CSU EPSA 2015, 27, 65–70. [Google Scholar]
  19. Zhao, X.; Wang, M.; Zhao, Y.; Wu, Q. A model of compensation mechanism variance on peak regulating ancillary services based on capacity across thermal power units. Autom. Electr. Power Syst. 2013, 37, 57–61. [Google Scholar]
  20. Fu, Y.; Chen, H.; Jiang, X.; Sun, J. A bi-layer peak-regulation compensation mechanism for large-scale wind power integration. Power Syst. Prot. Control 2019, 47, 51–57. [Google Scholar]
  21. Li, W.; Yang, Q.; Zhang, H.; Wang, Q. Incentive mechanism research on accommodation of wind power in regional electricity market based on cooperative game. Renew. Energy Resour. 2014, 32, 475–480. [Google Scholar]
  22. Yang, Y.; Zhang, J.; Feng, T. Study on compensation mechanism for peak-regulating ancillary service of nuclear units. Power Syst. Technol. 2017, 41, 2131–2138. [Google Scholar]
  23. Zhang, S.; Jiao, Y.; Chen, W. Demand-side management (DSM) in the context of China’s on-going power sector reform. Energy Policy 2017, 100, 1–8. [Google Scholar] [CrossRef]
  24. Roh, H.; Lee, J. Residential demand response scheduling with multiclass appliances in the smart grid. IEEE Trans. Smart Grid 2015, 7, 94–104. [Google Scholar] [CrossRef]
  25. Monyei, C.G.; Adewumi, A.O. Demand Side Management potentials for mitigating energy poverty in South Africa. Energy Policy 2017, 111, 298–311. [Google Scholar] [CrossRef] [Green Version]
  26. Chen, Y.; Xu, Y.; Li, Z.; Feng, X. Optimally coordinated dispatch of combined-heat-and-electrical network with demand response. IET Gener. Transm. Distrib. 2019, 13, 2216–2225. [Google Scholar] [CrossRef]
  27. Du, Y.F.; Jiang, L.; Li, Y.; Wu, Q. A robust optimization approach for demand side scheduling considering uncertainty of manually operated appliances. IEEE Trans. Smart Grid 2018, 9, 743–755. [Google Scholar] [CrossRef]
  28. Moon, S.; Lee, J. Multi-residential demand response scheduling with multi-class appliances in smart grid. IEEE Trans. Smart Grid 2018, 9, 2518–2528. [Google Scholar] [CrossRef]
  29. Dou, C.; Meng, C.; Yue, W.; Zhang, B. Double-deck optimal schedule of micro-grid based on demand-side response. IET Renew. Power Gener. 2019, 13, 847–855. [Google Scholar] [CrossRef]
  30. Baringo, A.; Baringo, L.; Arroyo, J. Day-Ahead self-scheduling of a virtual power plant in energy and reserve electricity markets under uncertainty. IEEE Trans. Power Syst. 2018, 34, 1881–1894. [Google Scholar] [CrossRef]
  31. Bui, V.; Hussain, A.; Kim, H. A multiagent-based hierarchical energy management strategy for multi-microgrids considering adjustable power and demand response. IEEE Trans. Smart Grid 2018, 9, 1323–1333. [Google Scholar] [CrossRef]
  32. Sheng, S.; Gu, Q. A day-ahead and day-in decision model considering the uncertainty of multiple kinds of demand response. Energies 2019, 12, 1711. [Google Scholar] [CrossRef]
  33. Fontes, F.A.C.C.; Halder, A.; Becerril, J.; Kumar, P.R. Optimal control of thermostatic loads for planning aggregate consumption: Characterization of solution and explicit strategies. IEEE Control Syst. Lett. 2019, 3, 877–882. [Google Scholar] [CrossRef]
  34. Nojavan, S.; Mohammadi-Ivatloo, B.; Zare, K. Optimal bidding strategy of electricity retailers using robust optimisation approach considering time-of-use rate demand response programs under market price uncertainties. IET Gener. Transm. Distrib. 2015, 9, 328–338. [Google Scholar] [CrossRef]
  35. Tang, R.; Wang, S.; Li, H. Game theory based interactive demand side management responding to dynamic pricing in price-based demand response of smart grids. Appl. Energy 2019, 250, 118–130. [Google Scholar] [CrossRef]
  36. Sheng, S.; Zhu, J.; Yan, J.; Li, M.; Li, R. Economic optimal dispatching of power system with wind power-pumped storage-thermal power joint operation. In Proceedings of the 5th IET International Conference on Renewable Power Generation (RPG) 2016, London, UK, 21–23 September 2016. [Google Scholar]
  37. Deng, R.; Yang, Z.; Chow, M.; Chen, J. A survey on demand response in smart grids: Mathematical models and approaches. IEEE Trans. Ind. Inform. 2015, 11, 570–582. [Google Scholar] [CrossRef]
  38. Lei, M.; Mo, S.; Wei, W.; Hua, Y.; Zhang, B. Risk assessment of demand response considering wind power generation. J. Eng. 2019, 16, 1824–1829. [Google Scholar] [CrossRef]
  39. Fu, Y.; Jiang, Y.; Li, Z.; Wei, C. Optimal economic dispatch for microgrid considering shiftable loads. Proc. CSEE 2014, 34, 2612–2620. [Google Scholar]
  40. Sun, C.; Wang, L.; Xu, H. An interaction load model and its application in microgrid day-ahead economic scheduling. Power Syst. Technol. 2016, 40, 2009–2016. [Google Scholar]
  41. Xing, L.; Zhang, P.; Fang, C.; Zhang, Y. Optimal operation for microgrid using generalized demand side resources. Autom. Electr. Power Syst. 2013, 37, 7–12. [Google Scholar]
  42. Jiang, X.; Jin, Y.; Wang, T.; Gao, J.; Zhan, X. Optimal sizing of large-scale wind system with time-sharing wind power curtailment. Int. Trans. Electr. Energy Syst. 2018, 28, e2582. [Google Scholar] [CrossRef]
  43. Dui, X.; Zhu, G.; Yao, L. Two-stage optimization of battery energy storage capacity to decrease wind power curtailment in grid-connected wind farms. IEEE Trans. Power Syst. 2018, 33, 3296–3305. [Google Scholar] [CrossRef]
  44. Dui, X.; Zhu, G. Optimal unit commitment based on second-order cone programming in high wind power penetration scenarios. IET Renew. Power Gener. 2018, 12, 52–60. [Google Scholar] [CrossRef]
  45. Tang, W.; Yang, H. Optimal operation and bidding strategy of a virtual power plant integrated with energy storage systems and elasticity demand response. IEEE Access 2019, 7, 79798–79809. [Google Scholar] [CrossRef]
  46. Dong, J.; Xue, G.; Li, R.; Cai, H. Research on peak shaving costs and allocation of wind power integration using scalable computing method. Clust. Comput. 2017, 20, 391–400. [Google Scholar] [CrossRef]
Figure 1. The games of system peaking process.
Energies 12 03299 g001
Figure 2. The allocation of system additional income.
Energies 12 03299 g002
Figure 3. Compensation mechanism model.
Energies 12 03299 g003
Figure 4. Cluster analysis of peaking thermal units.
Energies 12 03299 g004
Figure 5. The scheduling structure considering VPP.
Energies 12 03299 g005
Figure 6. 24-hour basic data.
Energies 12 03299 g006
Figure 7. Optimized load curve of VPP in Case 4.
Energies 12 03299 g007
Table 1. The Thermal Unit Parameters.
Thermal Unit12345678910
Pmax (MW)6306004554554001621501308580
Pbasic,min (MW)345330227.52102008070602520
Pdeep,min (MW)207200150136.51302523202520
Ramp (MW/h)2002001301301309060604040
Table 2. The Parameters of Shiftable Loads.
Typetc[ShiftShift+]td (h)Pav (kW)
Electric Vehicle19:0019:00–next day 5:0054
Electric Vehicle22:0022:00–next day 5:00130
Table 3. The Parameters of Transferable Loads.
Typetc[TranTran+]tdmin (h)Pmax (MW)Smax (MW·h)
Battery Storage16:0022:00–next day 9:00113
Electric Heating8:0022:00–next day 9:001210
Table 4. The Simulation Results.
Case01234
Thermal unitsOperating cost ($)727,706 541,984541,730525,582522,307
Unit generation cost ($/MWh)19.2119.2221.1919.2221.05
Electric revenue ($)2,084,9861,553,1091,402,0731,505,8561,365,325
Electric compensation ($)**151,036*187,784
Net profits ($)1,357,2791,011,1251,011,379980,2741,030,802
Wind farmsWPC (%)*26%6.02%21%0%
Electric revenue ($)*802,2471,030,060873,5201,085,489
Net profits ($)*802,247879,024873,520897,705
System additional income ($)*076,77624,01995,458
* There is no corresponding item in a single case (for example, there is no “Electric compensation” in Case 1).
Table 5. Peaking Compensation of Each Alliance.
AllianceV ($)AllianceV ($)AllianceV ($)
{A}38,697{A,C}38,697{A,B,C}46,503
{B}10,948{A,D}50,952{A,B,D}57,275
{C}0{B,C}10,956{A,C,D}50,952
{D}15,670{B,D}26,618{B,C,D}26,618
{A,B}46,503{C,D}15,689{A,B,C,D}57,275
Table 6. Allocation Result in Outer Layer.
ParticipantABCD
Shapley Value ($)33,20012,27684033393
Realization Coefficient0.3840.5820.7190.752
Improve Shapley Value ($)20,29810,71514,68911,569
Table 7. Allocation result in inner layer.
Peaking ProviderCapacity (MW)Peaking ContributionFee ($)
Custer AThermal Unit 1630−0.549700
Thermal Unit 2600−0.5910,599
Custer BThermal Unit 3455−0.224366
Thermal Unit 4455−0.173374
Thermal Unit 5400−0.152977
Custer CThermal Unit 6162−0.125508
Thermal Unit 7150−0.115049
Thermal Unit 8130−0.094131
Custer DShiftable Unit 11200.203127
Shiftable Unit 21500.223440
Transferable Unit 11500.142189
Transferable Unit 21000.182814

