A Voltage-Based Approach for Series High Impedance Fault Detection and Location in Distribution Systems Using Smart Meters

 ,
,
Abstract
:1. Introduction
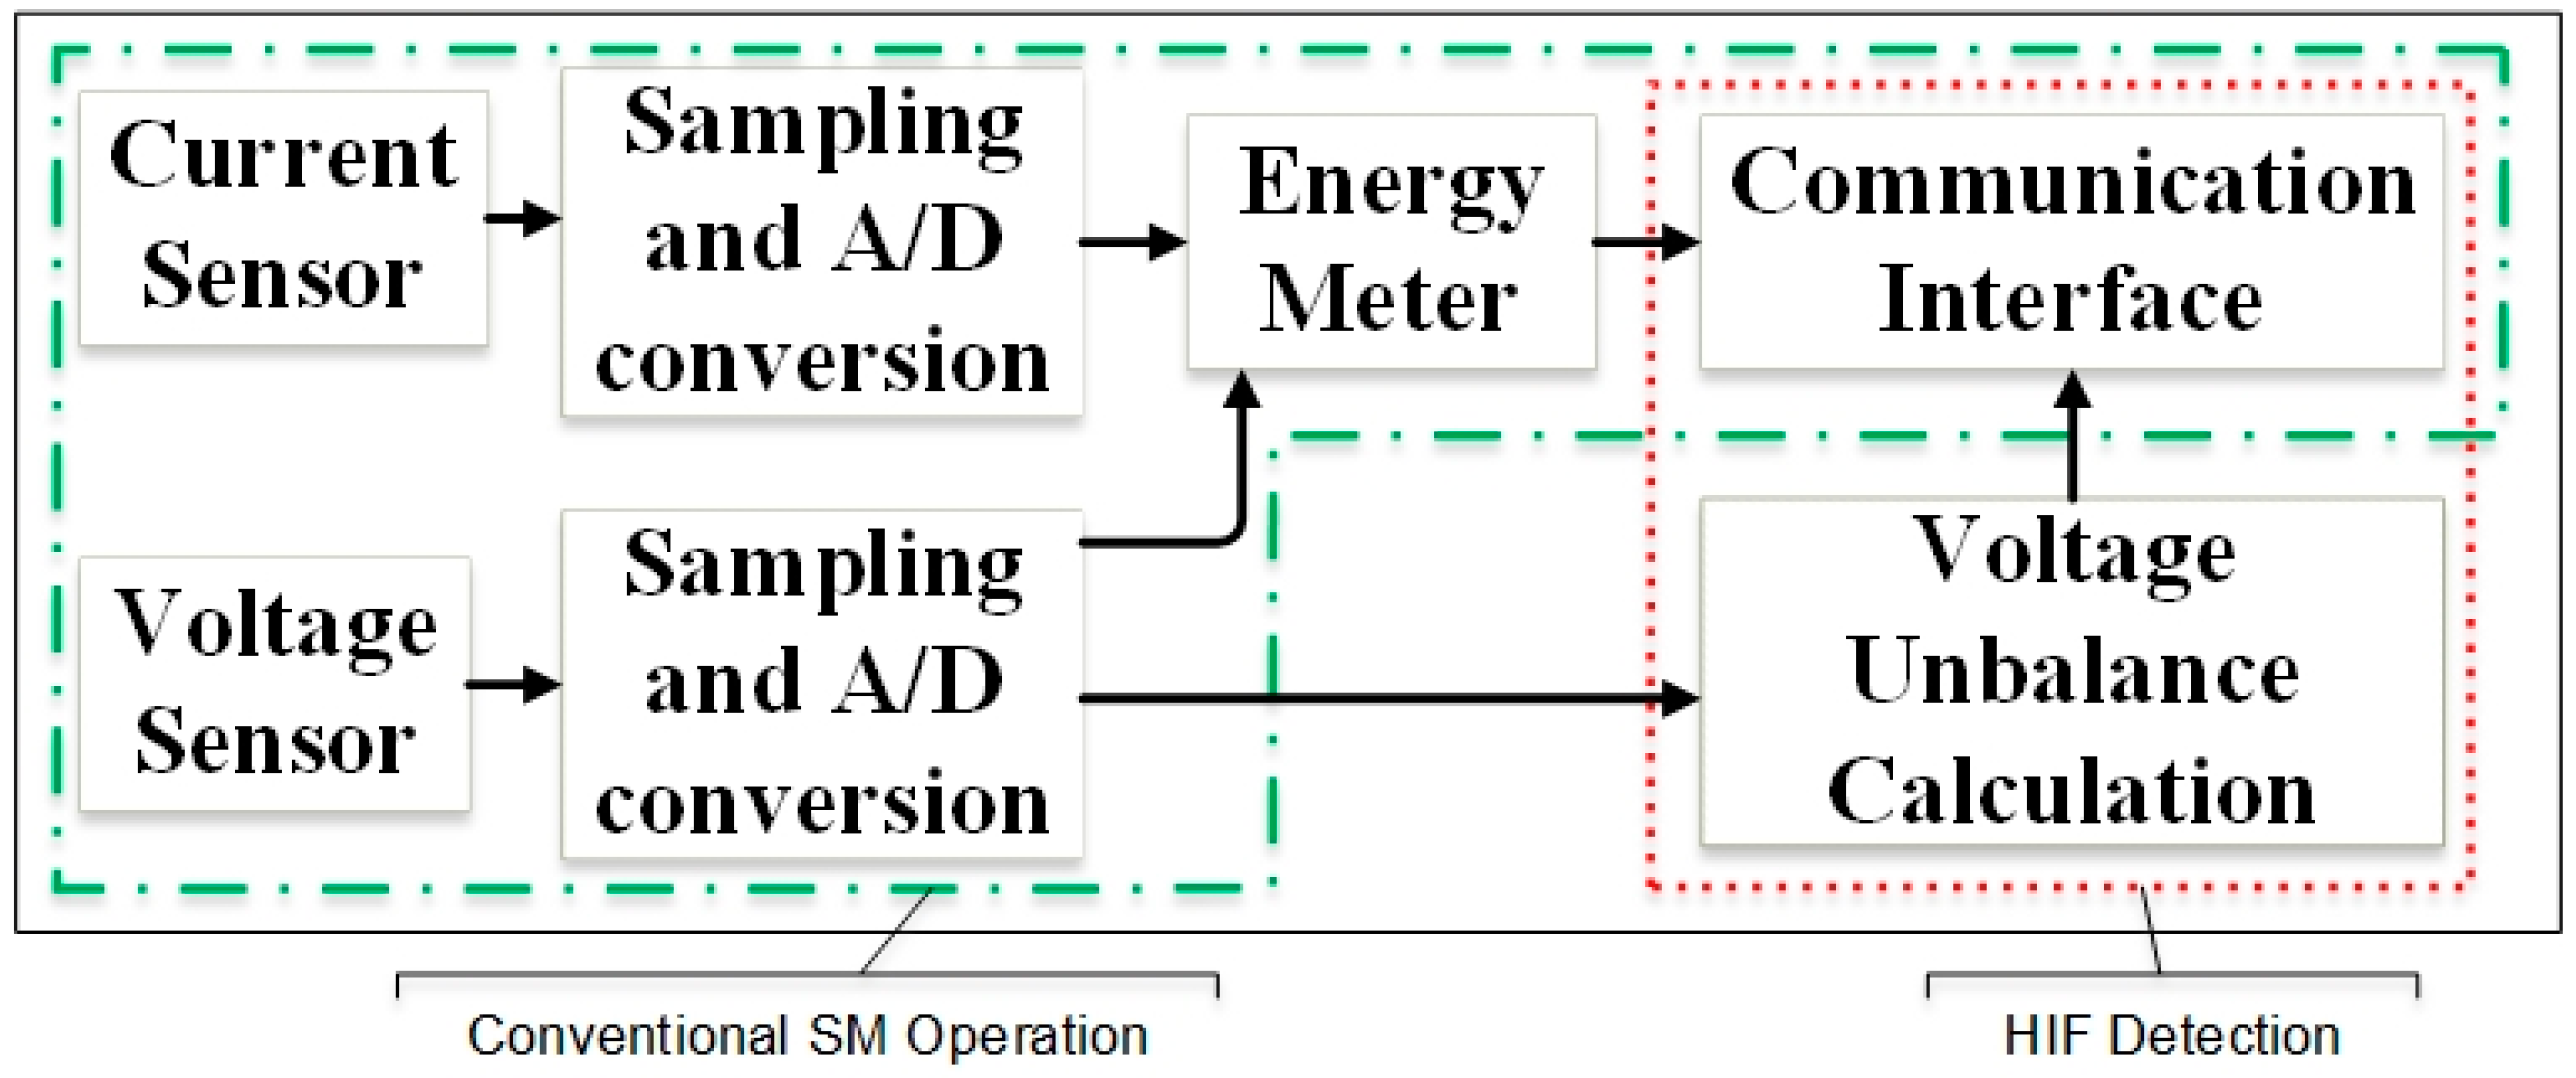
2. Proposed Methodology for HIF Detection and Location
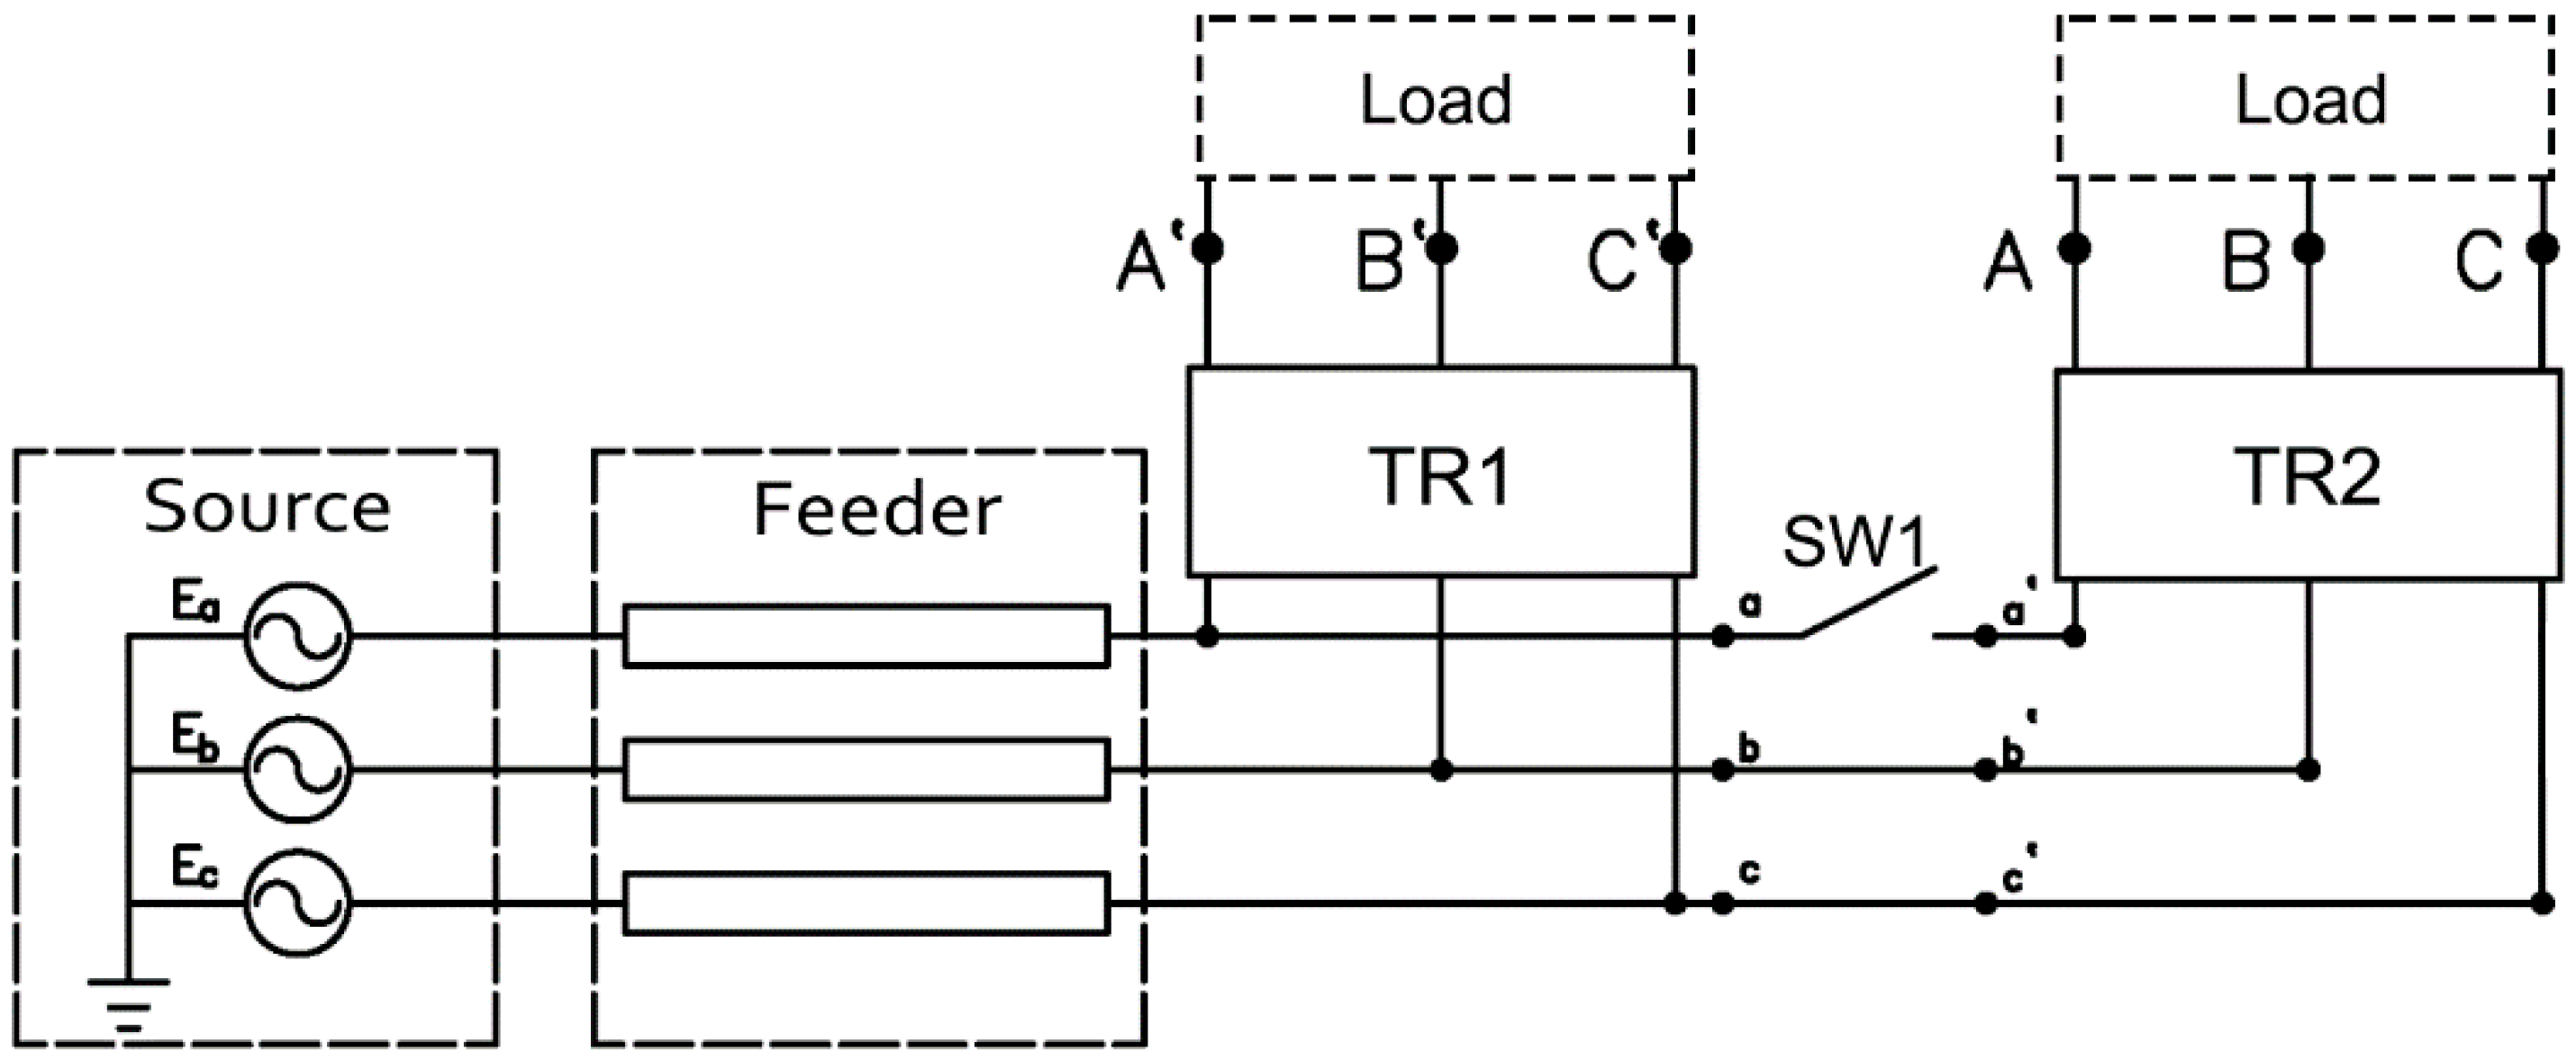
2.1. Detection
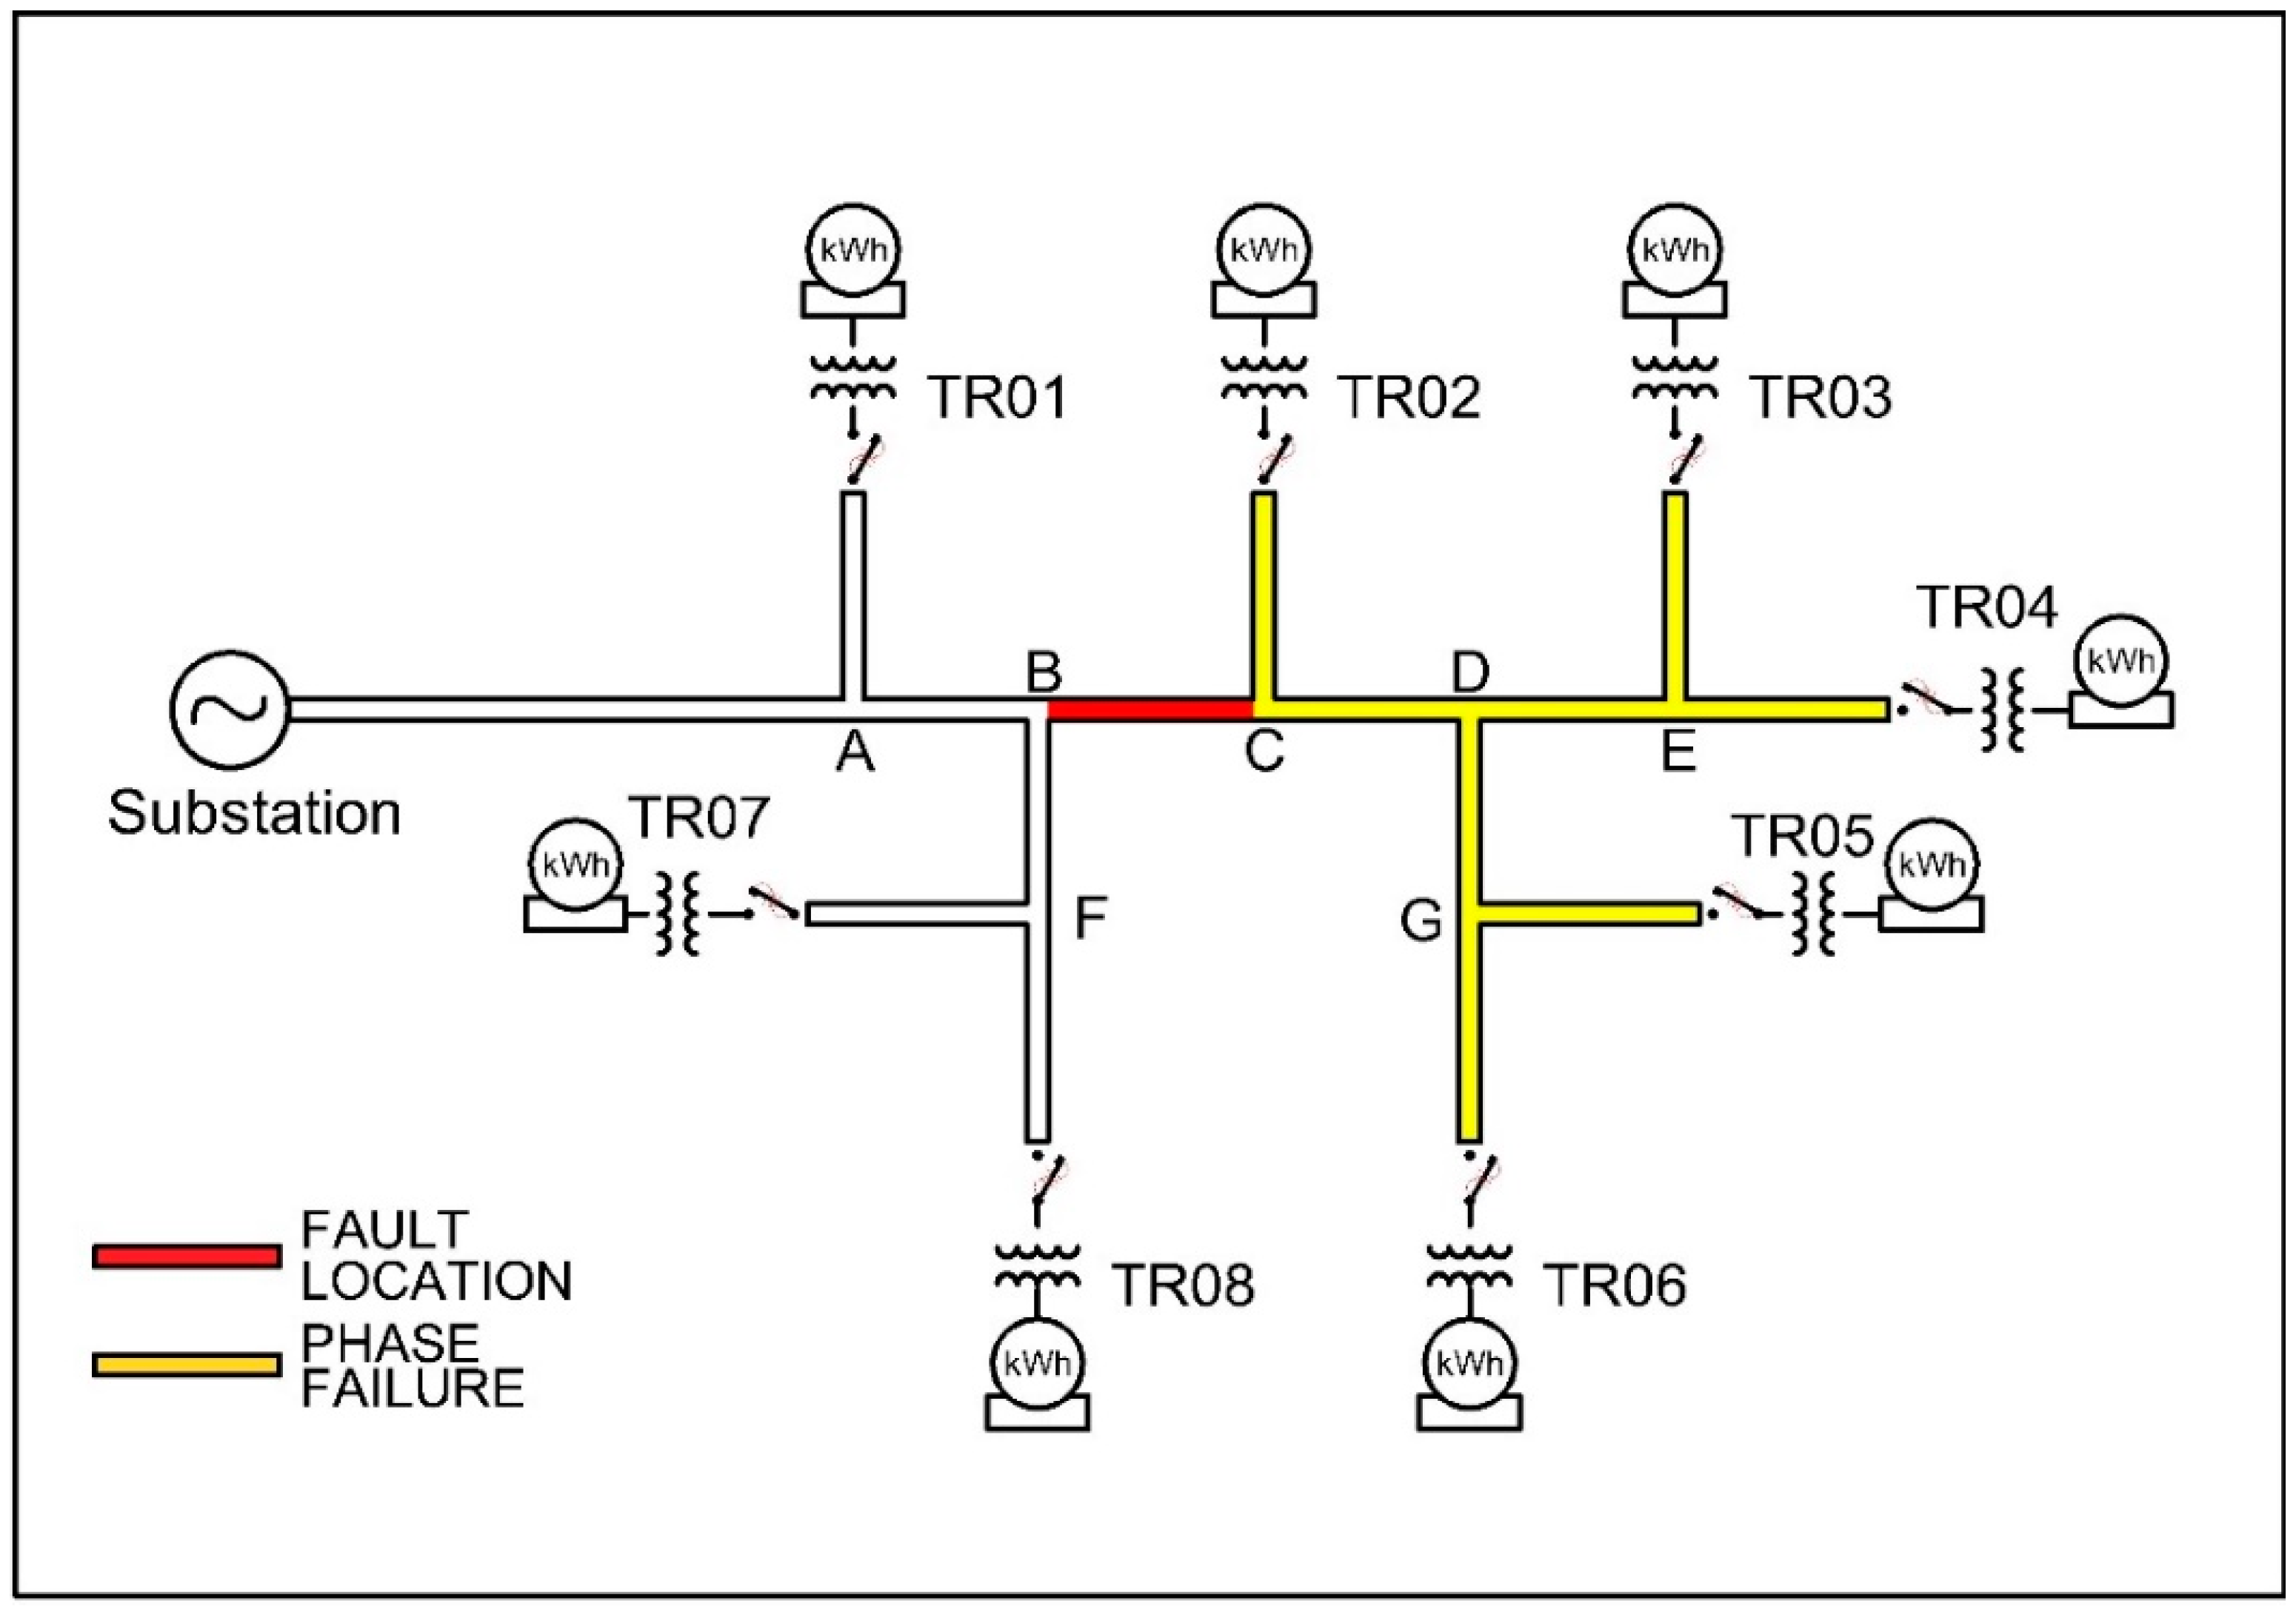
2.2. Location
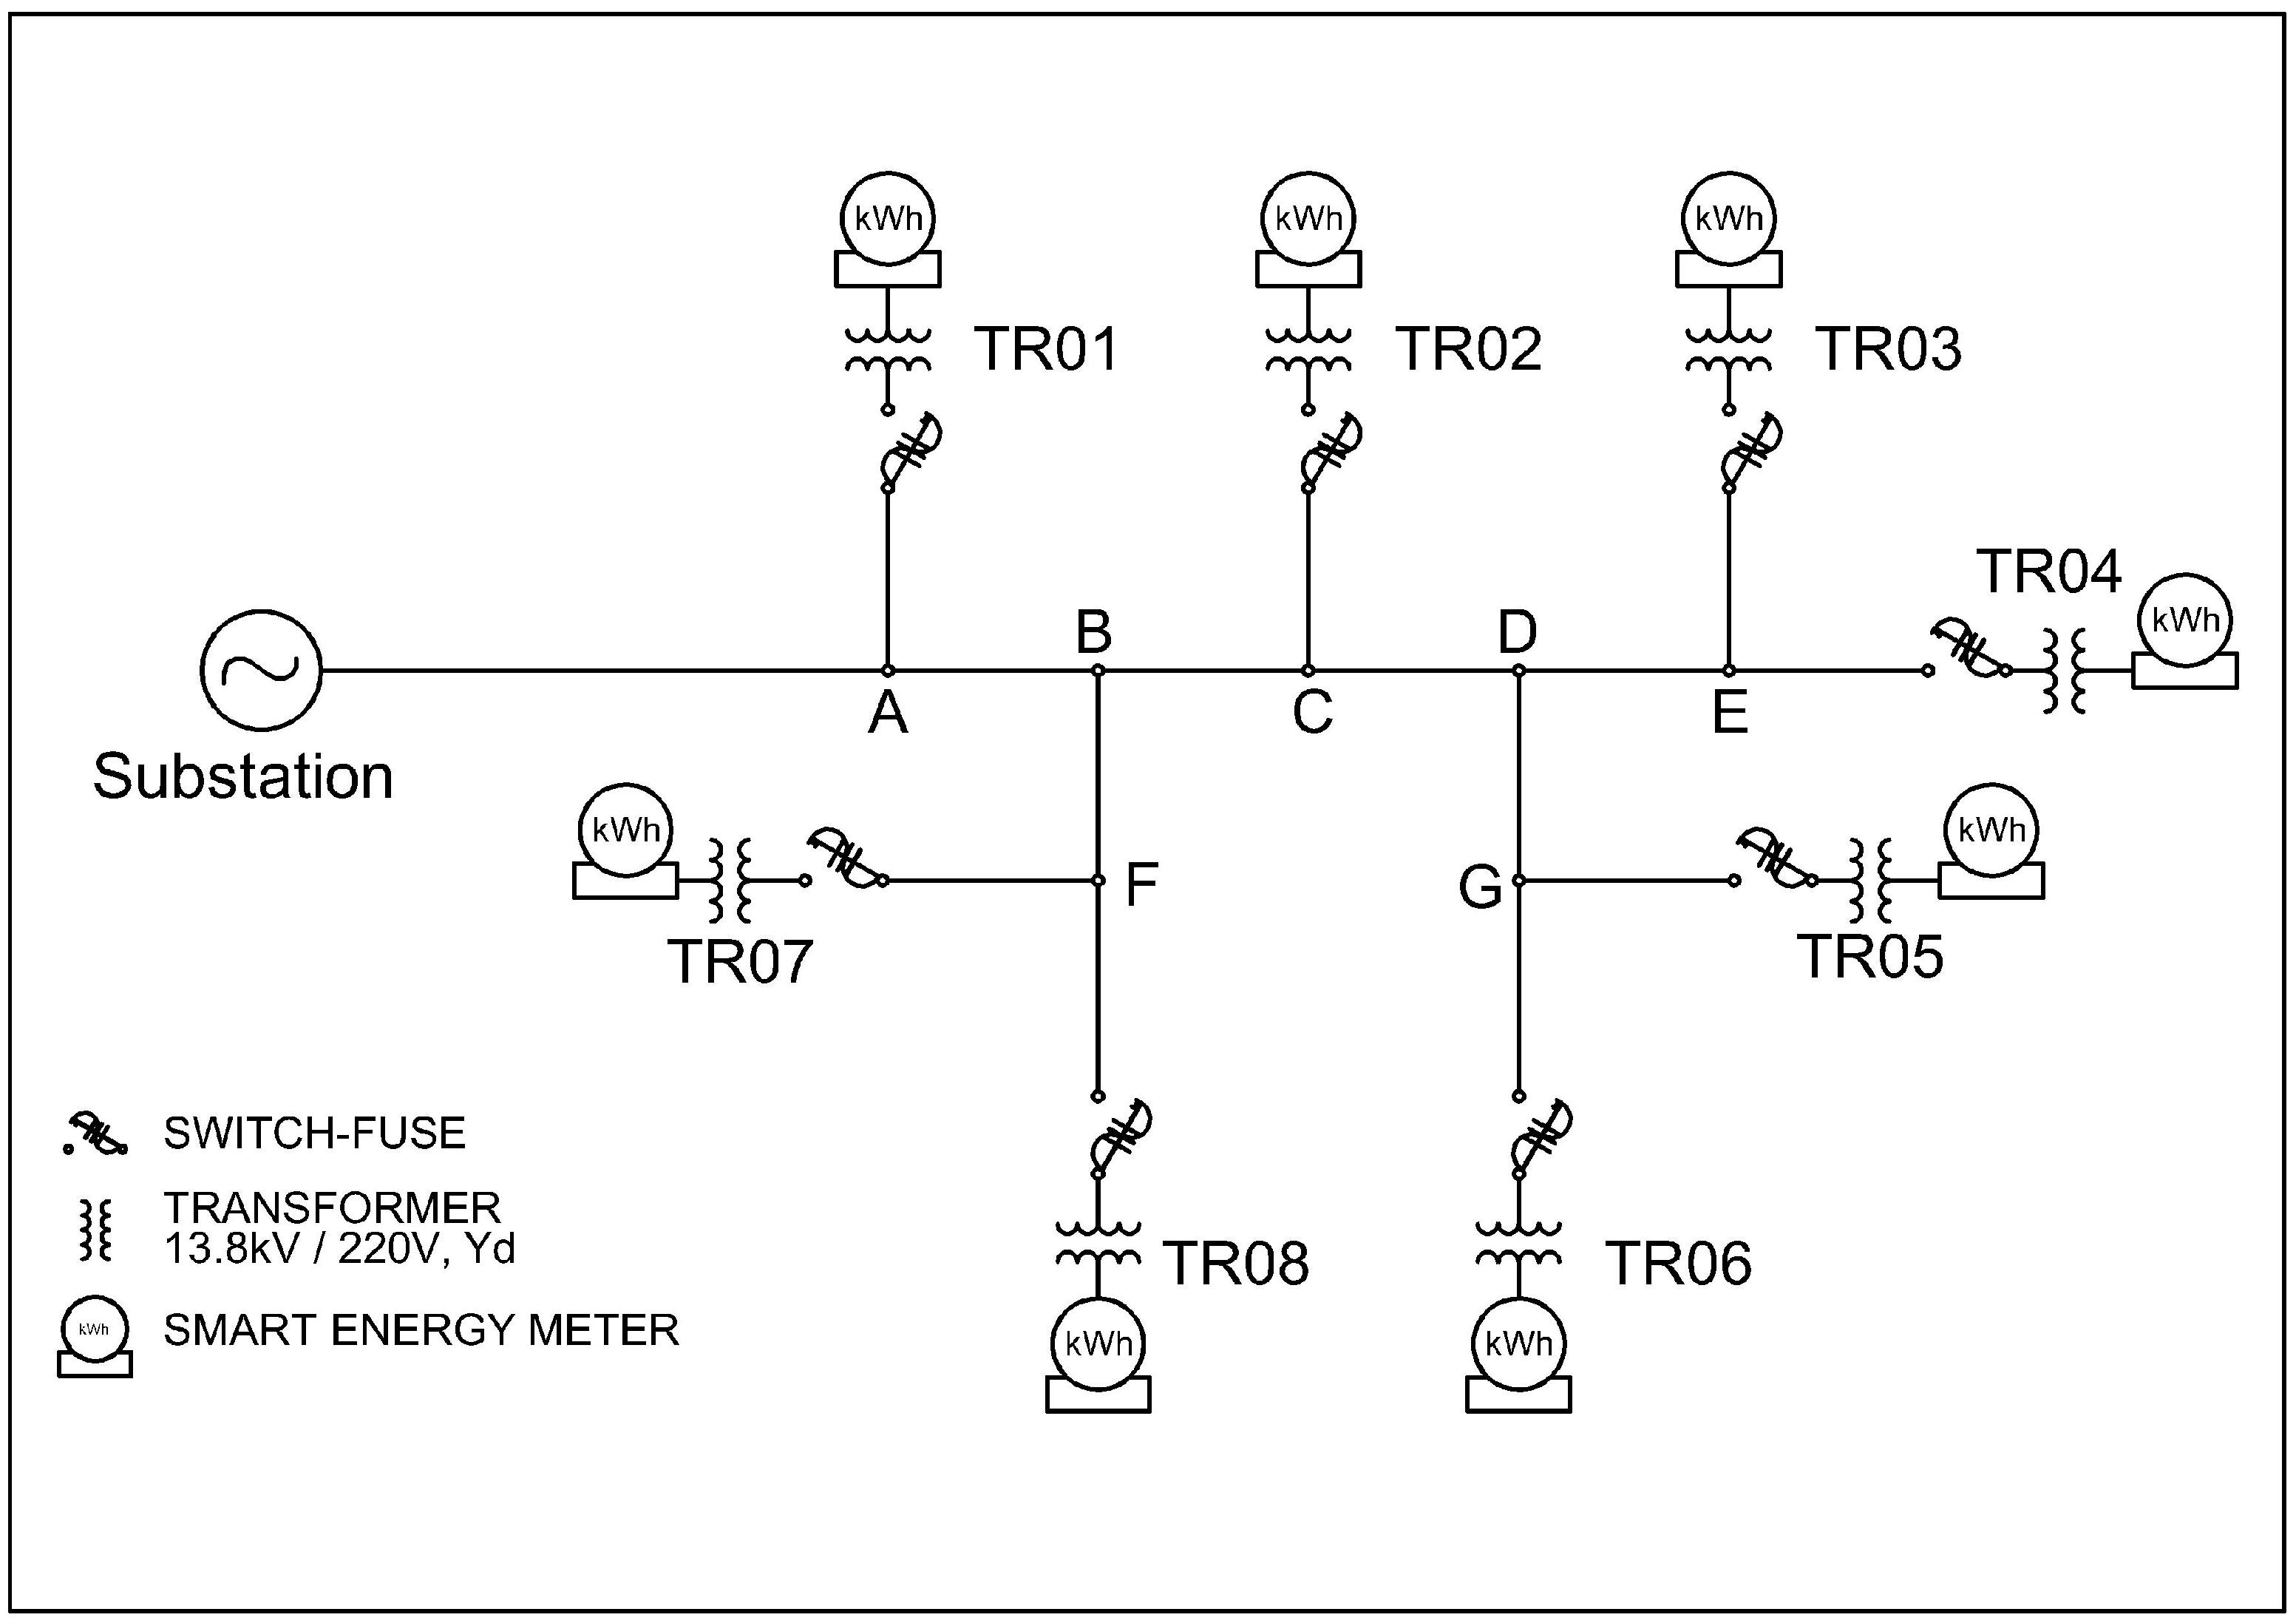
- The previous knowledge of the system topology, i.e., every branch between transformers and derivation nodes are listed on a matrix format, mapping the distribution feeder;
- The unbalance factor measurements from each smart meter, identified by its respective MV/LV transformer in the distribution system.
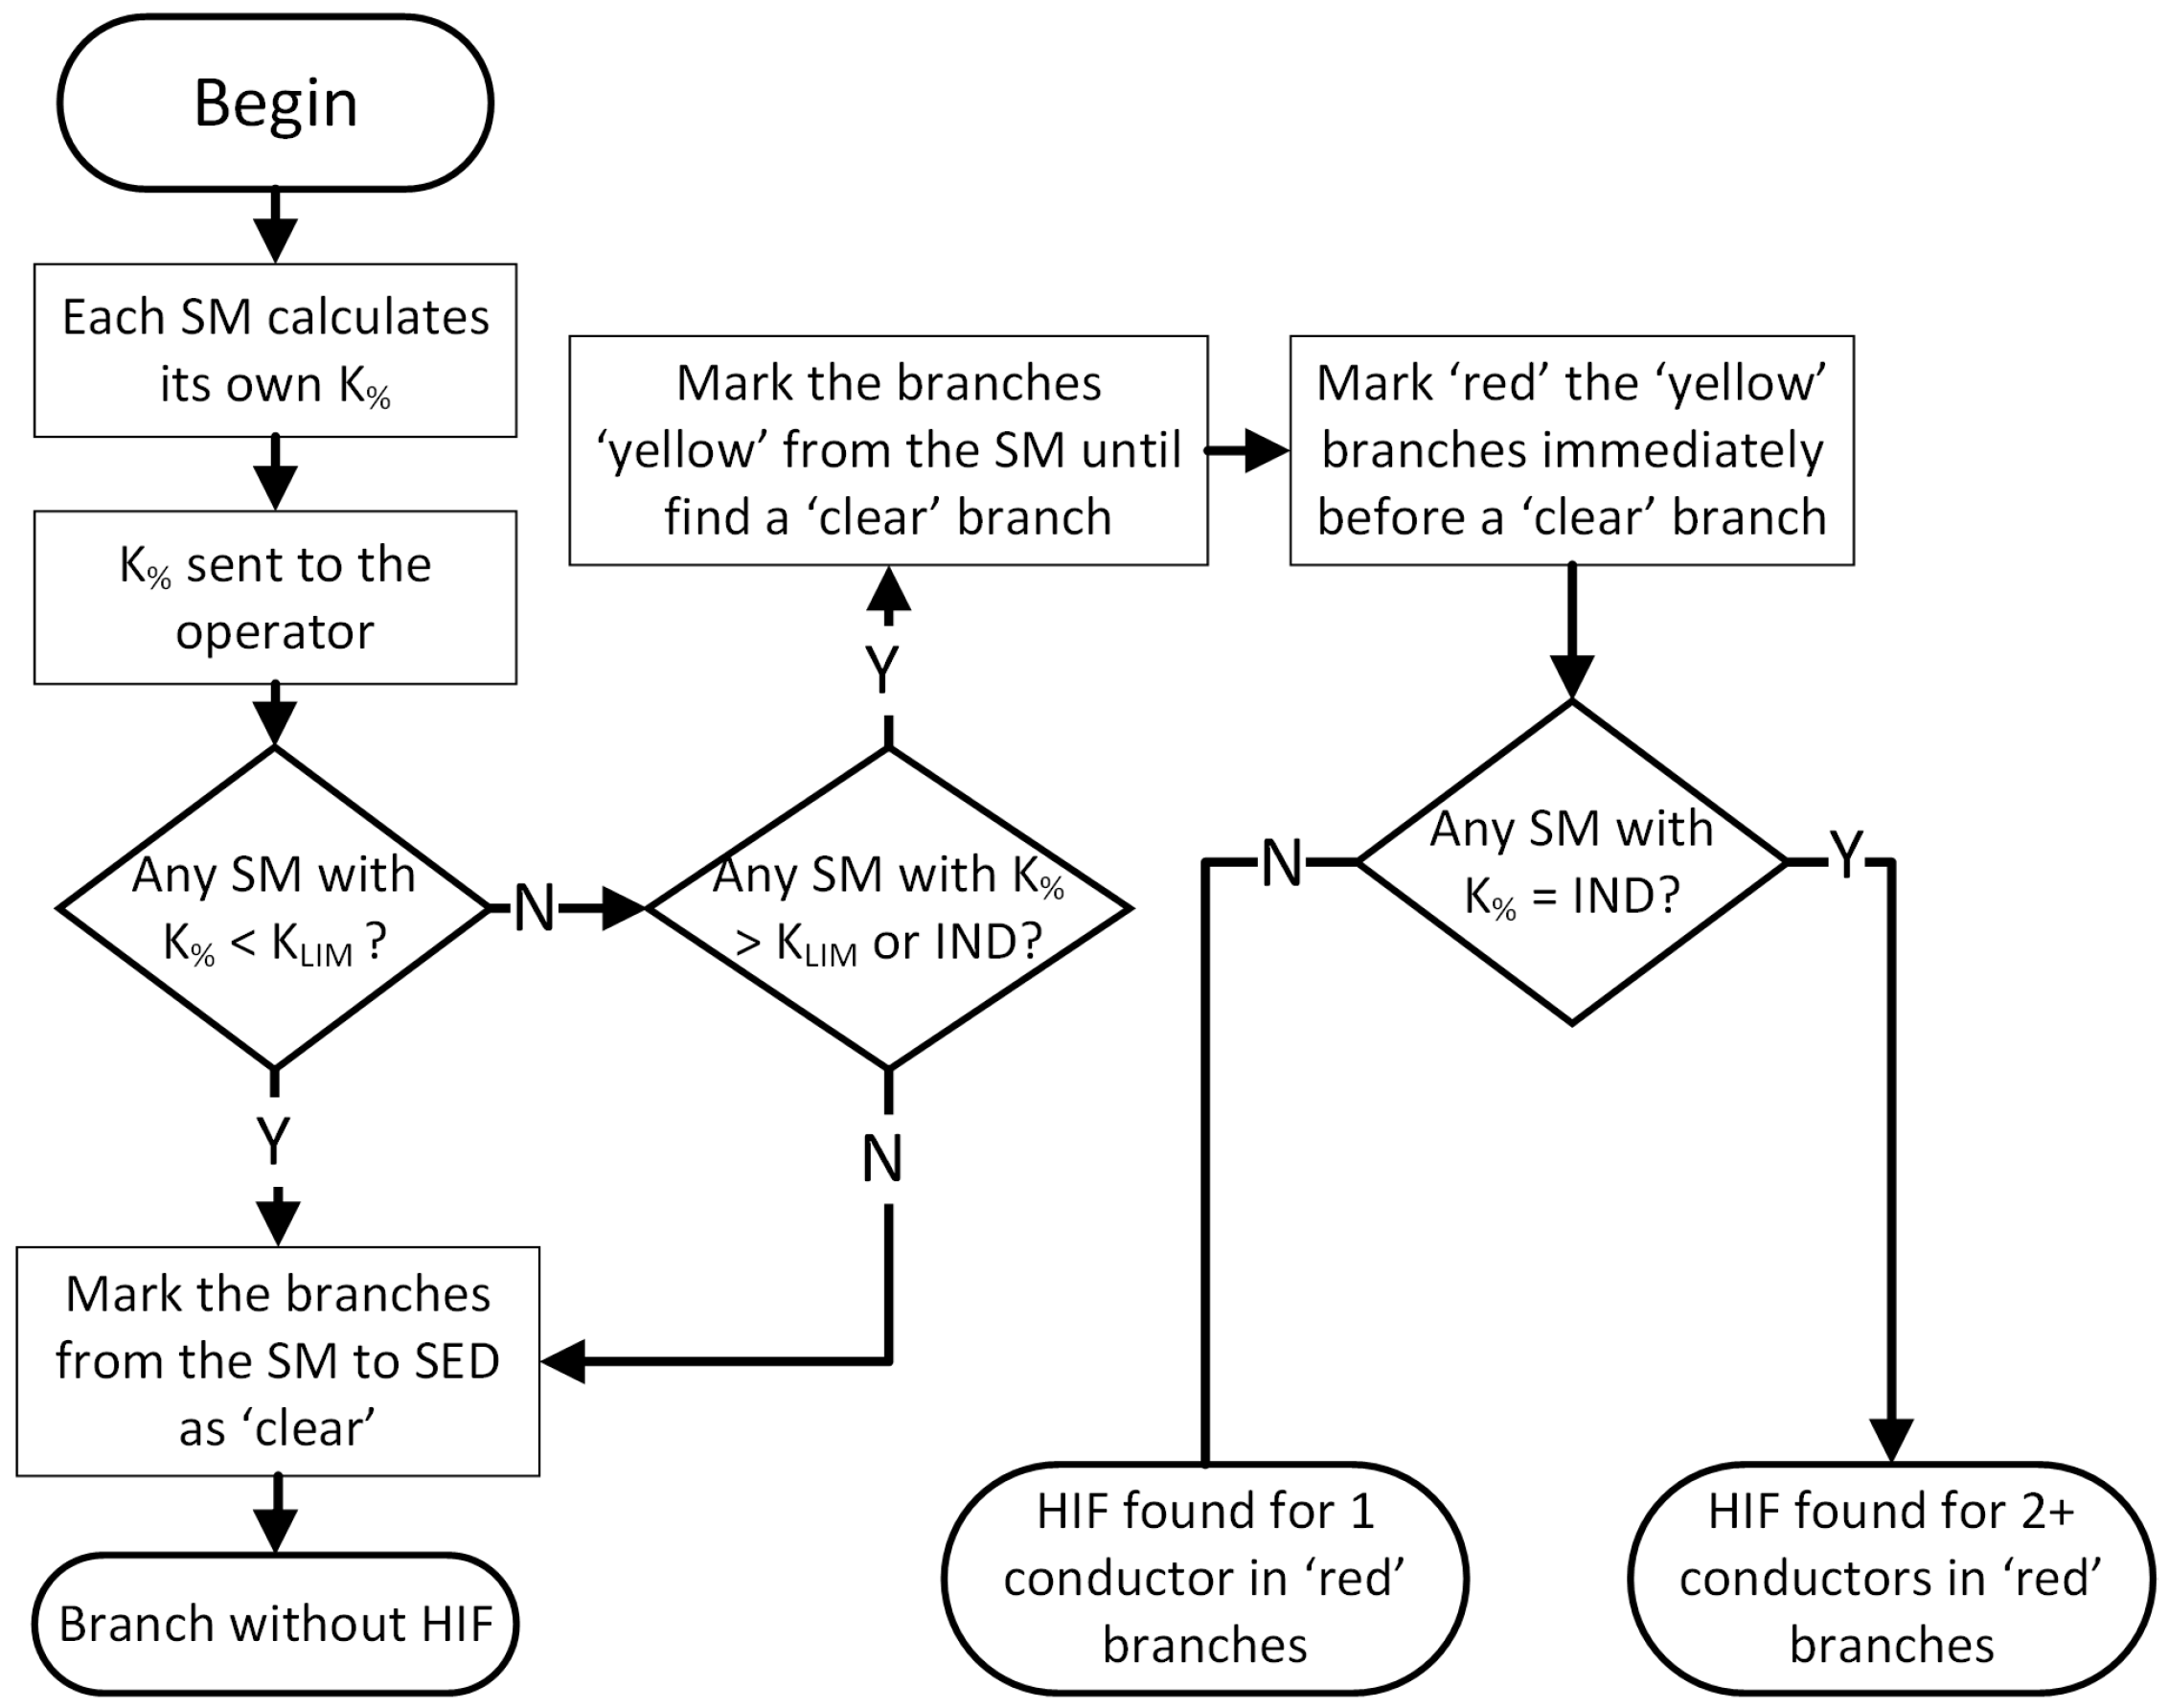
- The location procedure initially reads the voltage unbalance factor K% for every SM on the system;
- It identifies distribution transformers, for which the respective SM presents an unbalance factor K% below the unbalance threshold (KLIM);
- For all SMs with “healthy” results (K% < KLIM), the algorithm marks each branch on the respective path from the SM to the substation as “clear”;
- The algorithm identifies distribution transformers, for which the respective SM presents an unbalance factor K% above KLIM, referred here as “unbalanced SM”;
- The algorithm goes through every branch from each “unbalanced SM” to the substation, marking it as “yellow”, until it finds a branch marked as “clear”.
- The “yellow” branch immediately before a “clear” branch is the probable location of the HIF, and it is marked as “red”.
- At the end of the process, the algorithm presents the branches marked as “clear”, i.e., probably not affected by the HIF; the branches marked as “yellow”, i.e., probably affected by the HIF; and, finally, the branch(es) marked as “red”, i.e., the probable location of the HIF.
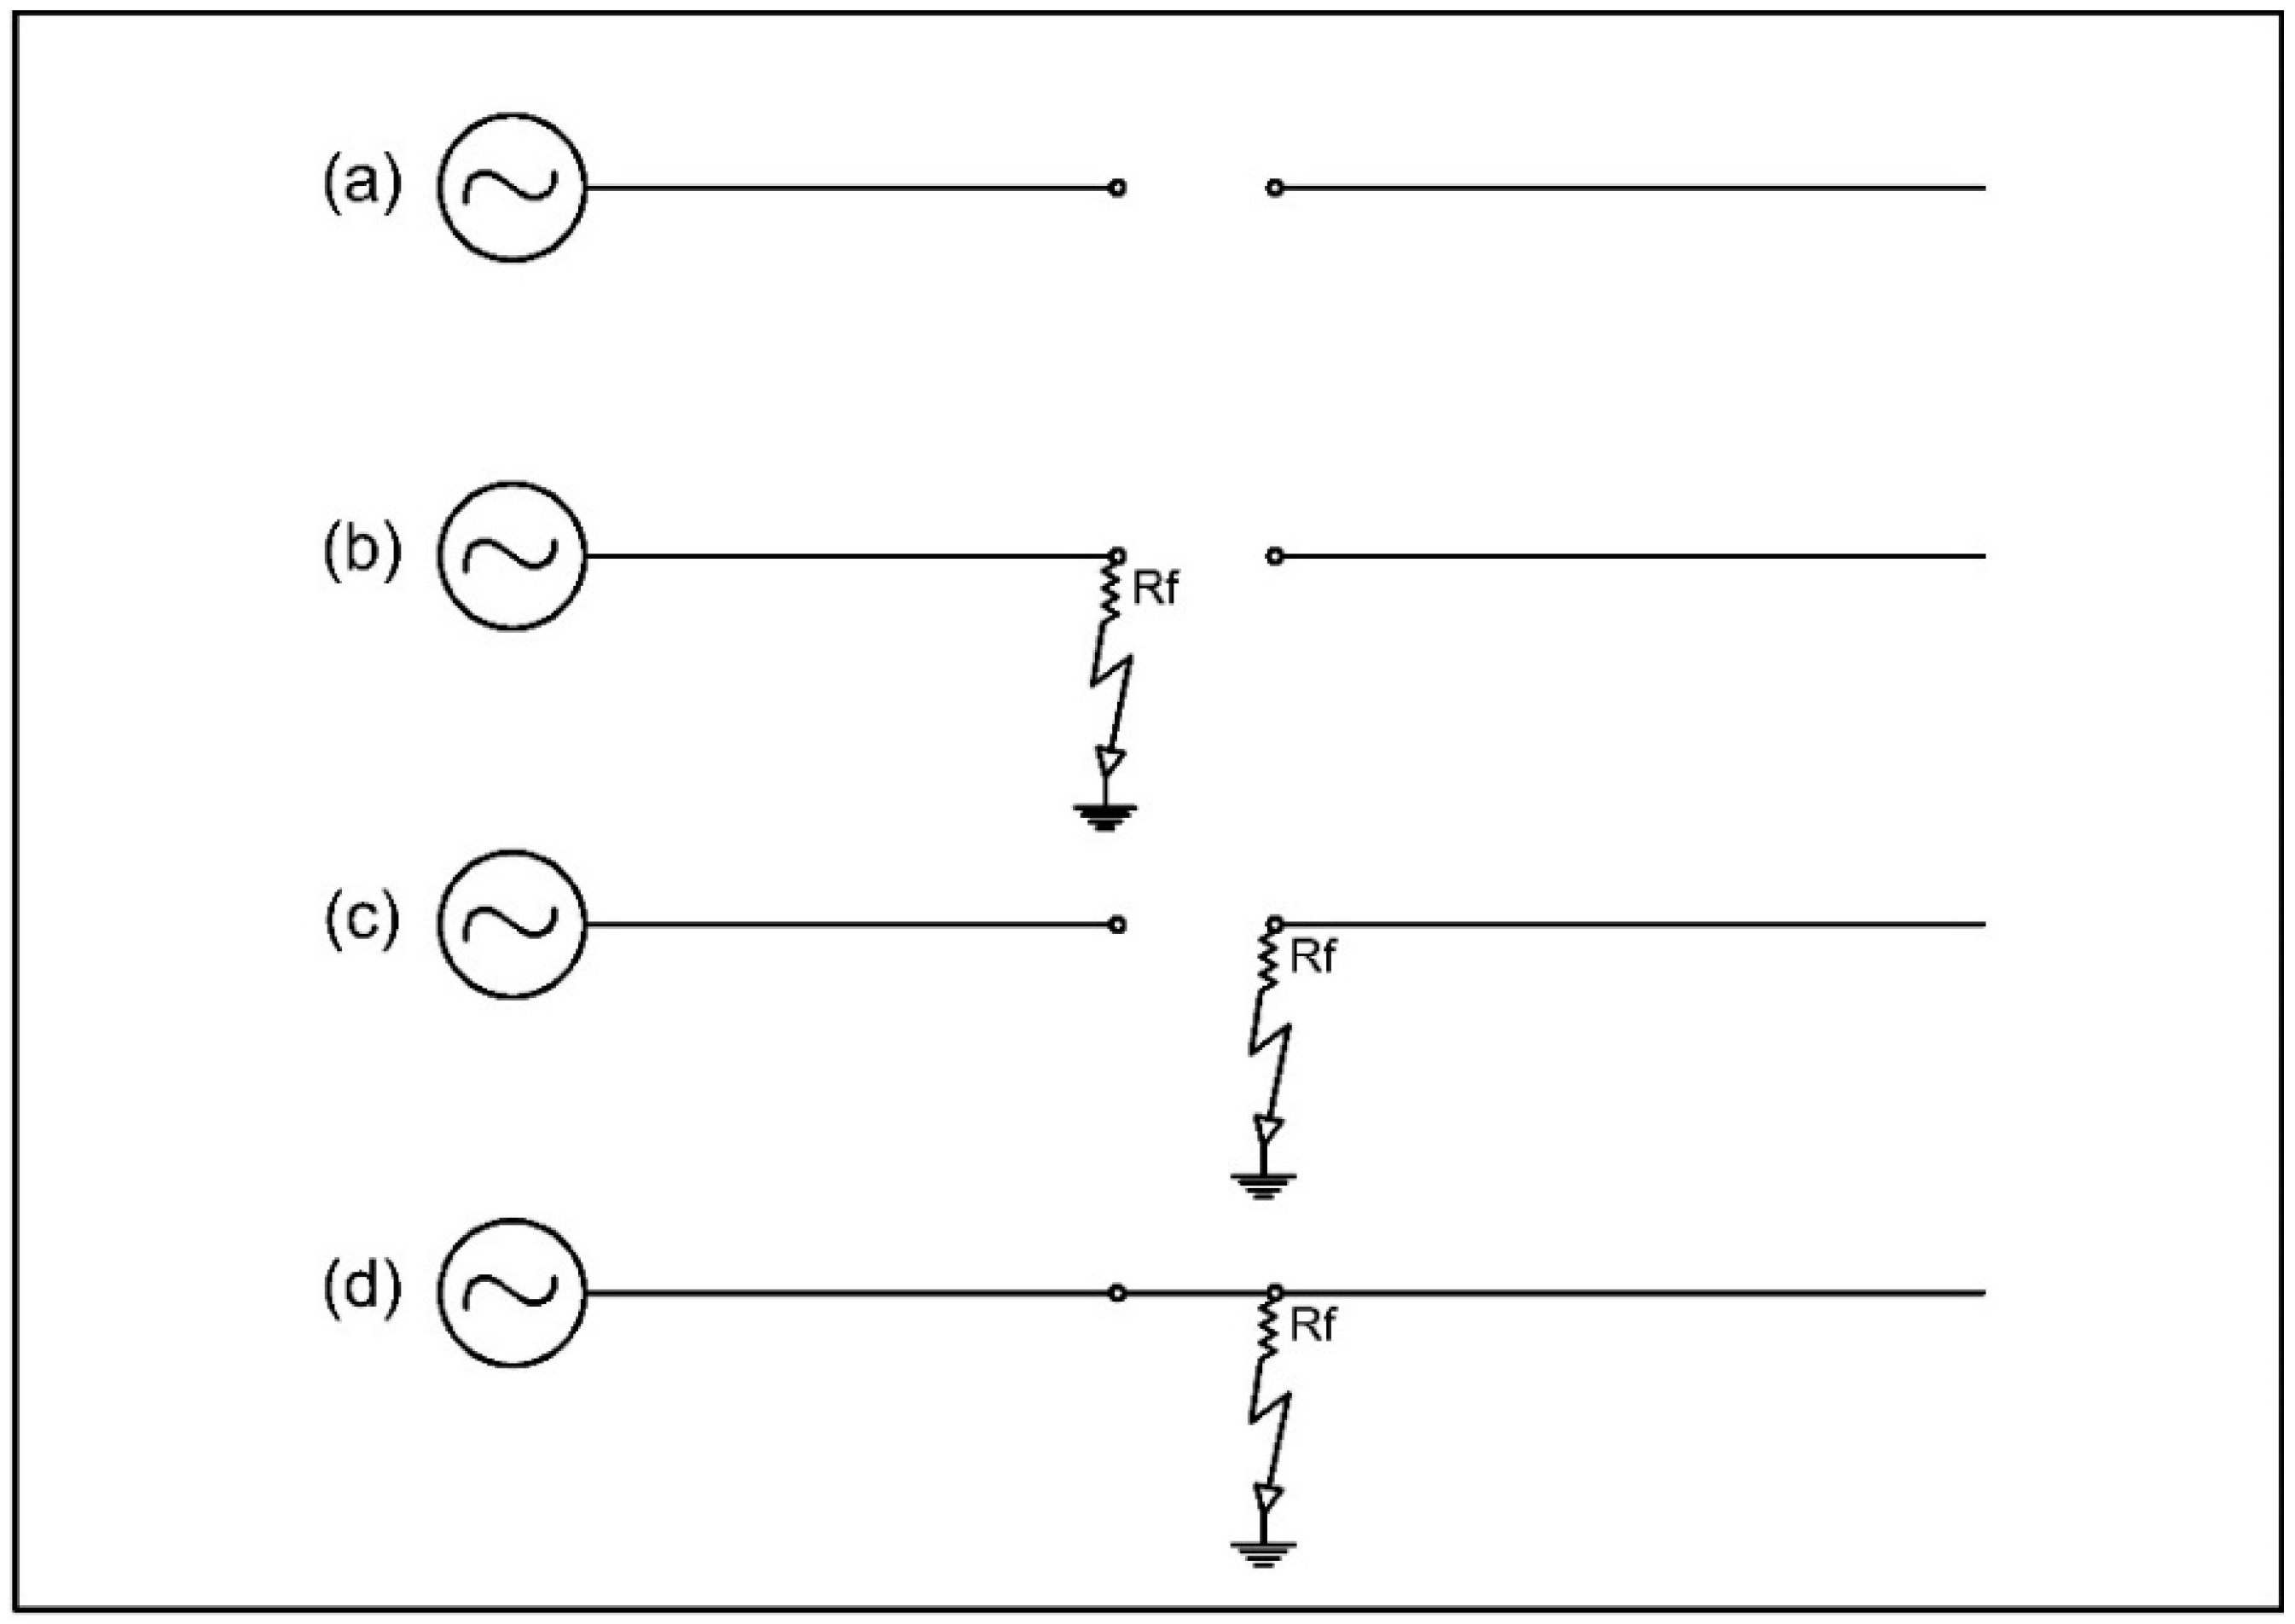
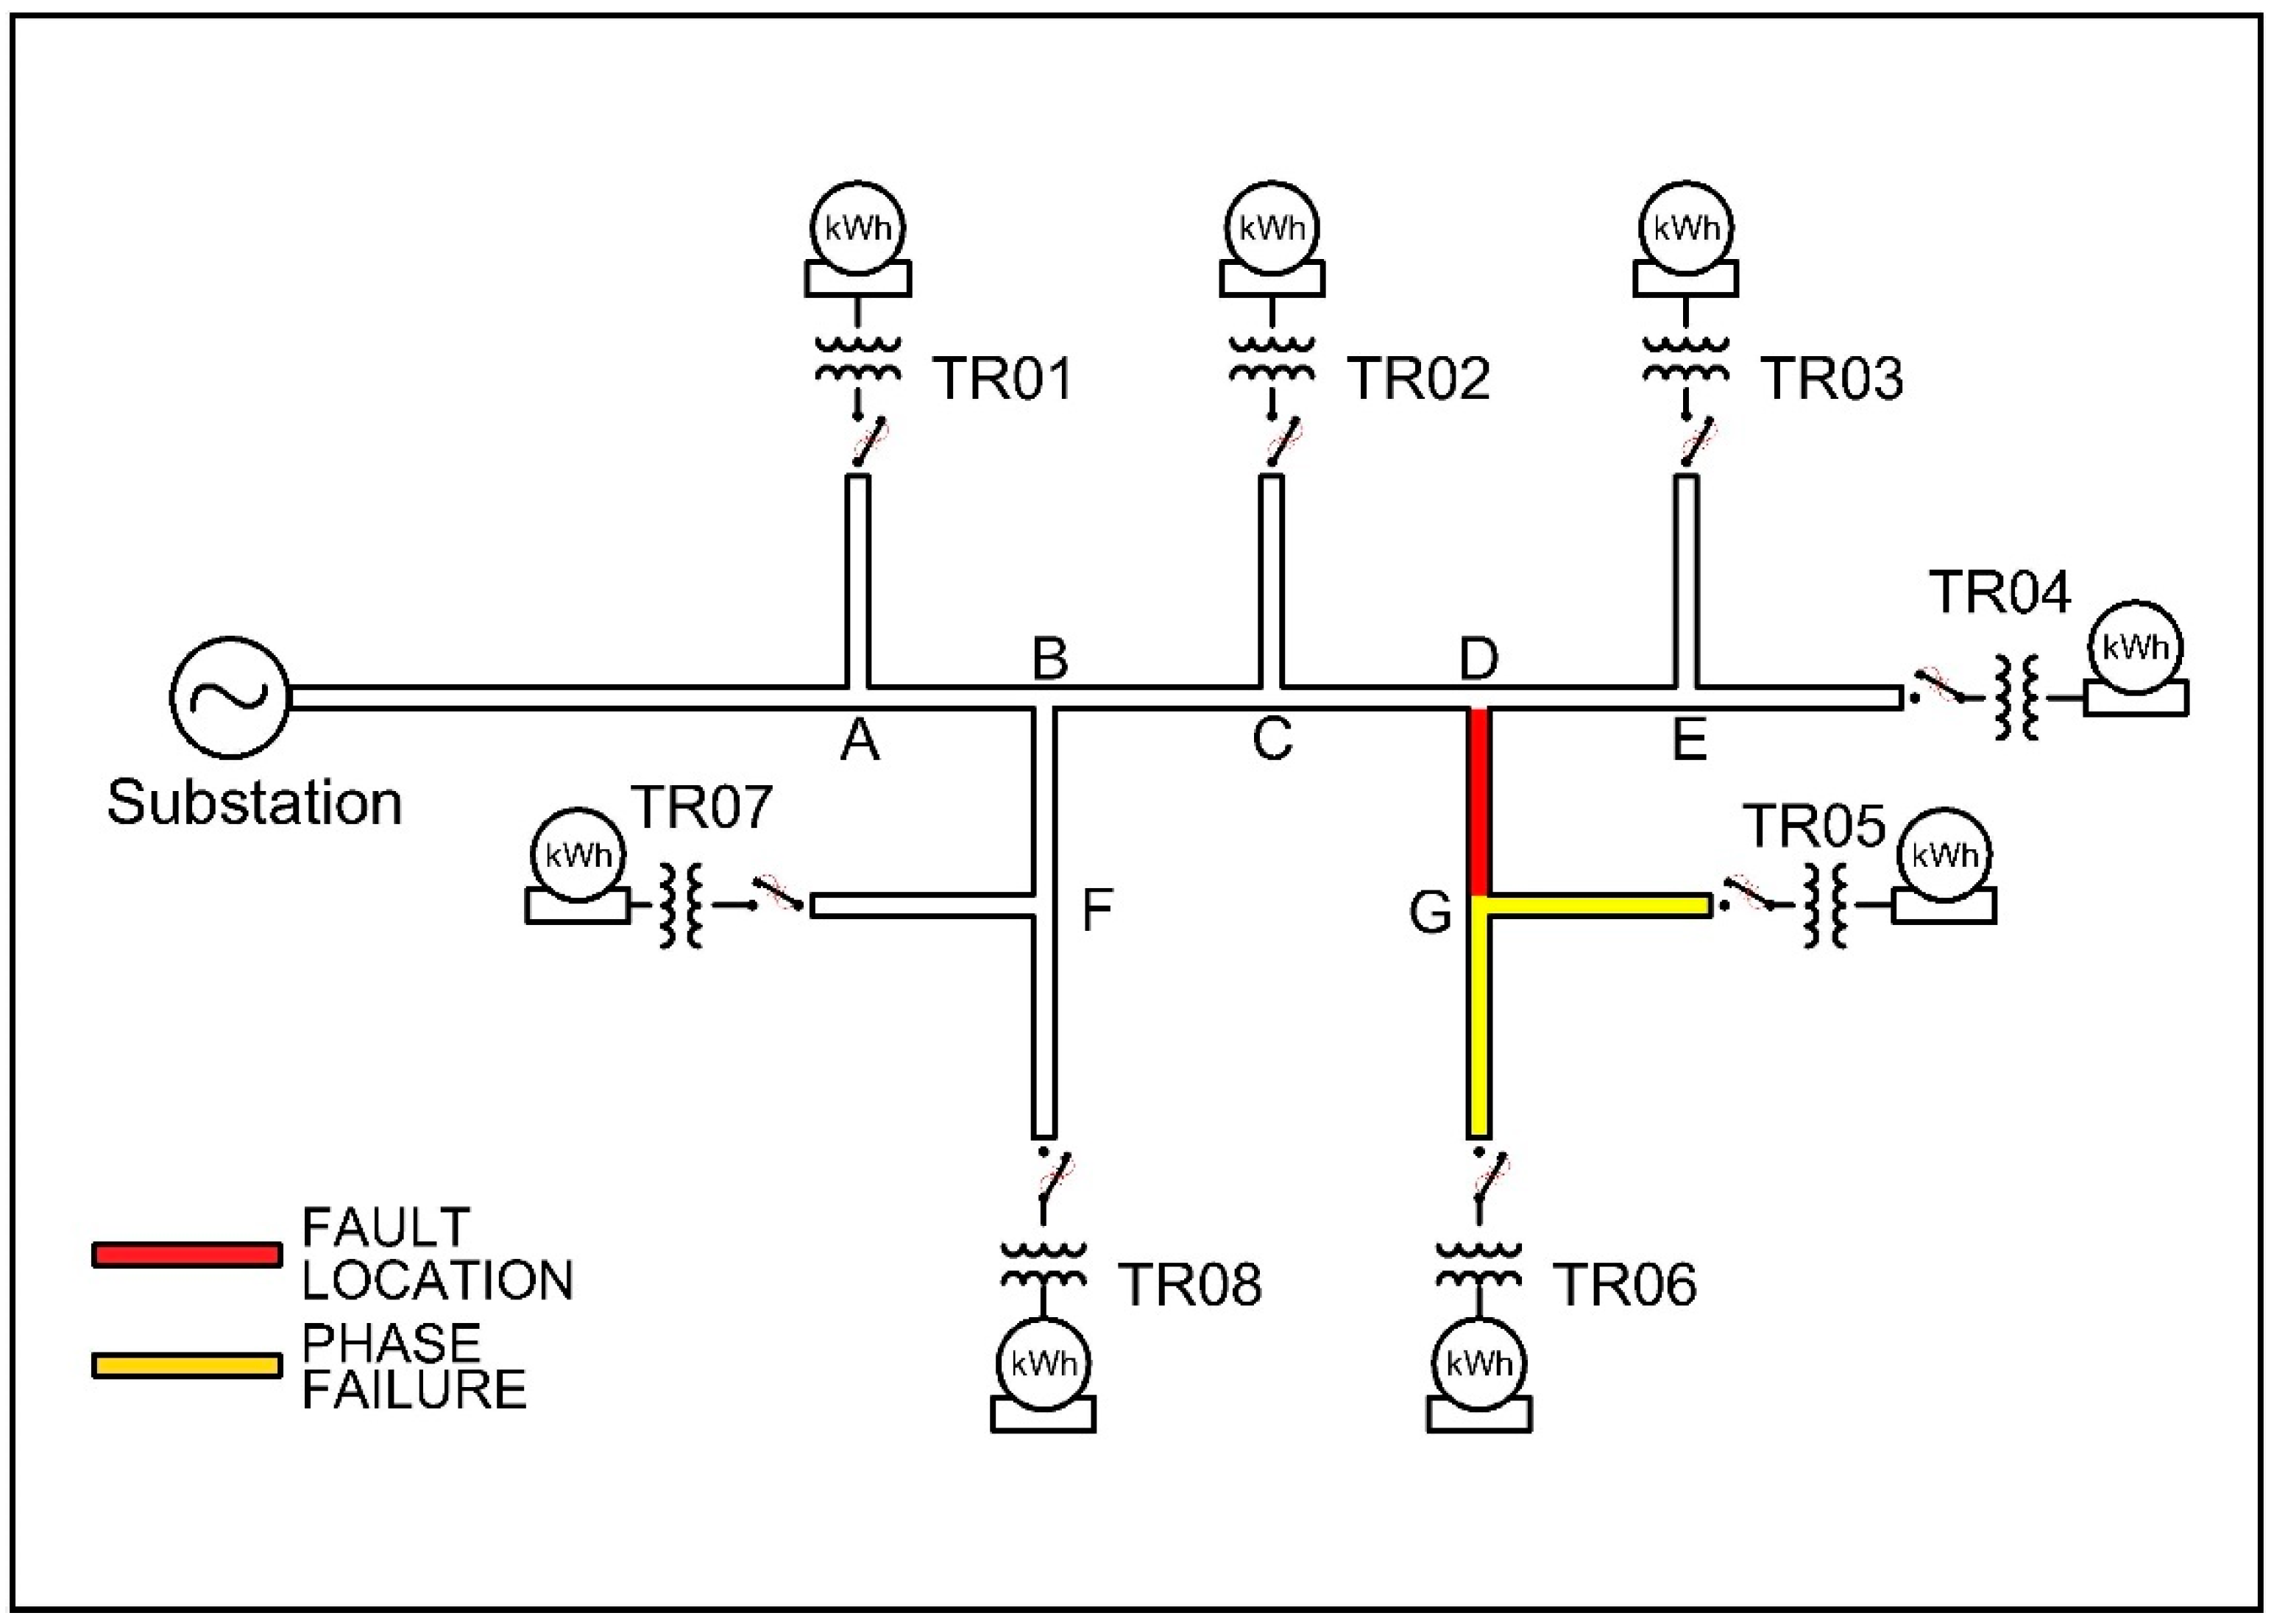
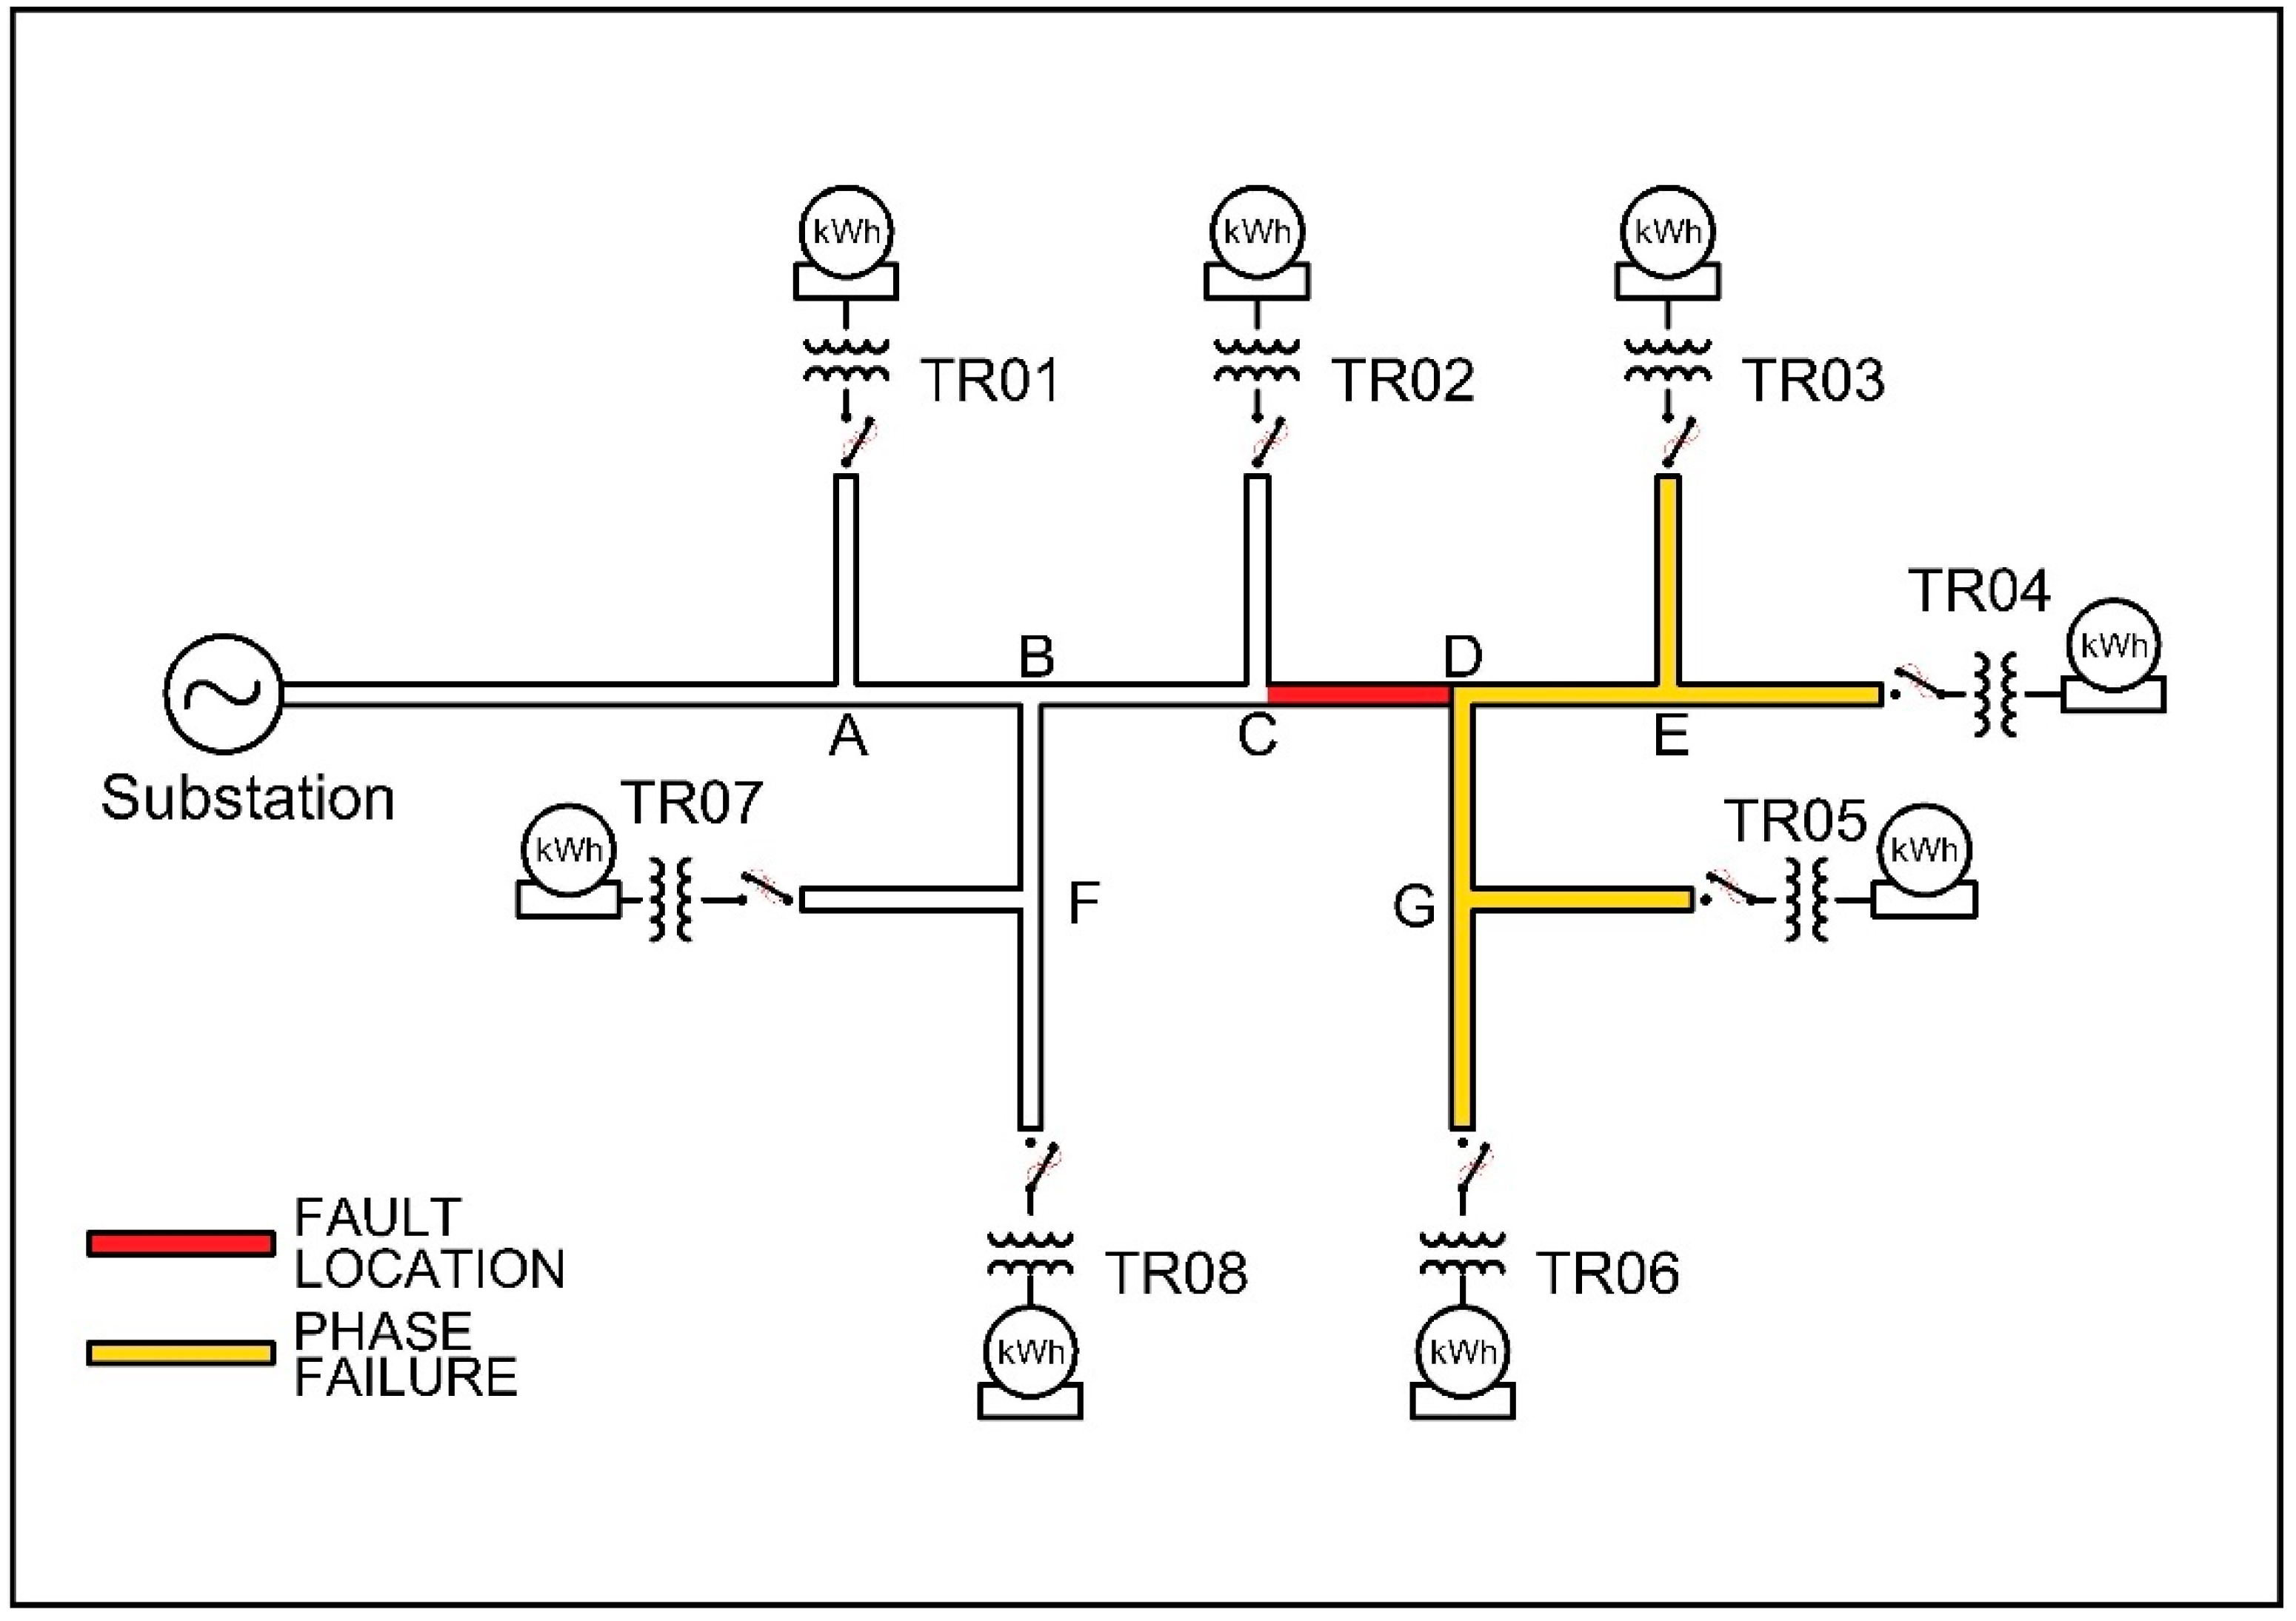
3. Case Study
- Number of opened conductors: 0 to 2;
- Contact or no contact to the ground;
- Contact to the ground on the load-side or the source-side;
- Contact resistance to the ground: 40 Ω or 8000 Ω.
4. Results
4.1. System Operating Under Normal Conditions
4.2. System Operating Under Fault Conditions
4.2.1. Faults on Section DG
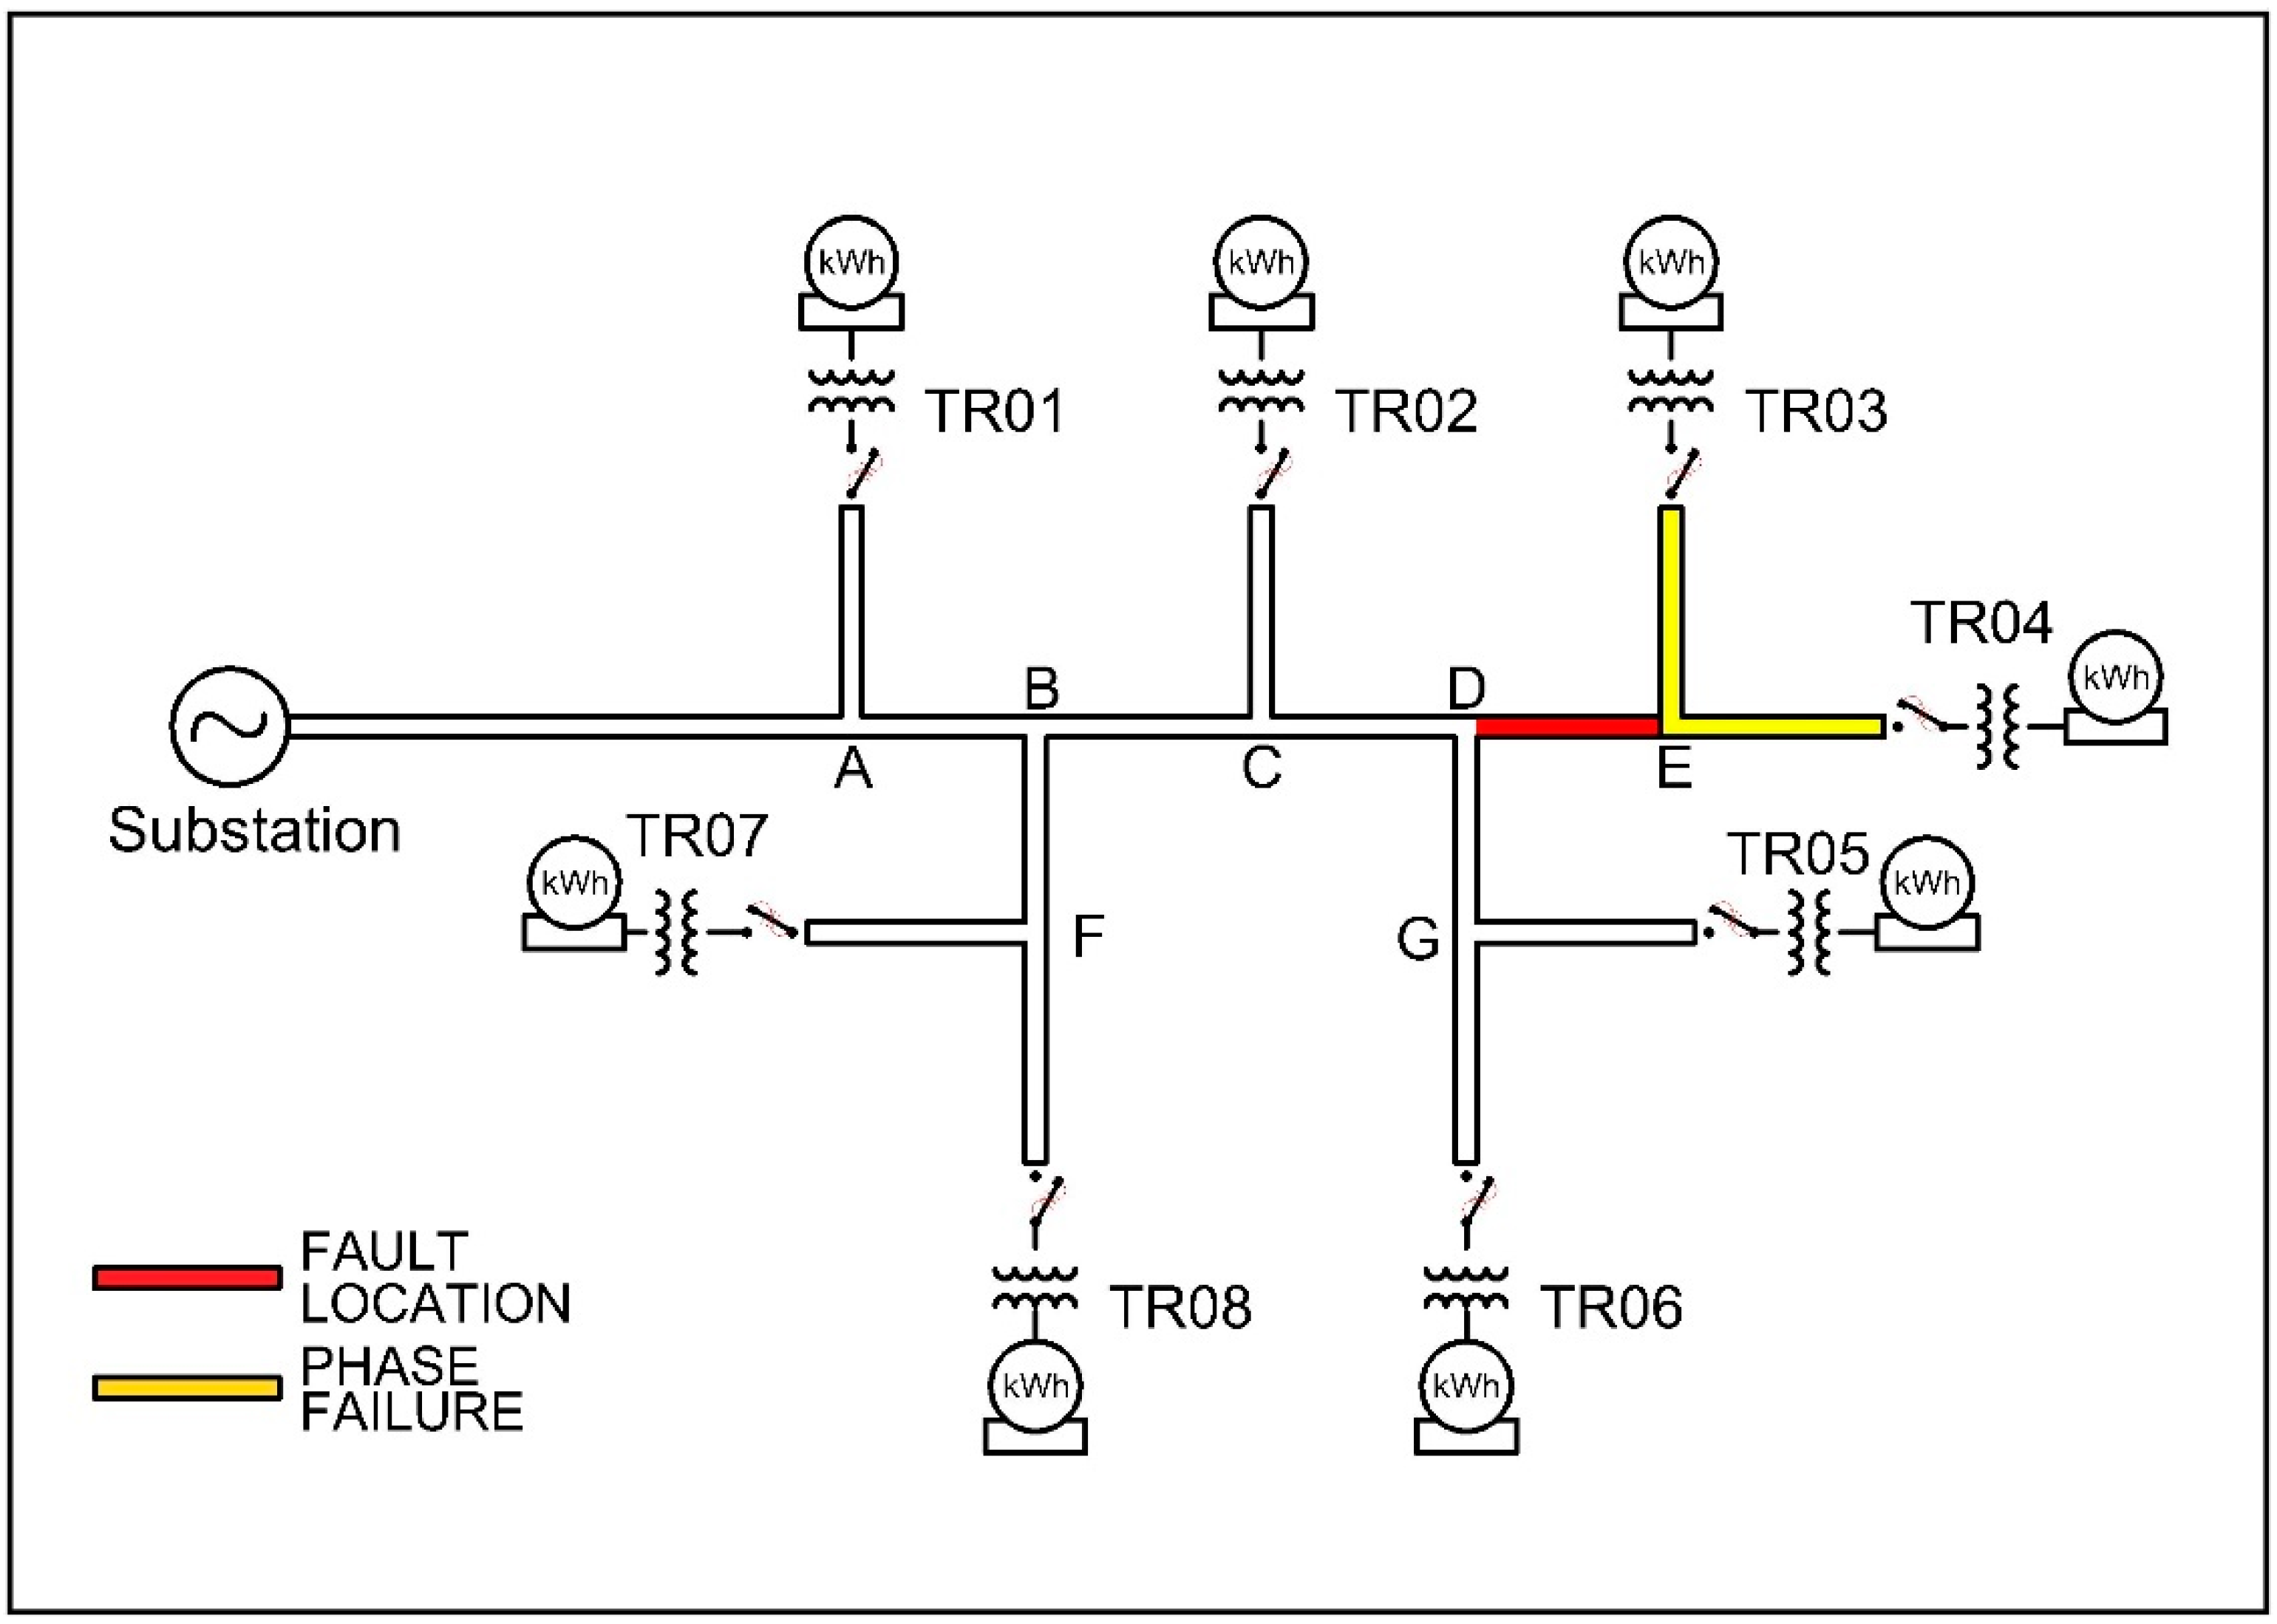
4.2.2. Faults on Section DE
4.2.3. Faults on Section CD
4.2.4. Faults on Section BC
4.3. Summary of Results
5. Conclusions
Author Contributions
Funding
Acknowledgments
Conflicts of Interest
References
- Santos, W.C.; Lopes, F.V.; Brito, N.S.D.; Souza, B.A. High-Impedance Fault Identification on Distribution Networks. IEEE Trans. Power Deliv. 2017, 32, 23–32. [Google Scholar] [CrossRef]
- Hou, D. Detection of High-Impedance Faults in Power Distribution Systems. In Proceedings of the IEEE 2007 Power Systems Conference: Advanced Metering, Protection, Control, Communication, and Distributed Resources, Clemson, SC, USA, 13–16 March 2007; pp. 85–95. [Google Scholar] [CrossRef]
- High Impedance Fault Detection Technology. Available online: http://grouper.ieee.org/groups/td/dist/documents/highz.pdf (accessed on 6 March 2019).
- Garcia-Santander, L.; Bastard, P.; Petit, M.; Gal, I.; Lopez, E.; Opazo, H. Down-Conductor Fault Detection and Location via a Voltage Based Method for Radial Distribution Networks. IEE Proc. Gener. Transm. Distrib. 2005, 152, 180–184. [Google Scholar] [CrossRef]
- Ghaderi, A.; Ginn, H.L.; Mohammadpour, H.A. High Impedance Fault Detection: A Review. Electr. Power Syst. Res. 2017, 143, 376–388. [Google Scholar] [CrossRef]
- Torres, V.; Guardado, J.L.; Ruiz, H.F.; Maximov, S. Modeling and Detection of High Impedance Faults. Int. J. Electr. Power Energy Syst. 2014, 61, 163–172. [Google Scholar] [CrossRef]
- Mitolo, M.; Musca, R.; Zizzo, G. A Cost-Effective Solution for Clearing High-Impedance Ground Faults in Overhead Low-Voltage Lines. IEEE Trans. Ind. Appl. 2019, 55, 1208–1213. [Google Scholar] [CrossRef]
- Emanuel, A.E.; Cyganski, D.; Orr, J.A.; Shiller, S.; Gulachenski, E.M. High Impedance Fault Arcing on Sandy Soil in 15 KV Distribution Feeders: Contributions to the Evaluation of the Low Frequency Spectrum. IEEE Trans. Power Deliv. 1990, 5, 676–686. [Google Scholar] [CrossRef]
- Soheili, A.; Sadeh, J.; Bakhshi, R. Modified FFT Based High Impedance Fault Detection Technique Considering Distribution Non-Linear Loads: Simulation and Experimental Data Analysis. Int. J. Electr. Power Energy Syst. 2018, 94, 124–140. [Google Scholar] [CrossRef]
- Gadanayak, D.A.; Mallick, R.K. Interharmonics Based High Impedance Fault Detection in Distribution Systems Using Maximum Overlap Wavelet Packet Transform and a Modified Empirical Mode Decomposition. Int. J. Electr. Power Energy Syst. 2019, 112, 282–293. [Google Scholar] [CrossRef]
- Elkalashy, N.I.; Lehtonen, M.; Darwish, H.A.; Taalab, A.-M.I.; Izzularab, M.A. A Novel Selectivity Technique for High Impedance Arcing Fault Detection in Compensated MV Networks. Eur. Trans. Electr. Power 2008, 18, 344–363. [Google Scholar] [CrossRef]
- Farias, P.E.; de Morais, A.P.; Rossini, J.P.; Cardoso, G., Jr. Non-Linear High Impedance Fault Distance Estimation in Power Distribution Systems: A Continually Online-Trained Neural Network Approach. Electr. Power Syst. Res. 2018, 157, 20–28. [Google Scholar] [CrossRef]
- Vantuch, T.; Prílepok, M.; Fulneček, J.; Hrbáč, R.; Mišák, S. Towards the Text Compression Based Feature Extraction in High Impedance Fault Detection. Energies 2019, 12, 2148. [Google Scholar] [CrossRef]
- Almalki, M.; Hatziadoniu, C. Classification of Many Abnormal Events in Radial Distribution Feeders Using the Complex Morlet Wavelet and Decision Trees. Energies 2018, 11, 546. [Google Scholar] [CrossRef]
- Baqui, I.; Zamora, I.; Mazón, J.; Buigues, G. High Impedance Fault Detection Methodology Using Wavelet Transform and Artificial Neural Networks. Electr. Power Syst. Res. 2011, 81, 1325–1333. [Google Scholar] [CrossRef]
- Silva, S.; Costa, P.; Gouvea, M.; Lacerda, A.; Alves, F.; Leite, D. High Impedance Fault Detection in Power Distribution Systems Using Wavelet Transform and Evolving Neural Network. Electr. Power Syst. Res. 2018, 154, 474–483. [Google Scholar] [CrossRef]
- Hubana, T.; Saric, M.; Avdaković, S. Approach for Identification and Classification of HIFs in Medium Voltage Distribution Networks. IET Gener. Transm. Distrib. 2018, 12, 1145–1152. [Google Scholar] [CrossRef]
- Veerasamy, V.; Abdul Wahab, N.; Ramachandran, R.; Mansoor, M.; Thirumeni, M.; Lutfi Othman, M. High Impedance Fault Detection in Medium Voltage Distribution Network Using Discrete Wavelet Transform and Adaptive Neuro-Fuzzy Inference System. Energies 2018, 11, 3330. [Google Scholar] [CrossRef]
- Von Meier, A.; Stewart, E.; McEachern, A.; Andersen, M.; Mehrmanesh, L. Precision Micro-Synchrophasors for Distribution Systems: A Summary of Applications. IEEE Trans. Smart Grid 2017, 8, 2926–2936. [Google Scholar] [CrossRef]
- Jamali, S.; Bahmanyar, A.; Bompard, E. Fault Location Method for Distribution Networks Using Smart Meters. Meas. J. Int. Meas. Confed. 2017, 102, 150–157. [Google Scholar] [CrossRef]
- Chakraborty, S.; Das, S. Application of Smart Meters in High Impedance Fault Detection on Distribution Systems. IEEE Trans. Smart Grid 2019, 10, 3465–3473. [Google Scholar] [CrossRef]
- Radhakrishnan, A.; Das, S. Protection Functionalities in Smart Meters to Enhance Distribution System Protection. In Proceedings of the 2018 IEEE Innovative Smart Grid Technologies—Asia (ISGT Asia), Singapore, 22–25 May 2018; pp. 1038–1043. [Google Scholar] [CrossRef]
- Kezunovic, M. Smart Fault Location for Smart Grids. IEEE Trans. Smart Grid 2011, 2, 11–22. [Google Scholar] [CrossRef]
- Senger, E.C.; Kaiser, W.; Santos, J.C.; Burt, P.M.S.; Malagodi, C.V.S. Broken Conductors Protection System Using Carrier Communication. IEEE Trans. Power Deliv. 2000, 15, 525–530. [Google Scholar] [CrossRef]
- Thomas, M.S.; Bhaskar, N.; Prakash, A. Voltage Based Detection Method for High Impedance Fault in a Distribution System. J. Inst. Eng. Ser. B 2016, 97, 413–423. [Google Scholar] [CrossRef]
- Al-Ghannam, S.H.; Khan, Y.; Ahmad, U.; Malik, N.H.; Al-Arainy, A.A.; Al-Shahrani, B.S. Development of Open (Broken) Conductor Detection System for High Resistivity Areas. In Proceedings of the IEEE2017 Saudi Arabia Smart Grid (SASG), Jeddah, Saudi Arabia, 12–14 December 2017; pp. 1–8. [Google Scholar] [CrossRef]
- Abhijith, U.P.; Akhil, K.; Amal, K.; Salam, A.; Shabeeb Backer, T.K.; Sangeetha, K. High Impedance Fault Detectors for Radial Secondary Distributors. In Proceedings of the IEEE 2015 International Conference on Control Communication & Computing India (ICCC), Trivandrum, India, 19–21 November 2015; pp. 314–318. [Google Scholar] [CrossRef]
- Vieira, F.L.; Carvalho Filho, J.M.; Silveira, P.M.; Guerrero, C.A.V.; Leite, M.P. High Impedance Fault Detection and Location in Distribution Networks Using Smart Meters. In Proceedings of the IEEE 18th International Conference on Harmonics and Quality of Power (ICHQP), Ljubljana, Slovenia, 13–16 May 2018; pp. 1–6. [Google Scholar] [CrossRef]
- International Electrotechnical Commission (IEC). Standard 61000-4-30: Testing and Measurement Techniques—Power Quality Measurement Methods, 3rd ed.; IEC: Geneva, Switzerland, 2015. [Google Scholar]
- Olczykowski, Z.; Wasowski, A. Methods of Voltage Unbalance Estimation in Electric Power Networks. Electr. Power Qual. Util. 2006, 12, 71–76. [Google Scholar]
- Garcia, D.C.; Filho, A.L.F.; Oliveira, M.A.G.; Fernandes, O.A.; do Nascimento, F.A. Voltage Unbalance Numerical Evaluation and Minimization. Electr. Power Syst. Res. 2009, 79, 1441–1445. [Google Scholar] [CrossRef]
- Seiphetlho, T.E.; Rens, A.P.J. On the Assessment of Voltage Unbalance. In Proceedings of the IEEE 14th International Conference on Harmonics and Quality of Power—ICHQP 2010, Bergamo, Italy, 26–29 September 2010; pp. 1–6. [Google Scholar] [CrossRef]
- Arghavani, H.; Peyravi, M. Unbalanced Current-Based Tariff. CIRED Open Access Proc. J. 2017, 2017, 883–887. [Google Scholar] [CrossRef]
- IEEE Power & Energy Society. IEEE Std 1159: Recommended Practice for Monitoring Electric Power Quality; IEEE: New York, NY, USA, 2009. [Google Scholar] [CrossRef]
- CENELEC TC 8X. Standard EN 50160: Voltage Characteristics of Electricity Supplied by Public Electricity Networks; CENELEC: Brussels, Belgium, 2010. [Google Scholar]


| Source Equivalent | 13.8 kV | X/R = 8 | SCC = 120 MVA | |
|---|---|---|---|---|
| Feeder Impedance | ||||
| Positive sequence (Z1) | 1.6118 + j0.4637 Ω/km | |||
| Zero sequence (Z0) | 4.8354 + j1.3911 Ω/km | |||
| Transformers (∆-Y) | ||||
| Nominal power | 45 kVA | |||
| Winding 1 (∆) | 13.8 kV | 0.001 + j15.08 Ω | ||
| Winding 2 (Y) | 220 V | 0.001 + j15.08 Ω | ||
| Load (LV-side) | ||||
| Phase | A | B | C | |
| Current (A) | 60 | 85 | 45 | |
| Power factor (lagging) | 0.48 | 0.20 | 0.77 | |
| Transformer | VAB (V) | VBC (V) | VCA (V) |
|---|---|---|---|
| TR1 | 208.5 | 212.4 | 213.1 |
| TR2 | 173.1 | 189.5 | 28.2 |
| Phase 1 | Transformer | |||||||
|---|---|---|---|---|---|---|---|---|
| TR1 | TR2 | TR3 | TR4 | TR5 | TR6 | TR7 | TR8 | |
| A | 59.2 (−61.4°) | 59.2 (−1.4°) | 59.2 (−61.4°) | 59.2 (−61.4°) | 45.4 (−40.0°) | 59.2 (−61.4°) | 59.2 (−61.4°) | 45.4 (−40.0°) |
| B | 84.6 (−200.0°) | 45.4 (160.0°) | 84.6 (−200.0°) | 59.2 (−181.4°) | 84.6 (−200.0°) | 84.6 (−200.0°) | 45.4 (−160.0°) | 84.6 (−200.0°) |
| C | 45.4 (80.0°) | 84.6 (40.0°) | 59.2 (58.6°) | 84.6 (40.0°) | 59.2 (58.6°) | 45.4 (80.0°) | 84.6 (40.0°) | 59.2 (58.6°) |
| - | Current Unbalance | |||||||
| 28.7% | 26.6% | 17.1% | 17.1% | 26.6% | 28.7% | 26.6% | 26.6% | |
| Case | Fault Type 1 | Fault Description | Fault Condition | Contact Resistance |
|---|---|---|---|---|
| 1 | (a) | One broken conductor | Hanging in the air | - |
| 2 | (b) | One broken conductor | Source-side contact | 40 Ω |
| 3 | (b) | One broken conductor | Source-side contact | 8000 Ω |
| 4 | (c) | One broken conductor | Load-side contact | 40 Ω |
| 5 | (c) | One broken conductor | Load-side contact | 8000 Ω |
| 6 | (a) | Two broken conductors | Hanging in the air | - |
| 7 | (d) | No broken conductor | Shunt | 40 Ω |
| 8 | (d) | No broken conductor | Shunt | 8000 Ω |
| Voltage Unbalance Factor—K% Faults on Section DG | |||||||||
|---|---|---|---|---|---|---|---|---|---|
| Cases | No Fault | One Broken Conductor 1 | Two 2 | Shunt | |||||
| Meter Position | 0 | 1 | 2 | 3 | 4 | 5 | 6 | 7 | 8 |
| Unb. 3 | Air | S-40 Ω | S-8k Ω | L-40 Ω | L-8k Ω | Air | 40 Ω | 8k Ω | |
| TR01 | 1.16 | 1.18 | 2.08 | 1.18 | 1.18 | 1.18 | 1.15 | 2.08 | 1.16 |
| TR02 | 1.02 | 0.98 | 3.91 | 0.98 | 0.98 | 0.98 | 1.05 | 3.95 | 1.02 |
| TR03 | 0.80 | 0.88 | 4.33 | 0.86 | 0.87 | 0.87 | 0.78 | 4.36 | 0.78 |
| TR04 | 0.70 | 0.67 | 4.57 | 0.66 | 0.67 | 0.67 | 0.74 | 4.61 | 0.69 |
| TR05 | 1.10 | 99.70 | 99.70 | 99.70 | 49.21 | 71.90 | IND 4 | 4.96 | 1.07 |
| TR06 | 1.20 | 100.30 | 100.30 | 100.30 | 49.58 | 72.28 | IND | 5.63 | 1.19 |
| TR07 | 1.03 | 1.00 | 2.82 | 1.00 | 1.00 | 1.00 | 1.05 | 2.85 | 1.03 |
| TR08 | 1.10 | 1.14 | 1.82 | 1.13 | 1.14 | 1.14 | 1.10 | 1.83 | 1.09 |
| Voltage Unbalance Factor K% Faults on Section DE | |||||||||
|---|---|---|---|---|---|---|---|---|---|
| Cases | No Fault | One Broken Conductor 1 | Two 2 | Shunt | |||||
| Meter Position | 0 | 1 | 2 | 3 | 4 | 5 | 6 | 7 | 8 |
| Unb. 3 | Air | S-40 Ω | S-8k Ω | L-40 Ω | L-8k Ω | Air | 40 Ω | 8k Ω | |
| TR01 | 1.16 | 1.19 | 2.08 | 1.19 | 1.19 | 1.19 | 1.19 | 2.08 | 1.16 |
| TR02 | 1.02 | 0.96 | 3.92 | 0.96 | 0.97 | 0.96 | 0.96 | 3.95 | 1.02 |
| TR03 | 0.80 | 89.82 | 89.82 | 89.82 | 49.50 | 69.33 | IND 4 | 5.46 | 0.78 |
| TR04 | 0.70 | 89.61 | 89.61 | 89.61 | 49.91 | 69.68 | IND | 5.76 | 0.69 |
| TR05 | 1.10 | 1.16 | 3.84 | 1.14 | 1.16 | 1.16 | 1.16 | 3.85 | 1.08 |
| TR06 | 1.20 | 1.28 | 4.57 | 1.28 | 1.28 | 1.28 | 1.28 | 4.57 | 1.19 |
| TR07 | 1.03 | 0.99 | 2.83 | 0.98 | 0.99 | 0.99 | 0.99 | 2.85 | 1.03 |
| TR08 | 1.10 | 1.14 | 1.84 | 1.13 | 1.14 | 1.14 | 1.14 | 1.83 | 1.09 |
| Voltage Unbalance Factor—K% Faults on Section CD | |||||||||
|---|---|---|---|---|---|---|---|---|---|
| Cases | No Fault | One Broken Conductor 1 | Two 2 | Shunt | |||||
| Meter Position | 0 | 1 | 2 | 3 | 4 | 5 | 6 | 7 | 8 |
| Unb. 3 | Air | S-40 Ω | S-8k Ω | L-40 Ω | L-8k Ω | Air | 40 Ω | 8k Ω | |
| TR01 | 1.16 | 1.21 | 2.17 | 1.21 | 1.21 | 1.21 | 1.14 | 2.16 | 1.16 |
| TR02 | 1.02 | 0.91 | 4.07 | 0.91 | 0.92 | 0.92 | 1.06 | 4.14 | 1.02 |
| TR03 | 0.80 | 93.61 | 93.61 | 93.61 | 49.61 | 79.95 | IND 4 | 4.64 | 0.78 |
| TR04 | 0.70 | 93.26 | 93.26 | 93.26 | 50.02 | 80.03 | IND | 4.88 | 0.69 |
| TR05 | 1.10 | 93.29 | 93.29 | 93.29 | 49.24 | 79.62 | IND | 4.13 | 1.08 |
| TR06 | 1.20 | 93.85 | 93.85 | 93.85 | 49.61 | 80.05 | IND | 4.85 | 1.19 |
| TR07 | 1.03 | 0.96 | 2.92 | 0.95 | 0.96 | 0.96 | 1.06 | 2.98 | 1.03 |
| TR08 | 1.10 | 1.18 | 1.97 | 1.17 | 1.17 | 1.18 | 1.09 | 1.98 | 1.09 |
| Voltage Unbalance Factor—K% Faults on Section BC | |||||||||
|---|---|---|---|---|---|---|---|---|---|
| Cases | No Fault | One Broken Conductor 1 | Two 2 | Shunt | |||||
| Meter Position | 0 | 1 | 2 | 3 | 4 | 5 | 6 | 7 | 8 |
| Unb. 3 | Air | S-40 Ω | S-8k Ω | L-40 Ω | L-8k Ω | Air | 40 Ω | 8k Ω | |
| TR01 | 1.16 | 1.23 | 2.27 | 1.23 | 1.22 | 1.23 | 1.15 | 2.26 | 1.16 |
| TR02 | 1.02 | 90.54 | 90.54 | 90.54 | 50.39 | 80.77 | IND 4 | 4.36 | 1.02 |
| TR03 | 0.80 | 90.65 | 90.65 | 90.65 | 49.59 | 80.46 | IND | 3.77 | 0.79 |
| TR04 | 0.70 | 90.40 | 90.40 | 90.40 | 50.01 | 80.53 | IND | 3.92 | 0.69 |
| TR05 | 1.10 | 90.33 | 90.33 | 90.33 | 49.23 | 80.13 | IND | 3.25 | 1.08 |
| TR06 | 1.20 | 90.86 | 90.86 | 90.86 | 49.60 | 80.56 | IND | 4.03 | 1.19 |
| TR07 | 1.03 | 0.93 | 3.06 | 0.93 | 0.94 | 0.93 | 1.05 | 3.12 | 1.03 |
| TR08 | 1.10 | 1.20 | 2.14 | 1.18 | 1.19 | 1.19 | 1.08 | 2.15 | 1.09 |
| Case | Fault Detected and Located Correctly? | ||||
|---|---|---|---|---|---|
| DG 1 | DE | CD | BC | ||
| 1 | One broken conductor, air 2 | YES | YES | YES | YES |
| 2 | One broken conductor, S 3, 40 Ω | YES | YES | YES | YES |
| 3 | One broken conductor, S, 8k Ω | YES | YES | YES | YES |
| 4 | One broken conductor, L, 40 Ω | YES | YES | YES | YES |
| 5 | One broken conductor, L, 8k Ω | YES | YES | YES | YES |
| 6 | Two broken conductors, air | IND 4 | IND | IND | IND |
| 7 | Shunt, 40 Ω | NO | NO | NO | NO |
| 8 | Shunt, 8k Ω | NO | NO | NO | NO |
© 2019 by the authors. Licensee MDPI, Basel, Switzerland. This article is an open access article distributed under the terms and conditions of the Creative Commons Attribution (CC BY) license (http://creativecommons.org/licenses/by/4.0/).
Share and Cite
Vieira, F.L.; Santos, P.H.M.; Carvalho Filho, J.M.; Leborgne, R.C.; Leite, M.P. A Voltage-Based Approach for Series High Impedance Fault Detection and Location in Distribution Systems Using Smart Meters. Energies 2019, 12, 3022. https://doi.org/10.3390/en12153022
Vieira FL, Santos PHM, Carvalho Filho JM, Leborgne RC, Leite MP. A Voltage-Based Approach for Series High Impedance Fault Detection and Location in Distribution Systems Using Smart Meters. Energies. 2019; 12(15):3022. https://doi.org/10.3390/en12153022
Chicago/Turabian StyleVieira, Francinei L., Pedro H. M. Santos, José M. Carvalho Filho, Roberto C. Leborgne, and Marino P. Leite. 2019. "A Voltage-Based Approach for Series High Impedance Fault Detection and Location in Distribution Systems Using Smart Meters" Energies 12, no. 15: 3022. https://doi.org/10.3390/en12153022
APA StyleVieira, F. L., Santos, P. H. M., Carvalho Filho, J. M., Leborgne, R. C., & Leite, M. P. (2019). A Voltage-Based Approach for Series High Impedance Fault Detection and Location in Distribution Systems Using Smart Meters. Energies, 12(15), 3022. https://doi.org/10.3390/en12153022