1. Introduction
Today’s sheet industry demands perfect flatness and outstanding surface quality of both hot- and cold-rolled metal strips. Two kinds of machines, based on a similar forming process, help to achieve these quality requirements: tension levelers and scale breakers [
1]. The tension leveler, also called the straightening section, presents a complex multi-motor drive system in which the machines are mutually coupled with metal strips having elastic properties [
2,
3,
4]. The leveler is normally located at the exit of the strip processing line. To ensure flatness of the metal strip, it has to be exposed to high tension. This process is called tension leveling [
5]. It results in flattening of the metal sheet by controlled flexing, usually when passing over an adjustable roll at high tension [
6]. Using tension leveling, all particles of the metal strip are pulled beyond the elastic limit (i.e., beyond the yield point). After the strip passes the tension leveler, it is completely flat and relatively free of internal stresses.
A typical tension leveler consists of two tension roll units (often called bridles): the input and the output ones. Each unit is equipped with several tension rolls. By connecting several tension rolls in series, it is possible to achieve a considerably large difference between tensions in the strip input to and output from the tension leveler [
7], and the tension rolls function as a “tension amplifier” here.
The tension in the strip passing a roll depends on the force transferred from the roll to the strip. The amount of the force depends on the friction between the strip surface and the tension roll and on the wrap angle corresponding to the area of mutual contact surface between the strip and tension roll. All these relationships are described by the well-known, so-called capstan equation [
8] or the strip friction equation [
9]. This equation is widely used to analyze the mechanical behavior of strips in which the contacts have a circular profiled surface (i.e., capstan or roll, respectively).
The proper control algorithm for tension distribution among the bridle rolls must ensure precise elongation control of the strip and balanced loading of the roll drives. The following approaches are used for strip tension control: indirect tension control by speed difference of the rolls [
10], speed with torque limit tension indirect control [
11,
12], tension control by utilization of tension sensors [
13,
14,
15,
16,
17], and sensorless tension control [
18,
19,
20,
21]. A detailed review of all these control approaches can be found in [
22].
Several disturbances and nonlinearities affect the tension control system. For this reason, selecting the right type of controller for the system and tuning the controller is not a straightforward operation [
23]. In practice, tension control systems are subject to process uncertainties, such as eccentricity of the rolls, misalignment of rolls, or sliding between the strip and rolls [
10]. The strip may only slip over a roll on a small portion of the contact surface, while “sticking” on the remaining portion of the contact surface, depending on the amount of the torque applied to the roll. The phenomenon of strip sliding occurs in the area where the strip exits the roll surface. For the leveler, it is recommended to maintain a ratio of output to input tension of approximately 2 [
12]. Precise load sharing among the bridle rolls (and, in fact, among individual motors of the multi-motor drive system) presents a complex task based on the physical relations and positional arrangement of the bridle rolls.
Industrial multi-motor drives like those in conveyors, separator drums, cement kilns, or printing machines are required to work together to share the load. Each motor must contribute to the proportional sharing of power to the driven load. Currently, these load-sharing drives usually use one of the following algorithms: droop, speed trim follower, or torque follower, also known as master–slave [
24,
25,
26,
27]. For the last case, the ratio of load sharing can be adjusted so that each motor shares a proportional amount of load under all conditions. However, this is not sufficient in a tension leveler because of the high differences in the tension values of particular leveler drives and their various power ratings.
To our best knowledge, proper tension distribution among the drives in a bridle section with respect to its physical limits which also takes into consideration the wrap angle or maximum torque of the drive has not yet been researched.
Therefore, the algorithm presented in this article is not for tension control itself but particularly for the proper distribution of the tensions among the drives in a strip processing line. It ensures tension distribution among the particular drives of the leveler while also preserving the conditions of a constant ratio between the input and output tension.
This paper is organized as follows.
Section 2 explains the distribution of the force in the strip along the contact area between the strip and a driving roll. This phenomenon is described in
Section 3 for the case of a four-roll leveler section. Based on the derived equations,
Section 4 presents the principle of the novel tension distribution algorithm, which is generalized in
Section 5 for any general arrangement of the bridle rolls. Simulation results are presented in
Section 6, and experimental results taken from a real continuous line are shown in
Section 7. Finally, the overall work is concluded in
Section 8.
2. Static Properties of the Moving Strip
The condition of the tension distribution in a strip within the contact surface with a roll depends on the roll and strip material, as well as their surface quality. Tangential forces act on each roll element of the strip, and their sum is equal to the difference between the tensions of the input and output strip of the roll around which the strip is wrapped. Due to differences in the tensile stresses in the subsequent section
σi and the previous section
σi−1 and according to Hook’s Law, the material elongates along the surface of the roll [
28].
If there is change in neither tension nor angular speed in the steady state (
Figure 1), the whole contact surface between the roll and strip (i.e., wrap angle
α) is divided into two parts:
β—the wrap angle of the area with adhesion friction. There is no movement of the strip elements along the surface of the roll. This phenomenon is always at the input site, where the strip enters contact with the roll surface.
γ—the wrap angle of the area with sliding friction. The strip is sliding along the surface of the roll. Elastic deformation of the strip occurs here. This phenomenon is always on the exit site of the roll where the strip leaves the roll surface.
The sliding friction area is optimal when
γ ≤
α; otherwise, a sliding phenomenon occurs. The ratio of the tensile stresses (i.e., factor
eµγ) is calculated as:
where
σ12 is the tensile stress in the subsequent section,
σ01 is the tensile stress in the previous section of the tension roll, and
μ is the sliding friction coefficient.
During the force transmission from the roll to the strip, the ratio in Equation (1) should be respected; otherwise, a sliding effect will occur [
29]. The ratio of tensile forces at the two ends of the strip wound on the roll is the value of the exponential function on the product of the kinetic friction coefficient and the wrap angle. For the known factor
eµγ and tension stress value
σ01 in the previous section, the maximum value of the output tension stress
σ12 of the next section is calculated based on Equation (1).
In general, a problem of tension distribution between several tension rolls is based on the presumption that for each tension roll the value of factor
eμγ and its maximum admissible value are known together with the stress on the input and output strip. If the area of the cross section of the strip
S is constant and the tensile stress is calculated as
σ = F/S [N/mm
2; N, mm
2], where
F is the tension in the strip, Equation (1) can be rewritten as follows:
where
F12 is the tension in the strip on the input side of the roll and
F12 is the tension on its output side.
Equation (2) defines a condition for the tension distribution. It is defined as
where
eµα is calculated based on known values of the sliding coefficient
μ and wrap angle
α.
3. Tension Distribution between the Tension Rolls
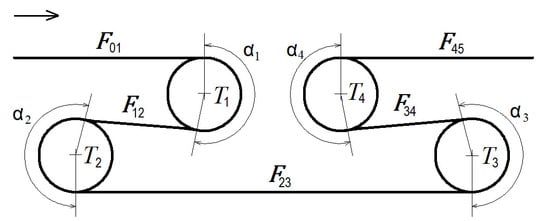
In this section, tension distribution is explained using the example of a tension leveler consisting of four rolls. This is located, e.g., in the entry section of a continuous line for processing strip materials.
Figure 2 shows such an entry section of the line. The tension of the strip passing the roll is increased by the amount of the tension corresponding to the motor torque.
The difference between the output tension
F45 and the input tension
F01 of the leveler section equals the sum of the tension contributions
FMi (
i = 1, 2, 3, 4) of each drive in the leveler:
Equation (4) can be rewritten using motor torques
τ1–
τ4 and the radius
R of the rolls (which is equal for all rolls in the leveler):
The increment of tension produced by the
ith roll,
Ti, is the tension contribution of the
ith drive corresponding to the torque developed by the motor. Based on this, Equation (5), valid for the arrangement of tension rolls shown in
Figure 2, can be rewritten as follows:
Now, the tension distribution problem can be formulated as follows:
The unknown tension contributions Ti, i = 1, 2, …, have to be found, and
Their values must satisfy the condition prescribed by Equation (3).
The
ith drive contribution to the tension is calculated as
Ti =
Fi,i+1 −
Fi,i−1. For all drives, the equations can be written as follows:
By substituting Equations (7)–(10) into Equation (6) and making final rearrangements, the resultant tension is
The majority of the practical implementations of tension distribution algorithms in tension levelers are based on the above Equations (7)–(11). They assume a constant wrap angle α. For the same friction coefficient μ between the strip and each roll, the contributions of Ti are calculated similarly. However, this solution is unsatisfactory in the case when sliding between the strip and the rolls occurs. In this case, the factor eµα has to be recalculated. The proposed solution is shown in the following section.
4. Dynamic Tension Distribution Algorithm
In general, the following equation is valid for the tension contribution by the previous roll
Ti and the tension contribution by the subsequent roll
Ti+1:
Let
denote the ratio of the tension contribution by the subsequent roll to the tension contribution by the previous roll:
Based on Equation (13), the following ratios can be defined:
Based on Equation (14) the tension contributions of the drives can be defined:
By substituting Equation (15) into Equation (6), the resulting equation is
For the calculation of the tension contributions of a particular drive, the values of the ratios
pki have to be known. These parameters are calculated by substituting Equations (7)–(10) into Equation (14):
The tension distribution algorithm can be described as follows. For the input tension F01 and required output tension F45, after substitution into Equation (16), the tension contribution of T1 is calculated. This contribution is substituted into Equation (15), and the tension contributions for T2 to T4 are calculated. With the use of these calculated values, upper and lower torque limitations of each drive can be set up.
We note that the proposed algorithm is viable only if the following conditions are fulfilled:
where
F45 is the maximum value of output tension that can be established for the known ratios of
eμαi, and
τMAXi is the maximum admissible torque of the
ith drive.
5. Algorithm Generalization
In the previous section, the algorithm of the tension distribution was developed and shown on the example of a part of a line with four tension rolls. Here, the algorithm is extended to a more general case.
The initial factor value
eμαi for the
ith roll can be calculated as follows:
where
Fout is the tension of the strip on the output site of the bridle section and
Fin is that on its input site.
Generally, the ratios
pki for the multi-motor drive can be defined as
The generic equation for the calculation of the tension contribution
by the first drive can be defined as follows:
Based on Equation (15), the equation of the tension contribution of the subsequent drives is
The step-by-step procedure for the implementation of this algorithm into a control system results in dynamic distribution of the tension among the tension rolls. The algorithm is as follows:
Equation (20): Calculation of the initial factors eµαi of each drive based on the input tension and reference output tension.
Equation (21): Calculation of pki.
Equations (22) and (23): Calculation of the tension contribution of each drive.
If the strip is sliding on the ith roll, its eµα factor must be adjusted accordingly (i.e., it must be decreased if slipping occurs). The control system of the leveling line automatically reduces the factor eµαi in the following cases:
This causes the ith drive to start to produce lower tension, but other drives will react and start to increase their tensions. Therefore, their eµα factors will increase.
The use of a tension controller. Design of the tension controller is outside the scope of this paper. Existing solutions for tension controllers can be found, e.g., in [
11,
22,
30].
The proposed algorithm is suitable for the leveler section of the line of tension rolls. These rolls do not have any master speed drive, i.e., all their drives are working at their preset torque limit.
6. Simulation Results
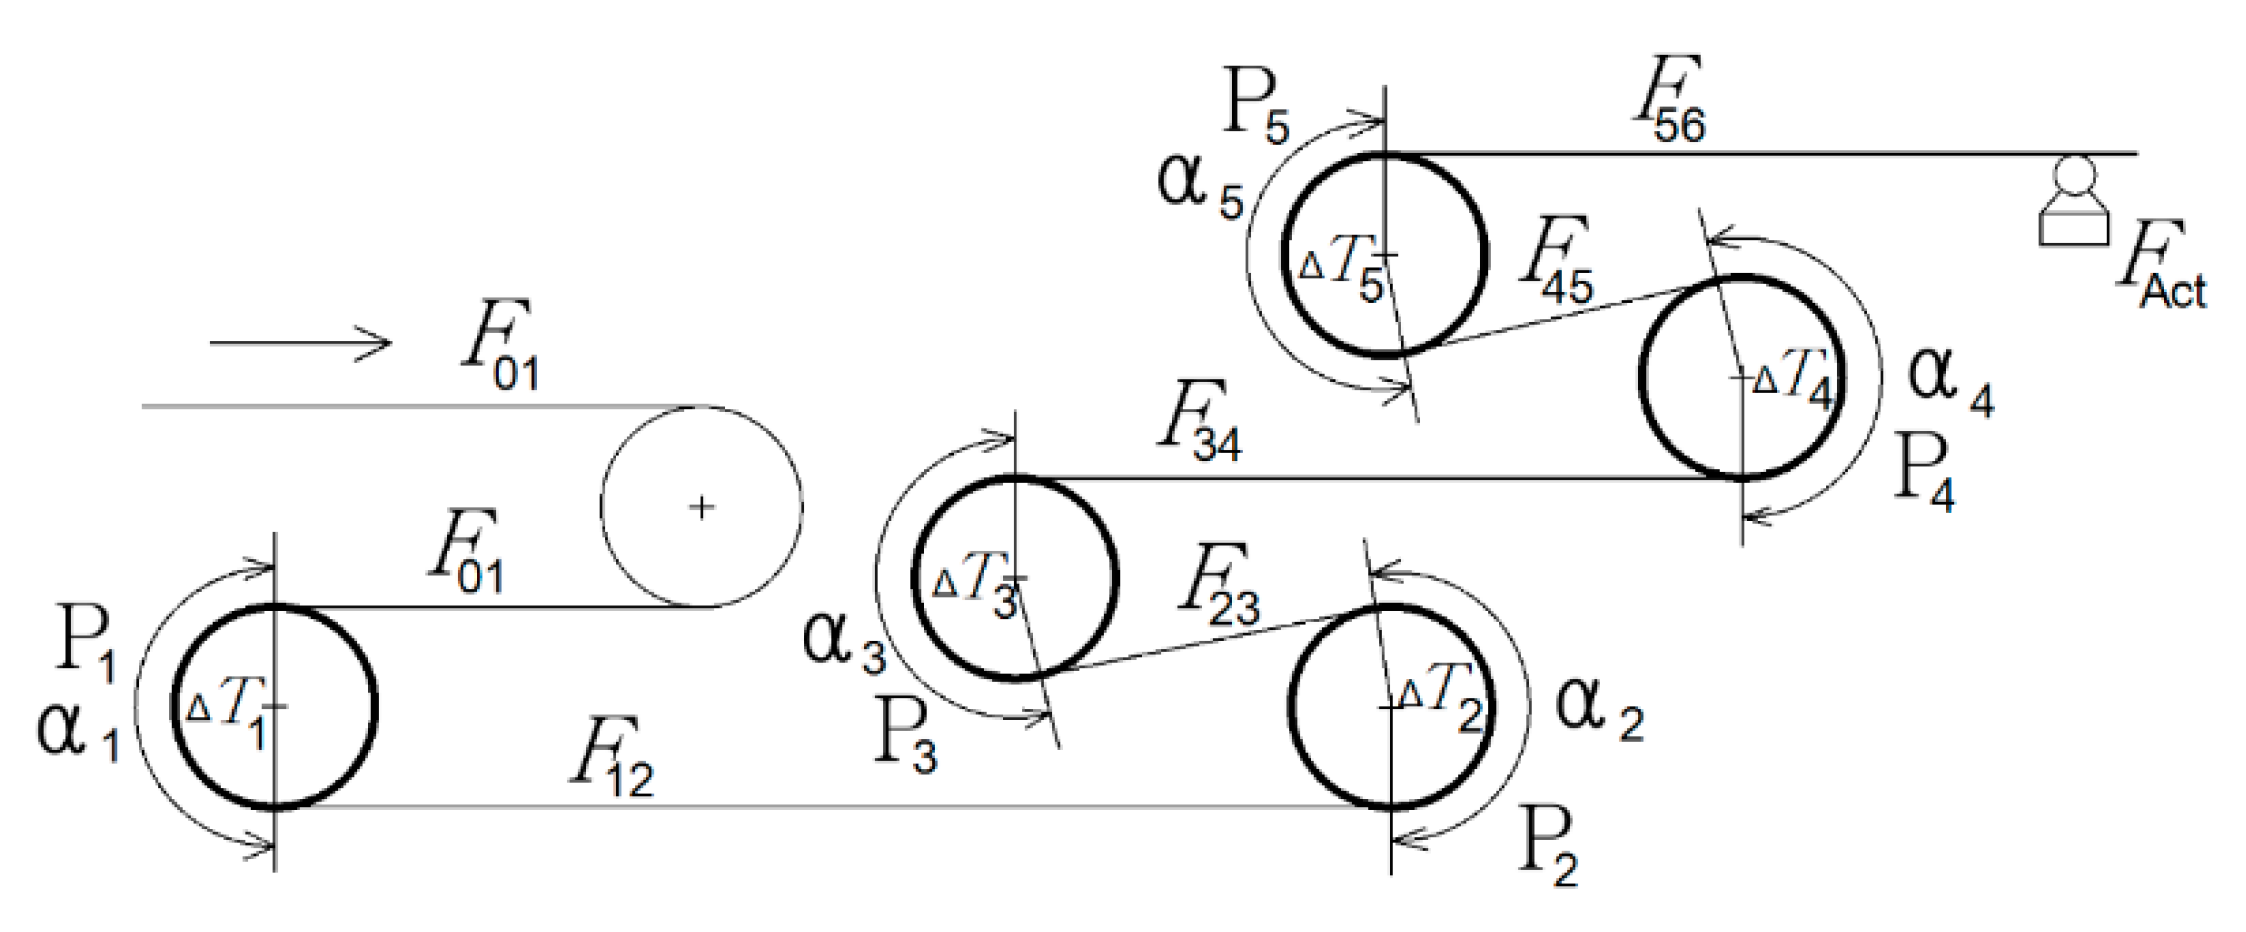
The algorithm described in previous sections was verified by simulation in a MATLAB/Simulink program of a tension leveler consisting of five tension rolls. The arrangement of the drives is shown in
Figure 3.
Table 1 shows the maximum values of wrap angles and maximum values of tension which each drive can develop on the tension roll circumference. These are the physical limits that must not be exceeded.
The algorithm requires knowledge of the values of input tension
FIN =
F01 and the desired output tension
FOUT =
F56 and calculates reference tension values of
T1 to
T5. Our hypothesis is that for the particular arrangement of the drive system, as for example shown in
Figure 3, the dynamic tension distribution algorithm should be favorable against uniform distribution. The reason for this is that the wrap angles are not the same for each drive.
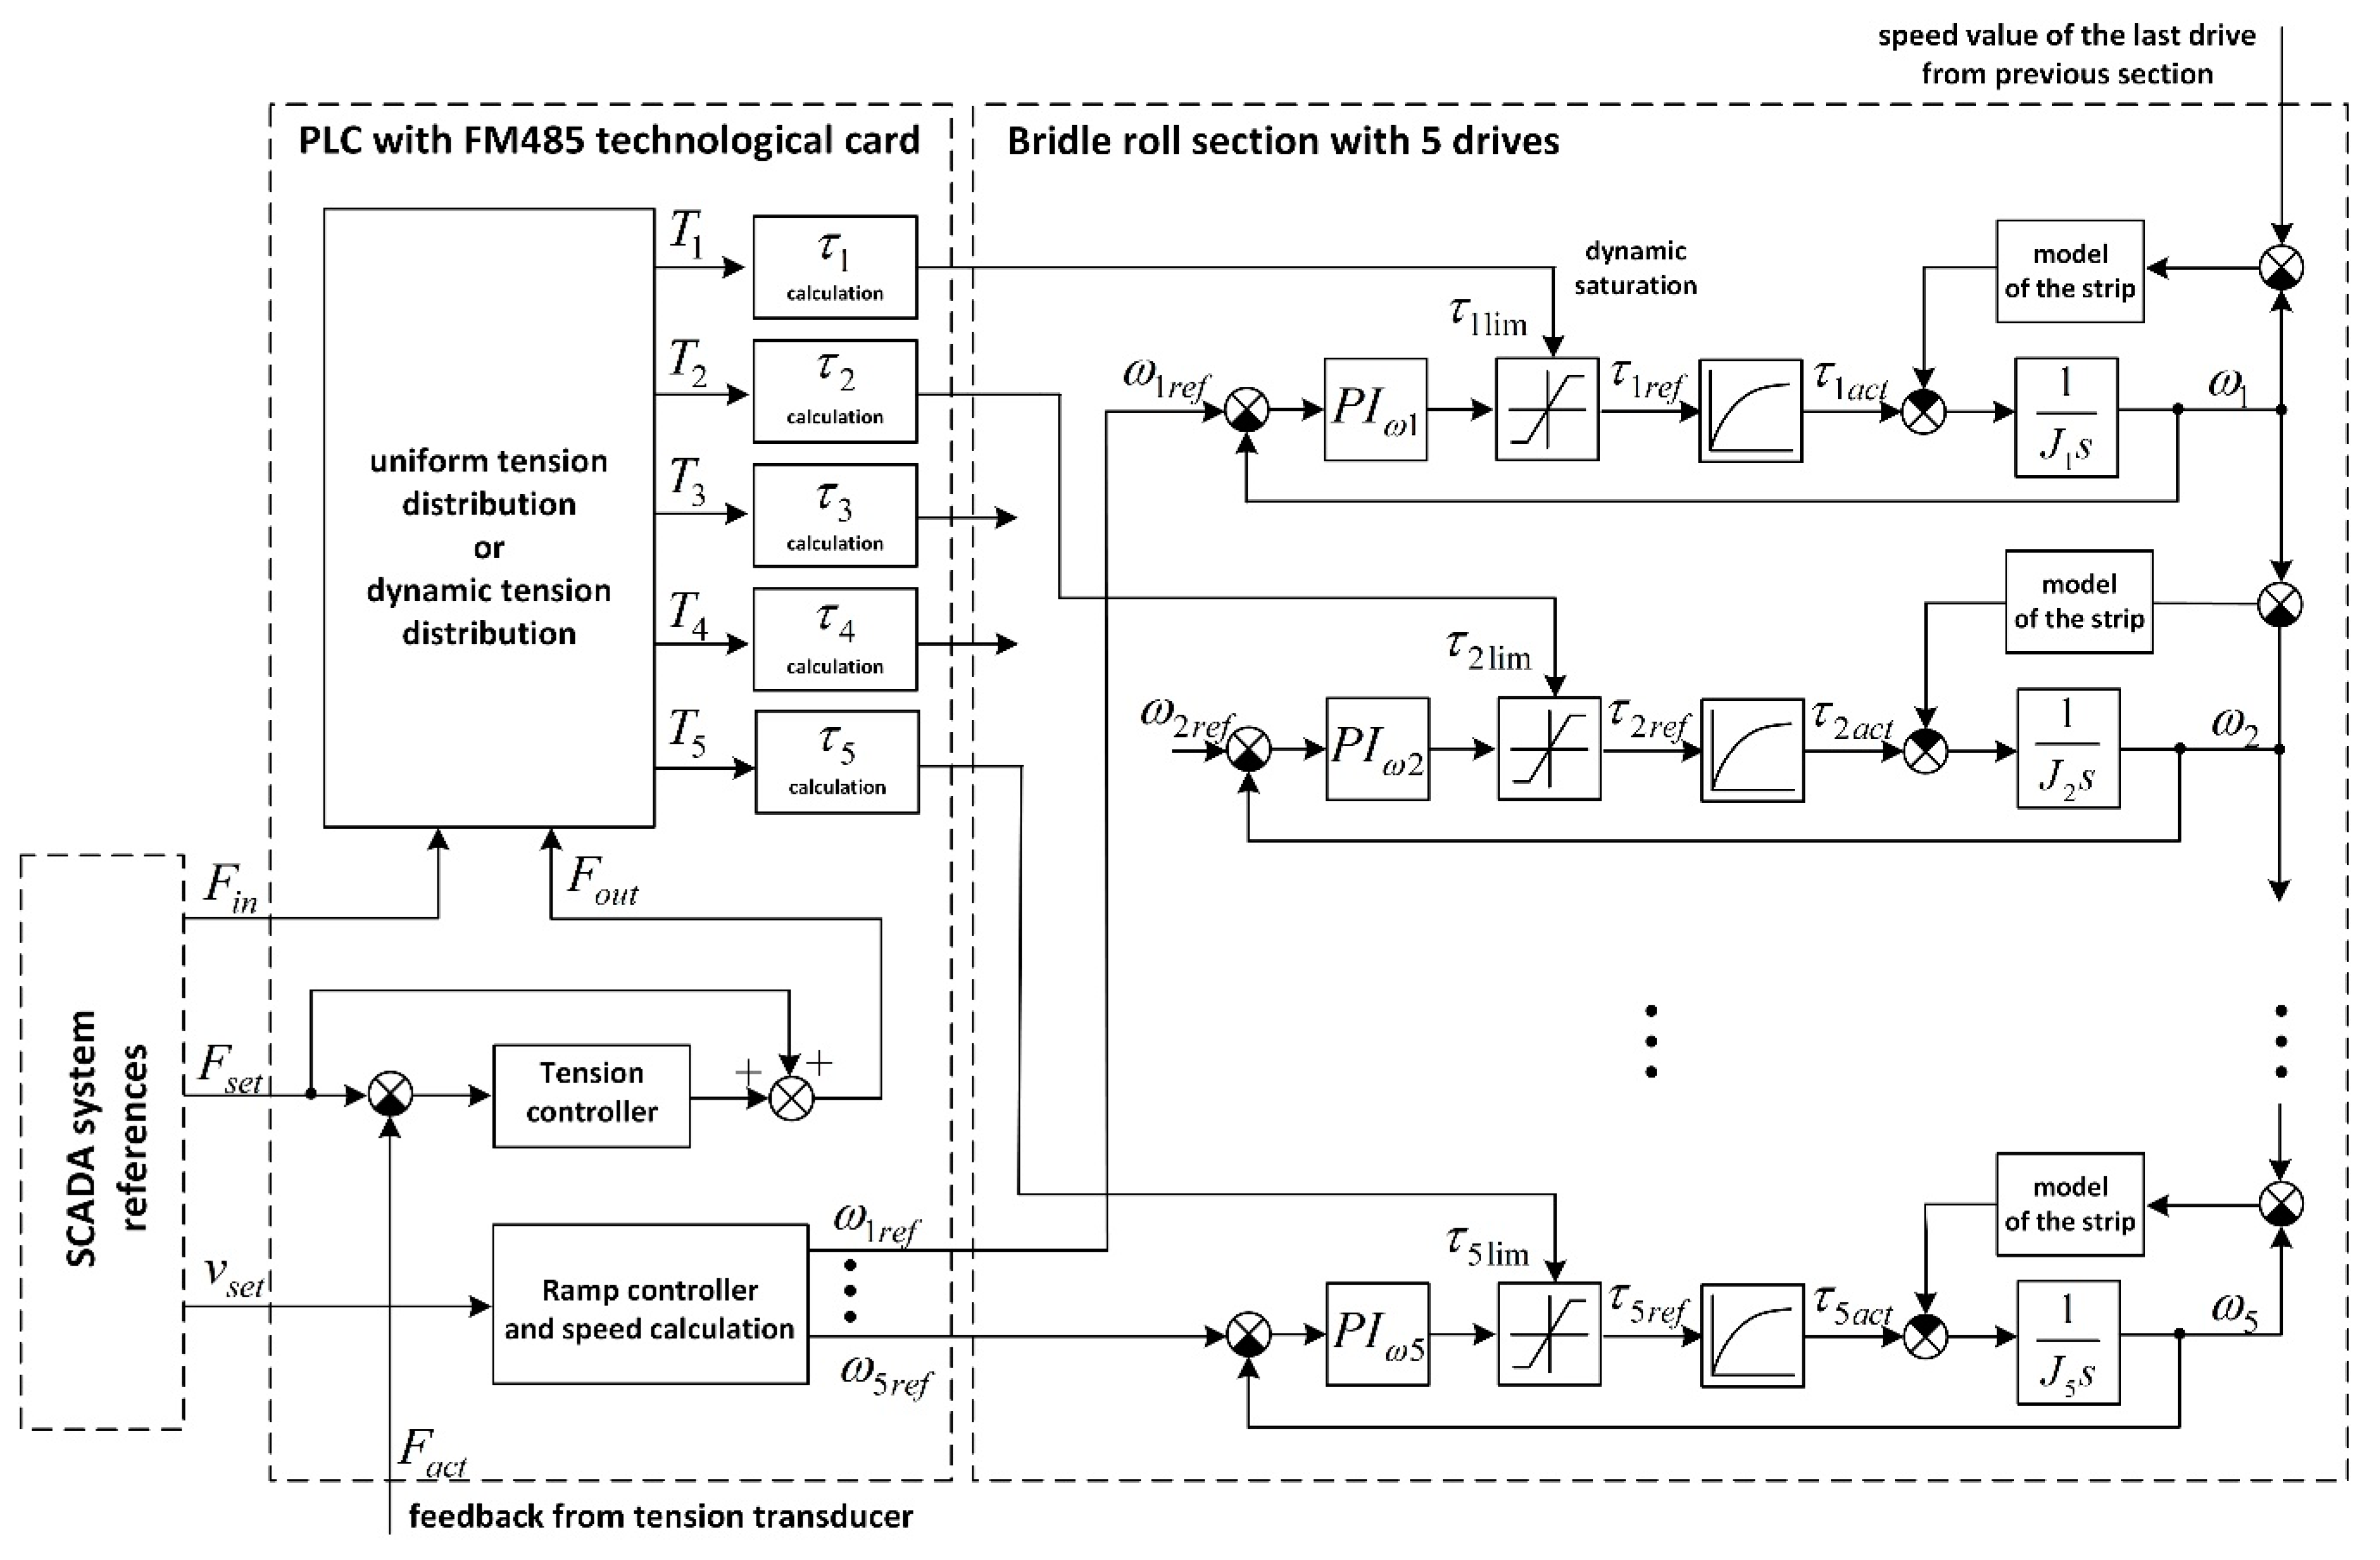
The overall control structure is shown in
Figure 4. The input tension was calculated using the SCADA system and the output tension was calculated with a tension controller.
Synthesis of the tension controller itself can be found in our previous work [
11].
T1 to
T5 are the reference tension values acting as dynamic saturations at the outputs of the speed PI controllers of each drive. The feedback tension
Fact can be measured by the tension transducer, located as shown in
Figure 3.
At the beginning of the algorithm, convenient values of
eµα for each drive are not known. Based on Equation (11) and on the precondition that the factor values are approximately equal, the first estimation of the factor
eμαi can be calculated as follows:
The first estimation of the
factor given by Equation (24) presents a starting point for the simulation results shown in
Figure 5. The left picture shows actual values of the factor
eμα and their limits. The right picture shows tension set points and tension limits. Two important time spots should be mentioned here. The first one occurs at
t = 2 s where the input tension was changed from 2 kN to 3 kN. The second one is at
t = 6 s when the calculation was switched from the uniform distribution algorithm to the dynamic distribution one.
Next, the phenomena that are underway in drive P1 are examined. At the beginning, for t = 0 s, the maximum factor eμαlim1 and the maximum tension T1max of this drive are exceeded and the drive operates outside of its limits. The maximum factor eμαlim2 of P2 is exceeded, but the maximum tension T2max of that drive is not exceeded. This is due to the uniform tension distribution algorithm, which forces the same value of eμα = 1.695 on every single drive, regardless of the actual torque conditions of the drive.
At time t = 2 s, the input tension value rises. This causes an immediate decrease of the factors for all drives together with redistribution of the tensions among the drives. The tensions of the drives P1, P2, and P3 are increased, and the tensions of the drives P4 and P5 decrease. It can be observed that in the case of tension increase, the maximum tension T2max of the drive P2 was exceeded. This clearly shows the disadvantage of uniform tension distribution: in this case, the tension limits and/or eμα factor limits are not respected. As a consequence, when conditions change on the tension rolls, some of the drives may be overloaded. This can be solved by the dynamic tension distribution algorithm.
For the dynamic tension distribution algorithm, in the case when the maximum power of the machine is reached, its factor
eµα has to be limited. Its maximum values can be calculated as
where
Ti_MAX is the maximum tension contribution of the
ith drive,
Fi,i+1 is the tension after the tension roll, and
Fi−1,i is the tension value before the tension roll. Based on Equation (25), the maximum value
eµαi_maxF is calculated and then compared with the maximum value
eµαi_MAX_α, calculated according to the maximum wrap angle of the drive in
Table 1. The minimum of these two values, which, at a later stage, can be used as the limit value
eµα_lim, must be found. Based on these limit values, new tension differences
Ti are calculated. As a consequence, new reference tension values of
T1 to
T5 are sent to the drive control. Therefore, the actual tensions on the tension rolls are changed and accordingly redistributed.
This phenomenon can be observed within the simulation results in
Figure 5, valid for the time interval
. At time
t = 6 s, the switchover from uniform distribution to dynamic tension distribution was simulated. We note that the tensions denoted
T1 to
T5 present uniform distribution and the tensions
T1dyn to
T5dyn are for the dynamic distribution. The tension references
T1dyn of drive P1 and
T2dyn of drive P2 were above their limit values, but after a transient period, they decreased and reached the desired limit values. It could be observed that the tension references
T3dyn to
T5dyn increased accordingly. The advantage of the described dynamic tension distribution over the uniform tension distribution was obvious.
Table 2 shows examples of uniform tension distribution for different input and output tensions. The first row in
Table 2 corresponds to the simulated courses in
Figure 5 within the time interval
. The red-colored values present tension contributions above the torque limit. The situation when the actual value of
eµαi reaches the maximum of
eµαi_maxF, calculated according to the wrap angle in the last column of
Table 1, is shown in yellow.
Table 3 shows a comparison of uniform tension distribution with dynamic tension distribution for different values of input and output tensions. Each row pair contains results of both algorithms: the dynamic and uniform ones. The first row in
Table 3 is identical to the simulation results shown in
Figure 5 in the time interval
. When the dynamic tension distribution algorithm starts, we have a possibility to decrease the selected factor
eµαi and, as a consequence, the required tension contribution decreases under the torque limit. Simultaneously, the actual value of
eµαi will decrease below the value of the maximum factor
eµαi_maxF, calculated from the wrap angle. The red color marks the values of present tension contributions above the torque limit. The situation when the actual value of
eµαi reaches the maximum value of
eµαi_maxF, calculated according to the wrap angle and the value in the last column of
Table 1, is marked in yellow. The situations in which dynamic tension distribution intervened in order to maintain the predefined requirements are marked in green.
7. Experimental Results
The control systems for large continuous processing lines often consist of several programmable logic controllers (PLCs). For very fast calculations of process variables in processing lines, the following alternatives are usually used: the FM485 application module (also known as a technological card) [
31] or the SIMATIC TDC multiprocessor control system [
32]. The SIMATIC TDC solves complex drive control and technology tasks with maximum quantity frameworks and shortest cycle times on a single platform. The system is used particularly for large plants in process, energy, and drive technology. It uses the programming language Continuous Function Chart (CFC) [
33], which is very similar to MATLAB Simulink.
For implementation of the algorithm presented in this paper, actual values from sensors were processed using Siemens Step 7 software. The control of all drives in a processing line, together with the tension distribution algorithm, was programmed in CFC and then implemented in a SIMATIC TDC. The program implementation block for the proposed tension distribution algorithm is shown in
Figure 6.
The block in
Figure 5 needs reference values of input and output tension and reference values of
eµαi factors. The outputs of the block are reference values of the tension, further used in the control structure. They are used as torque saturation for the drives in the line. More inputs and outputs of this block interact with other parts of the control system. The control system consists of many service blocks, but description of their functions and parameters is outside the scope of this paper. The overall control concept was already shown in
Figure 4. Dynamic tension distribution for five drives with arrangement shown in
Figure 3 and parameters in
Table 1 was verified on a realistic production line processing aluminum strips. The algorithm was used with the tension leveler placed between the strip input accumulator and annealing oven. It is shown in
Figure 7.
The dynamic tension distribution algorithm was implemented in the control structure of the described multi-motor system of the tension leveler. For data collection, the
Iba system for process data acquisition and analysis from production lines was used. The
IbaPDA system presents an extremely powerful, PC-based acquisition and recording system of different measured data in automated industrial technical processes [
34].
Figure 8 shows the measured and recorded experimental results. They are identical in Case A with the values in the bottom line in
Table 3. The input tension was set to 3 kN and the output tension was set to 28 kN. The experimental results show that the actual speed of the production line was
v = 20 m/min. At time approximately
t = 11:17 s, the desired value of tension
F56 =
FIN increased from 2 kN to 3 kN. This increase was initiated by a sudden change in the cross-sectional area of the strip (corresponding to the phenomenon when one strip end is welded to another one having different thickness).
Before that instant, only drive P5 was saturated. Following the tension change, the power limit of drives P5 and P4 was exceeded. For these drives, a new value of factor eµαi_MAX_F was calculated using Equation (25). The tension distribution algorithm calculated new tension references and, as a consequence, the tensions among the rolls reached these values, not exceeding the maximum.
It can be observed that the tension of drive P3 also increased, and the tension of drives P1 and P2 decreased accordingly. That means that the preset limitations have an immediate influence on the real values of the tension. Further, this corresponds very well to the simulated responses in
Figure 5. As a consequence, all drives operated below their power limits while the tensions of the strip input in the leveler section and output from the section remained unchanged.
8. Conclusions
Described in this paper is an algorithm for dynamic tension distribution among tension rolls in the leveling section of a metal strip processing line. The algorithm manipulates the eµα factor, taking into consideration the nonlinear dependency obtained by the product of the wrap angle α and friction constant µ between the strip and the roll contact surface.
The main findings from the proposed approach are summarized as follows:
Physical limits given by the space arrangement of the drives in the leveling section, represented by various wrap angles and the maximum torque for each drive, are taken into account.
Using this algorithm, none of the drives driving the tension rolls will be permanently overloaded.
The value of the factor eµα can be preset and limited for each drive separately.
Proper tension distribution among tension rolls in the leveling section ensures that balanced slip between the strip surface and the roll surface acts on each roll under all working conditions. This ensures uniform abrasion of the surface of each roll under all working conditions. As an economical consequence of this fact, all tension rolls in the leveling section can be replaced simultaneously during periodical repairs. This decreases the dead time which is necessary for the repair of continuously running technological lines which work in a 24/7 cycle (24 h × 7 days in the week); thus, industrial application of the algorithm could bring economic advantages.
The proposed method is universal and is not restricted by the number of tension rolls used in the leveling section. It is suitable for implementation in the control system of a multi-motor drive leveling section in which torque-controlled drives work without any speed master drive, i.e., all drives have a constant preset torque limit value.
The designed algorithm for the dynamic distribution of tension will help to decrease damage to the strip surface caused by possible excessive slipping of the strip over a roll in the leveler section. Thus, it contributes to preserving high quality of the processed strip.
Future research in this field will deal with the details of the described slipping phenomenon and with evaluation of the economic advantages of the algorithm’s implementation in control systems in specific continuous strip processing lines.


